UnitedHealth Group
Section 1 — Business Overview, Operations & Competitive Positioning
1.1 The Business
sources UnitedHealth Group collects fixed monthly premiums — the majority of them ultimately funded by the U.S. government — and earns its profit on two linked spreads: the margin between premiums received and medical costs paid at UnitedHealthcare, the largest U.S. health insurer, and the fees and margins recaptured when those same health care dollars are serviced by its own care-delivery, data-analytics and pharmacy businesses under the Optum umbrella. §
The company operates through two complementary platforms. UnitedHealthcare provides health benefits across employer, individual, Medicare and Medicaid markets; Optum is an information- and technology-enabled health services business serving patients, providers, payers and life sciences organizations through three reportable segments — Optum Health (care delivery), Optum Insight (data, analytics and health-system operations) and Optum Rx (pharmacy care services). Revenue reached $447,567.0M in FY2025, up from $287,597.0M in FY2021, with growth recorded in every year of the five-year window — a scale of throughput no other company in the sector approaches. The business is overwhelmingly domestic, and its workforce is very large, with a substantial portion comprising clinical professionals — an important structural point, because UnitedHealth is as much an employer of physicians and operator of care settings as it is an insurer. The shares trade under the ticker UNH. §
How the company actually generates returns matters more than how it describes itself. The insurance businesses are working-capital engines: premiums arrive before claims are paid, generating float that is invested, while underwriting margin depends on pricing medical cost trend accurately twelve months in advance. The Optum businesses then re-intermediate the same dollar — a premium collected by UnitedHealthcare can be spent at an Optum-owned clinic, processed on an Optum Insight platform and filled through an Optum Rx pharmacy — so the consolidated return on a member is the sum of an underwriting spread and several service margins. FY2025 was a transition year for this model: management concedes in the filing that its pricing and health-status assumptions fell well short of the medical cost trend actually incurred, significantly impacting earnings, and the year closed with a broad restructuring program under a substantially new leadership team. Those dynamics are examined in Sections 2 and 3; the model itself, described here, remains intact.
Key Information
| Item | Value |
|---|---|
| Ticker | UNH |
| Sector / Industry | Healthcare — Managed Care |
| Report Date | 2026-06-07 |
| Most Recent FY Revenue | $447,567.0M |
| EBIT Margin (Most Recent FY) | 4.2% |
| Diluted Shares Outstanding | 911M |
| Current Price | $399.47 |
| Rating | HOLD |
| 12-Month Price Target | $364.86 |
| Conviction | Medium |
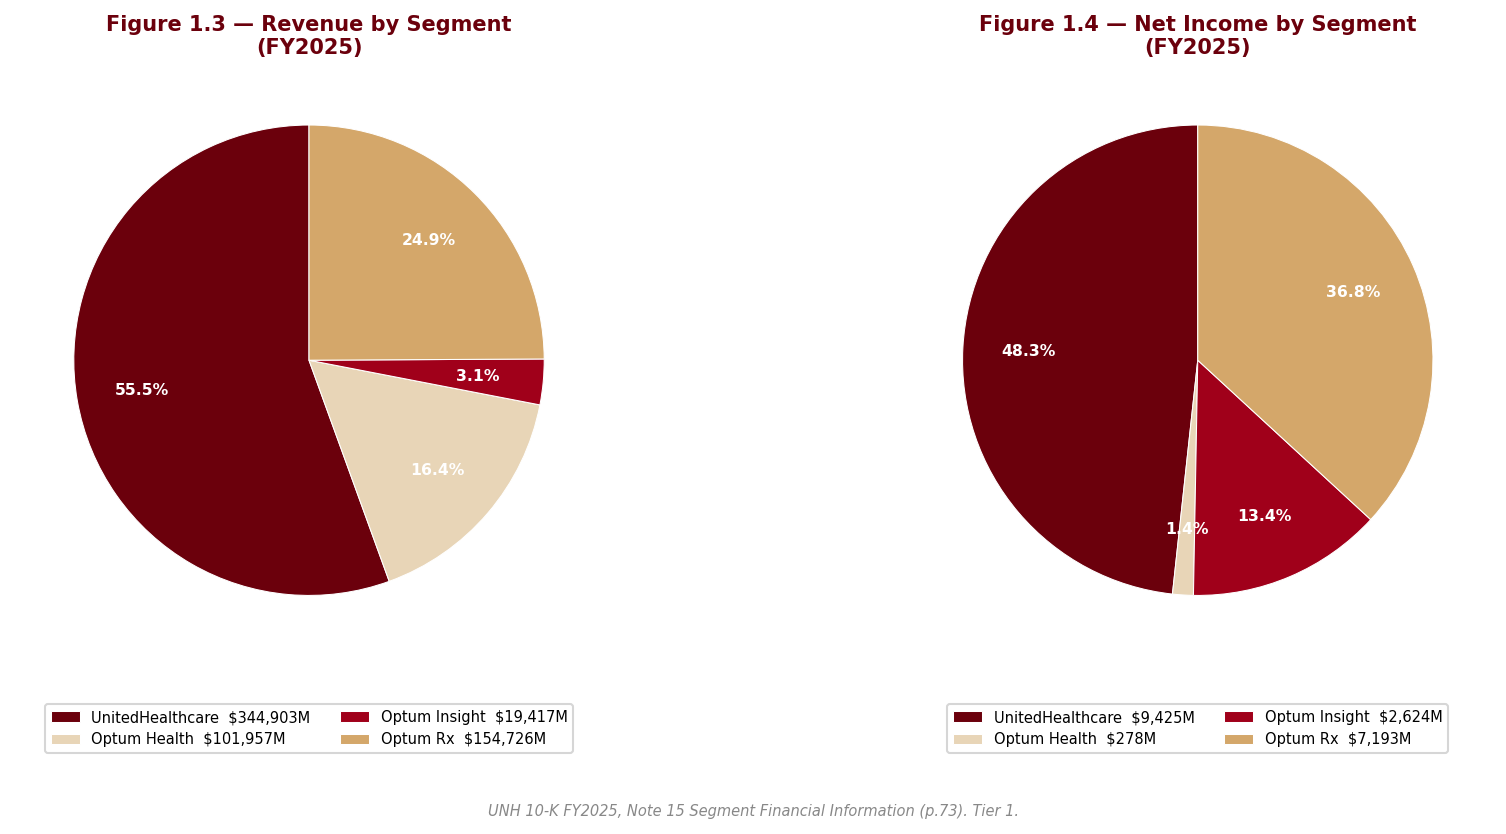
1.2 Operating Segments
sources UnitedHealthcare is the benefits franchise, organized across three businesses. Employer & Individual sells risk-based plans — in which the company assumes medical and administrative cost responsibility in exchange for a fixed monthly premium — alongside fee-based administrative services for self-funded employers who retain the risk themselves. Medicare & Retirement serves seniors through Medicare Advantage, where CMS pays a fixed monthly premium per member that varies with geography, demographics and the member’s coded health status, plus Part D drug coverage and Medicare Supplement products; premium revenues from CMS represent a very substantial share of total consolidated revenues, making the federal government the company’s most important counterparty by a wide margin. Community & State manages Medicaid and related safety-net programs under per-member monthly premiums from state governments, won through formal bid processes. The single economic variable that drives the entire segment is the medical care ratio — the share of each premium dollar consumed by claims. Premiums are fixed for the contract period, so cost trend that exceeds the priced assumption cannot be recovered until the next pricing cycle; small forecasting errors translate into large earnings swings.
Optum Health is the care-delivery arm: primary, specialty and surgical care across clinic, in-home and virtual settings, with an explicit strategy of moving providers from fee-for-service to value-based arrangements. In its fully accountable value-based contracts, Optum Health takes responsibility for a patient’s total cost of care in exchange for a monthly premium — economically, it becomes a mini-insurer with delivery assets. The driving variable is therefore the same as UnitedHealthcare’s, transposed: medical cost per capitated member versus the premium received. This symmetry is the segment’s strength in benign cost environments and its central fragility when trend runs hot, as FY2025 demonstrated. The segment historically also housed Optum Financial, including Optum Bank, which earns fees plus investment and interest income on consumer health accounts; effective at the start of the new fiscal year, Optum Financial moves to Optum Insight, with prior periods to be recast — a comparability break analysts should anticipate in quarterly reporting.
Optum Insight sells services, analytics and software platforms that run clinical, administrative and financial processes for health systems (revenue cycle management), health plans (payment integrity, risk and quality), state governments (Medicaid program administration) and life sciences companies. Products are typically delivered over multi-year contracts, and the segment maintains an order backlog of signed agreements and anticipated renewals — making backlog conversion the variable to watch. A portion of that backlog relates to affiliated agreements with other UnitedHealth businesses, a point developed below.
Optum Rx is the pharmacy care platform: a pharmacy benefit manager combined with home-delivery, specialty, community and infusion pharmacies, including limited-distribution oncology and gene-therapy support capabilities. Its economics are driven by script volume and the retained spread on managed drug spend — a scale business in which purchasing leverage compounds with size.
The system view. The four segments form a deliberate flywheel: UnitedHealthcare’s membership supplies patients to Optum Health’s clinics, claims to Optum Insight’s platforms and scripts to Optum Rx; Optum’s cost-management and care-steering capabilities in turn protect UnitedHealthcare’s underwriting margin; and the data generated at every node feeds back into pricing, risk coding and clinical engagement. Management frames the acceleration of value-based care as the core growth strategy precisely because it deepens every one of those linkages. The fragilities are the mirror image. First, the intersegment revenues eliminated in consolidation are priced at management’s estimate of fair value — meaning reported segment margins are partly an internal allocation choice rather than a market outcome, and a growing share of Optum Insight’s backlog is affiliated rather than won from third parties, so its growth is increasingly captive rather than market-validated. Second, the flywheel correlates exposures rather than diversifying them: when Medicare Advantage funding compresses, UnitedHealthcare’s premiums and Optum Health’s capitation revenues are hit by the same policy decision simultaneously, which is exactly the pattern that produced the FY2025 result. Third, the integrated model concentrates regulatory and political attention on a single corporate entity. The flywheel is real, but FY2025 showed that it spins in both directions.
1.3 Geographic Exposure
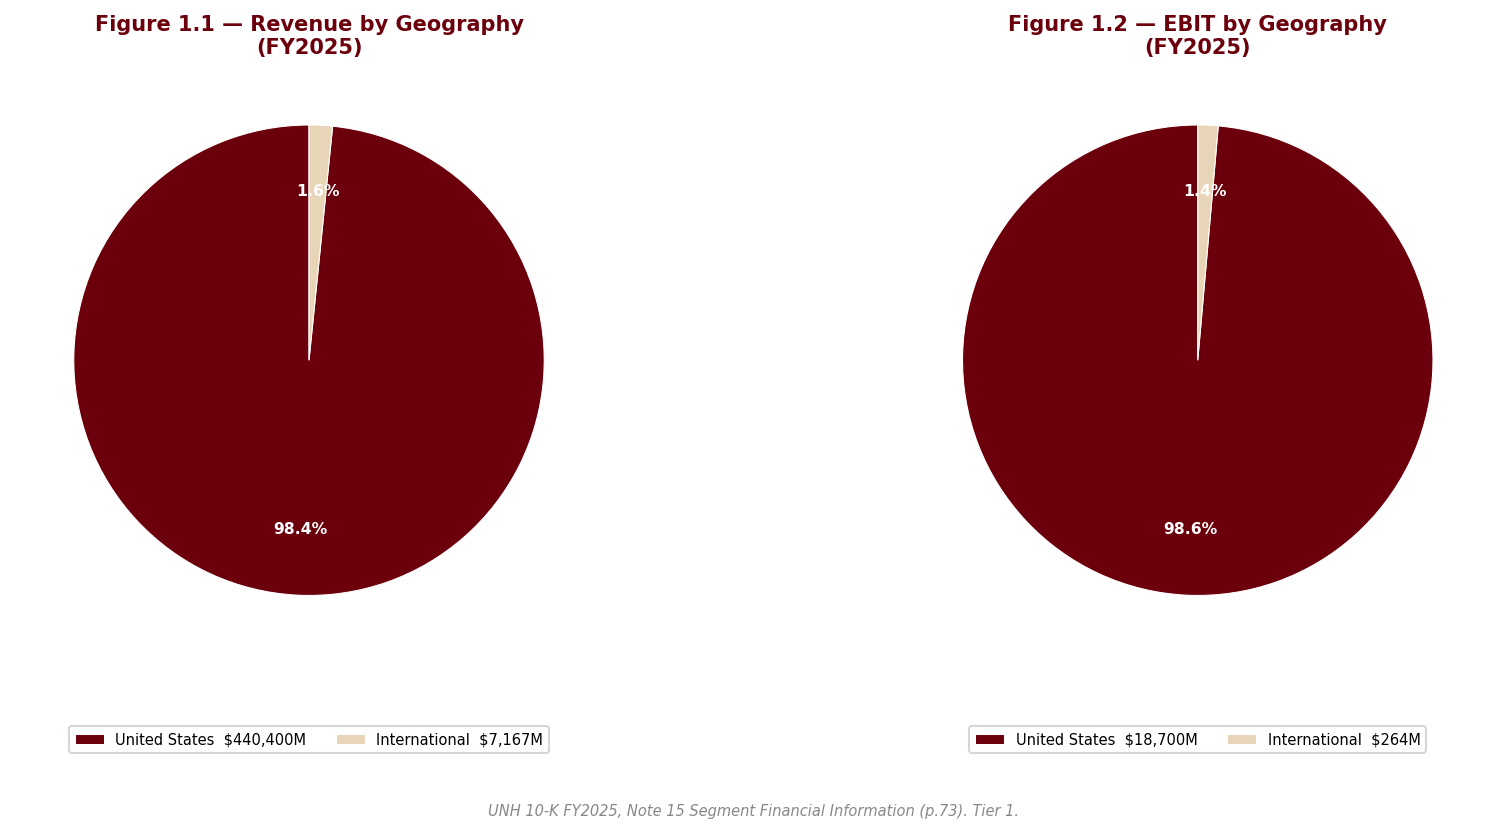
sources UnitedHealth Group is, for analytical purposes, a domestic U.S. business. Its members, providers, payers and regulators are overwhelmingly American, and currency exposure is immaterial to the investment case. The residual international footprint is being reduced rather than grown: the year’s portfolio review included business exits and dispositions, and the remaining South American operations are held for sale. The meaningful concentration is therefore not geographic but payer-based — a very substantial share of consolidated revenue flows from a single counterparty, CMS, supplemented by state Medicaid agencies. That concentration, and the rate-setting and investigative powers that come with it, is the dominant exposure of the company and is treated in depth in Section 2.
1.4 Management Team
sources The leadership team was almost entirely rebuilt within roughly twelve months — an extraordinary reset for a company of this size, and itself a fact the analysis must price. Stephen Hemsley, the long-tenured former chief executive, returned as Chair and Chief Executive Officer in May 2025, combining the two roles and reversing the prior separation. Wayne DeVeydt joined as Chief Financial Officer in September 2025 from Bain Capital, having previously run Surgery Partners and served as finance chief of Elevance Health — the closest peer — which makes him one of the few external hires who arrives already fluent in managed-care economics. Dr. Patrick Conway took over as CEO of Optum in May 2025, and Tim Noel became CEO of UnitedHealthcare in January 2025. §
The anchor is unambiguously Hemsley: his return is a credibility transaction with the market, trading continuity and operational memory for a renewed — and now larger — succession question, since a returning former CEO is by construction a bridge rather than a destination. DeVeydt’s appointment is the most substantive signal; an outside CFO from the principal competitor suggests the Board wanted an unsentimental view of the portfolio, and the broad restructuring program that arrived in the new team’s first full quarter is consistent with that mandate. The risks are equally clear and are flagged as a watch item: the majority of listed executive officers are new or newly in role, execution depends on a team that has not yet operated together through a full pricing cycle, and the bench beneath them is unproven at this scale. The governance dimensions of the transition, including the circumstances of the UnitedHealthcare CEO succession, are addressed in Section 2.
1.5 Capital Allocation Track Record
sources | Year | Dividends Paid ($M) | Share Repurchases ($M) | CapEx ($M) | |—|—|—|—| | FY2021 | $-5,280.0M | $-5,000.0M | $-2,454.0M | | FY2022 | $-5,991.0M | $-7,000.0M | $-2,802.0M | | FY2023 | $-6,761.0M | $-8,000.0M | $-3,386.0M | | FY2024 | $-7,533.0M | $-9,000.0M | $-3,499.0M | | FY2025 | $-7,916.0M | $-5,545.0M | $-3,622.0M |
Source: UNH 10-K FY2025, Consolidated Statements of Cash Flows; Data sheet, UNH_Portfolio.xlsx.
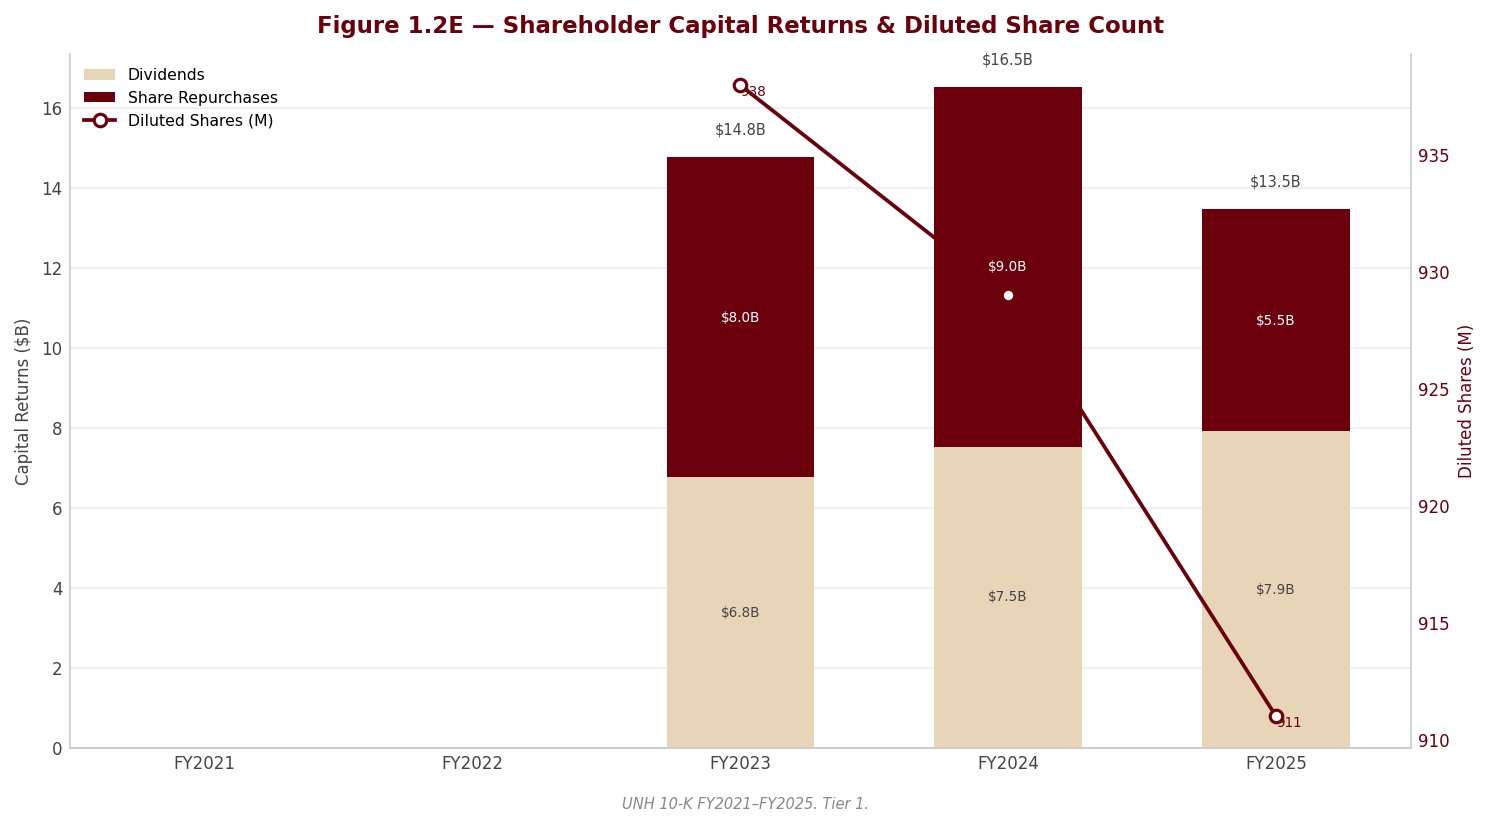
The structural pattern of the past five years is that of a capital-light services compounder: capital expenditure is modest relative to the revenue base because the company’s growth has historically been bought, not built — acquisitions of physician practices, technology platforms and pharmacy assets are the true reinvestment channel, which is why goodwill and intangibles dominate the balance sheet (a risk treated in Section 2). What the business did not spend on plant, it returned: a quarterly dividend raised consistently, paired with sustained share repurchases.
FY2025 marks an inflection in that pattern that deserves more attention than the table alone conveys. The Board raised the quarterly dividend mid-year even as earnings came under severe pressure — signaling that the dividend is treated as a quasi-fixed commitment — yet no share repurchases occurred in the closing months of the year. The buyback, in other words, is the swing variable, and it swung to zero at the same time that the regulated insurance subsidiaries required net capital infusions from the parent rather than paying dividends up to it, a reversal of the system’s normal cash direction. Repurchases executed earlier in the year were made at average prices well above where the stock ended it, an unflattering timing record. Taken together, the FY2025 actions read as a shift from shareholder-return maximization to balance-sheet protection within a single year; the liquidity mechanics behind that shift, including rising statutory capital requirements, are analyzed in Sections 2 and 3. Investors should not assume buyback support for the share count in the coming year until subsidiary dividend capacity normalizes.
1.6 Competitive Positioning & Moat
sources §1.6.1 Industry structure. U.S. health care spending has grown consistently for many years, accounts for a substantial share of GDP, and is expected by management to keep growing on demographics, medical technology and pharmaceutical advancement. The structure of managed care concentrates returns in scale: a larger insurer spreads fixed administrative and technology cost over more members, negotiates deeper provider discounts, and absorbs actuarial volatility that would impair a subscale book. Critically, the growth payer is the government — Medicare Advantage and Medicaid — which means the entity that sets prices is also the largest customer. Returns therefore accrue to operators who can manage realized medical cost trend below the trend embedded in fixed premiums, year after year, across a rate cycle they do not control.
§1.6.2 Competitive advantages. UnitedHealth’s moat rests on four pillars, each anchored in the filing rather than asserted. First, absolute scale: a $447,567.0M revenue base — the largest in the industry — directly funds the network discounts, technology investment and actuarial depth that the industry structure rewards. Second, vertical integration: no competitor pairs the largest benefits franchise with owned care delivery, a health-system-wide analytics business and a top-tier pharmacy benefit manager; management’s stated strategy of accelerating fully accountable value-based care is, in moat terms, a mechanism for converting insurance scale into recurring service revenue that fee-only rivals cannot replicate. Third, local network depth: the company itself frames its UnitedHealthcare positioning around strong local-market provider relationships, breadth of product, and competitive medical and operating cost positions — advantages that are accumulated market by market and are slow for entrants to assemble. Fourth, contracted visibility: Optum Insight’s multi-year order backlog of signed and legally binding agreements gives a portion of the services business revenue character closer to software than to insurance. It is worth noting that management describes its own markets as highly competitive, with rivals ranging from startups to sophisticated global enterprises; the moat is scale and integration, not the absence of competition.
§1.6.3 Competitive vulnerabilities. The vulnerabilities are concentrated where the moat is deepest. The same government concentration that funds growth exposes the company to a payer that has been setting Medicare Advantage rates below forward medical cost trend for multiple years, with risk-model revisions reducing funding further — a pressure management itself describes as sustained and which no degree of scale offsets, because it applies to the whole industry’s largest channel at once. Underwriting is repricing-lagged: FY2025 proved that when management misjudges trend, the fixed-premium model transmits the error directly to earnings, and the company has now under-forecast trend through consecutive cycles. The integrated model invites regulatory and antitrust scrutiny precisely because of its breadth, and the pharmacy benefit management business faces an active legislative and investigative agenda industry-wide. Unresolved federal investigations touching Medicare billing practices — disclosed in the filing only in general terms — sit directly on the largest revenue source, and are treated as the dominant regulatory risk in Section 2. Finally, the partly self-referential nature of segment economics (internally priced intersegment revenue, a growing affiliated share of Optum Insight’s backlog) means the market-validated portion of Optum’s growth is smaller than headline segment figures suggest.
§1.6.4 Verdict. The competitive position is genuinely strong and was not the cause of the FY2025 setback: no rival took UnitedHealth’s members, networks or pharmacy scale. What FY2025 demonstrated is that the moat protects market position, not margins, when the dominant payer cuts effective rates and the company misprices medical cost trend simultaneously. The structural advantages — scale, integration, data, distribution — should allow the company to defend share and to reprice faster than subscale peers, which argues for margin recovery being a question of timing rather than possibility. But the through-cycle margin in the government businesses is likely to settle structurally below the levels of the past decade, with the Optum recapture model the principal offset. Long-run margin durability therefore rests less on competition than on two things outside the moat’s reach: the Medicare rate cycle, and management’s restored underwriting discipline. Both are testable within the next two pricing cycles, and Section 3 frames the evidence.
Section 2 — Key Risks & Catalysts
2.1 Downside Risks
sources The risk landscape at UnitedHealth Group is dominated by a single counterparty — the federal government — which simultaneously sets the prices for the company’s largest revenue source, audits the coding that determines those prices, and is now investigating the company’s billing practices; layered beneath that regulatory nucleus, the forensic review of the FY2025 filing surfaced an unusual concentration of red-flag findings in earnings quality, reserve adequacy, holding-company liquidity and balance-sheet composition, several of which are new to this filing year. This is not a normal risk profile for an investment-grade compounder, and the section that follows treats it accordingly: the risks below are specific findings from this filing, not sector boilerplate, and in our judgment they currently outweigh the identifiable catalysts.
Risk 1 — Federal Medicare-billing investigations: unnamed, unreserved and unbounded
sources This is the dominant risk in the filing, and it is flagged at the highest severity by our forensic review — as much for how it is disclosed as for what it is. The Department of Justice’s criminal and civil investigations into the company’s Medicare billing practices, which the company itself publicly confirmed in mid-2025, are nowhere specifically named in the 10-K. The commitments and contingencies footnote covers them only with generic language: a list of government agencies that review the company’s businesses, and a single sentence acknowledging that certain businesses have been or are under review for compliance with coding and other requirements under the Medicare risk-adjustment model. No liability is accrued. No range of loss is provided. The company states it is often unable to estimate losses or ranges of losses for such matters — which means that any settlement, civil penalty, corporate integrity agreement or, at the extreme, program exclusion would be entirely incremental to reported results, with no reserve standing in front of it. The only named DOJ matter remains the long-running False Claims Act whistleblower case dating to 2011.
The exposure sits directly on the company’s largest revenue source. Premiums from CMS are the single biggest component of consolidated revenue and grew as a share of the total this year, so the entity conducting the investigation is also the company’s most important customer. The mechanics of Medicare Advantage compensation — fixed monthly premiums that vary with each member’s coded health status — place risk-adjustment coding at the center of both the revenue model and the investigation, and the filing separately confirms that some of the company’s local plans have been selected for risk-adjustment data validation audits, which can produce retrospective payment adjustments.
Two adjacent findings sharpen the picture. First, the forensic comparison against the prior-year filing found that the word “shareholders” was quietly added to the list of parties bringing legal actions against the company — new language this year, and an oblique acknowledgment of securities litigation following the 2025 share-price collapse, with no further detail given. Second, as a partially offsetting watch item, the 2011 False Claims Act case took a procedurally favorable turn: a court-appointed Special Master recommended summary judgment in the company’s favor on all remaining claims, though the DOJ has moved to reject that recommendation and the matter remains open. The court’s eventual ruling will be read as precedent for the broader risk-adjustment exposure, in both directions.
Probability: High (that the investigations remain a live, unpriced overhang through the forecast horizon) | Timeframe: Immediate | Quantified potential impact: Not quantifiable by design — the company provides no accrual and no range, which is itself the finding. The relevant frame is that outcomes span a wide distribution from dismissal to a settlement with conduct remedies, and any adverse resolution would fall entirely outside reported reserves while potentially constraining the risk-coding practices that support Medicare Advantage revenue itself.
Risk 2 — The reserve cushion is gone: underwriting risk with no buffer
sources UnitedHealth’s risk-based products collect fixed premiums and pay uncertain claims, so reported earnings rest on two actuarial estimates: the pricing assumption set a year in advance, and the reserve for claims incurred but not yet reported. The FY2025 filing shows both legs under strain simultaneously. Management concedes in the MD&A that its pricing and health-status assumptions fell well short of incurred medical cost trend, significantly impacting earnings — an unusually candid admission, and the second consecutive cycle in which trend was under-forecast. More structurally, our forensic review flags at the highest severity that the favorable prior-year reserve development which historically released into earnings each year has declined sharply for the third consecutive year and is now a small fraction of its level two years ago. The cushion of conservatism is essentially exhausted: the reported medical care ratio is now a “truer” — and structurally higher — number than in prior years, and there is far less buffer if claims trend deteriorates from here.
The same footnote contains a first-time disclosure that confirms the direction of travel: a premium-deficiency and loss-contract reserve line appears in the medical-costs-payable rollforward for the first time, an explicit acknowledgment that certain books of business are priced below expected cost. The estimation machinery itself remains the auditor’s sole critical audit matter — the IBNR estimate for medical costs payable — and the filing’s own sensitivity disclosure makes clear that small changes in completion factors or per-member cost trend move the reserve by amounts material to net earnings. The risk-factor disclosure says the rest plainly: relatively small differences between predicted and actual medical costs have resulted, and may again result, in significant changes in financial results, and cost overruns cannot be recovered within the fixed premium period.
Probability: Medium | Timeframe: Immediate to 1–2 years | Impact: A renewed underwriting miss in 2026 would flow directly to earnings with no development buffer to absorb it, would push the medical care ratio — and therefore required statutory capital — higher still, and would compound Risks 4 and 5 below. The filing’s own sensitivity framing establishes that the swing from modest estimation error alone is material to net earnings.
Risk 3 — A kitchen-sink transition year: the 2026 “recovery” may be partly manufactured
sources Two of the forensic review’s highest-severity findings concern the quality of the FY2025 baseline itself, and they matter prospectively because every recovery narrative will be measured against it. First, the fourth-quarter “restructuring and other actions” charge is a bundle that sweeps in items which are not restructuring in any conventional sense: net valuation losses on equity securities (an investment result), the advance funding of the company’s charitable foundation (a discretionary contribution), and — most importantly — the establishment of a loss-contract reserve that pulls anticipated 2026 losses at certain Optum Health value-based care businesses into 2025. Management itself states that the net cash-flow impact of these actions in the coming year is expected to be immaterial, confirming that the charges are largely non-cash or accrual-timing in nature. The pattern is a classic big-bath: depress the transition year, pre-book the next year’s losses, and create an easier comparison base. As the loss-contract reserve is released against actual 2026 costs, reported segment results will be flattered by exactly the amount that was pulled forward.
Second, and cutting in the opposite direction within the same year, the company recorded a large non-cash gain on the deconsolidation of a business — triggered not by a sale but by “changes in governance rights” — and booked that gain inside operating costs, where it is the principal driver of the net portfolio gain attributed to Optum Rx and therefore of that segment’s reported earnings growth. No cash was received; the retained stake is now an equity-method investment measured at the least observable level of the fair-value hierarchy, and the identity of the deconsolidated business is not disclosed. A governance-rights change that produces a gain of this character inside a reportable segment’s operating result deserves more disclosure than it received.
The context is unavoidable: these actions land in the first full quarter of an almost entirely new leadership team — returning CEO, externally hired CFO, new chief executives at both Optum and UnitedHealthcare, all within roughly twelve months — which is noted as a governance watch item in its own right. The timing of the charges is consistent with a new team resetting the base from which it will be measured. The filing also makes no reference of any kind to the December 2024 killing of the UnitedHealthcare chief executive that preceded this succession; we note the omission without speculating beyond filed facts. The practical consequence for investors: neither FY2025 segment results (especially Optum Health’s operating loss) nor any apparent FY2026 margin recovery should be taken at face value — both must be read net of the reserve pull-forward, the non-recurring charges and the deconsolidation gain.
Probability: High (that reported 2026 improvement overstates underlying improvement) | Timeframe: 1–2 years | Impact: This is a risk to analytical conclusions and to the durability of any re-rating rather than to cash flows directly: if the market capitalizes a manufactured margin recovery, the disappointment arrives when the reserve releases and easy comparisons lapse. Section 3 decomposes the affected figures.
Risk 4 — Holding-company liquidity has reversed: subsidiaries now absorb capital
sources A cluster of mutually reinforcing disclosures, flagged at the highest severity, shows the group’s internal cash engine running backwards. In FY2025 the regulated insurance subsidiaries received net capital infusions from the parent — a reversal from the prior year, when they paid very large net dividends up to it — while only a small fraction of consolidated cash and equivalents is available for general corporate use. The parent-company-only schedule shows the holding company increasingly funded by intercompany notes from its own subsidiaries: it is borrowing from the entities it owns to service external debt, the dividend and buybacks. And because the elevated medical care ratio raises the statutory capital its insurance subsidiaries must hold, the company has entered reinsurance agreements explicitly to reduce capital and surplus requirements — agreements that do not qualify for reinsurance accounting and are carried under deposit accounting, meaning no risk transfer is recognized. That is capital engineering, not risk transfer, and it signals genuine pressure on regulated-entity surplus. §
A second highest-severity finding compounds the picture on the cash-flow statement: the company entered a new, short-dated (under one year), uncommitted receivables-sale facility in 2025 — no such facility existed in the prior-year filing — under which receivables sold to banks are recorded as a reduction of receivables and classified as operating cash flow. Management’s own MD&A lists the sale of receivables among the supports to operating cash flow in a year when operating cash flow declined. Because the facility is uncommitted and matures within a year, the benefit reverses if the banks decline to renew, converting a financing-like dependence into an operating-cash-flow headwind. Reported FY2025 cash conversion is therefore flattered, and Section 3 footnotes the affected metrics.
The surrounding signals are consistent with strain: share repurchases stopped entirely in the closing quarter; the major rating agencies hold predominantly negative outlooks on the senior debt; and the commitments footnote discloses, for the first time as a quantified commitment, put and call options on unconsolidated businesses created by the portfolio-refinement program — a contingent, largely counterparty-controlled claim on parent liquidity that sits outside the balance sheet (a watch item in its own right). Against this, the debt structure itself is clean — committed revolvers undrawn, maturities laddered, covenant compliance asserted — so this is a risk of capital-flow direction and flexibility, not of near-term solvency.
Probability: Medium | Timeframe: Immediate to 1–2 years | Impact: Dividend capacity, buyback resumption and deleveraging all depend on the medical care ratio normalizing so that subsidiaries can resume up-streaming cash. If 2026 medical costs disappoint again, the negative rating outlooks become live downgrades, raising funding costs precisely when the parent’s internal funding sources are already strained — and the put/call obligations could be exercised into that weakness.
Risk 5 — Goodwill concentration against a loss-making segment
sources Goodwill and other intangibles represent a dominant share of total consolidated assets — a balance-sheet composition the company’s own risk factors flag as exposed to material impairment if acquired businesses underperform the assumptions used to value them. The forensic review pairs that concentration with an uncomfortable fact pattern flagged at the highest severity: Optum Health, the reporting unit carrying the largest goodwill balance of the four, swung to an operating loss in FY2025, required a loss-contract reserve for anticipated further losses in its value-based care book in 2026, and is guided to serve fewer value-based care lives — yet its goodwill increased during the year through continued acquisitions. Management asserts that the annual impairment test found all reporting units’ fair values “substantially in excess” of carrying values, but discloses no quantitative headroom, discount rates or growth assumptions, making the assertion untestable as disclosed. Meanwhile, the businesses the company is actually selling tell a less comfortable story: held-for-sale remeasurements crystallized losses, meaning exit values came in below carrying values for the assets being divested.
The trigger to watch is the 2026 repricing of the value-based care book. If the economics do not recover on repricing — and management has already pre-booked losses for part of that book — impairment risk migrates from theoretical to live. A charge would be non-cash, but it would directly reduce the equity base supporting credit ratings already on negative outlook, and it would constitute an admission that a meaningful portion of the acquisition-led growth strategy was overpaid for. §
Probability: Medium | Timeframe: 1–2 years | Impact: Non-cash but ratings-relevant and narrative-defining: an Optum Health impairment would simultaneously weaken the credit-metric equity base (compounding Risk 4) and undercut the central pillar of the long-term thesis — that value-based care delivery converts insurance scale into durable service margins.
Additional watch items. Three lower-severity forensic findings warrant monitoring without rising to standalone risks. The Change Healthcare cyberattack of early 2024 remains a live earnings drag: the company took a further fourth-quarter reserve against collections on the interest-free loans it extended to affected providers, receivable allowances rose, and the litigation and regulatory tail from the data breach is not quantified anywhere in the contingencies footnote — even as the cybersecurity item asserts no material threats were identified as of year-end. Second, intersegment economics deserve skepticism: internal transactions are priced at management’s estimate of fair value, affiliated revenues eliminated in consolidation grew faster than consolidated revenue, a growing share of Optum Insight’s backlog is affiliated rather than market-won, and the 2026 segment realignment (Optum Financial moving from loss-making Optum Health into margin-compressing Optum Insight, with prior periods recast) must be checked for whether the recast obscures deterioration in either segment. Third, Optum Bank’s loan book is growing rapidly, with consumer lending expanding fastest, commercial mortgages collateralized by commercial real estate, a meaningful portion of loans carried at fair value using unobservable inputs, and funding drawn primarily from HSA deposits — adding a credit and asset-liability dimension that is not core to the health-services thesis.
2.2 Upside Catalysts
sources The catalyst picture is thinner than the risk picture, and we state that plainly: this is a five-risk, three-catalyst profile, and the catalysts are predominantly recovery mechanics — the unwinding of 2025’s damage — rather than new sources of value creation. None is a pure binary windfall; each requires execution against a medical cost trend that management itself expects to persist and has mis-forecast for two consecutive cycles.
Catalyst 1 — The 2026 repricing and benefit redesign restore underwriting margin
sources The most consequential catalyst is the simplest: the fixed-premium model that transmitted the 2025 underwriting miss directly to earnings works symmetrically on the way back. Management has repriced and redesigned benefits for 2026 with the elevated care patterns explicitly contemplated, is deliberately shrinking to restore margin — Medicare Advantage membership, Medicaid membership (including exit from one state) and value-based care lives are all guided to contract — and retains the levers the MD&A enumerates: network composition, benefit adjustments, supplemental premiums and county-by-county participation decisions. The final rate notice for 2026 approached the industry’s forward cost trend, a better starting point than the prior multi-year shortfalls. If realized trend lands within the new pricing corridor, the medical care ratio falls, statutory capital pressure eases, and the recovery becomes self-funding through Risk 4’s machinery in reverse — subsidiary dividends resume, and the holding-company strain unwinds. The essential caveat comes from Risk 3: part of the apparent 2026 improvement is pre-arranged through the loss-contract reserve, so the genuine signal is the medical care ratio excluding reserve releases, not headline segment margin. §
Probability: Medium | Timeframe: 1–2 years | Monitoring trigger: Quarterly medical care ratio against priced trend through 2026, read alongside the rollforward of the loss-contract reserve — improvement driven by reserve releases is noise; improvement in the underlying ratio is signal. Membership attrition running materially beyond guidance would indicate the repricing is overshooting.
Catalyst 2 — Favorable resolution of the 2011 False Claims Act case
sources The court-appointed Special Master has recommended summary judgment in the company’s favor on all remaining claims in the long-running risk-adjustment whistleblower case — the most procedurally favorable posture this matter has reached. The DOJ has moved to reject the recommendation, so the outcome is genuinely open, but adoption of the report by the court would do more than close one case: it would set a read-through precedent on the legal theory underlying risk-adjustment coding liability, the same terrain on which the broader unnamed investigations (Risk 1) operate, and would likely compress the legal-overhang discount embedded in the equity. This is the closest thing in the filing to a binary upside event. §
Probability: Medium | Timeframe: 1–2 years (court timing is not in the company’s control) | Monitoring trigger: The court’s ruling on the Special Master’s report and the DOJ’s objection; any subsequent appellate posture. Symmetrically, rejection of the report would harden Risk 1.
Catalyst 3 — Normalization of subsidiary dividends and resumption of capital returns
sources The same disclosures that constitute Risk 4 define the recovery signature. If the medical care ratio improves, the sequence runs: required statutory capital stabilizes, the deposit-accounted reinsurance scaffolding becomes unnecessary, regulated subsidiaries resume paying dividends to the parent rather than absorbing infusions, the receivables facility can lapse without straining cash flow, rating outlooks revert to stable, and the suspended buyback — historically the company’s principal return channel, with authorization still outstanding — resumes against a depressed share price. Each step is observable in filings, which makes this catalyst unusually monitorable. The dividend increase pushed through mid-2025 despite the earnings collapse signals the Board treats the dividend as a fixed commitment; the buyback is the swing variable and its restart would be the market’s confirmation that management itself believes the balance-sheet pressure has passed.
Probability: Medium | Timeframe: 1–2 years | Monitoring trigger: Direction of parent/subsidiary capital flows and intercompany note balances in the next annual filing’s parent-only schedule; renewal or lapse of the receivables facility at its maturity; rating-outlook revisions; first quarter with resumed repurchases.
2.3 Risk & Catalyst Summary
sources | # | Item | Type | Probability | Timeframe | Status | Monitoring Trigger | |—|—|—|—|—|—|—| | 1 | Federal Medicare-billing investigations — unnamed, unreserved, unbounded | Risk | H | Immediate | Active | First named disclosure, accrual or settlement framework in any 2026 filing; RADV audit outcomes | | 2 | Reserve cushion exhausted — underwriting risk with no buffer | Risk | M | Immediate–2 years | Active | Prior-year development line and premium-deficiency reserve in next medical-costs-payable rollforward | | 3 | Kitchen-sink baseline — 2026 recovery partly manufactured | Risk | H | 1–2 years | Active | Loss-contract reserve releases vs actual 2026 Optum Health results; quality of segment recast | | 4 | Holding-company liquidity reversal and cash-flow propping | Risk | M | Immediate–2 years | Active | Parent/subsidiary capital-flow direction; receivables-facility renewal; rating-outlook actions | | 5 | Goodwill concentration against loss-making Optum Health | Risk | M | 1–2 years | Latent | VBC repricing outcome in 2026; any quantitative headroom disclosure or triggering-event test | | 6 | 2026 repricing and benefit redesign restore underwriting margin | Catalyst | M | 1–2 years | Monitoring | Underlying MCR ex-reserve-releases vs priced trend; membership attrition vs guidance | | 7 | Favorable resolution of the 2011 False Claims Act case | Catalyst | M | 1–2 years | Monitoring | Court ruling on Special Master report and DOJ objection | | 8 | Subsidiary dividend normalization and capital-return resumption | Catalyst | M | 1–2 years | Monitoring | Parent-only schedule capital flows; buyback restart; outlook revisions to stable |
2.4 Risk Interdependencies
sources These risks do not sit side by side; they share a single transmission mechanism, and that is what makes the profile more dangerous than the sum of its parts. The nucleus is CMS: one counterparty simultaneously supplies the largest share of revenue, sets the rates that have run below cost trend for multiple years, administers the risk-adjustment model whose revision is cutting funding, audits the coding that determines payment, and houses the enforcement arm investigating that same coding. A hostile turn on any one of those faces tightens all the others. The financial risks then chain off that nucleus in a defined sequence: if 2026 medical costs disappoint again (Risk 2), the medical care ratio stays elevated, which mechanically raises required statutory capital, which deepens the subsidiary capital absorption and parent funding strain (Risk 4), which converts negative rating outlooks into downgrades just as the uncommitted receivables facility and the put/call obligations can call on liquidity. A failed value-based care repricing — the same event, viewed from the asset side — is also the trigger for an Optum Health goodwill impairment (Risk 5), which would strike the equity base supporting those ratings in the same period. Risk 3 then degrades the instrumentation: because the 2025 baseline was depressed by pulled-forward losses and flattered by a non-cash gain, the early-warning value of reported 2026 margins is impaired — reserve releases can make a deteriorating book look like a recovering one for several quarters, delaying recognition of exactly the scenario described above. The single most damaging combination is a second underwriting miss coinciding with an adverse development in the DOJ matters: the first removes the financial flexibility, the second arrives as an unreserved claim against it, and the disclosure posture of the filing means neither is currently priced into reported figures. Conversely, the dependencies work in reverse — a clean underwriting year releases the entire chain at once, which is why Catalyst 1 dominates the upside case.
2.5 ESG & Regulatory Exposure
sources The regulatory exposure in this filing is unusually concrete and sits well above generic sector risk. On Medicare Advantage, management states that rate notices for numerous years have set base rates well below forward medical cost trend, that the advance notice for 2027 is “far below” it, and that revisions to the risk-adjustment model have reduced and will continue to reduce funding — a sustained, quantified-by-management policy squeeze on the company’s largest program, arriving while CMS premiums have grown to a record share of consolidated revenue. On Medicaid, management characterizes state funding and payment rates as insufficient to meet patient health needs, is exiting one state, and expects membership losses from reduced eligibility — an explicit statement that a government customer is paying below cost. The pharmacy business faces its own active agenda: the risk factors detail ongoing governmental investigations into PBM practices industry-wide that have already produced civil penalties and corporate integrity agreements, alongside potential legislation on rebates, formularies, pricing benchmarks and network design that could materially change the Optum Rx business model. The Inflation Reduction Act has already shifted more Part D risk onto plans. Layered over all of it sits the disclosure gap on the DOJ Medicare-billing investigations treated as Risk 1 — the defining regulatory fact of this filing year. §
On the social and data dimensions, the company’s obligations are structural rather than reputational: it is one of the largest custodians of protected health information in the country, operating as both covered entity and business associate under HIPAA, and the Change Healthcare breach demonstrated the tail — mass compromise of personal health data at a recently acquired, incompletely integrated business, with provider-loan losses still being reserved nearly two years later and the breach-litigation exposure unquantified in the contingencies footnote. The cybersecurity item describes a credible governance apparatus — NIST-framework alignment, penetration and recovery testing, Board oversight delegated to the Audit and Finance Committee with an external incident-response firm engaged — but its assertion that no cybersecurity threats materially affected the company as of year-end sits awkwardly beside the same filing’s fourth-quarter cyberattack reserve, and we weight the reserve over the assertion. The company also flags its expanding use of AI in operations and products as a legal and regulatory risk in its own right, with health-data and AI legislation evolving at federal and state level — relevant for a business whose moat is explicitly data-driven. On environment, the filing’s exposure is through medical costs rather than operations: management identifies natural disasters and effects of climate change as drivers of increased care costs, a channel that runs straight into the underwriting risk in Section 2.1 rather than into a sustainability report. On governance, three facts from the filing stand on their own: the Chair and CEO roles were recombined in the May 2025 transition, reversing the prior separation; the majority of listed executive officers are new or newly in role within roughly twelve months; and shareholder suits entered the litigation disclosure for the first time. Each is a fact, not an allegation — but together they mean governance execution must be monitored rather than assumed during precisely the period when the financial risks above are most live.
Section 3 — Financial Analysis & Historical Performance
sources Three-Statement Linkage Confirmation: - Net Income ties (Income Statement → Cash Flow Statement): Confirmed. The cash flow statement opens from consolidated net earnings including noncontrolling interests, which reconciles to net earnings attributable to common shareholders after deducting the noncontrolling-interest share. No discrepancy. - Cash ties (Balance Sheet → Cash Flow Statement): Confirmed. Year-end cash and equivalents on the balance sheet tie to the cash flow statement’s ending cash balance in each year of the five-year window. - Retained Earnings reconciliation: Confirmed with one structural note. Beginning retained earnings plus net earnings less dividends does not arrive at ending retained earnings on its own, because the company allocates share-repurchase consideration in excess of par against retained earnings. Once that allocation is incorporated, the account reconciles. The analytically important consequence — disclosed in the forensic review — is that in the most recent year dividends plus buybacks exceeded net earnings attributable to shareholders, and retained earnings declined for the first time in the coverage window.
3.1A Income Statement
sources | | FY2021 | FY2022 | FY2023 | FY2024 | FY2025 | |—|—|—|—|—|—| | Revenue ($M) | $287,597.0M | $324,162.0M | $371,622.0M | $400,278.0M | $447,567.0M | | YoY Growth | — | 12.7% | 14.6% | 7.7% | 11.8% | | D&A ($M) | $3,103.0M | $3,400.0M | $3,972.0M | $4,099.0M | $4,361.0M | | EBITDA ($M) (computed: EBIT + D&A) | $27,073.0M | $31,835.0M | $36,330.0M | $36,386.0M | $23,325.0M | | EBITDA Margin | 9.4% | 9.8% | 9.8% | 9.1% | 5.2% | | EBITDA Growth | — | 17.6% | 14.1% | 0.2% | -35.9% | | EBIT ($M) | $23,970.0M | $28,435.0M | $32,358.0M | $32,287.0M | $18,964.0M | | EBIT Margin | 8.3% | 8.8% | 8.7% | 8.1% | 4.2% | | Interest Expense ($M) | $1,660.0M | $2,092.0M | $3,246.0M | $3,906.0M | $4,002.0M | | Pre-Tax Income ($M) | $22,310.0M | $26,343.0M | $29,112.0M | $20,071.0M | $14,697.0M | | Tax Expense ($M) | $4,578.0M | $5,704.0M | $5,968.0M | $4,829.0M | $1,890.0M | | Effective Tax Rate | 20.5% | 21.7% | 20.5% | 24.1% | 12.9% | | Net Income ($M) | $17,285.0M | $20,120.0M | $22,381.0M | $14,405.0M | $12,056.0M | | Net Margin | 6.0% | 6.2% | 6.0% | 3.6% | 2.7% | | Net Income Growth | — | 16.4% | 11.2% | -35.6% | -16.3% | | Diluted EPS | $18.08 | $21.18 | $23.86 | $15.51 | $13.23 | | EPS Growth | — | 17.1% | 12.7% | -35.0% | -14.7% | | Diluted Shares (M) | 956 | 950 | 938 | 929 | 911 |
Source: Company FY2025 Form 10-K, consolidated statements of operations; FY2021–FY2023 figures per the corresponding prior-year filings. UnitedHealth reports as an insurer — medical costs and operating costs replace the conventional COGS/gross-profit presentation, so no gross-margin line is shown.
CAGR Summary
| Metric | 3Y CAGR | 5Y CAGR | 10Y CAGR |
|---|---|---|---|
| Revenue | 11.4% | — | — |
| EBITDA | -9.8% | — | — |
| Net Income | -15.7% | — | — |
| Diluted EPS | -14.5% | — | — |
| FCF | -11.8% | — | — |
3.1B Income Statement — Analysis
sources The revenue story. The top line grew every year of the window, from $287,597.0M in FY2021 to $447,567.0M in FY2025, a 11.4% three-year CAGR. But the composition of that growth deteriorated meaningfully in the final year. FY2025’s 11.8% expansion was driven by Medicare Advantage membership growth, higher-acuity Medicaid members, Optum Rx script volume from new and existing clients — and, critically, by the Inflation Reduction Act’s redesign of Medicare Part D, which shifted more risk to plans and mechanically grossed up both premiums and medical costs. Revenue that arrives pre-matched with an equal-and-offsetting cost increase is low-quality growth: it inflates the denominator of every margin ratio without adding profit dollars. The FY2024 deceleration to 7.7% reflected the Change Healthcare cyberattack’s disruption of Optum Insight and the South American divestiture program; the FY2025 reacceleration is therefore partly optical. Looking forward, management guides to membership contraction across Medicare Advantage, Medicaid and value-based care lives — meaning FY2026 is explicitly framed as a shrink-to-restore-margin year, and the five-year pattern of uninterrupted double-digit-average growth should not be extrapolated.
The margin trajectory. This is the center of the investment debate, and management’s own words frame it: the filing concedes that FY2025 pricing and health-status assumptions fell “well short” of the medical cost trend actually incurred, significantly impacting earnings. EBIT margin held in a tight band from 8.3% in FY2021 to a peak of 8.8% in FY2022, eased to 8.1% in FY2024, then collapsed to 4.2% in FY2025 — roughly half the level the franchise sustained for the prior four years. The compression is a layered phenomenon: multi-year Medicare Advantage rate notices set below forward medical cost trend, the phase-in of risk-adjustment model revisions reducing funding, elevated utilization and provider billing intensity, the adverse member profile of newly added value-based care patients, individual-exchange market morbidity, and the Part D risk shift. Our judgment is that the trajectory is part cyclical, part structural: the underwriting miss is repriceable through the FY2026 cycle, but the government-funding squeeze and the disappearance of the reserve-release cushion (below) are structural features of the next several years, not a one-year air pocket.
Major Movers. Five drivers materially moved the income statement, and they must be separated to see the underlying business:
- The underwriting miss (structural-cyclical hybrid). EBIT fell from $32,287.0M to $18,964.0M as medical costs outran priced assumptions across Medicare Advantage, Medicaid and the exchanges. Management has now mis-forecast trend for two consecutive pricing cycles, which weakens confidence in the FY2026 repricing thesis even as benefit-design and county-exit levers are pulled.
- The Q4 “kitchen-sink” restructuring charge (temporary, but read it skeptically). The fourth quarter absorbed a restructuring bundle that the forensic review flags as far broader than conventional restructuring: real-estate rationalization and workforce reductions, but also net valuation losses on equity securities, a discretionary advance funding of the company’s charitable foundation, and — most importantly — a loss contract reserve that pulls anticipated FY2026 value-based care losses into FY2025. This is a classic big-bath pattern in the first full quarter under a new CEO and CFO: it depresses the transition year and manufactures an easier comparison base. Any FY2026 margin “recovery” must be read net of reserve releases and the non-recurrence of these charges.
- A non-cash deconsolidation gain booked inside operating costs (one-off, flattering). A change in governance rights triggered deconsolidation of a business whose redeemable noncontrolling-interest carrying value exceeded its net assets, producing a large gain recorded within operating costs — the principal driver of the net portfolio-action gain attributed to Optum Rx and therefore of that segment’s reported earnings growth. No cash was received; the retained stake is now a Level 3 equity-method investment. Reported FY2025 EBIT is thus simultaneously depressed by the restructuring bundle and inflated by this gain — neither belongs in a run-rate.
- The evaporation of favorable reserve development (structural). Favorable prior-year medical-reserve development has declined sharply for three consecutive years and is now a small fraction of its earlier level, while premium-deficiency and loss-contract reserves appear in the claims rollforward for the first time. The cushion of conservatism that historically released into each year’s earnings is essentially gone: the reported medical care ratio is now a “truer” — and structurally higher — number, with far less buffer if claims trend deteriorates again.
- The tax-rate collapse (unsustainable cushion to net income). The effective rate fell to 12.9% from 24.1% as permanent items — primarily Irish rate differential and Luxembourg tax attributes — plus nontaxable divestiture effects landed on a depressed pre-tax base of $14,697.0M. Without it, the -16.3% net income decline would have been markedly worse. Gross unrecognized tax benefits jumped sharply with IRS examinations open across multiple years; the forward model should normalize toward the historical rate near 20.5%.
A sixth driver compounds below the operating line: interest expense climbed from $1,660.0M to $4,002.0M across the window as debt was added — a structural increase that arrived precisely as the operating earnings supporting it halved.
Quality of earnings. Neither of the last two fiscal years is a clean base. FY2024 carried portfolio-refinement gains in operating results, cyberattack-related provider accommodation costs, and the Brazil divestiture loss below the operating line — which is why FY2024’s effective rate of 24.1% was elevated by non-deductible disposition losses while FY2025’s 12.9% was depressed by their mirror image. FY2025 EBIT of $18,964.0M nets a kitchen-sink charge (including next year’s pre-booked losses) against a non-cash accounting gain. The honest characterization is that underlying FY2025 operating earnings sit somewhere between the reported figure and the FY2024 level, and that the -9.8% three-year EBITDA CAGR overstates the decay in the franchise while the reported FY2025 margin understates its run-rate earning power. Both distortions are disclosed; neither is quantifiable from the face of the statements alone — which is itself a disclosure-quality criticism. One further earnings-quality point carries a forensic RED flag and must be stated plainly: the publicly confirmed Department of Justice criminal and civil investigations into the company’s Medicare billing practices are addressed in the filing only through generic language, with no liability accrued and no range of loss provided. Reported earnings therefore carry no reserve whatsoever for this exposure — any settlement, penalty or program consequence would be entirely incremental to every figure in the tables above. The exposure itself is treated in depth in Section 2; its earnings-quality implication belongs here.
⚠ Items to Watch. - If FY2026 EBIT margin fails to recover meaningfully above 4.2% despite the repricing cycle, the loss-reserve release tailwind and the non-recurrence of the Q4 charge, the structural-impairment thesis displaces the cyclical-trough thesis. - If the effective tax rate remains below 20.5% in FY2026, earnings quality concerns deepen — the historical rate, not the FY2025 print, is the right modeling anchor. - If revenue growth in FY2026 exceeds 7.7% despite guided membership contraction across MA, Medicaid and value-based care, interrogate whether growth is again arriving via the low-quality Part D gross-up channel rather than profitable lives. - Watch the cadence of loss-contract reserve releases against FY2026 medical costs: margin improvement funded by reserve release is accounting, not recovery. - The segment realignment effective at the start of FY2026 — Optum Financial moves from loss-making Optum Health into Optum Insight, with prior periods recast — breaks segment comparability at exactly the moment segment trends matter most; recast figures should be checked for whether they mask underlying deterioration in either segment, particularly given that intersegment transactions are priced at management’s estimate of fair value.
3.2A Balance Sheet
sources | | FY2021 | FY2022 | FY2023 | FY2024 | FY2025 | |—|—|—|—|—|—| | ASSETS | | | | | | | Cash & Equivalents ($M) | $21,375.0M | $23,365.0M | $25,427.0M | $25,312.0M | $24,365.0M | | Receivables ($M) | $14,216.0M | $17,681.0M | $21,276.0M | $22,365.0M | $23,018.0M | | Total Current Assets ($M) | $61,758.0M | $69,069.0M | $78,437.0M | $85,779.0M | $90,582.0M | | PP&E, net ($M) | $8,969.0M | $10,128.0M | $11,450.0M | $10,553.0M | $10,762.0M | | Goodwill & Intangibles ($M) | $75,795.0M | $93,352.0M | $103,732.0M | $106,734.0M | $110,499.0M | | Total Assets ($M) | $212,206.0M | $245,705.0M | $273,720.0M | $298,278.0M | $309,581.0M | | LIABILITIES & EQUITY | | | | | | | Short-term Debt ($M) | $3,620.0M | $3,110.0M | $4,274.0M | $4,545.0M | $6,069.0M | | Total Current Liabilities ($M) | $78,292.0M | $89,237.0M | $99,054.0M | $103,769.0M | $114,897.0M | | Long-term Debt ($M) | $42,383.0M | $54,513.0M | $58,263.0M | $72,359.0M | $72,320.0M | | Total Debt ($M) | $46,003.0M | $57,623.0M | $62,537.0M | $76,904.0M | $78,389.0M | | Net Debt ($M) | $24,628.0M | $34,258.0M | $37,110.0M | $51,592.0M | $54,024.0M | | Total Liabilities ($M) | $135,727.0M | $159,358.0M | $174,801.0M | $195,687.0M | $207,883.0M | | Shareholders’ Equity ($M) | $71,760.0M | $77,772.0M | $88,756.0M | $92,658.0M | $94,110.0M | | Retained Earnings ($M) | $77,134.0M | $86,156.0M | $95,774.0M | $96,036.0M | $95,603.0M | | Key Ratios | | | | | | | Current Ratio | 0.8x | 0.8x | 0.8x | 0.8x | 0.8x | | Net Debt / EBITDA | 0.9x | 1.1x | 1.0x | 1.4x | 2.3x | | Debt / Equity | 0.6x | 0.7x | 0.7x | 0.8x | 0.8x | | Book Value / Share | $75.06 | $81.87 | $94.62 | $99.74 | $103.30 |
Source: Company FY2025 Form 10-K, consolidated balance sheets; prior years per the corresponding filings. As an insurer, the company carries no inventory; inventory-linked working-capital metrics (DIO, cash conversion cycle) are undefined and omitted. Total liabilities are as printed in the filing; note that redeemable noncontrolling interests sit in a mezzanine caption between liabilities and equity, so total liabilities plus shareholders’ equity does not sum to total assets without it.
3.2B Balance Sheet — Analysis
sources Asset composition. This is an acquisition-built balance sheet wearing an insurer’s working-capital structure. Goodwill and intangibles of $110,499.0M dominate total assets of $309,581.0M — by far the largest single asset category — while net PP&E is just $10,762.0M. The company does not build; it buys, and the goodwill stack grew every year of the window, from $75,795.0M in FY2021. The forensic review attaches a RED flag here that we regard as the balance sheet’s most important single issue: Optum Health’s goodwill — the largest of the four segments’ — increased through acquisitions in the same year that segment swung to an operating loss and required a loss-contract reserve for its forward book. Management asserts the annual impairment test found fair values “substantially in excess” of carrying values, but discloses no quantitative headroom, discount rates or growth assumptions — an untestable assertion that sits uneasily beside realized remeasurement losses on the businesses the company actually moved to held-for-sale, where exit values came in below carrying values. If value-based care economics do not recover on the FY2026 repricing, impairment risk migrates from theoretical to live, and a charge would land directly on the equity base supporting credit ratings already carrying negative outlooks. A further structural note: a redeemable noncontrolling-interest balance sits in the mezzanine, outside both liabilities and equity as presented in the table above; that mezzanine balance collapsed year-over-year, driven by the same governance-rights deconsolidation that produced the operating-cost gain discussed in 3.1B.
Leverage trajectory. Total debt grew from $46,003.0M to $78,389.0M and net debt from $24,628.0M to $54,024.0M — a steady, acquisition-funded build that was unremarkable while EBITDA grew alongside it. The FY2025 earnings collapse changed the arithmetic abruptly: net debt/EBITDA jumped from 1.0x in FY2023 to 1.4x in FY2024 and 2.3x in FY2025, with gross debt/equity reaching 0.8x. The deterioration is denominator-driven, but the consequences are real, and the forensic memo’s holding-company findings sharpen them considerably: in FY2025 the regulated insurance subsidiaries — historically the engine that up-streamed billions in dividends to the parent — instead received net capital infusions, the parent’s borrowings from its own subsidiaries rose materially, and the company entered reinsurance agreements under deposit accounting (no risk transfer) to manage statutory surplus. That combination — subsidiaries absorbing capital, intercompany funding of external obligations, and capital engineering via reinsurance — is the signature of a holding company whose internal cash engine has temporarily reversed. Required statutory capital is expected to increase further as the elevated medical care ratio flows through. No covenant breach is flagged, but deleveraging, buyback resumption and dividend growth all now depend on the medical care ratio normalizing. One off-balance-sheet item belongs in any complete leverage picture: the portfolio-refinement program left the company holding minority stakes in unconsolidated businesses with newly quantified put and call options attached — a multi-billion-dollar estimated redemption obligation if currently redeemable, disclosed for the first time this year, that appears nowhere among the liabilities in the table above. The puts are largely counterparty-controlled and sit outside the next twelve months, but they are a potential future call on the same parent liquidity already under strain.
Working capital. A current ratio of 0.8x — below parity in every year shown — would alarm in an industrial context but is structural for an insurer: premiums are collected before claims are paid, and the resulting float is the business model, not a liquidity defect. The receivables picture deserves more scrutiny than the headline suggests. DSO improved to 19 days in FY2025 from 20 days in FY2024, which would ordinarily read as collection discipline — but the forensic review identifies a new, uncommitted, sub-one-year receivables-sale facility entered during FY2025, under which sold receivables are derecognized and the proceeds classified as operating cash flow. Part of the apparent receivables improvement is therefore monetization, not collection, and it can reverse if the banks decline to renew. Receivables of $23,018.0M nonetheless grew more slowly than revenue in FY2025, so there is no adverse build signal beyond the facility caveat. One watch item within the receivables base: nearly two years after the Change Healthcare cyberattack, the company took a sizable incremental reserve against collection of the interest-free loans it extended to affected care providers, and the allowance on other current receivables rose markedly year-over-year — a live, slow-burning credit tail from that event, absorbed in Optum Insight’s results.
⚠ Items to Watch. - If net debt/EBITDA remains above 1.4x at FY2026 year-end — i.e., fails to retrace even to the FY2024 level as earnings recover — the negative rating outlooks become live downgrade risk and the capital-return program stays constrained. - Any Optum Health goodwill impairment charge against the $110,499.0M goodwill-and-intangibles stack is a direct hit to the $94,110.0M equity base; watch the FY2026 annual test disclosure for the first appearance of quantified headroom. - If regulated subsidiaries require net capital infusions for a second consecutive year, parent-level dividend capacity is the binding constraint — regardless of consolidated earnings. - A reversal of the receivables-sale facility would show up as a working-capital drag; watch whether DSO retraces toward 20 days.
3.3A Cash Flow Statement
| FY2021 | FY2022 | FY2023 | FY2024 | FY2025 | |
|---|---|---|---|---|---|
| Cash from Operations ($M) | $22,343.0M | $26,206.0M | $29,068.0M | $24,204.0M | $19,697.0M |
| Capital Expenditures ($M) | $-2,454.0M | $-2,802.0M | $-3,386.0M | $-3,499.0M | $-3,622.0M |
| Free Cash Flow ($M) | $19,889.0M | $23,404.0M | $25,682.0M | $20,705.0M | $16,075.0M |
| FCF Margin | 6.9% | 7.2% | 6.9% | 5.2% | 3.6% |
| FCF / Share | $20.80 | $24.64 | $27.38 | $22.29 | $17.65 |
| FCF Conversion (FCF/NI) | 115.1% | 116.3% | 114.7% | 143.7% | 133.3% |
| CapEx / Revenue | 0.9% | 0.9% | 0.9% | 0.9% | 0.8% |
| CapEx / D&A | 0.8x | 0.8x | 0.9x | 0.9x | 0.8x |
| Dividends Paid ($M) | $-5,280.0M | $-5,991.0M | $-6,761.0M | $-7,533.0M | $-7,916.0M |
| Share Repurchases ($M) | $-5,000.0M | $-7,000.0M | $-8,000.0M | $-9,000.0M | $-5,545.0M |
Source: Company FY2025 Form 10-K, consolidated statements of cash flows; prior years per the corresponding filings.
3.3B Cash Flow — Analysis
sources Quality of operating cash flow. Operating cash flow peaked at $29,068.0M in FY2023 and has declined for two consecutive years, to $24,204.0M and then $19,697.0M — a -9.1% three-year CAGR. Headline FCF conversion looks excellent at 133.3%, but that figure flatters for two reasons and must not be read as a quality signal. First, the denominator: net income is depressed by the non-cash Q4 charges, so conversion above one hundred percent is partly an artifact of the same charges that crushed earnings — the FY2024 reading of 143.7% carries the identical distortion in reverse direction from the Brazil loss. Second, the numerator: per the forensic review, FY2025 operating cash flow was explicitly supported by the new receivables-sale facility — management itself lists the sale of receivables among the supports to the year’s operating cash flows. Because the facility is uncommitted and matures inside a year, that benefit is borrowed, not earned; non-renewal converts it into an FY2026 operating-cash-flow headwind. Management separately states the net FY2026 cash impact of the restructuring actions should be immaterial — accrual outflows offset by disposal proceeds — which confirms the Q4 charges were largely non-cash or timing in nature, consistent with the big-bath reading in 3.1B. Adjusting mentally for the facility, underlying FY2025 cash generation declined materially but remained solidly positive; the franchise still throws off cash even in its worst underwriting year in the window.
CapEx analysis. Capital intensity is structurally trivial and stable: CapEx runs below one percent of revenue (0.8% in FY2025) and has sat below parity with depreciation throughout the window (0.8x in FY2025). For an industrial, a sub-1.0x CapEx/D&A ratio would suggest harvest mode; here it simply reflects where growth capital actually goes — acquisitions, which bypass the CapEx line entirely and accumulate as the goodwill stack analyzed in 3.2B. The filing does not split maintenance from growth CapEx; given the magnitudes, the distinction is immaterial to valuation. The real reinvestment question for this company is M&A discipline, not CapEx sufficiency.
Capital allocation waterfall. Over the five years shown, cumulative FCF was absorbed roughly equally by shareholder returns and by acquisition spending funded alongside debt issuance. Within shareholder returns the mix is shifting in a direction that warrants attention. Dividends rose every single year, from $-5,280.0M to $-7,916.0M, and the payout ratio has climbed from 30.5% to 65.7% — driven by the earnings collapse, not by a policy change, but a payout at that level on depressed earnings consumes flexibility. Buybacks tell the sharper story: repurchases peaked at $-9,000.0M in FY2024, were cut to $-5,545.0M in FY2025, and — per the forensic review — stopped entirely in the closing months of the year, after the full-year repurchases had been executed at an average price far above where the stock ended the year. Value-destructive timing followed by a halt, alongside a mid-year dividend increase, reads as capital conservation forced by the holding-company strain documented in 3.2B rather than as opportunism. The net result, flagged in the linkage confirmation above: dividends plus buybacks exceeded attributable net earnings, and retained earnings fell from $96,036.0M to $95,603.0M. Per-share support from repurchases — the diluted count fell at a -1.4% three-year CAGR to 911M — should not be assumed to continue in FY2026.
⚠ Items to Watch. - If FY2026 operating cash flow falls below the FY2025 level of $19,697.0M, the decline is worse than it appears — the FY2025 base already includes the one-time receivables-facility benefit. - If the dividend payout ratio remains above 52.3% in FY2026, the dividend-growth streak is colliding with the earnings base; a payout retracing toward 30.2% on recovered earnings is the healthy path. - Buyback resumption ahead of visible subsidiary-dividend normalization would be a yellow flag for capital discipline, not a bullish signal. - FCF/share below $17.65 for a second year would force the dividend conversation: DPS of $8.69 already consumes roughly half of FY2025 FCF per share.
3.4 Returns Analysis
sources | | FY2021 | FY2022 | FY2023 | FY2024 | FY2025 | |—|—|—|—|—|—| | ROIC | 19.8% | 21.4% | 21.6% | 18.2% | 11.3% | | ROE | 24.1% | 26.9% | 26.9% | 15.9% | 12.9% | | ROA | 8.1% | 8.8% | 8.6% | 5.0% | 4.0% | | Interest Coverage | 14.4x | 13.6x | 10.0x | 8.3x | 4.7x |
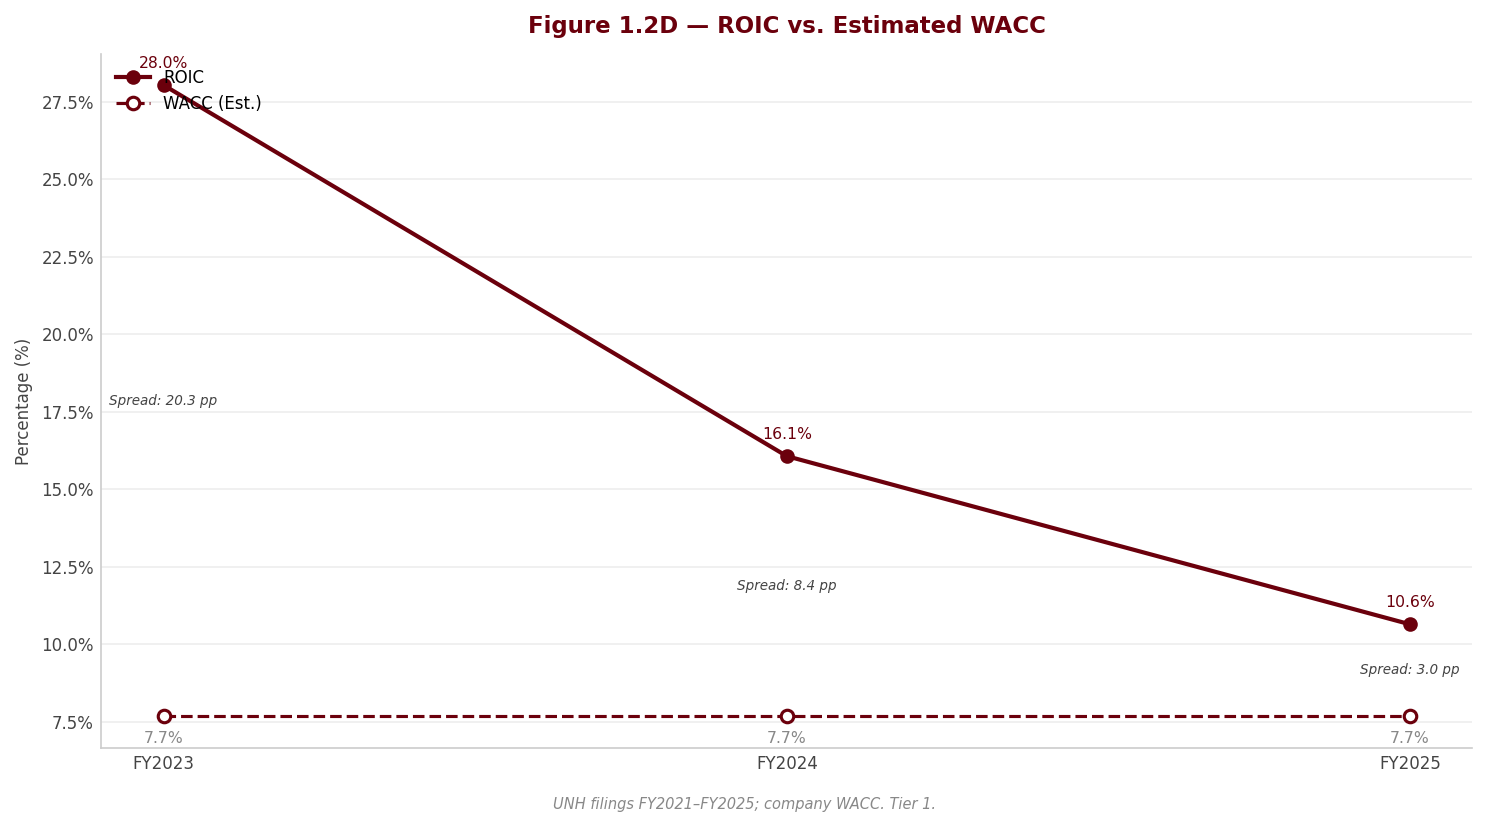
The returns table is the cleanest summary of what FY2025 did to this franchise. ROIC peaked at 21.6% in FY2023 — an elite figure for a business of this scale, and the quantitative expression of the flywheel described in Section 1 — then fell to 18.2% and 11.3%. Even the depressed FY2025 figure should remain above the cost of capital derived in Section 4, meaning the company is still creating value on its invested base at the trough — but the spread has compressed from commanding to ordinary in two years. The decomposition matters: invested capital kept growing (the goodwill build of 3.2B) while NOPAT halved, so the ROIC decline is both a numerator collapse and a denominator that never stopped expanding. The recovery case requires the FY2026 repricing to restore the numerator against a capital base that the company is now actively pruning through divestitures. Interest coverage tells the same story from the creditor’s seat: 14.4x in FY2021 has fallen to 4.7x — still comfortable in absolute terms, but a steep glide path, and the figure embeds the depressed, charge-laden FY2025 EBIT.
The DuPont decomposition isolates where ROE was won and lost. FY2025 ROE of 12.9% decomposes into a net margin of 2.7%, asset turnover of 1.47x and an equity multiplier of 3.25x. Asset turnover is the stable backbone — it actually improved in FY2025 as the Part D gross-up pushed revenue up faster than assets — and the equity multiplier has drifted up only modestly across the window. The entire collapse from the 26.9% FY2023 ROE to 12.9% in FY2025 is therefore a margin event: net margin compressed from 6.0% to 2.7%. The swing factor is, and will remain, the underwriting margin — turnover and leverage are structurally pinned by the business model. This is analytically convenient: the ROE recovery thesis collapses into a single question, which is whether the medical care ratio normalizes, and every margin watch-item in 3.1B applies here without modification.
3.5 Altman Z-Score (Most Recent FY)
sources | Component | FY2023 | FY2024 | FY2025 | |—|—|—|—| | X1 (Working Capital / Total Assets) | -0.075 | -0.060 | -0.079 | | X2 (Retained Earnings / Total Assets) | 0.350 | 0.322 | 0.309 | | X3 (EBIT / Total Assets) | 0.118 | 0.108 | 0.061 | | X4 (Equity / Total Liabilities) | 0.508 | 0.474 | 0.453 | | X5 (Revenue / Total Assets) | 1.358 | 1.342 | 1.446 | | Z-Score | 2.45 | 2.36 | 2.26 | | Zone | Gray (1.81–2.99) | Gray (1.81–2.99) | Gray (1.81–2.99) |
The company sits in the gray zone in all three years shown, and the score has declined in each of the last two — moving toward, not away from, the distress boundary. Two readings must be held simultaneously. First, the model’s mechanics overstate risk for an insurer: X1 is structurally negative because premium float makes negative working capital the business model, not a stress symptom, and the Z-score was calibrated on manufacturers. A gray-zone reading for a large health insurer is normal and carries no implication of distress. Second — and this is the part not to soften — the direction is informative even where the level is not. The deterioration is driven almost entirely by X3, the EBIT-to-assets ratio, which roughly halved in FY2025, with X2 and X4 also eroding as retained earnings declined and liabilities grew. In other words, the model is correctly detecting exactly what the rating agencies’ negative outlooks detect: a profitability shock landing on a balance sheet that kept levering through it. Credit risk here is not solvency risk — it is downgrade risk, with consequences for funding costs and commercial-paper flexibility. A recovery in X3 alongside stabilization of X2 in FY2026 would retrace the score toward its FY2023 level; a third consecutive decline would mean the profitability shock is compounding rather than mean-reverting.
Section 4 — Valuation Methodology
4.1 Cost of Capital (WACC)
sources All inputs to the WACC are verified market data (from market-researcher output) or approved analyst assumptions. Computed metrics are marked accordingly.
4.1.1 Cost of Equity
sources | Component | Value | Source | |—|—|—| | Risk-Free Rate (10Y UST) | 4.55% | US Treasury 10-year par yield | | Equity Risk Premium | 4.18% | Damodaran implied ERP | | Beta (Levered) | 0.65 | 5-year monthly regression — raw, not relevered | | Size Premium | 0.00% | Not applied — mega-cap issuer | | Company-Specific Risk Premium | 2.31% | Analyst judgment — rationale below | | Cost of Equity (Ke) | 8.77% | CAPM: Rf + β × (ERP + CRP) |
The beta of 0.65 is the raw five-year monthly estimate, deliberately not relevered. Total debt has risen meaningfully over the estimation window — from $57,623.0M in FY2022 to $78,389.0M in FY2025 — but market-value leverage remains modest, and relevering off the current market debt-to-equity ratio would be circular: that ratio is elevated primarily because the equity price collapsed in 2025 on idiosyncratic news, not because of a financing decision. The honest caveat cuts the other way as well — the 2025 idiosyncratic drawdown depresses the measured beta, so the regression understates forward-looking risk. That residual risk is addressed explicitly through the company-specific premium rather than by adjusting beta, which keeps the judgment visible in one place instead of buried in a relevering convention.
The company-specific risk premium of 2.31% is the single most consequential judgment in this valuation, and it deserves to be read as exactly that: a discretionary analyst overlay, not a market-derived input. It is applied for three forensic findings that no CAPM input can capture. First, publicly confirmed Department of Justice criminal and civil investigations into Medicare billing practices are carried at zero accrual, with no named disclosure in the filing and no estimable loss range — an unpriced tail against the company’s largest revenue source. Second, holding-company liquidity is strained: regulated subsidiaries are absorbing capital rather than upstreaming dividends, the parent is leaning on intercompany funding, and all three rating agencies carry Negative outlooks. Third, a cluster of earnings- and cash-flow-quality findings — a kitchen-sink fourth-quarter charge, operating cash flow supported by a new uncommitted receivables-sale facility, and an exhausted favorable-development cushion — materially raises forecast risk. Because the workbook formula scales this premium by beta, the input was calibrated to deliver the intended uplift to the cost of equity. Removing the premium entirely would lower the WACC and raise the DCF fair value by more than any other single input change in this report; a reader who rejects the premium should re-derive the valuation before relying on Section 6. Even with the premium, the resulting Ke of 8.77% is not high by broad-market standards — the depressed measured beta dominates the calculation — which is itself a reason the discretionary overlay exists.
4.1.2 Cost of Debt
sources | Component | Value | |—|—| | Pre-tax Cost of Debt (Kd) | 5.15% | | Marginal Tax Rate | 20.50% | | After-tax Cost of Debt | 4.10% |
The pre-tax cost of debt of 5.15% is derived from FY2025 interest expense divided by average total debt across the FY2024 and FY2025 balance sheets, both taken from the Excel workbook. The implied spread over the risk-free rate is modest and consistent with a single-A composite credit profile — but all three agencies hold Negative outlooks, so the realized cost of incremental debt is more likely to drift above this figure than below it if the holding-company strain persists.
The marginal tax rate of 20.50% is a normalized rate, not the mechanical three-year average, and the choice is deliberate. The FY2025 effective rate of 12.9% is artificially low — Irish and Luxembourg tax attributes amplified by depressed pre-tax income, plus nontaxable divestiture effects — and is not sustainable. The FY2024 rate of 24.1% is artificially high, inflated by a non-deductible Brazil loss. FY2023, at 20.5%, is the cleanest recent year and sits between the two distorted ones; it anchors both the after-tax cost of debt and every projection year in the DCF. Note that this normalization works against the valuation: a mechanical average would have produced a lower tax rate and a higher fair value.
4.1.3 Capital Structure & WACC
| Component | Value |
|---|---|
| Equity Weight (market value) | 87.0% |
| Debt Weight (market value) | 13.0% |
| WACC | 8.16% |
At 87.0% equity and 13.0% debt, the capital structure is lightly leveraged at market values even after the 2025 share-price decline, and the WACC of 8.16% is therefore driven almost entirely by the cost of equity — the cost of debt is close to immaterial at this weight mix. The practical consequence is that every judgment embedded in Ke, above all the discretionary company-specific premium, flows through to the discount rate nearly one-for-one on an equity-weighted basis. The sensitivity grids in Section 4.3 should be read with that in mind.
4.2 DCF Model — Three Scenarios
sources The DCF uses a five-year explicit projection of unlevered free cash flow discounted at the WACC, with terminal value computed under two methods — perpetuity growth and exit EV/EBITDA multiple — and the selected method shown in Section 4.2.3 with the rationale for the choice. The five-year window is deliberate: it captures the 2026 repricing-and-contraction year plus a multi-year margin-normalization arc, and no long-duration capital program warrants a longer horizon. Three scenarios — Base, Bear, Bull — differ in revenue growth, EBITDA margin, and terminal growth per the standard adjustments described below; all three use the same WACC.
4.2.1 Key Assumptions
sources | Assumption | Bear | Base | Bull | |—|—|—|—| | Revenue Growth — each year | Base − 2pp | -0.5% (Y1) → 4.0% (Y5) | Base + 2pp | | EBITDA Margin — each year | Base − 1pp | 6.5% (Y1) → 8.0% (Y5) | Base + 1pp | | CapEx / Revenue | unchanged | 0.9% | unchanged | | D&A / Revenue | unchanged | 1.0% | unchanged | | Effective Tax Rate | unchanged | 20.5% | unchanged | | Terminal Growth Rate | Base − 0.5pp | 2.5% | Base + 0.5pp | | Exit EV/EBITDA Multiple | 10.0x | 10.0x | 10.0x | | WACC | 8.16% | 8.16% | 8.16% |
Note: Bear and Bull use the standard adjustments above (per the valuation-agent methodology), applied to every projection year as full independent DCF reruns. The resulting fair values appear in Section 6.2 ($306.31 / $620.40).
Revenue path. Year 1 revenue growth of -0.5% is negative by design. Management has guided to a deliberate shrink-to-restore-margins year: Medicare Advantage membership contraction, Medicaid losses including a full state exit, and a pruning of value-based-care lives, only partially offset by repricing. This sits far below the company’s recent historical growth rate — intentionally so, because that history reflects a pricing catch-up era that management itself says is over, and projecting it forward would compound a base that no longer exists. Year 2 at 3.0% assumes membership stabilizes and rate increases earn through. Years 3 and 4 at 4.5% and 4.5% are deliberately held below national health-expenditure growth: CMS now represents a record share of consolidated revenue and is actively cutting effective rates, which caps the company’s pricing power regardless of utilization trends. Year 5 at 4.0% glides toward the terminal rate.
Margin path. Neither end-year of the historical record is a clean anchor. FY2025 EBITDA of $23,325.0M carries the fourth-quarter kitchen-sink bundle — restructuring, equity-security valuation losses, a charitable-foundation advance, and a loss-contract reserve that pulls anticipated 2026 value-based-care losses into 2025 — plus the cyber-related loan reserve; it is not a run-rate. FY2024 EBITDA of $36,386.0M is flattered by portfolio-refinement gains booked inside operating costs. The Year 1 margin of 6.5% therefore assumes only a partial recovery: the one-offs do not recur and the pre-booked loss reserve releases against 2026 costs, but the favorable prior-year development cushion that supported reported margins for years is structurally gone, and management has mispriced medical-cost trend two cycles running — that track record argues against assuming a clean snap-back. The steady-state margin of 8.0% by Year 5 equals the three-year historical average but is deliberately held well below the FY2021–FY2023 peak, for three reasons: the development cushion cannot be rebuilt quickly, the V28 risk-model phase-in and the Medicare Advantage rate environment compress underwriting economics, and the DOJ investigation may itself constrain the risk-coding intensity that supported peak-era margins. This is the most sensitive operating assumption in the model — small movements in the terminal margin move the fair value more than any input other than the discount rate.
CapEx, D&A, tax, and working capital. CapEx at 0.9% of revenue is consistent with the capital-light history (0.9% in FY2023 declining to 0.8% in FY2025), and D&A is held at 1.0% of revenue. The tax rate of 20.5% in every projection year is the normalized FY2023-anchored rate discussed in Section 4.1.2 — set above the mechanical three-year average because the FY2025 rate is unsustainable. Working capital is the model’s most explicitly conservative choice: the company has historically generated a small cash inflow from float, but the FY2025 inflow is propped up by a new uncommitted short-term receivables-sale facility that can reverse on non-renewal, so the projection credits no float benefit at all — zero working-capital change in every year. This costs the valuation real cash flow relative to history; it is a deliberate haircut, not an oversight.
Terminal growth. The terminal growth rate of 2.5% sits comfortably below the hard ceiling of US long-run nominal GDP growth, as it must. National health expenditure grows faster than GDP, which might argue for a higher rate — but the company’s terminal economics are capped by its dominant payer: CMS represents a record share of revenue and is actively cutting effective rates, so a sub-GDP terminal rate is the appropriate resolution of that tension. The rate is the mid-point of the mature-company range considered, neither the top nor the bottom. The terminal value represents 79% of total enterprise value in the base case — a high proportion, driven by the combination of a sub-par discount rate at this capital structure and a depressed near-term cash-flow base. The honest implication: roughly four-fifths of this valuation rests on what is assumed about the business beyond Year 5, and the terminal-method choice examined in Section 4.2.3 deserves correspondingly heavy scrutiny.
4.2.2 Base Case UFCF Projection
| Base (FY) | Year 1 | Year 2 | Year 3 | Year 4 | Year 5 | |
|---|---|---|---|---|---|---|
| Revenue ($M) | $447,567.0M | $445,329.2M | $458,689.0M | $479,330.0M | $500,899.9M | $520,935.9M |
| EBITDA ($M) | — | $28,946.4M | $32,108.2M | $35,949.8M | $38,819.7M | $41,674.9M |
| EBIT ($M) | — | $24,493.1M | $27,521.3M | $31,156.5M | $33,810.7M | $36,465.5M |
| NOPAT ($M) | — | $19,472.0M | $21,879.5M | $24,769.4M | $26,879.5M | $28,990.1M |
| Unlevered FCF ($M) | — | $20,140.0M | $22,567.5M | $25,488.4M | $27,630.9M | $29,771.5M |
| PV of UFCF ($M) | — | $18,620.0M | $19,289.7M | $20,142.1M | $20,187.3M | $20,109.7M |
4.2.3 Terminal Value & Enterprise Value Bridge
sources | Item | Value | |—|—| | Sum of PV of UFCFs ($M) | $98,348.9M | | Terminal Value — Perpetuity Growth ($M) | $538,855.9M | | Terminal Value — Exit Multiple ($M) | $416,748.7M | | Selected Terminal Value ($M) | $538,855.9M | | PV of Terminal Value ($M) | $363,980.1M | | Terminal Value as % of Enterprise Value | 79% | | Enterprise Value ($M) | $462,329.0M | | Less: Net Debt ($M) | $54,024.0M | | Less: Minority Interest ($M) | $5,980.0M | | Equity Value ($M) | $402,325.0M | | Shares Outstanding (M — current count used in the per-share bridge) | 908 | | DCF Fair Value / Share (Base) | $443.02 | | Upside / Downside vs. Current Price | 10.9% |
The perpetuity-growth method is selected for the headline terminal value, and the reader should understand that this is the most generous methodological choice in this report. The gap between the two terminal-value computations — $538,855.9M under perpetuity growth versus $416,748.7M under the 10.0x exit-multiple cross-check — is substantial, and the perpetuity figure implies an exit multiple on Year 5 EBITDA well above both the 10.0x assumption and the multiples at which the closest payer peers currently trade. Had the exit-multiple terminal value been selected instead, the fair value per share would sit materially below $443.02; the second sensitivity grid in Section 4.3 quantifies exactly how far.
The equity bridge deducts net debt of $54,024.0M — note that, consistent with peer convention, the insurance investment portfolio backing policyholder liabilities is not netted against debt — and minority interest of $5,980.0M, divided over 908 million shares (the current count used in the per-share bridge). The resulting base-case fair value of $443.02 implies 10.9% upside to the current price of $399.47. That conclusion should not be read in isolation: the multiples-based legs of the composite valuation point the opposite direction, pricing the company’s risk flags more harshly than the perpetuity DCF does. Both results are documented honestly here; Section 6 weighs them against each other and resolves the disagreement into a rating and target range.
4.3 WACC Sensitivity
sources The fair value is sensitive to both the WACC and the terminal growth rate — unavoidably so, given that the terminal value carries 79% of enterprise value. The grid below shows the implied fair value per share across combinations of the two inputs under the perpetuity-growth terminal method; the base case is the bolded centre cell.
WACC × Terminal Growth Rate → DCF Fair Value (Base Case)
| WACC \ TGR | 1.5% | 2.0% | 2.5% | 3.0% | 3.5% |
|---|---|---|---|---|---|
| 7.16% | 461.1 | 503.6 | 555.2 | 619.2 | 700.8 |
| 7.66% | 417.0 | 452.0 | 493.7 | 544.3 | 607.2 |
| 8.16% | 379.5 | 408.7 | 443.0 | 484.0 | 533.7 |
| 8.66% | 347.3 | 372.0 | 400.6 | 434.3 | 474.5 |
| 9.16% | 319.4 | 340.4 | 364.6 | 392.7 | 425.8 |
Two readings matter. First, along the base-case WACC row, the fair value falls below the current price ($399.47) only between the two lowest terminal-growth columns — meaning that at our discount rate, the market is pricing a terminal growth assumption modestly below the base case, not above-trend growth. Second, holding the terminal growth rate at the base assumption, the fair value converges to the current price one grid step down in WACC — equivalent to a discount rate carrying a somewhat larger risk premium than the one applied here. Either reading is defensible given the unresolved DOJ tail and the holding-company strain: the market is not being irrational, it is simply charging more for the same risks this report prices through the discretionary premium. The grid also makes the asymmetry plain — outcomes fan out far more widely toward low-WACC, high-growth combinations than they compress toward the punitive corner, which is the signature of a valuation dominated by its terminal value.
Because the terminal-method choice is the report’s most generous assumption, the same grid is shown under the exit-multiple terminal method:
WACC × Exit EV/EBITDA Multiple → DCF Fair Value (Base Case)
| WACC \ Exit EV/EBITDA | 8.0x | 9.0x | 10.0x | 11.0x | 12.0x |
|---|---|---|---|---|---|
| 7.16% | 305.1 | 337.6 | 370.0 | 402.5 | 435.0 |
| 7.66% | 297.6 | 329.3 | 361.0 | 392.7 | 424.4 |
| 8.16% | 290.2 | 321.2 | 352.2 | 383.2 | 414.2 |
| 8.66% | 283.0 | 313.3 | 343.6 | 373.9 | 404.2 |
| 9.16% | 276.1 | 305.7 | 335.3 | 364.9 | 394.5 |
The contrast is the point. At the base-case WACC and the 10.0x exit multiple, the fair value sits below the current price — and no cell in the displayed multiple range reproduces the perpetuity-based fair value of $443.02 at the base-case discount rate. The entire margin of upside in the base-case DCF is therefore attributable to the perpetuity terminal assumption rather than to the explicit five-year forecast. An investor who believes the company should be valued at a market-consistent exit multiple — rather than at the richer multiple the perpetuity mathematics implicitly awards — should weight the lower grid, and with it the more cautious conclusion that Section 6 draws from the multiples-based legs of the composite.
Source: approved valuation assumptions written to the Valuation sheet of the workbook; every figure traceable via lineage.json.
Section 5 — Financial Metrics & Peer Benchmarking
5.1 Peer Selection
sources The peer set comprises the four other members of the large-cap US managed-care complex: CVS Health, Elevance Health, The Cigna Group and Humana. The set is unusually clean on the mechanical dimensions — all four report under US GAAP, all four have December fiscal year-ends, and all figures below are drawn from FY2025 Form 10-K filings, so there are no IFRS translations and no period mismatches anywhere in this section. The comparability problems that do exist are structural, not mechanical, and they matter more here than in most peer groups: no company in the set replicates UnitedHealth’s combination of the largest US health insurer (UnitedHealthcare) with a pharmacy-benefits, health-services and care-delivery arm (Optum). Elevance and Humana are the closest comparators on insurance economics — Humana as a near pure-play Medicare Advantage underwriter, Elevance as a diversified benefits company with a smaller pharmacy arm. CVS and Cigna sit at the other pole: both carry very large, low-margin pharmacy and PBM revenue bases (CVS additionally carries a retail footprint) that mechanically compress every consolidated margin and revenue-multiple comparison. The honest framing is that Elevance and Humana benchmark UnitedHealthcare’s economics, Cigna’s Evernorth benchmarks Optum Rx’s, and consolidated-level comparisons across the whole set are directional. A further, unavoidable defect of the FY2025 vintage specifically: CVS’s GAAP earnings are distorted by a $5.7bn goodwill impairment, which renders its earnings-based metrics artifacts rather than economics — flagged at every point of use below and in 5.7.
| Peer | Ticker | Exchange | Filing Type | Accounting Standard | Fiscal Year End | Comparability Note |
|---|---|---|---|---|---|---|
| CVS Health Corporation | CVS | NYSE | 10-K | US GAAP | December | Retail pharmacy + PBM + insurance mix; FY2025 GAAP earnings depressed by a $5.7bn goodwill impairment — earnings metrics are artifacts |
| Elevance Health, Inc. | ELV | NYSE | 10-K | US GAAP | December | Closest insurance comparator; no printed operating-income subtotal, so EBIT-based metrics are computed and include net investment income |
| The Cigna Group | CI | NYSE | 10-K | US GAAP | December | PBM-heavy (majority of revenue via Evernorth); consolidated margins structurally compressed by pass-through pharmacy revenue |
| Humana Inc. | HUM | NYSE | 10-K | US GAAP | December | Near pure-play Medicare Advantage insurer; cleanest read on MA underwriting economics, no services/PBM diversification |
5.2 Profitability Comparison
sources Comparative: Most Recent Full Fiscal Year
| Metric | UnitedHealth Group | CVS Health Corporation | Elevance Health, Inc. | The Cigna Group | Humana Inc. |
|---|---|---|---|---|---|
| Revenue ($M) | $447,567.0M | $402,067.0M | $199,125.0M | $274,900.0M | $129,664.0M |
| EBITDA Margin | 5.2% | 2.3%ᶜ | 4.9%ᶜ | 4.4%ᶜ | 2.6%ᶜ |
| EBIT Margin | 4.2% | 1.2%ᶜ | 4.1%ᶜ | 3.3%ᶜ | 2.1%ᶜ |
| Net Margin | 2.7% | 0.4%ᶜ | 2.8%ᶜ | 2.2%ᶜ | 0.9%ᶜ |
| FCF Margin | 3.6% | 1.9%ᶜ | 1.6%ᶜ | 3.1%ᶜ | 0.3%ᶜ |
Flag legend: ᵐ = market-sourced (price-dependent, not filing-verified); ᶜ = computed from filing components rather than printed on the statement face. No gross-margin row is shown: none of the five companies — UnitedHealth included — prints a cost-of-sales or gross-profit subtotal, so the metric is undefined for this peer set (see 5.7).
Source: peer figures from CVS Health Corporation (10-K, FY2025), Elevance Health, Inc. (10-K, FY2025), The Cigna Group (10-K, FY2025) and Humana Inc. (10-K, FY2025); UnitedHealth figures from the FY2025 Form 10-K via the verified data pack.
Historical: UnitedHealth Group Own 5-Year Progression
| Metric | FY2021 | FY2022 | FY2023 | FY2024 | FY2025 |
|---|---|---|---|---|---|
| EBITDA Margin | 9.4% | 9.8% | 9.8% | 9.1% | 5.2% |
| EBIT Margin | 8.3% | 8.8% | 8.7% | 8.1% | 4.2% |
| Net Margin | 6.0% | 6.2% | 6.0% | 3.6% | 2.7% |
| FCF Margin | 6.9% | 7.2% | 6.9% | 5.2% | 3.6% |
The cross-sectional table needs to be read in two layers — what is genuine economics and what is accounting artifact — and FY2025 is a vintage in which the artifacts are unusually large. Start with the artifacts. CVS’s margins are not an operating comparison at all this year: its GAAP operating result absorbs a $5.7bn goodwill impairment in its care-delivery business plus roughly $1.2bn of legacy litigation charges, and we deliberately present as-reported figures with no normalization. Its EBIT, EBITDA and net margins should be read as impairment-depressed, not as evidence that the CVS model earns a fraction of UnitedHealth’s margin. Second, the structural mix effect: CVS and Cigna run the majority of their revenue through pharmacy and PBM operations, where pass-through drug revenue inflates the denominator of every margin ratio — their lower consolidated margins reflect what kind of revenue they book, not necessarily how well they operate it. Third, Elevance’s EBIT-based figures carry the ᶜ flag with a specific asymmetry: Elevance prints no operating-income subtotal, so its EBIT is constructed from pre-tax income plus interest expense and consequently includes net investment income that Cigna’s printed operating income excludes — Elevance’s operating margin is modestly flattered by construction relative to Cigna’s in this table.
With the artifacts stripped away, the genuine economics still favor UnitedHealth, but less emphatically than the table suggests at first glance. Against the cleanest like-for-like comparators, UnitedHealth’s FY2025 EBITDA margin of 5.2% and EBIT margin of 4.2% stand at the top of the set — above Elevance despite Elevance’s construction benefit, and well above Humana, whose near pure-play Medicare Advantage book makes it the most exposed in the set to the same MA underwriting deterioration that drove UnitedHealth’s own compression. That is the structurally important observation: FY2025 is a sector-wide MA underwriting trough, and UnitedHealth leads the peer set at the trough. The historical table sharpens the point — the FY2025 margins are roughly half the level UnitedHealth sustained across FY2021–FY2024, and as Section 3 details, the FY2025 print itself nets a kitchen-sink restructuring charge against a non-cash deconsolidation gain, with the Part D redesign additionally grossing up the revenue denominator. Two caveats keep the comparison honest in the other direction: UnitedHealth’s own FY2025 GAAP earnings are no cleaner than its peers’ — the comparison is as-reported on both sides — and its margin leadership at the trough partly reflects the Optum services mix, which is exactly the diversification Elevance and Humana lack. Our judgment: the cross-sectional margin advantage is structural (mix, scale, vertical integration), the FY2025 level is cyclical, and the cross-sectional gap understates the normalized advantage because UnitedHealth is being compared at its own decade-trough margins.
5.3 Returns Comparison
sources Comparative: Most Recent Full Fiscal Year
| Metric | UnitedHealth Group | CVS Health Corporation | Elevance Health, Inc. | The Cigna Group | Humana Inc. |
|---|---|---|---|---|---|
| ROIC | 11.3% | 2.7%ᶜ | 9.0%ᶜ | 10.1%ᶜ | 7.5%ᶜ |
| ROE | 12.9% | 2.4%ᶜ | 13.3%ᶜ | 14.4%ᶜ | 7.0%ᶜ |
| ROA | 4.0% | 0.7%ᶜ | 4.8%ᶜ | 3.8%ᶜ | 2.5%ᶜ |
| Asset Turnover | 1.45x | 1.59xᶜ | 1.67xᶜ | 1.75xᶜ | 2.72xᶜ |
Historical: UnitedHealth Group Own 5-Year Progression
| Metric | FY2021 | FY2022 | FY2023 | FY2024 | FY2025 |
|---|---|---|---|---|---|
| ROIC | 19.8% | 21.4% | 21.6% | 18.2% | 11.3% |
| ROE | 24.1% | 26.9% | 26.9% | 15.9% | 12.9% |
| ROA | 8.1% | 8.8% | 8.6% | 5.0% | 4.0% |
Returns are where the franchise quality argument either survives the FY2025 shock or it does not, and the answer in this table is: it survives, narrowly. UnitedHealth’s ROIC of 11.3% leads the peer set even in its worst year of the coverage window — ahead of Cigna, Elevance and Humana on a like-for-like GAAP basis, with CVS’s figure an impairment artifact rather than a meaningful comparison. Critically, that trough ROIC remains above the 8.16% cost of capital derived in Section 4, so the company is still creating value on its invested base at the bottom of the cycle — but the historical row shows what has been lost: a spread that was commanding in FY2022–FY2023, when ROIC ran near twice its current level, has compressed to ordinary. As Section 3’s decomposition establishes, the decline is a NOPAT collapse landing on an invested-capital base that never stopped growing; the recovery case is a numerator repair story, not a capital-efficiency one.
ROE requires more care, because it is the one returns line where UnitedHealth does not lead: Cigna and Elevance both post higher FY2025 ROE. Three things temper that reading. First, UnitedHealth’s FY2025 earnings carry the net restructuring and reserve charges detailed in Section 3, so the numerator is at its most depressed. Second, UnitedHealth’s equity base is the largest and most goodwill-laden in the set — the denominator carries two decades of acquisitions. Third, a definitional point disclosed in 5.7: UnitedHealth carries redeemable noncontrolling interests in a mezzanine caption outside both liabilities and equity, its parent-only equity is sourced from the filing’s Schedule I, and its invested-capital construction therefore differs slightly from the peers’; differences of a percentage point or two in ROIC/ROE across the set can be definitional rather than operational. On asset turnover, Humana’s figure — the highest in the set by a wide margin — is a business-model fact, not an efficiency achievement: a pure-play insurer with no retail, services or care-delivery asset base turns its premium float faster by construction. UnitedHealth’s turnover is the stable backbone of its DuPont stack, as Section 3 shows, and it actually improved in FY2025 as the Part D gross-up pushed revenue ahead of assets.
5.4 Leverage & Liquidity Comparison
sources Comparative: Most Recent Full Fiscal Year
| Metric | UnitedHealth Group | CVS Health Corporation | Elevance Health, Inc. | The Cigna Group | Humana Inc. |
|---|---|---|---|---|---|
| Net Debt / EBITDA | 2.3x | 6.1xᶜ | 2.3xᶜ | 2.0xᶜ | 2.4xᶜ |
| Total Debt / Equity | 0.8x | 0.9xᶜ | 0.7xᶜ | 0.8xᶜ | 0.7xᶜ |
| Interest Coverage | 4.7x | 1.5xᶜ | 5.8xᶜ | 6.5xᶜ | 4.3xᶜ |
| Current Ratio | 0.8x | 0.8xᶜ | 1.5xᶜ | 0.8xᶜ | 2.0xᶜ |
| FCF Margin | 3.6% | 1.9%ᶜ | 1.6%ᶜ | 3.1%ᶜ | 0.3%ᶜ |
The net debt convention must be stated before the table is interpreted, because it shapes every figure in the first row: total debt is short-term plus current-portion plus long-term borrowings, excluding operating lease liabilities; only cash and cash equivalents are netted, with no credit for investment portfolios. Applied uniformly, the convention is fair — but it understates the difference in balance-sheet character across the set in two directions. CVS carries large retail-store operating-lease liabilities that the others do not have at scale; including them would push CVS’s leverage higher still. In the opposite direction, the underwriting businesses — Elevance, Humana, and UnitedHealth itself — hold substantial investment portfolios backing policyholder liabilities that receive no netting credit: Humana’s headline leverage of 2.4xᶜ coexists with an investment portfolio of roughly $15.7bn per its filing, against which it would screen as net cash if portfolios were netted. CVS’s outlier multiple compounds two distortions at once — genuinely higher borrowings and an EBITDA denominator depressed by the goodwill impairment — and its coverage ratio of 1.5xᶜ is likewise an artifact of the impaired earnings base, not a run-rate solvency reading.
Read on a consistent basis, UnitedHealth’s net debt/EBITDA of 2.3x sits squarely within the insurer cluster alongside Elevance, Cigna and Humana — unremarkable cross-sectionally. The problem is the path, not the position: as Section 3 documents, this ratio has more than doubled across the window, the FY2025 jump is denominator-driven by the earnings collapse, and it arrives alongside negative rating-agency outlooks, a year in which regulated subsidiaries absorbed rather than up-streamed capital, and a buyback halt in the closing months of the year. A leverage level that is ordinary for the sector is carrying an extraordinary set of constraints for this company specifically. Interest coverage of 4.7x remains the second-strongest in the set on the FY2025 GAAP comparison and is comfortable in absolute terms, but it embeds the charge-laden trough EBIT. The current-ratio row should not be read as a liquidity ranking: sub-parity ratios at UnitedHealth, CVS and Cigna are the premiums-before-claims float structure of the business model, while Humana’s and Elevance’s higher ratios reflect the composition of their investment portfolios within current assets, not superior liquidity discipline. On FCF margin, UnitedHealth’s 3.6% leads the set — though Section 3’s caveat travels with it: the FY2025 operating-cash-flow base includes a one-time benefit from the new receivables-sale facility.
5.5 Valuation Multiples Comparison
sources Comparative: Current Price
| Metric | UnitedHealth Group | CVS Health Corporation | Elevance Health, Inc. | The Cigna Group | Humana Inc. |
|---|---|---|---|---|---|
| EV/EBITDA | 18.2x | 19.2xᵐ | 11.7xᵐ | 8.4xᵐ | 14.8xᵐ |
| P/E | 30.2x | 69.0xᵐ | 16.3xᵐ | 13.1xᵐ | 35.6xᵐ |
| FCF Yield | 4.4% | 6.4%ᵐ | 3.5%ᵐ | 11.0%ᵐ | 0.9%ᵐ |
All peer valuation multiples are market-sourced (ᵐ): share prices as of early June 2026 from public quote sources combined with FY2025 filing financials — they are not filing-verified and move with prices. UnitedHealth’s market capitalization uses the FY2025 diluted weighted-average share count as a proxy for the current count (see 5.7).
Historical: UnitedHealth Group EV/EBITDA — current enterprise value measured against each fiscal year’s EBITDA
| Metric | FY2021 | FY2022 | FY2023 | FY2024 | FY2025 |
|---|---|---|---|---|---|
| EV / EBITDA | 15.1x | 13.1x | 11.5x | 11.8x | 18.2x |
| P/E | 22.1x | 18.9x | 16.7x | 25.8x | 30.2x |
Both rows hold today’s enterprise value and market capitalization fixed and divide by each historical year’s EBITDA and earnings — they show what the current price pays for each vintage of earnings power, not where the stock traded in those years.
Two of the five P/E figures in the comparative table should be discarded before any conclusion is drawn. CVS’s multiple of 69.0xᵐ is an impairment artifact — the denominator absorbs the $5.7bn goodwill write-off and litigation charges — and presenting it as an earnings-power comparison would be a defect; on its pre-impairment earnings base CVS screens far cheaper than this print. Humana’s elevated multiple is the mirror case of UnitedHealth’s: a depressed MA-trough earnings base, with the market paying for a recovery that has not yet printed. That leaves Elevance and Cigna as the clean reference points, and against them the comparison is stark: UnitedHealth trades at roughly twice their earnings multiples and a substantial EV/EBITDA premium, with the lowest FCF yield in the set after Humana — Cigna’s double-digit FCF yield is the value outlier among the clean names.
Is the premium justified? The historical rows reframe the question. The current price paid against FY2023 or FY2024 EBITDA — earnings bases the franchise actually delivered as recently as two years ago — implies a multiple in line with where Elevance trades today on its own current earnings. In other words, the headline 18.2x is almost entirely a denominator event: the market is not paying a champion’s premium for trough earnings so much as refusing to capitalize the trough as permanent. The investment translation is direct and consistent with Section 4’s scenario framing: at the current price, the market multiple already embeds a substantial margin recovery. If the FY2026 repricing cycle restores margins toward the historical band, the effective multiple on recovered earnings is unremarkable against the clean peers and the premium resolves itself; if the trough proves structural, the stock is the most expensive name in the set on the only earnings it can actually generate. The P/B de-rating across the historical row — today’s price against a book value that has grown every year — shows the market has already withdrawn a meaningful portion of the historical premium; what remains is specifically the recovery bet.
5.6 Efficiency Comparison
sources | Metric | UnitedHealth Group | CVS Health Corporation | Elevance Health, Inc. | The Cigna Group | |—|—|—|—|—| | Days Sales Outstanding | 19 days | 36 daysᶜ | 40 daysᶜ | 38 daysᶜ | | Days Inventory Outstanding | — | 32 daysᶜ | — | 12 daysᶜ | | Days Payables Outstanding | — | 29 daysᶜ | — | 18 daysᶜ | | Cash Conversion Cycle | — | 39 daysᶜ | — | 33 daysᶜ | | CapEx / Revenue | 0.8% | 0.7%ᶜ | 0.6%ᶜ | 0.4%ᶜ |
The structure of this table is itself the finding: a full cash-conversion-cycle comparison does not exist for this peer set. UnitedHealth and Elevance carry no inventory line — insurers hold float, not stock — so DIO, DPO and the cash conversion cycle are undefined for them, and the em dashes above are definitional, not missing data. The CVS and Cigna figures that do appear are product-segment-only constructs: computed against their pharmacy cost-of-products lines, with payables definitions that exclude separate pharmacy-claims payable captions, they describe the drug-distribution side of those businesses and nothing else. They are shown for completeness and should not be ranked against anything UnitedHealth does.
That leaves two rows with genuine cross-sectional content. On DSO — the one working-capital metric computable on a consistent basis across the set — UnitedHealth collects roughly twice as fast as CVS, Elevance and Cigna, a real advantage rooted in the premium-led revenue mix and the scale of its government business, where CMS remits on a predictable cycle. One caveat from Section 3 carries directly into this comparison: part of the FY2025 DSO improvement reflects the new receivables-sale facility, under which sold receivables are derecognized — the cross-sectional gap is genuine, but the most recent year of UnitedHealth’s own improvement is partly monetization rather than collection discipline. On capital intensity, the row reads as a sector signature rather than a differentiator: every company in the set spends well under one percent of revenue on CapEx. As Section 3 establishes for UnitedHealth — and it holds across the peer group — growth capital in managed care flows through acquisitions, not the CapEx line, so reinvestment discipline must be judged on M&A returns (Section 5.3’s ROIC comparison), not on this row.
5.7 Comparability Caveats
sources Seven material comparability issues affect the tables above. None is cosmetic; each changes how at least one comparison should be read.
1. CVS’s FY2025 earnings are impairment artifacts (affects 5.2, 5.3, 5.4, 5.5). CVS’s GAAP operating income absorbs a $5.7bn goodwill impairment in its Health Care Delivery reporting unit plus approximately $1.2bn of legacy litigation charges. By policy, as-reported figures are used with no normalization, so every CVS earnings-based metric in this section — EBIT and EBITDA margins, net margin, all three return measures, interest coverage, net debt/EBITDA and the P/E — is depressed. Excluding the impairment alone, CVS’s operating earnings would be a multiple of the reported figure, and its leverage and coverage picture would look materially different. No CVS earnings-based figure in this section should be read as run-rate economics, and its P/E must never be cited as an earnings-power comparison.
2. Business mix makes consolidated margin comparisons structural, not like-for-like (affects 5.2, 5.5). CVS (majority products/pharmacy revenue) and Cigna (majority pharmacy revenue via Evernorth) carry large low-margin, pass-through PBM/pharmacy revenue bases that mechanically compress consolidated margins and revenue multiples. Humana is a near pure-play Medicare Advantage insurer; Elevance is predominantly health benefits with a smaller pharmacy arm; UnitedHealth combines both models. Margin gaps across the set reflect revenue-mix denominators as much as operating performance: CVS’s and Cigna’s lower margins are not per se underperformance, and Humana’s compression is concentrated MA-cycle exposure, not inefficiency.
3. Gross margin and the cash conversion cycle are undefined for this peer set (affects 5.2, 5.6). None of the five companies prints a COGS or gross-profit subtotal — health insurers present medical costs, pharmacy/product costs and operating costs as parallel lines — so the gross-margin row was omitted by design, not for lack of data. UnitedHealth, Elevance and Humana carry no inventory, so DIO/DPO/CCC are undefined for them; the CVS and Cigna figures shown are product-segment constructs with payables definitions that make DPO ambiguous. Working-capital efficiency comparisons in this section are restricted to DSO, the only metric computable consistently across all five companies.
4. Elevance’s EBIT-based metrics are constructed, with an investment-income asymmetry (affects 5.2, 5.3, 5.4). Elevance prints no operating-income subtotal; its EBIT was computed as pre-tax income plus interest expense. That construction includes net investment income and net losses on financial instruments — items Cigna’s printed operating income excludes — so Elevance’s operating margin and EBIT-derived returns are modestly flattered relative to Cigna’s convention. Rankings between Elevance and Cigna on operating-margin lines sit inside this definitional noise.
5. The net debt convention masks balance-sheet character differences (affects 5.4). Net debt is defined throughout as borrowings only, with only cash and cash equivalents netted — operating leases and investment portfolios are excluded. The convention is applied uniformly but cuts both ways: CVS’s substantial retail operating-lease liabilities would raise its leverage further if included, while the underwriters’ investment portfolios receive no credit — Humana’s headline net debt/EBITDA coexists with a roughly $15.7bn investment portfolio, against which it would screen as net cash. Leverage comparisons between the retail/PBM and underwriting business models should be treated as directional.
6. All valuation multiples are market-sourced, with a UNH share-count proxy (affects 5.5). Every multiple in 5.5 combines share prices from public quote sources as of early June 2026 with FY2025 filing financials; none is filing-verified, and all move with prices. UnitedHealth’s market capitalization additionally uses the FY2025 diluted weighted-average share count as a proxy for the current share count, which is not in the verified data pack, and CVS quote sources showed market-cap variance at the date of sourcing. The multiples are fit for relative ranking, not for precision claims.
7. UnitedHealth’s own equity-based metrics carry a definitional wrinkle (affects 5.3). UnitedHealth carries redeemable noncontrolling interests in a mezzanine caption outside both liabilities and equity, its balance sheet face does not subtotal parent-only equity (the attributable figure is sourced from the filing’s Schedule I), and its invested-capital construction captures total equity including NCI while peers’ uses total debt plus total equity — no peer carries a material mezzanine NCI balance at year-end. Differences of roughly one to two percentage points in UnitedHealth’s ROIC and ROE versus alternative NCI treatments are definitional, not operational, and should not be over-read in close rankings such as the ROE comparison in 5.3.
Finally, a symmetry point that frames the whole section: UnitedHealth’s own FY2025 figures are as-reported GAAP and carry their own net charges — the restructuring bundle, cyberattack reserves and divestiture effects detailed in Section 3 — so the comparison is distorted GAAP against distorted GAAP, not a clean company against messy peers. Both sides of every table carry their year’s scars; the caveats above identify whose scars sit where.
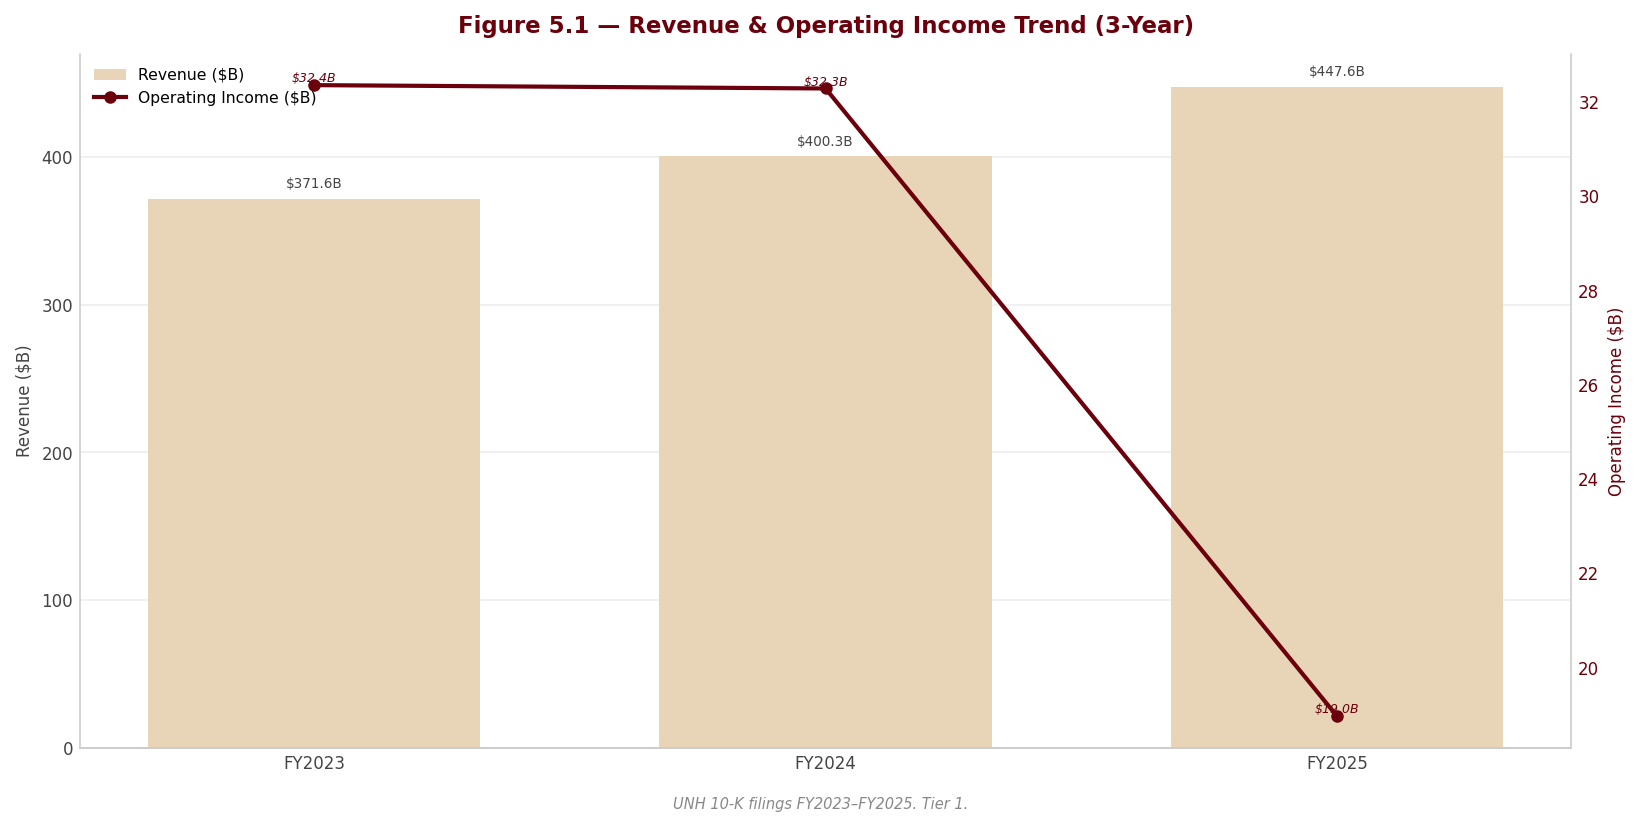
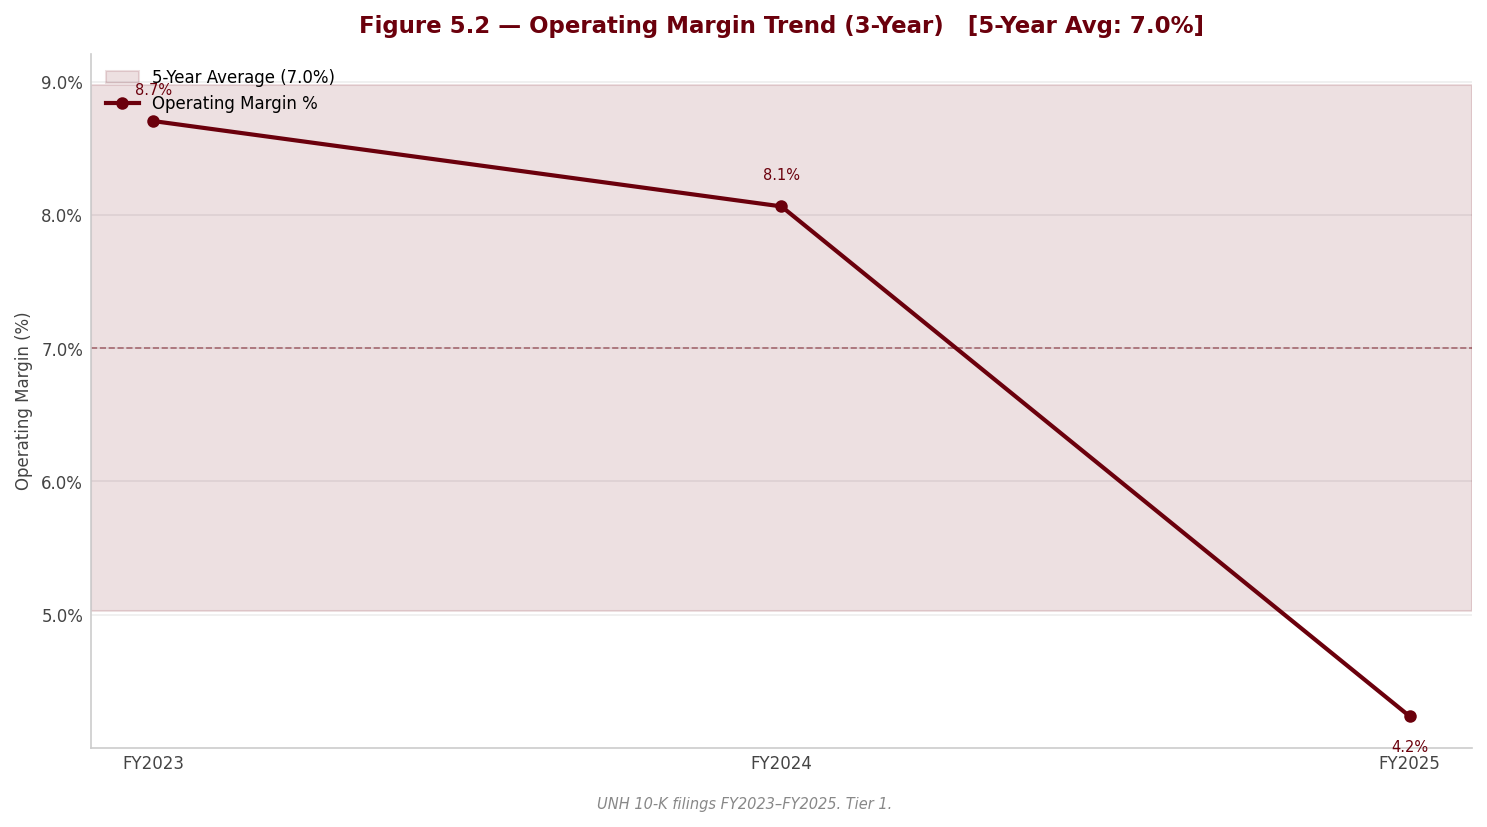
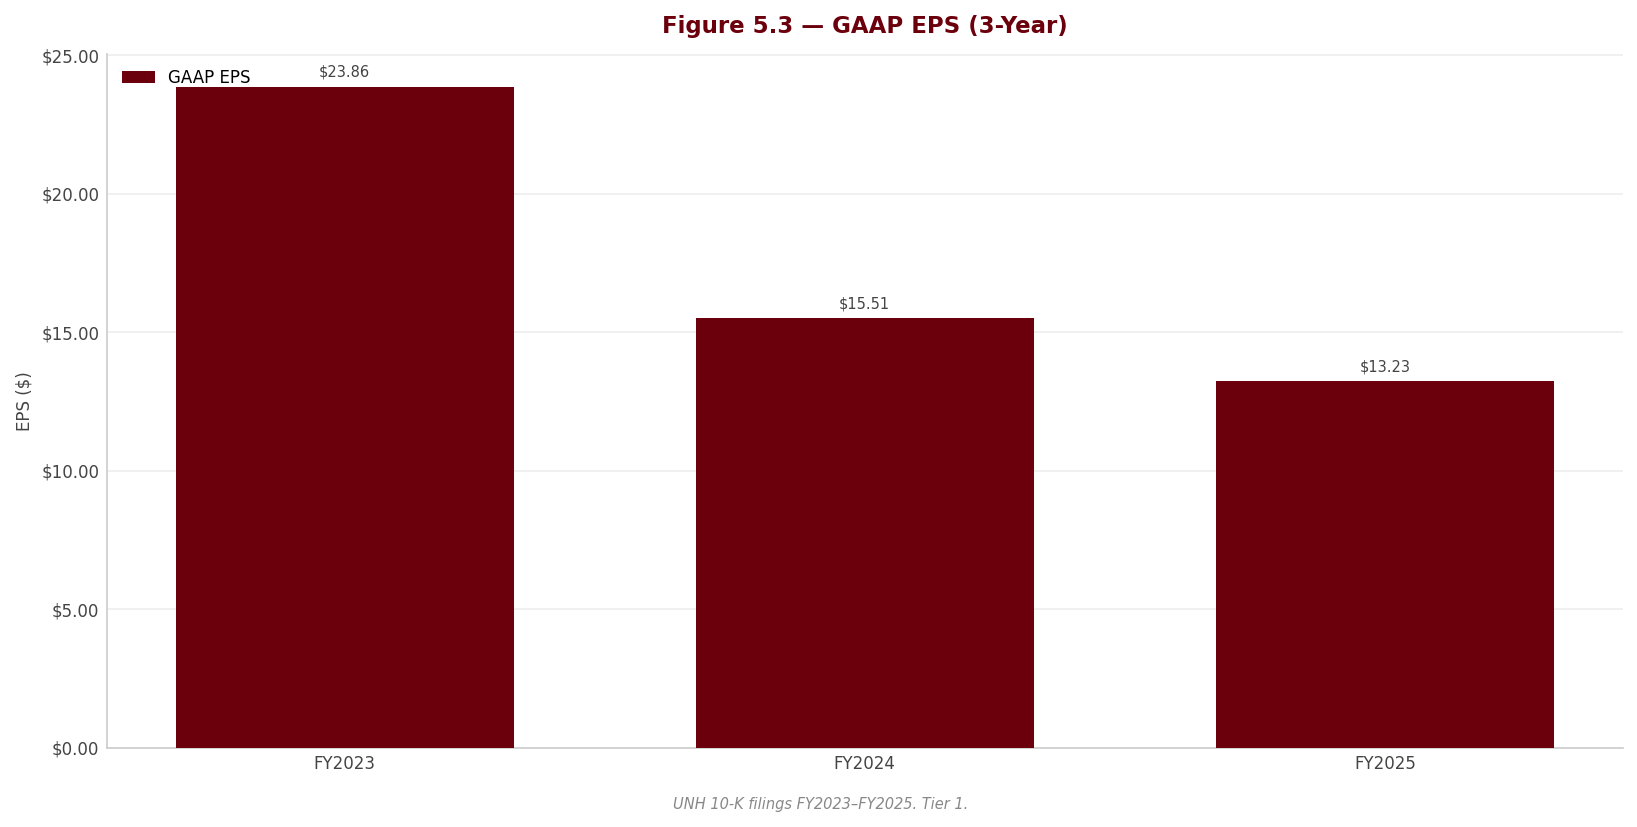
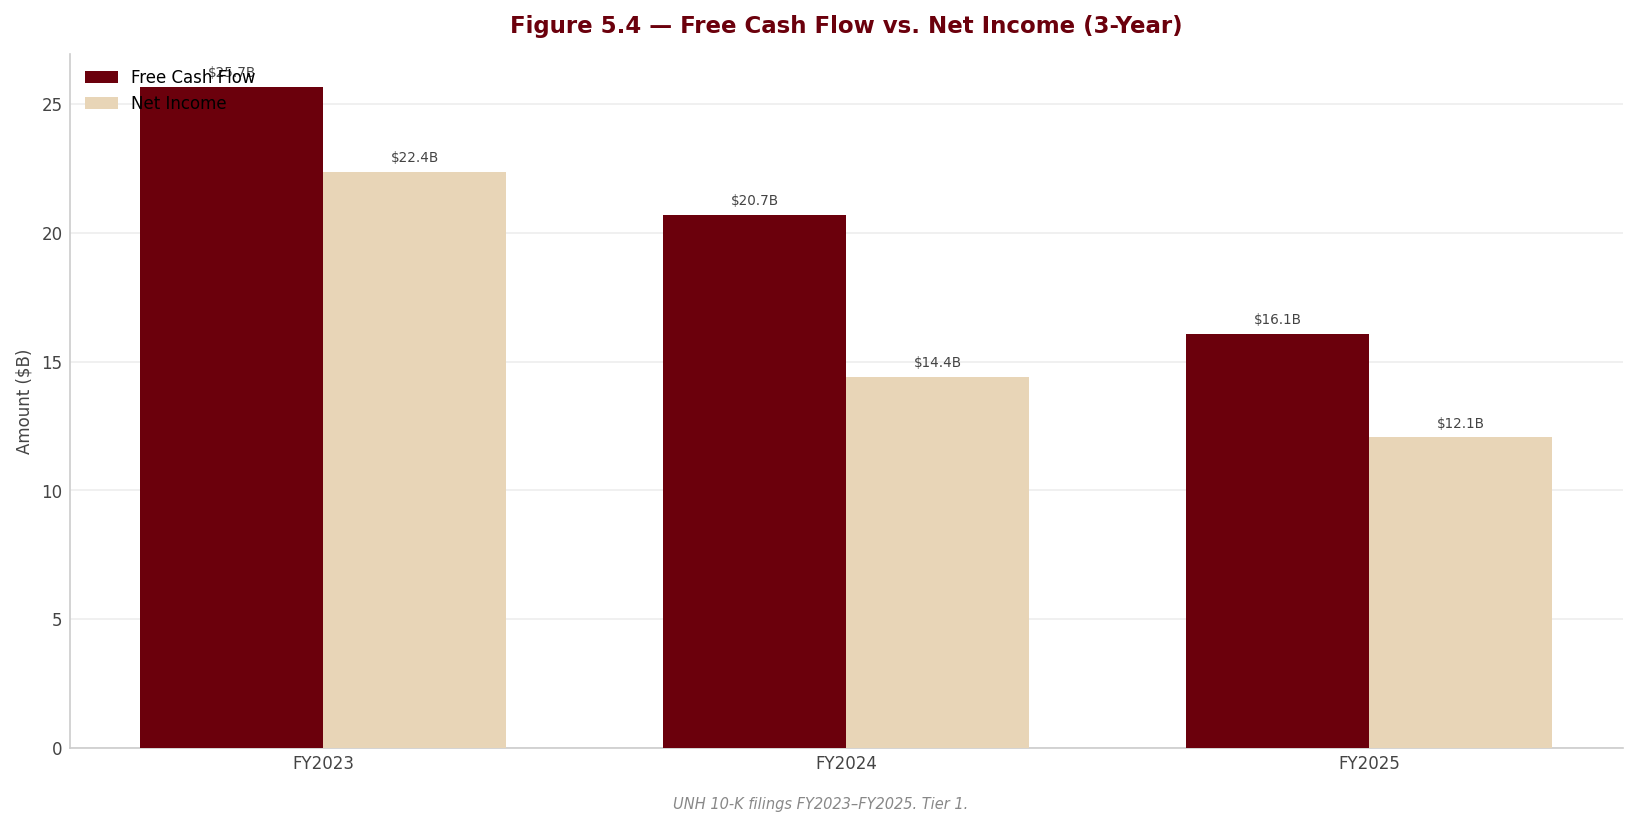
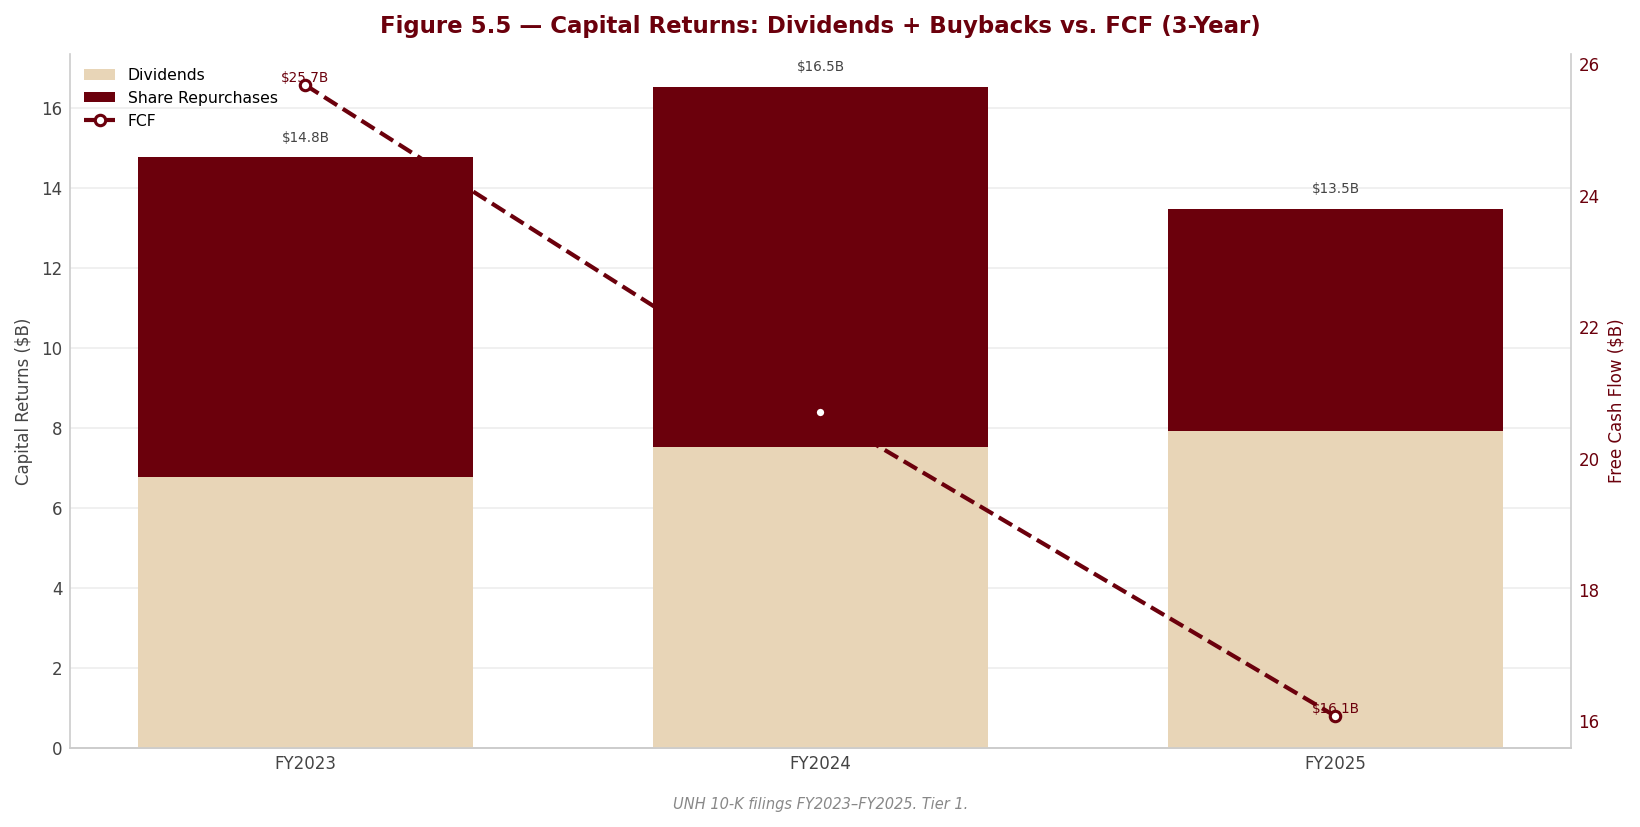
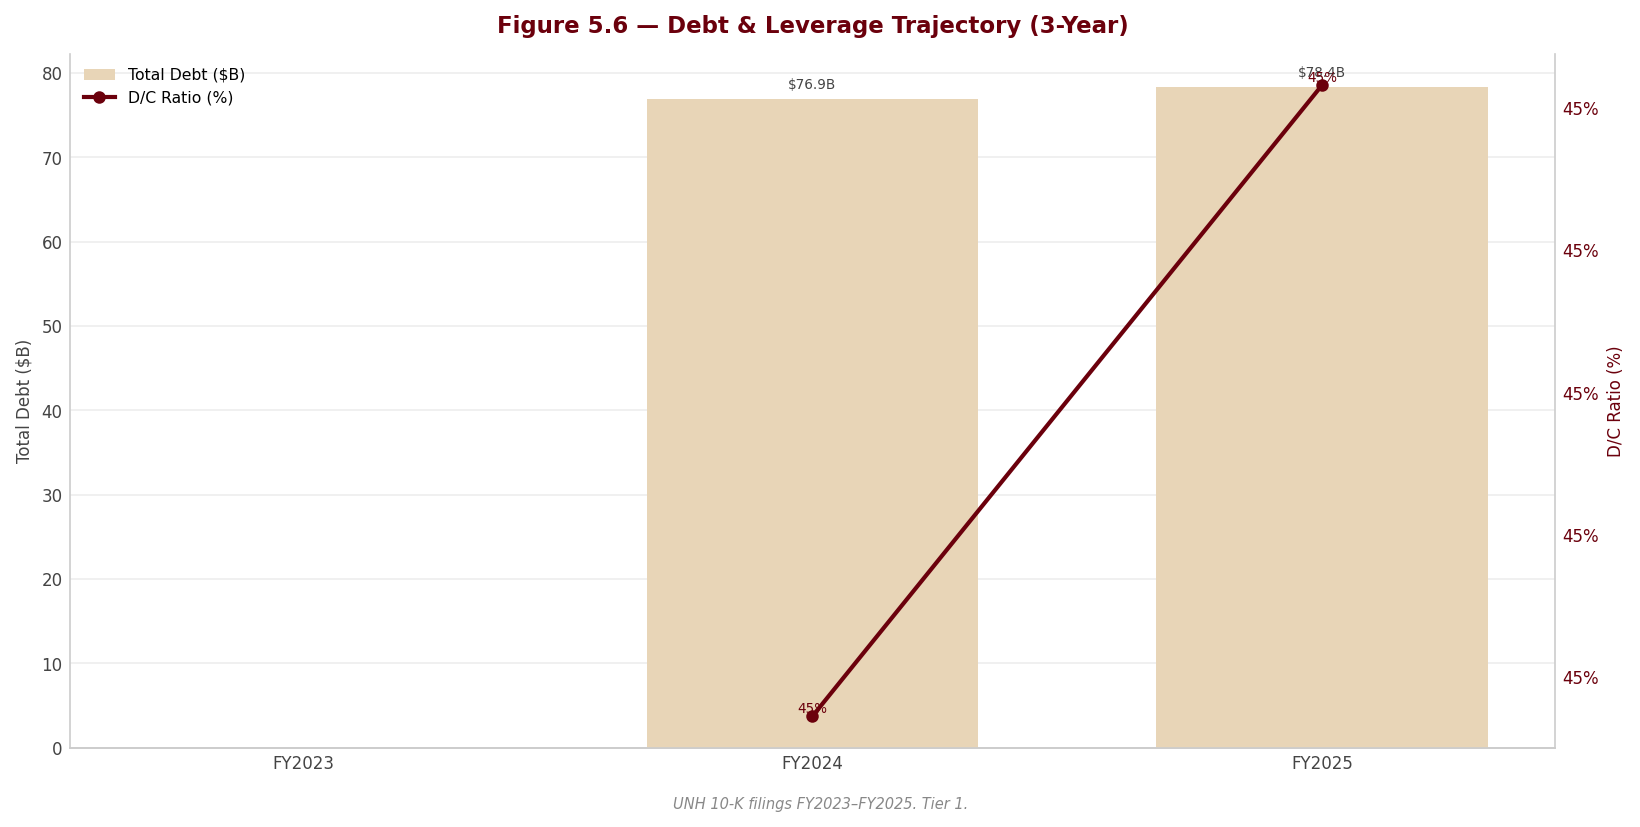
Section 6 — Valuation & Price Target
sources
6.1 Valuation Framework
sources The price target is built from four independent valuation methods, each carried through three scenarios (Bear, Base, Bull) and combined at an equal 25% weight within each scenario. The equal weighting is deliberate: this is a company where the methods genuinely disagree, and suppressing that disagreement behind a single preferred multiple would misrepresent the central finding of this report. The composite is not a compromise designed to look balanced — it is an honest average of four lenses that, by construction, see the same business differently.
| Method | Weight | Rationale |
|---|---|---|
| DCF (3 scenarios) | 25% | Intrinsic value from five-year unlevered cash flows plus terminal value; captures the long-term compounding the franchise is still capable of, but is the most sensitive to the discount rate and to the perpetuity terminal assumption that drives most of its value. |
| P/E Relative | 25% | Earnings-based and market-oriented; anchors the company to where managed-care peers trade on forward earnings — but FY2025 GAAP earnings are depressed by non-run-rate charges, so this leg understates normalized earnings power. |
| EV/EBITDA Relative | 25% | Capital-structure-neutral and the cleanest cross-sectional benchmark for the sector; strips the financing decisions that distort net income, though FY2025 EBITDA is itself contaminated by the fourth-quarter charge and the deconsolidation gain. |
| FCF Yield | 25% | Tests valuation against cash generation rather than accrual earnings; the appropriate discipline for a year in which reported operating cash flow was supported by a new, uncommitted receivables-sale facility that may not recur. |
For UnitedHealth, no single leg deserves blind trust this year. The DCF is the most theoretically complete but is dominated by its terminal value and by a discount rate carrying a discretionary risk overlay; the multiples are cleaner conceptually but are anchored to FY2025 figures that the forensic review shows are not a clean run-rate. Equal weighting is the honest response to that standoff.
6.2 DCF Results Summary
sources | Scenario | Fair Value / Share | Upside / Downside vs. Current Price ($399.47) | |—|—|—| | Bear | $306.31 | Below the current price — the discounted-cash-flow downside case does not clear the market | | Base | $443.02 | 10.9% | | Bull | $620.40 | Well above the current price |
The DCF base case of $443.02 sits above the current price of $399.47, implying 10.9% upside. That is the single most important fact in this section, and it points in the opposite direction from the composite. The bear case of $306.31 falls below the current price, so the market is not pricing the DCF bear scenario — the share price implies something closer to a discounted base case than a downside case.
Read carefully, the DCF does not say UnitedHealth is cheap; it says the DCF is sensitive to two assumptions that are doing almost all of the work. First, roughly 79% of enterprise value is terminal value, so the perpetuity growth rate of 2.5% and the discount rate matter far more than the explicit five-year forecast. Second, the discount rate embeds a discretionary company-specific risk premium layered on top of CAPM to capture the DOJ tail, the holding-company liquidity strain, and the cluster of earnings-quality findings — risks no market-derived input would otherwise price. To justify the current market price on the DCF alone, one need only assume a discount rate carrying a modestly larger risk premium than the base case applies, at the same terminal growth rate. In other words, the market is not mispricing the company against the DCF — it is simply charging a little more for the same risks the discretionary premium already prices, and the multiples-based legs charge for more aggressively still.
6.3 Multiples-Based Valuation
sources Each relative method applies a target multiple to the company’s metric to derive a fair value per share. The implied fair values below are the base-case outputs that flow into the composite in 6.4 (the three relative methods plus the DCF).
| Method | Current Multiple | Target Multiple | Implied Fair Value (Base) |
|---|---|---|---|
| P/E | 30.2x | 24.0x | $317.52 |
| EV/EBITDA | 18.2x | 16.0x | $344.88 |
| FCF Yield | 4.4% | 5.0% | $354.02 |
UnitedHealth currently trades at 30.2x trailing earnings and 18.2x EBITDA — both elevated only because the FY2025 denominators are depressed by the kitchen-sink charges discussed in Sections 2 and 3, not because the market is paying a growth premium. The target multiples (P/E 24.0x, EV/EBITDA 16.0x) are set against the managed-care peer set in Section 5 — above the distressed names (CVS, whose GAAP multiples are impairment artifacts) but below UnitedHealth’s own pre-crisis range, reflecting a franchise that is impaired but not broken. On normalized forward earnings power the implied fair values cluster well below the DCF’s $443.02: the relative methods price the risk flags that the DCF’s terminal value does not. That divergence is the heart of the valuation and is resolved in the composite below.
6.4 Composite Fair Value
sources | Method | Bear | Base | Bull | |—|—|—|—| | DCF | $306.31 | $443.02 | $620.40 | | P/E Relative | $269.89 | $317.52 | $365.15 | | EV/EBITDA Relative | $283.23 | $344.88 | $406.52 | | FCF Yield | $307.84 | $354.02 | $416.49 | | Composite Fair Value | $291.82 | $364.86 | $452.14 |
Each scenario’s composite is the equal-weighted average of the four methods. The Base case is the central reference; Bear and Bull bound the range.
Composite Fair Value (Base): $364.86
Source: Valuation sheet of the workbook (approved assumptions); peer anchors per Section 5; every figure traceable via lineage.json.
Current Price: $399.47 | Implied Upside / Downside: -8.7%
The composite base case of $364.86 sits below the current price of $399.47, implying -8.7% downside — the mirror image of the DCF’s standalone signal. This is the thesis in one number: the intrinsic-value lens says modest upside, the relative-and-cash lenses say modest downside, and the equal-weighted blend lands the fair value just under the market. The disagreement is not noise to be averaged away and forgotten; it is the structure of the call.
The dispersion between the Bear composite of $291.82 and the Bull composite of $452.14 is wide, and the single largest driver of that spread is the DCF leg, whose own Bear-to-Bull range ($306.31 to $620.40) dwarfs the other three methods. That width is itself a finding: it tells the reader that conviction here is genuinely limited, and that the gap between a credible bull and a credible bear is large because the two unresolved questions — whether the 2026 margin recovery is real, and whether the DOJ tail stays unpriced — admit very different answers. A narrow composite would imply a confidence the underlying facts do not support. The honest range is the Bear-to-Bull composite span, with the Base as the central reference and the price target.
6.5 Sensitivity Analysis
The sensitivity of the base-case DCF fair value to the WACC and the terminal growth rate is shown below. The current share price of $399.47 is implied at approximately the 2.5% terminal growth rate combined with a WACC one grid-step above the base case — that is, a discount rate carrying a somewhat larger risk premium than the one applied in the base DCF. The implied assumptions are therefore not aggressive; they are mildly more conservative than the report’s own base case, which is the natural consequence of the discretionary company-specific risk premium being a judgment rather than a market-observed input. This is the pivot of the entire valuation: removing the discretionary premium would shift the base case toward the lower-WACC rows, where every cell at or above the base terminal growth rate prints a fair value materially above the current price — flipping the DCF decisively bullish. A reader who rejects the premium should re-derive the conclusion before relying on it; a reader who accepts it is left with the two-sided call this section reaches.
WACC × Terminal Growth Rate — DCF Fair Value / Share
[Sensitivity table from Valuation sheet — | WACC \ TGR | 1.5% | 2.0% | 2.5% | 3.0% | 3.5% | |—|—|—|—|—|—| | 7.16% | 461.1 | 503.6 | 555.2 | 619.2 | 700.8 | | 7.66% | 417.0 | 452.0 | 493.7 | 544.3 | 607.2 | | 8.16% | 379.5 | 408.7 | 443.0 | 484.0 | 533.7 | | 8.66% | 347.3 | 372.0 | 400.6 | 434.3 | 474.5 | | 9.16% | 319.4 | 340.4 | 364.6 | 392.7 | 425.8 |]
6.6 Investment Recommendation
sources Rating: HOLD | 12-Month Price Target: $364.86 | Conviction: Medium
This is a genuinely two-sided call, and the rating reflects that rather than papering over it. The central thesis: at $399.47, UnitedHealth is priced almost exactly at fair value, with the intrinsic DCF ($443.02) pointing modestly higher and the relative-and-cash composite ($364.86) pointing modestly lower — and the disagreement between the two methods is the position. The target of $364.86 is the Base composite, presented within an honest Bear-to-Base-to-Bull range of $291.82 to $452.14. There is not enough asymmetry in either direction to justify a BUY or a SELL, and pretending otherwise would be the error.
What would have to be true for the bull case: the 2026 margin recovery has to be real, not manufactured. And here the forensic record demands caution. The fourth-quarter 2025 “restructuring and other actions” bundle was a kitchen-sink charge under a new CEO and CFO that swept in items that are not restructuring in any conventional sense — including the establishment of a loss-contract reserve that pulls anticipated 2026 value-based-care losses into 2025. That reserve will release against 2026 costs as incurred, so part of any 2026 “recovery” is pre-booked rather than earned. The bull case requires trusting that the underlying repricing and benefit-design actions, net of those reserve releases and net of the non-recurrence of the charge, genuinely restore margin.
What would have to be true for the bear case: the margin recovery disappoints, and the regulatory tail goes live. The bear case rests on two pillars that the filing itself substantiates. First, the publicly confirmed Department of Justice criminal and civil investigations into Medicare billing practices are disclosed only through generic boilerplate — never specifically named, carried at zero accrual, and accompanied by no estimable loss range — against the company’s single largest revenue source. Any settlement, penalty, corporate integrity agreement, or program exclusion would be entirely incremental to reported results, and the quiet addition of “shareholders” to the list of litigants signals a second front opening. Second, management itself admitted that 2025 pricing assumptions ran well short of incurred medical cost trend — a trend it expects to persist and has now mis-forecast across two cycles — so the recovery is a bet on the same team’s repricing landing where the last two did not.
Five further forensic findings reinforce the caution and belong among the risk pillars of this recommendation: the non-cash deconsolidation gain booked inside operating costs that flatters Optum Rx; the new uncommitted, 364-day receivables-sale facility propping up a down year’s operating cash flow; the holding-company liquidity reversal, with regulated subsidiaries absorbing capital instead of upstreaming it and the parent leaning on intercompany funding while all three agencies hold Negative outlooks; the near-evaporation of favorable prior-year reserve development that removes the cushion historically used to smooth earnings; and goodwill concentration in an Optum Health segment that swung to an operating loss in the same year its goodwill grew. Together these are why the discount rate carries a discretionary premium — and why the composite, not the standalone DCF, sets the target.
The honest framing of the swing factor: the single biggest determinant of this call is the discretionary risk premium embedded in the WACC. Remove it and the DCF turns decisively bullish; keep it and the methods balance to roughly fair value. The HOLD is therefore a statement that the risks are real enough to charge for, but not yet severe enough — absent a named DOJ disclosure or a failed 2026 recovery — to call the stock down.
Key Catalyst: Evidence in 2026 reporting that Medicare Advantage and Optum Health value-based-care margins are recovering on the 2026 repricing — net of the Q4-2025 loss-contract reserve releases — which would validate the bull leg and shift weight toward the DCF.
Key Risk: A first named disclosure, accrual, or adverse resolution in the DOJ Medicare-billing investigations, which carry no reserve today and would be entirely incremental to reported results.
Upgrade Triggers (conditions that would raise the rating or target)
sources | # | Trigger | Threshold | Timeframe | |—|—|—|—| | 1 | Medicare Advantage / Optum Health margin recovery confirmed in reported results | EBIT margin (via $18,964.0M base) recovers toward the FY2023–FY2024 level, net of loss-contract reserve releases | FY2026 results | | 2 | DOJ Medicare-billing investigations resolved without material penalty or with a quantified, contained settlement | Named resolution with no program exclusion and a settlement within normalized cash flow | Within 12–18 months | | 3 | Prior-year favorable reserve development re-normalizes, restoring the earnings cushion | Favorable development returns toward historical run-rate; no further premium-deficiency reserves added | FY2026 reserve rollforward | | 4 | Capital return resumes, signaling restored holding-company liquidity | Share repurchases ($-5,545.0M base) resume at scale and regulated subsidiaries resume net dividends to the parent | FY2026 | | 5 | Membership stabilizes after the guided 2026 contraction | MA, Medicaid and value-based-care lives stop declining and net adds turn positive | By end of FY2026 |
Downgrade Triggers (conditions that would lower the rating or target)
sources | # | Trigger | Threshold | Timeframe | |—|—|—|—| | 1 | DOJ investigations escalate to a named charge, accrual, or adverse settlement | Any accrual established, corporate integrity agreement, or program exclusion disclosed | Any time | | 2 | 2026 margin recovery fails to materialize | EBIT ($18,964.0M) and EBITDA ($23,325.0M) fail to recover, or fall further, as 2025 pricing miss persists | FY2026 results | | 3 | Holding-company liquidity strain deepens into a rating action | Any agency moves from Negative outlook to an actual downgrade; net debt ($54,024.0M) rises further | Within 12 months | | 4 | Operating cash flow / FCF deteriorate as receivables facility non-renews | FCF ($16,075.0M) falls as the 364-day uncommitted receivables-sale facility is not renewed | At the 364-day renewal mark | | 5 | Goodwill impairment crystallizes at Optum Health | Any goodwill or intangible write-down following failed value-based-care repricing | FY2026 |
Format: “[Metric] exceeds/falls below [threshold] in [timeframe] → revise rating to [recommendation]”
Section 7 — Quarterly Update: Q1 2026
sources This is a quarterly update note. The reader has read Sections 1–6 and knows the business, the thesis, and the historical financials. Do not repeat that context. The purpose of this section is: (1) report what happened this quarter with exact numbers, (2) explain what drove the results and what the footnotes reveal, (3) assess whether the investment thesis is intact, and (4) state a clear portfolio action. Be schematic. Every analytical claim must be grounded in a specific number. See quarterly-section-writer agent spec for computation rules.
Quarter definitions (from manifest quarterly_periods): - CQ = current quarter (most recently filed 10-Q) — Q1 2026 (three months ended March 31, 2026) - PYSQ = prior year same quarter (year-over-year comparison) — Q1 2025 - PQ = prior sequential quarter (sequential comparison) — Q4 2025
Portfolio Action
sources HOLD
| Assessment | |
|---|---|
| Action | HOLD |
| Reason | Earnings normalized as expected — EBIT $8,990M (−1.4% YoY) and diluted EPS $6.90 (+$0.05 YoY) snapped back from the Q4 2025 kitchen-sink quarter ($380M EBIT, $0.02 EPS), confirming the recovery is real, but the DOJ False Claims tail is still live and a new IRS transfer-pricing NOPA appeared this quarter, so the thesis is confirmed-not-upgraded. |
| Thesis intact? | PARTIALLY — the operating recovery and reserve-development thesis held (MCR 83.9% vs 84.8%, $1,050M favorable prior-year development), but the legal/regulatory tail widened with the new IRS transfer-pricing dispute (10-Q p. 14). |
| Trigger to revisit | A DOJ summary-judgment denial (the court rejecting the Special Master’s pro-company recommendation, 10-Q p. 14), or an IRS NOPA quantification that exceeds reserves, would move this toward REDUCE; two clean quarters of MCR below 84% with stable holdco cash would move it toward ADD. |
7.1 Results at a Glance
sources | Metric | Q1 2026 | Q1 2025 | YoY Δ | Q4 2025 | QoQ Δ | |—|—|—|—|—|—| | Revenue ($M) | $111,721.0M | $109,575.0M | +2.0% | $113,215.0M | −1.3% | | Gross Profit ($M) | — | — | — | — | — | | Gross Margin | — | — | — | — | — | | EBITDA ($M) | $10,019.0M | $10,180.0M | −1.6% | $1,497.0M | +569.3% | | EBITDA Margin | 9.0% | 9.3% | −0.3 pp | 1.3% | +7.6 pp | | EBIT ($M) | $8,990.0M | $9,119.0M | −1.4% | $380.0M | +2,265.8% | | EBIT Margin | 8.0% | 8.3% | −0.3 pp | 0.3% | +7.7 pp | | Net Income ($M) | $6,280.0M | $6,292.0M | −0.2% | $10.0M | +62,700.0% | | Net Margin | 5.6% | 5.7% | −0.1 pp | 0.01% | +5.6 pp | | Diluted EPS | $6.90 | $6.85 | +0.7% | $0.02 | +34,400.0% |
YoY formula (shown once): YoY Δ = (CQ − PYSQ) / |PYSQ| × 100. Example, Revenue: (111,721 − 109,575) / |109,575| × 100 = +2.0%. QoQ formula (shown once): QoQ Δ = (CQ − PQ) / |PQ| × 100. Example, Revenue: (111,721 − 113,215) / |113,215| × 100 = −1.3%. Margin formula (shown once): EBITDA Margin = EBITDA / Revenue × 100 = 10,019 / 111,721 × 100 = 9.0%. EBIT Margin = 8,990 / 111,721 × 100 = 8.0%. Net Margin = 6,280 / 111,721 × 100 = 5.6%. EBITDA is derived as Earnings from operations + Depreciation and amortization = 8,990 + 1,029 = 10,019 (10-Q p. 2).
QoQ caveat — Q4 2025 was a near-zero-earnings restructuring quarter. PQ EBIT was $380M, PQ Net Income was $10M and PQ EPS was $0.02 — the “kitchen-sink” quarter. The QoQ percentages above (+2,265.8% EBIT, +62,700.0% Net Income, +34,400.0% EPS) are arithmetically correct under the |PQ| convention but are dominated by the tiny denominator and carry no real analytical signal. The meaningful read is the level: EBIT recovered to $8,990M and EPS to $6.90, both back in line with the Q1 2025 run-rate ($9,119M EBIT, $6.85 EPS), which is the point that matters for thesis durability.
Source: UNH Form 10-Q for the quarterly period ended March 31, 2026 — Condensed Consolidated Statements of Operations (10-Q p. 2).
7.2 P&L Drivers
sources Revenue: Total revenues rose +2.0% YoY to $111,721M, driven by UnitedHealthcare pricing actions (+$1,648M / +2% segment revenue) and Optum Rx specialty-pharmacy growth (+$604M / +2%), partly offset by Optum Health (−$728M / −3%) on fewer value-based-care patients; management attributes the lift to “pricing trends at UnitedHealthcare and growth at Optum Rx, partially offset by decreased people served” (10-Q p. 19). Volume moved the other way: UnitedHealthcare served 1.1 million fewer people YoY (49,050k vs 50,125k medical members), with Medicare Advantage down 690k (−8%) and Medicaid down 410k (−5%) (10-Q p. 21) — so this was a price-over-volume quarter.
Cost and margin: Gross profit and a single cost-of-goods line are not reported by a health insurer (the income statement, 10-Q p. 2, separates medical costs, operating costs and cost of products sold with no gross-profit subtotal); D&A was $1,029M in CQ vs $1,061M in PYSQ (−$32M / −3%). The margin story is the medical care ratio: MCR fell to 83.9% from 84.8% (−0.9 pp), aided by $1,050M of favorable prior-year reserve development (vs only $320M in Q1 2025) and a $187M premium-deficiency/loss-contract reserve release (10-Q pp. 12, 18). EBIT margin nonetheless slipped to 8.0% from 8.3% (−0.3 pp) because the operating cost ratio rose 1.4 pp to 13.8% on technology/people investments plus restructuring charges (10-Q p. 19) — the MCR tailwind was real but offset below the medical line, so the margin compression is operating-cost-driven, not medical-cost-driven.
Below the line: Interest expense was $955M (vs $998M PYSQ, −4%); a $72M loss on sale of subsidiaries held for sale (vs $15M) and a lower effective tax rate of 18.6% (vs 20.1%) shaped comparability, leaving diluted EPS at $6.90 — up $0.05 / +0.7% YoY and up $6.88 vs the $0.02 Q4 2025 trough (10-Q pp. 2, 18).
7.3 Balance Sheet & Cash Flow
sources | Metric | Q1 2026 | Q1 2025 | YoY Δ | Q4 2025 | QoQ Δ | |—|—|—|—|—|—| | Cash ($M) | $28,001.0M | $30,717.0M | −8.8% | $24,365.0M | +14.9% | | Net Debt ($M) | $49,916.0M | $50,554.0M | −1.3% | $54,024.0M | −7.6% | | Net Debt / LTM EBITDA | 2.15× | — | — | — | — | | Total Assets ($M) | $312,644.0M | $309,790.0M | +0.9% | $309,581.0M | +1.0% | | Equity ($M) | $97,881.0M | $95,038.0M | +3.0% | $94,110.0M | +4.0% | | OCF ($M) | $8,912.0M | $5,456.0M | +63.3% | — | —ᵃ | | CapEx ($M) | $-763.0M | $-898.0M | +15.0% | — | —ᵃ | | FCF ($M) | $8,149.0M | $4,558.0M | +78.8% | — | —ᵃ | | Dividends Paid ($M) | $-2,005.0M | $-1,912.0M | −4.9% | — | —ᵃ |
YoY/QoQ formula (shown once for this subsection): YoY Δ = (CQ − PYSQ) / |PYSQ| × 100; e.g. OCF (8,912 − 5,456) / |5,456| × 100 = +63.3%. QoQ Δ = (CQ − PQ) / |PQ| × 100; e.g. Cash (28,001 − 24,365) / |24,365| × 100 = +14.9%. Equity values are Total UnitedHealth Group shareholders’ equity (excluding noncontrolling interests): CQ 103,895 − 6,014 = 97,881; PYSQ 100,811 − 5,773 = 95,038; PQ 100,090 − 5,980 = 94,110 (10-Q pp. 1, 4). CapEx and Dividends are stored negative (outflows); the YoY signs above describe the change in the stored negative figure — CapEx outflow shrank from $898M to $763M, and dividends paid rose from $1,912M to $2,005M.
Net Debt / LTM EBITDA: LTM EBITDA = Q2 2025 (6,234) + Q3 2025 (5,414) + Q4 2025 (1,497) + Q1 2026 (10,019) = 23,164. Net Debt CQ 49,916 / LTM EBITDA 23,164 = 2.15×. Note: the ratio is flattered downward (toward higher leverage) by the $1,497M Q4 2025 restructuring quarter dragging the trailing-twelve-month base; on a normalized ~$40bn run-rate EBITDA the ratio would be near 1.2×.
Source: UNH Form 10-Q — Condensed Consolidated Balance Sheets (10-Q p. 1) and Condensed Consolidated Statements of Cash Flows (10-Q p. 5).
ᵃ Sequential (QoQ) comparison is not shown for cash-flow lines: a 10-Q cash-flow statement is year-to-date only, so a clean standalone Q4 2025 figure is not separable; the YoY column carries the signal.
Balance sheet note: Cash rose +14.9% QoQ to $28,001M and net debt fell −7.6% QoQ to $49,916M as the company repaid $1,500M of long-term debt and added only $1,100M of net short-term borrowings, while completing $1.1bn of held-for-sale dispositions (10-Q pp. 1, 5). Medical costs payable was broadly flat at $39,659M (vs $39,337M at Dec 31, 2025), and IBNR reserves rose to $27.6bn from $26.7bn — a modestly more conservative reserve posture (10-Q p. 12).
Cash flow note: FCF conversion = FCF / Net Income = 8,149 / 6,280 = 129.8%, a strong reading. OCF of $8,912M was up +63.3% YoY, which management attributes to Inflation Reduction Act pharmacy-rebate timing and working-capital movement; the key swing lines were Other assets (+$2,919M source vs −$544M use) and a smaller medical-costs-payable build (+$296M vs +$2,993M) — so cash flow comfortably outran earnings, but the beat is working-capital-timing-driven rather than a structural step-up (10-Q pp. 5, 20).
7.4 Footnote Review
sources Read every footnote in the CQ 10-Q. For each footnote below: state what it says, whether it changed vs. PYSQ or PQ, and the analytical implication. Every entry requires a page citation.
Footnote 1 — Basis of Presentation (10-Q p. 6) Standard interim-GAAP basis; most significant estimates are medical costs payable and goodwill. Two substantive disclosures here: (i) the $3.3bn 364-day receivables financing facility, under which UNH sold $585M of receivables in Q1 2026 and remitted $2.0bn related to 2025 sales (10-Q p. 6); and (ii) the Q1 2026 quantification of the Q4 2025 strategic review — a $230M net portfolio-divestiture gain (Optum Insight +$528M, Optum Rx +$8M, Optum Health −$306M) recorded in operating costs (10-Q p. 6). Changed vs PYSQ: the portfolio-divestiture and receivables-remittance items are new this year. Significance: confirms the Q4 2025 restructuring is being executed and is now flowing through as gains, supporting the “recovery is real” thesis.
Footnote 1 (cont.) — Restructuring and Other Actions (10-Q p. 7) Q1 2026 restructuring included a $400M contribution to the United Health Foundation (funded by an Optum Insight disposition gain), partly offset by a $137M release of Q4 2025 loss-contract reserves and $59M of equity-security valuation gains; net effect: operating costs +$415M, investment income +$74M, medical costs −$137M (10-Q p. 7). New vs PYSQ. Significance: the $400M foundation gift is a discretionary one-off that depressed reported operating margin by ~0.4 pp this quarter — adjusting for it, underlying EBIT margin is closer to ~8.4%, above the reported 8.0%.
Footnote 2 — Investments (10-Q pp. 7–8) Total debt securities $52,341M amortized cost / $50,577M fair value, with $1,881M gross unrealized losses (up from $1,628M at Dec 31, 2025) driven by rates, not credit; 31,000 of 42,000 positions in a loss position; AFS allowance for credit losses immaterial. Held $5.5bn equity securities (flat) and $3.9bn equity-method investments (vs $3.8bn) (10-Q p. 8). Changed vs PQ: unrealized losses widened ~$253M on higher rates. Significance: the $1.9bn unrealized loss sits in OCI (AOCI loss widened to −$2,562M, p. 1), not earnings; no impairment risk flagged — immaterial to the thesis.
Footnote 3 — Fair Value (10-Q pp. 9–10) $80,964M of assets at fair value on a recurring basis (33% Level 1 / 65% Level 2 / 2% Level 3); no transfers in/out of Level 3 in either period. Long-term debt fair value $69,323M vs $74,537M carrying (10-Q p. 10). Changed vs PQ: total fair-value assets up from $75,599M, mix essentially stable. Significance: Level 3 exposure remains a negligible 2% — no valuation-opacity concern.
Footnote 4 — Medical Costs Payable (10-Q p. 12) Ending balance $39,659M (vs $37,136M a year earlier). Prior-years’ reserve development was favorable by $1,050M in Q1 2026 vs only $320M in Q1 2025 — “driven by a favorable respiratory illness season”; IBNR reserves $27.6bn vs $26.7bn (10-Q p. 12). Changed vs PYSQ: favorable development more than tripled ($1,050M vs $320M). Significance: this is the single most thesis-relevant footnote. It directly addresses the reserve-development-adequacy risk from Section 6: the larger release plus a higher IBNR balance indicates reserves are adequate and were, if anything, conservatively set — a positive, though it means ~$730M of the YoY MCR improvement is development-driven rather than structural.
Footnote 5 — Short-Term Borrowings and Long-Term Debt (10-Q p. 12) $3.4bn commercial paper outstanding at a 3.7% weighted-average rate; covenant and detailed-maturity disclosure incorporated by reference to the 2025 10-K. The MD&A confirms covenant compliance: “As of March 31, 2026, we were in compliance with the various covenants under our bank credit facilities” (10-Q p. 23), with no specific covenant ratio level disclosed in the 10-Q. Changed vs PQ: short-term borrowings/current maturities rose to $6,477M from $6,069M; long-term debt fell to $71,440M from $72,320M after a $1,500M repayment (10-Q p. 1). Significance: leverage well within capacity; senior-unsecured ratings A2/A+/A but all three majors carry a Negative outlook (10-Q p. 23) — a watch item, not a present constraint.
Footnote 6 — Shareholders’ Equity (10-Q p. 13) One dividend paid March 17, 2026 at $2.21/share, $2,005M total (vs $2.10/$1,912M in Q1 2025); annualized dividend rate now $8.84. New this quarter: forward share-repurchase contracts for up to $2.0bn, of which 1.7M shares were purchased by the counterparty at $285.68 (a $500M liability recorded), remainder settling in Q2 2026; 19.3M shares remain authorized (10-Q pp. 13, 23). Changed vs PYSQ: cash repurchases dropped to $0 on the cash-flow statement (vs $3,000M in Q1 2025), replaced by the forward-contract structure (10-Q p. 5). Significance: the dividend was raised +5.2% per share and buybacks were paused/restructured — consistent with prioritizing holdco liquidity into the legal/regulatory overhang, which is prudent and thesis-neutral-to-positive.
Footnote 7 — Commitments and Contingencies (10-Q pp. 13–14) — see Contingencies and Litigation below for full treatment.
Footnote 8 — Held for Sale and Dispositions (10-Q p. 14) Agreement to sell remaining South American operations (close expected 2H 2026); losses in “loss on sale of subsidiary” include significant FX-translation effects. Held-for-sale disposal group carries $990M (South America) + $1,021M (Other) of assets after a $1,595M + $557M remeasurement to fair value less cost to sell. Q1 2026 completed dispositions brought in $1.1bn cash and a $211M net gain (Optum Insight +$525M, Optum Health −$314M) (10-Q p. 14). Changed vs PYSQ: this is the active execution of the Q4 2025 strategic exit. Significance: confirms management is shrinking lower-return/non-core operations and converting them to cash ($1.1bn this quarter) — supports the recovery thesis.
Footnote 9 — Segment Financial Information (10-Q pp. 15, 20) Four segments; on Jan 1, 2026 Optum Financial/Optum Bank was moved from Optum Health to Optum Insight, with prior periods recast. Q1 2026 segment EBIT: UnitedHealthcare $5,694M (+9% YoY), Optum Health $1,141M (−19%), Optum Insight $963M (−17%), Optum Rx $1,192M (−10%) (10-Q p. 20). Changed vs PYSQ: realignment is new; UnitedHealthcare is carrying the group while all three Optum segments declined. Significance: the earnings recovery is UnitedHealthcare-led; Optum Health operating margin fell to 4.7% from 5.7% on value-based-care medical-cost pressure — the soft spot to monitor.
Related-party transactions (10-Q — pp. 6–7, 8, 15) UNH has no controlling shareholder and no controlling-shareholder related-party regime; there is no standalone related-party footnote. The 10-Q discloses the limited related-party-type items that do exist, documented here with CQ vs PYSQ amounts: - Equity-method investments (operating businesses in health care): carrying value $3.9bn at March 31, 2026 vs $3.8bn at Dec 31, 2025 (10-Q p. 8). No related earnings amount separately disclosed. - Redeemable noncontrolling interests (redeemable NCI): balance $1,424M at March 31, 2026 vs $1,608M at Dec 31, 2025 (a $184M decrease); a +$51M fair-value/other adjustment ran through equity in Q1 2026 vs −$5M in Q1 2025 (10-Q pp. 1, 4). - Nonredeemable noncontrolling interests: $6,014M vs $5,980M; earnings attributable to NCI $201M in Q1 2026 vs $182M in Q1 2025; distributions to NCI $164M vs $179M; acquisition/other NCI adjustments +$31M vs +$194M (10-Q pp. 1, 4). - Intersegment (affiliated-customer) revenue eliminated in consolidation: $38,293M in Q1 2026 vs $38,927M in Q1 2025 (10-Q p. 15) — internal Optum-to-UnitedHealthcare transactions, fully eliminated, not third-party related-party dealings. Terms: no related-party terms changed; none are off-market in the disclosed information. This confirms the Section 6 read that UNH related-party scope is limited and immaterial.
Contingencies and litigation (10-Q pp. 13–14) - General legal matters: UNH is routinely party to class actions and suits (medical malpractice, employment, antitrust, privacy, contract); it records liabilities where probable but is “often unable to estimate the losses or ranges of losses” — no dollar amount disclosed (10-Q p. 13). Unchanged in character vs PYSQ. - Government investigations / RADV: ongoing CMS/OIG/DOJ/SEC/IRS and other reviews, including Medicare risk-adjustment coding compliance and RADV audits that “may result in retrospective adjustments” — no amount quantified (10-Q p. 13). - DOJ False Claims Act (risk-adjustment) — the key thesis risk: the 2011 whistleblower suit the DOJ joined in 2017 alleging improper risk-adjustment submissions. In March 2025 a court-appointed Special Master recommended summary judgment in UNH’s favor on all remaining claims; in April 2025 the DOJ moved to reject that report. UNH “cannot reasonably estimate the outcome” given procedural status (10-Q p. 14). Change vs prior quarter: procedural status unchanged this quarter — still awaiting the court’s ruling on the DOJ’s motion. Significance: the directly thesis-relevant DOJ Medicare-billing tail remains open and unresolved; the Special Master recommendation is favorable but not final. No reserve quantified. - NEW — IRS transfer-pricing NOPAs (10-Q p. 14): on March 6, 2026 UNH received Notices of Proposed Adjustment from the IRS for 2017–2020 intercompany transfer pricing with a foreign subsidiary, seeking to “significantly increase taxable income” for each year and potentially later years. UNH disagrees, will contest, and believes its uncertain-tax-position reserves are adequate; no dollar amount disclosed. New this quarter. Significance: a fresh, unquantified tax-liability tail layered on top of the DOJ matter — the single most important new contingency this quarter and a reason the action is HOLD rather than ADD.
Subsequent events (10-Q — none separately captioned) There is no separate “Subsequent Events” footnote. The only post-quarter-end forward-looking items disclosed are: forward share-repurchase contracts settling on or before July 1, 2026 (10-Q p. 13), pending health-care acquisitions requiring ~$3.0bn that mostly close in 2H 2026 (10-Q pp. 13, 23), and the South American sale expected to close 2H 2026 (10-Q p. 14). No material post-March-31 event (such as a litigation ruling) is disclosed; the filing is signed May 5, 2026 (10-Q p. 26).
7.5 What Changed This Quarter
sources - Earnings normalized off the Q4 2025 trough: EBIT recovered to $8,990M and diluted EPS to $6.90, vs $380M EBIT and $0.02 EPS in Q4 2025 — confirming the kitchen-sink quarter was a clean-up, not a new run-rate. Thesis implication: validates the “Q4 2025 recovery durability” assumption that was an open question in Section 6. - Reserve development was strongly favorable — $1,050M vs $320M a year ago (10-Q p. 12), and IBNR rose to $27.6bn from $26.7bn. Thesis implication: directly answers the reserve-adequacy risk — reserves are adequate-to-conservative — but flags that ~$730M of the YoY MCR improvement is one-off development, not structural. - A new IRS transfer-pricing dispute appeared: NOPAs received March 6, 2026 for tax years 2017–2020, unquantified (10-Q p. 14). Thesis implication: a fresh regulatory/tax tail that did not exist in prior filings; reason to hold rather than add. - The DOJ Medicare risk-adjustment case remains unresolved: Special Master recommended summary judgment for UNH (March 2025), DOJ moved to reject (April 2025), still pending (10-Q p. 14). Thesis implication: the central downside risk is still open; a favorable signal exists but is not final. - Capital-return posture shifted toward liquidity preservation: cash buybacks fell to $0 (vs $3,000M in Q1 2025), replaced by $2.0bn of forward contracts, while the dividend rose +5.2% to $2.21/share (10-Q pp. 5, 13). Holdco liquidity noted at only $1.1bn available for general corporate use out of $28.0bn cash (10-Q p. 20). Thesis implication: addresses the holdco-liquidity risk — management is conserving cash into the overhang. - UnitedHealthcare is carrying the group; all three Optum segments’ EBIT fell (UnitedHealthcare +9%, Optum Health −19%, Optum Insight −17%, Optum Rx −10%) (10-Q p. 20). Thesis implication: the recovery is narrow — concentrated in the insurance segment — with Optum Health value-based-care margin (4.7% vs 5.7%) the area to watch.
7.6 Portfolio Decision
sources Why HOLD: The quarter confirms the core recovery thesis without justifying an upgrade. Diluted EPS of $6.90 (+$0.05 / +0.7% YoY) and EBIT of $8,990M (−1.4% YoY) snapped cleanly back from the $0.02 EPS / $380M EBIT Q4 2025 restructuring quarter, so the durability question from Section 6 is answered: the trough was a clean-up. The reserve-adequacy risk is also resolved favorably — $1,050M of favorable prior-year development (vs $320M) with IBNR rising to $27.6bn (10-Q p. 12) — and FCF conversion of 129.8% with cash up to $28,001M shows the cash engine is intact. The footnote review, however, is what keeps this at HOLD rather than ADD: the DOJ Medicare risk-adjustment case is still unresolved (Special Master favorable but DOJ contesting, 10-Q p. 14) and a brand-new, unquantified IRS transfer-pricing dispute for 2017–2020 surfaced on March 6, 2026 (10-Q p. 14). With the underlying margin recovery narrow (UnitedHealthcare EBIT +9% while every Optum segment fell, 10-Q p. 20) and two open, unquantifiable legal/tax tails, the risk-reward is balanced — consistent with the Section 2/6 HOLD where DCF and multiples disagree.
What would change this view: - Upgrade condition: a court ruling adopting the Special Master’s recommendation (DOJ case dismissed), combined with two consecutive quarters of MCR below 84% on structural (not development-driven) improvement and stable holdco cash — would move to ADD. - Downgrade condition: a court rejection of the Special Master’s report (DOJ case proceeding to trial), an IRS NOPA quantification materially above current uncertain-tax reserves, or a credit-rating downgrade off the current Negative outlooks (10-Q p. 23) — any of these would move to REDUCE or EXIT.
Report Versions
Every published version of this report, newest first.
| Version date | Files |
|---|---|
| 2026-06-08 Current | Excel Excel Excel Word |
| 2026-06-06 | Excel Word |