Southern Copper Corporation
Section 1 — Business Overview, Operations & Competitive Positioning
1.1 The Business
sources Southern Copper Corporation digs copper out of two of the world’s largest ore systems in Peru and Mexico, processes it through its own smelters and refineries down to refined metal and copper rod, and sells it at prices set by the global commodity market — so the entire economic model rests on producing a price-taking product at a cash cost management believes is among the lowest of any copper producer of comparable size. §
The company is one of the largest integrated copper producers globally, with material by-product output of molybdenum, zinc and silver, and management believes it holds the largest copper reserves in the world. Every mining, smelting and refining asset sits in Peru or Mexico; exploration extends to Argentina and Chile. The business is vertically integrated from ore extraction through refined copper rod, including most of its own transport and logistics — an industrial railroad and port facilities serve the Peruvian mines. Because selling prices are determined by market forces beyond its control, management’s stated operating philosophy is cost control and production enhancement: remain profitable at the bottom of the copper cycle, maximize results at the top. Revenue in the most recent fiscal year reached 13,420.0M, a record, up from 10,934.1M four years earlier and 5,046.0M a decade ago — a trajectory that reflects both copper price cycles and the progressive addition of by-product volume, most recently zinc from the new Buenavista concentrator. The marketing model favors annual and longer-term contracts with end-user customers over spot sales and trading intermediaries, with deliberate diversification by region and customer.
The workforce is majority-unionized in both countries and largely hired locally; in Peru, the company signed long-term extensions of its collective bargaining agreements with all of its unions during the year, with no-stoppage commitments intended to keep operations running normally through at least 2027. The stock has been listed on both the New York and Lima exchanges since 1996. The company is a majority-owned, indirect subsidiary of Grupo Mexico — a structural fact that shapes governance, capital allocation and related-party economics throughout this report.
Key Information
| Item | Value |
|---|---|
| Ticker | SCCO |
| Sector / Industry | Metals & Mining — Copper |
| Report Date | 2026-06-07 |
| Most Recent FY Revenue | 13,420.0M |
| EBIT Margin (Most Recent FY) | 52.2% |
| Diluted Shares (FY2025 weighted avg) | 827M |
Source: verified workbook (SCCO_Portfolio.xlsx), figures traceable via lineage.json to the cited filings.
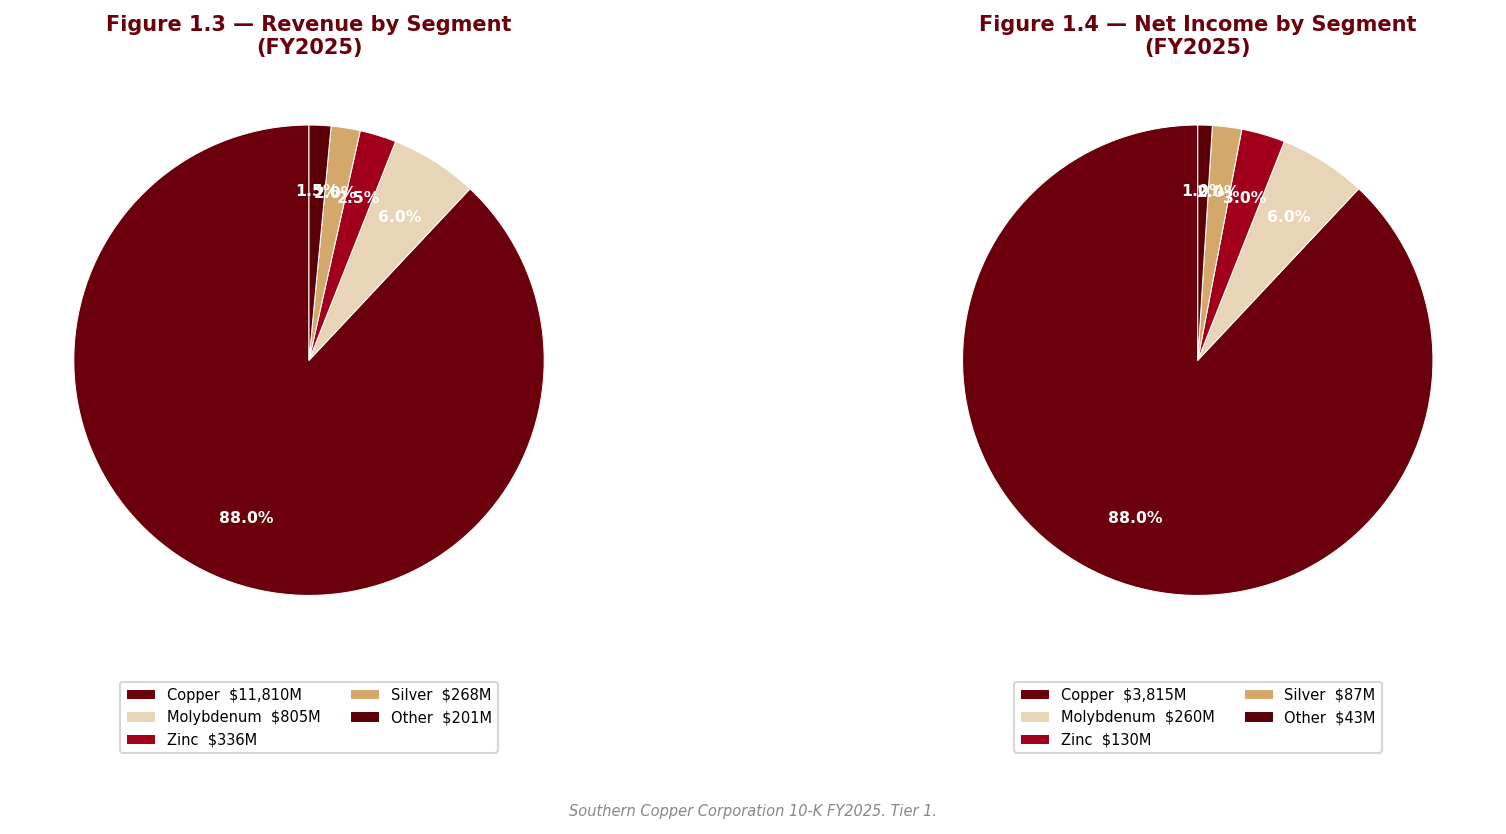
1.2 Operating Segments
sources Southern Copper reports three segments, which the chief operating decision maker evaluates primarily on operating income and total assets — reviewing production, net sales and operating income variances against budget and prior periods, plus capital expenditure execution, to allocate capital between them. §
Peruvian operations. The Toquepala and Cuajone open-pit complexes high in the Andes, plus the smelting and refining plants at the coastal city of Ilo — including a precious metals plant, the industrial railroad and port facilities that serve both mines. The segment produces copper with molybdenum and silver by-products, and refined copper via SX-EW. The single variable that drives this segment is the copper price applied to ore grades that declined at both Toquepala and Cuajone in the most recent year — meaning the segment needs either price or the Tia Maria growth project to offset grade-driven volume attrition.
Mexican open-pit. The La Caridad and Buenavista complexes with their smelters, refineries, a precious metals plant, a copper rod plant and shared support facilities. Buenavista sits on one of the world’s largest copper ore deposits. This segment now produces copper and zinc: the new Buenavista zinc concentrator ran at full capacity in the most recent year and was the principal driver of a sharp rise in zinc output, even as copper grades and recoveries at Buenavista weakened with the concentrator dedicated to zinc. The economic driver here has therefore broadened — the segment’s earnings now respond to the zinc price as a meaningful second factor alongside copper.
IMMSA (Mexican underground). Five underground mines producing zinc, copper, lead, silver and gold, together with a zinc refinery. This is the polymetallic tail of the portfolio — small relative to the open-pit segments, with economics driven by zinc and silver prices and by the grade and throughput of the underground operations rather than by copper. One IMMSA asset, the Taxco mine, has been on strike since 2007.
How the system fits together. The flywheel is by-product economics feeding cost leadership: molybdenum, zinc, silver and gold revenue credits absorb a substantial share of fixed costs, pushing the net cash cost of producing a pound of copper toward the bottom of the industry curve. Vertical integration — own smelting, refining, rail and port — captures margin that pure miners surrender to third-party processors and keeps treatment and refining economics in-house. The fragility is the mirror image: all three segments share the same two jurisdictions and, in the open-pit segments, the same primary commodity, so the portfolio offers operational diversification but very little economic diversification. When copper falls, all of it falls together, and the by-product cushion — itself commodity-priced — is correlated rather than offsetting.
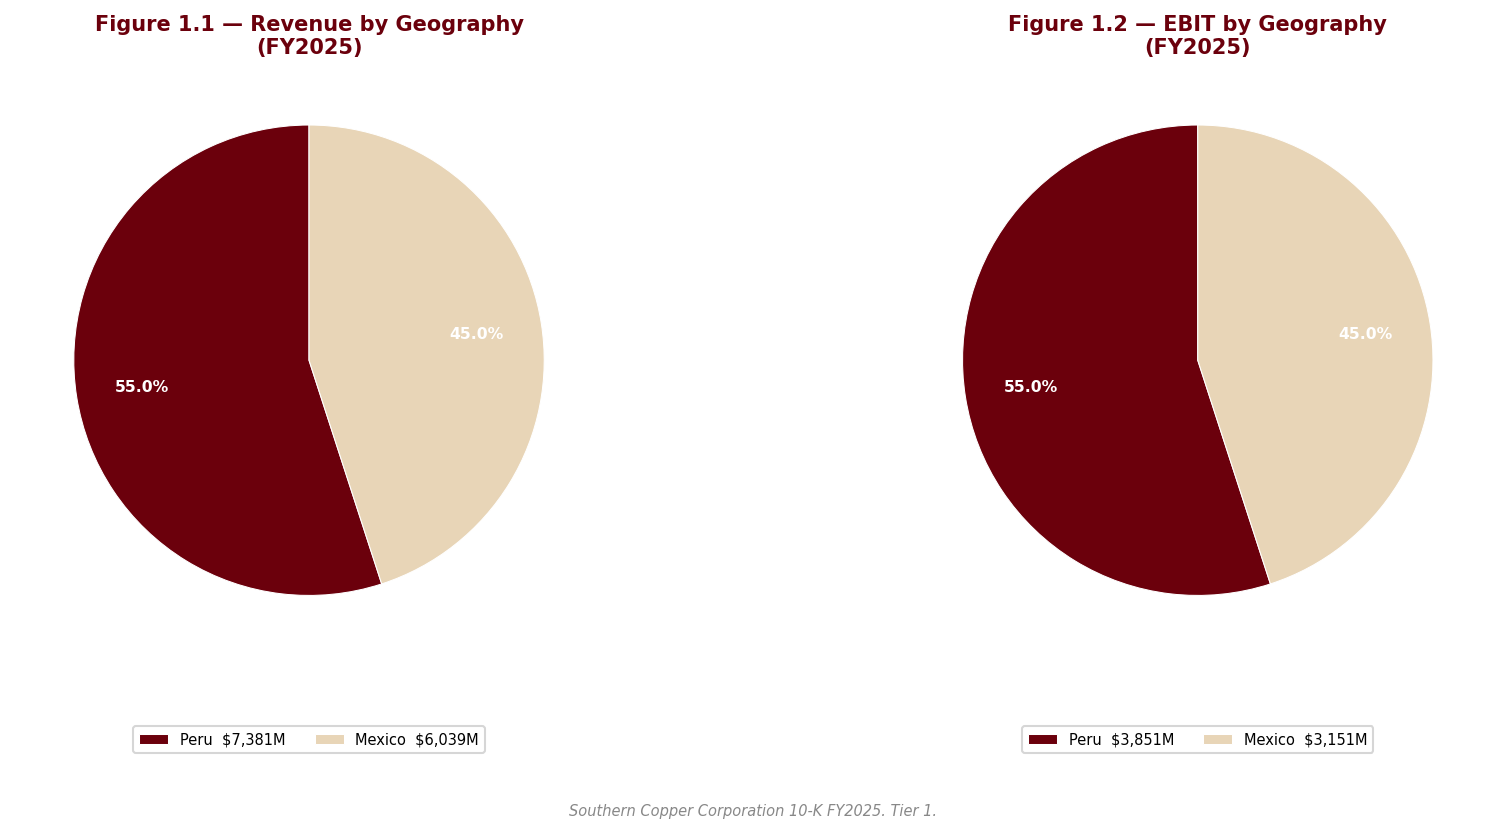
1.3 Geographic Exposure
sources The asset base is entirely binational: every producing mine, smelter and refinery is in Peru or Mexico, with exploration extending to Argentina and Chile. Revenue, by contrast, is deliberately diversified by region and customer through the end-user contract model, so geographic risk in this company is asset-side, not demand-side. The company holds extensive mining concessions in both countries — indefinite-term in Peru subject to annual fees, multi-decade renewable terms in Mexico — and generally owns the land and processing facilities outright.
The U.S. dollar is the functional currency and revenue is primarily dollar-denominated, but meaningful portions of operating costs are denominated in Peruvian soles and Mexican pesos; both currencies appreciated against the dollar during the year, a cost headwind that recurs whenever local appreciation outruns local inflation relief. The concentrated jurisdictional footprint carries real political weight: Peru is heading into general elections in April 2026 after a period of acute presidential instability, and Mexico has enacted Mining Law changes and a judicial reform whose effects management itself describes as not currently determinable. These exposures are treated in depth in Section 2; the point for the business overview is that there is no third country to retreat to — the company’s license to operate in exactly two states is the whole franchise.
1.4 Management Team
sources The anchor of this management structure is not an individual executive — it is the controlling shareholder. Grupo Mexico holds a super-majority of the capital stock through its wholly-owned subsidiary Americas Mining Corporation, determines the outcome of substantially all shareholder votes, and shares officers and directors with the company. The filing itself cautions explicitly that the parent’s interests may conflict with those of minority stockholders. Practically, this means strategy, board composition, dividend policy and capital project approval are set by Grupo Mexico, and the public-company management team executes within that mandate. §
The execution record under this structure is, on the operating evidence, disciplined: a consistent multi-decade strategy of cost control and organic growth, no disclosed CEO change during the year, long-dated labor agreements secured in Peru, and a record-revenue, record-net-income year delivered on by-product expansion rather than copper volume. The governance trade-off is equally consistent: extensive related-party purchasing from Grupo Mexico affiliates — including most of the electricity for the Mexican open-pit operations under long-dated contracts with parent-owned generators — operates alongside the conflict-of-interest caution in the filing. The succession and key-person question that matters for most companies is, here, subordinate to a structural one: minority shareholders are permanent passengers in a vehicle steered by the parent. The full governance assessment, including the related-party economics, is in Section 2.
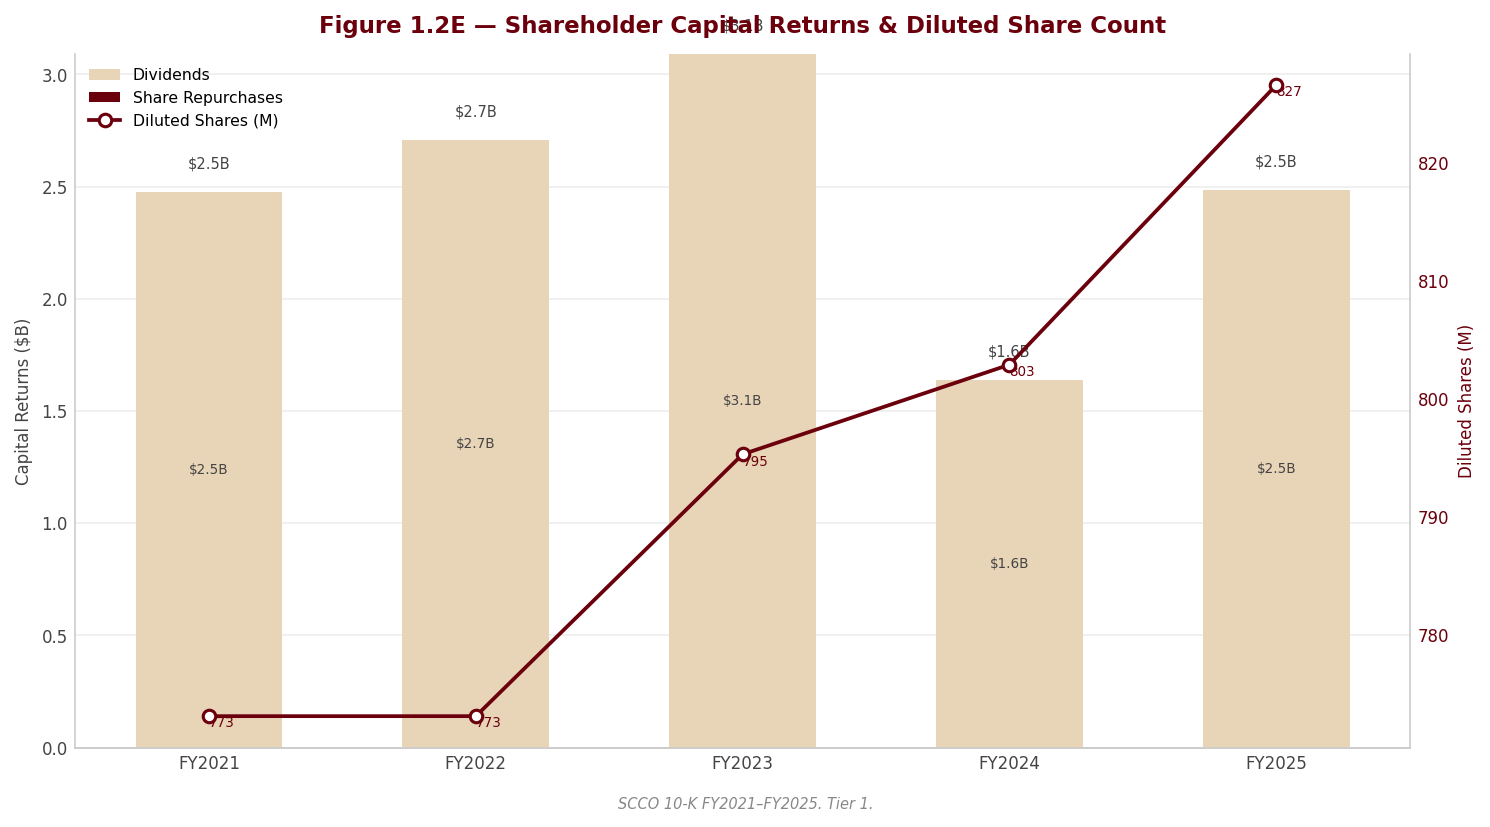
1.5 Capital Allocation Track Record
sources Southern Copper’s capital allocation has two simultaneous and unusually large commitments: heavy cash dividends — the company has distributed a significant share of net income as dividends since 1996 — and an expanding organic growth program aimed at substantially higher copper production by 2033. There is no third leg: the share repurchase program, although still authorized with no expiration date, has registered no activity since the third quarter of 2016, and since the second quarter of 2024 the Board has paid quarterly stock dividends out of previously repurchased treasury shares in addition to cash dividends — a mechanism that grows the share count rather than shrinking it.
| Year | Dividends Paid ($M) | Share Repurchases ($M) | CapEx ($M) |
|---|---|---|---|
| FY2021 | -2,473.8M | — | -892.3M |
| FY2022 | -2,705.8M | — | -948.5M |
| FY2023 | -3,092.4M | — | -1,008.6M |
| FY2024 | -1,637.2M | — | -1,027.3M |
| FY2025 | -2,485.1M | — | -1,325.3M |
Source: Company 10-K filings FY2021–FY2025, consolidated statements of cash flows, as compiled in the Data sheet of the SCCO workbook. Share repurchase program inactive since Q3 2016.
The signal in the mix is confidence in the asset base over financial engineering. Capital is being pushed into the business at an accelerating rate: the Board approved an enlarged capital investment program for the coming year, with spending concentrated in the Buenavista tailings facility, the new zinc concentrator, IMMSA mine development and the ramp-up of Tia Maria — the flagship Peruvian project now under construction and targeted for 2027 operations — while management states that Peruvian projects in construction or engineering could absorb a multi-billion-dollar sum over the next decade, with a parallel multi-billion-dollar pipeline under discussion in Mexico. That CapEx is increasingly growth capital rather than replacement capital is the central read: the company is building new production capacity (Tia Maria, the zinc concentrator, El Pilar) on top of maintaining existing operations, not merely sustaining a depleting asset.
Two caveats temper the shareholder-return story. First, the stock-dividend mechanism is dilutive by construction — treasury shares are being handed out rather than retired, expanding the per-share denominator. Second, with Grupo Mexico holding a super-majority of the shares, the overwhelming bulk of every cash dividend flows to the parent; the dividend policy should be read partly as a parent-funding channel, a dynamic the filing’s own risk factors acknowledge and which Section 2 examines in detail. Management’s stated discipline — every project must increase production, decrease costs or address social and environmental commitments — is the right framework; the governance question is who the discipline ultimately serves.
1.6 Competitive Positioning & Moat
sources §1.6.1 Industry structure. Copper is a pure commodity industry: competition is based primarily on price and service, and the filing is explicit that price dominates when supplies are ample. Products also compete with substitute materials, principally aluminum and plastics. In such a structure, no producer has pricing power; returns accrue to whoever sits lowest on the cost curve and owns the longest-lived, highest-quality ore bodies. Position on the cost curve is determined by ore grade, scale, by-product endowment and integration — all asset-level attributes that cannot be replicated quickly, because new world-class copper deposits are scarce, permitting takes decades, and the industry’s main competitors have consolidated into larger, more diversified groups. The cycle, meanwhile, is set by Chinese demand, global inventories and increasingly by trade policy.
§1.6.2 Competitive advantages. Southern Copper’s moat is geological and structural, and each claimed element is anchored in the filing. First, reserves: management believes the company holds the largest copper reserves in the world, with Buenavista alone sitting on one of the world’s largest copper ore deposits — in a depleting industry, reserve life is the scarcest asset. Second, cost position: management states its controllable cash cost is one of the lowest of all copper producers of similar size, explicitly supported by by-product revenue credits from molybdenum, zinc, silver and gold that help cover fixed costs — and the by-product engine grew in the most recent year as the Buenavista zinc concentrator reached full capacity, driving the net unit cash cost down sharply. Third, integration: ownership of the full chain from mine through smelter, refinery, rail and port internalizes processing margin and logistics control that single-stage competitors must buy. Fourth, tenure: concessions in Peru carry indefinite terms and the company generally owns its land and facilities, while long-term collective bargaining agreements in Peru lock in labor peace into 2027. None of these advantages confers pricing power — they confer survivability at the bottom of the cycle and superior cash conversion at the top, which is the only durable form of advantage available in this industry.
§1.6.3 Competitive vulnerabilities. The vulnerabilities are as structural as the strengths. The company is a price-taker on effectively its entire revenue base, and its by-product cushion is itself commodity-priced. Ore grades are declining at the core Peruvian pits and at Buenavista’s copper circuit — the most recent year’s copper production fell on grades, and management guides lower copper output again for the coming year — so the existing asset base is on a slow treadmill that only the project pipeline can reverse. That pipeline is exposed to the company’s deepest weakness: social license in exactly two jurisdictions. Tia Maria was delayed for years by community opposition before construction finally advanced; Los Chancas is currently blocked by illegal miners occupying the project area; Taxco has been on strike since 2007; and violent protests at Cuajone in 2022 halted production. Layer on Peruvian political instability heading into the April 2026 elections, Mexican Mining Law and judicial reform whose effects management cannot quantify, new U.S. tariffs on semi-finished copper products, and a controlling shareholder whose interests may diverge from the float, and the moat’s perimeter is clear: nothing erodes the ore body, but plenty can interdict access to it.
§1.6.4 Verdict. Southern Copper holds a genuine, asset-based moat — reserve scale, by-product-subsidized cost leadership and full integration — of the only kind that matters in a commodity industry, and it should keep the company profitable through the trough of any plausible copper cycle. But the moat protects margins against competitors, not against the copper price, and not against the political and community risk concentrated in its two host countries. Long-run margin durability is therefore a two-variable bet: the cost-curve position looks defensible for as long as the by-product engine and grades hold, while the realized margin will swing with copper and with Peru’s and Mexico’s tolerance for large-scale mining. Investors are buying the best seat in a theater they do not control.
Section 2 — Key Risks & Catalysts
2.1 Downside Risks
sources The risk landscape at Southern Copper is dominated not by the commodity cycle — which every copper producer shares — but by governance: a super-majority controlling shareholder whose commercial relationships with the company are extensive, growing, and verified as arm’s-length only by the company’s own internal processes. Around that core sit a newly escalated legal exposure in Peru, an earnings base partly marked to a near-record copper price, a project pipeline hostage to social license in two countries, and a Mexican fiscal regime whose direction of travel is unambiguously tighter.
The Grupo Mexico relationship — minority shareholders inside a controlled vehicle
sources This is the highest-priority risk in the filing, and the forensic review of the related-party footnote flags it as a red-level governance concern. Grupo Mexico, through its wholly-owned subsidiary Americas Mining Corporation, holds a super-majority of the capital stock and determines the outcome of substantially all shareholder votes — board composition, dividends, capital projects, asset sales. The commercial web around that control is extensive: administrative, legal and treasury services, rail freight, construction, engineering, captive power for the Mexican operations from three parent-owned generators under contracts running to 2032 and, in one case, two decades, metal purchases and tolling from sister company Asarco, and aviation and entertainment services from Larrea-family companies. The forensic review found that total purchases from parent affiliates grew materially year-over-year — faster than revenue — that the payable balance owed to affiliates expanded sharply, and that purchases from Asarco rose by an order of magnitude. Oversight of all of this rests on the company’s own Audit Committee review framework; no independent fairness opinion or market benchmarking of affiliate pricing is disclosed, several officers and directors are simultaneously officers or directors of Grupo Mexico entities, and the filing’s own risk factors concede that rising parent financial obligations could result in the parent obtaining loans, increased dividends or other funding from the company.
Two adjacent findings reinforce the pattern and are noted here as watch items. First, the Mexican defined-benefit pension plan’s allocation to Grupo Mexico’s own shares increased again year-over-year — a related-party concentration decided by plan fiduciaries that ties the plan’s funded status to the controlling shareholder’s equity, and a governance signal more than a balance-sheet risk given the plan is overfunded. Second, shortly after year-end, the controlled board approved a discretionary, non-contractual “solidarity contribution” to the government of Sonora, Mexico — a payment of meaningful size that was not approved by minority shareholders, benefits the operating jurisdiction of the parent’s broader interests, and is disclosed under commitments rather than subsequent events, where a reader could miss it. Neither item is individually large relative to the company; both illustrate how far the parent’s discretion reaches into company-related pools of capital.
The financial consequence is structural: the small public float bears a pro-rata share of every dollar paid to parent affiliates at prices that cannot be independently verified from the filing, and the cash dividend — raised again in the most recent year — flows overwhelmingly to the parent, consistent with the risk factor’s own warning about parent funding needs. The trigger for materialization is any period of parent balance-sheet stress, which history suggests would be met through the channels the filing itself enumerates.
Probability: High (the structure is in place and the transaction volume is growing; the question is degree, not existence) | Timeframe: Immediate and continuous | Quantified potential impact: Not quantifiable from the filing — which is precisely the problem. The cost to minority holders is the unobservable spread between affiliate pricing and market pricing, applied to a growing volume of related-party purchases.
Peruvian “labor shares” litigation — escalated enforcement orders, unquantified exposure
sources The forensic review flags this as a red-level legal risk, and it deserves prominence because it changed materially during the year. The decades-old Garcia Ataucuri lawsuit over Peruvian labor shares, which was absent from the prior year’s litigation disclosure entirely, re-emerged in the FY2025 filing at the judgment-execution stage: in December 2025 the company learned that a Lima civil court had ordered the physical delivery of millions of investment shares held by the Peruvian Branch and an affiliate to plaintiffs, and had instructed Peru’s securities registry to record ownership in their favor — adopting, before the court-ordered appraisal is final, the plaintiffs’ interpretation that one labor share equals one investment share. The company appealed within days and filed a constitutional protection action; in February 2026 a constitutional court ruled in its favor and enforcement was provisionally suspended. That reversal is first-instance and provisional, appeals are expected to be resolved during 2026, and the company states it cannot predict the outcome. No accrual or estimated exposure is disclosed. §
Two features warrant skepticism toward the “cannot be reasonably estimated” posture. The courts have already specified share quantities — the exposure is not formless. And an adverse final ruling would do more than transfer the named shares: it would set the valuation precedent for the broader class of labor-share claims against the Branch. The fact that this matter went from undisclosed in one annual filing to active enforcement orders in the next is itself a disclosure-cadence concern.
Probability: Medium (the company prevailed at the constitutional stage, but provisionally and at first instance) | Timeframe: Immediate — appellate rulings expected during 2026 | Quantified potential impact: Not quantified by the company; an adverse outcome would transfer economic interests in the Peruvian Branch to plaintiffs and establish a conversion precedent for the wider class, making this a potentially material dilution-of-economics event rather than an ordinary contingency.
Copper price dependence amplified by mark-to-market earnings quality
sources The structural risk is familiar — financial performance depends on copper, molybdenum, zinc and silver prices set by forces outside the company’s control, with Chinese demand singled out and extended price declines capable of triggering inventory writedowns, impairments and curtailment. What is specific to this year is how much of the reported result is itself a price mark. The forensic review flags, at yellow level, that trade receivables grew several times faster than sales, concentrated in the Mexican open-pit segment, driven by provisionally priced copper marked near the year’s record prices; the embedded-derivative receivable from provisional pricing more than doubled, a large open volume of provisionally priced copper settles in the first half of 2026, and the year’s net sales benefited from a positive provisional-pricing adjustment where the prior year’s was negative. The mechanism is standard for the industry and properly disclosed — but it means a meaningful slice of the record year reverses mechanically if copper retraces through the settlement windows. Concentration of year-end receivables in the largest customer also rose.
Two further yellow-flagged items belong in the same earnings-quality frame. The asset-retirement-obligation estimate has now been revised downward two years running — principally at Buenavista, in a jurisdiction where the company itself notes no enacted closure law exists — with the revision credited to cost of goods sold each time; a portion of the reported cost improvement is therefore estimate-driven, not operational. And the auditor’s sole critical audit matter remains the capitalization of leachable material on leach pads, mainly in Mexico — a large, long-dated, judgment-intensive inventory balance whose recoverability rests on copper grade, solubility and recovery-rate assumptions; no adverse indicator surfaced this year, but a downward revision to those assumptions would charge a substantial asset to cost of sales.
Probability: High for the price-mark reversal mechanism operating in some degree (it is mechanical); Medium for a reversal large enough to dent reported results visibly | Timeframe: Immediate — H1 2026 settlement windows | Impact: A copper retracement would simultaneously reverse provisional-pricing gains, deflate the receivable, and compress margins on new sales — the same variable hitting revenue, working capital and earnings quality at once.
Social license and project execution in Peru — the growth plan’s single point of failure
sources The organic growth plan to 2033 runs disproportionately through Peruvian ground that has already proven contestable. Tia Maria — the flagship, targeted for 2027 start-up with heavy capital committed and construction well advanced — now faces a longer list of lawsuits seeking to nullify its environmental approval, its construction license, or the project itself, with new claims filed during the year; the company calls them meritless and cannot estimate the contingency. The forensic review adds a yellow flag: the year’s other-expense line includes an unexplained, unquantified write-off of certain Tia Maria expenses — a soft signal of scope or capitalization revisions in the same year management reports accelerating progress, and one the filing does not explain. The project’s region was the site of violent community opposition within recent memory, as was Cuajone in 2022, where protests blocked the railway and seized water facilities. Los Chancas, the next project in the queue, is currently blocked outright by illegal miners occupying the project area. Taxco in Mexico has been on strike since 2007.
Overlaying all of this is Peruvian political instability of an unusual intensity even by local standards: congressional removal of the president in late 2025, the impeachment of the interim successor within months, a transitional government, and general elections due in April 2026. A meaningful share of net sales and effectively all of the near-term growth pipeline depend on the post-election government’s posture toward large-scale mining, royalties and the rule of law. §
Probability: Medium for material Tia Maria delay or cost escalation; High for continued Los Chancas blockage | Timeframe: 1–2 years (Tia Maria to 2027; elections April 2026) | Impact: Delay converts committed capital into a non-earning asset and pushes out the production growth that justifies the elevated investment program; outright cancellation — the precedent the lawsuits seek — would force a write-down and gut the 2033 volume target.
Mexican fiscal and regulatory tightening — and a filing error on the company’s own tax rate
sources The forensic review identified a red-level contradiction between consecutive filings on the Mexican special mining duty: the prior-year 10-K disclosed an increase in the royalty rate effective January 1, 2025, while the FY2025 filing’s tax footnote describes the 2025 rate at the lower, pre-increase level with no explanation of any repeal — and the filing’s own tax-reconciliation dynamics do not cohere with a single stated rate. This has since been resolved externally against the enacting decree published in Mexico’s Diario Oficial de la Federación on December 19, 2024: the special mining duty in force from January 1, 2025 is 8.5%, the higher rate, and the FY2025 footnote’s reference to 7.5% is incorrect as a description of enacted law. Two implications follow. Substantively, the enacted burden on the Mexican operations is the heavier one — a recurring charge at the higher rate, alongside the doubled extraordinary duty on precious-metals receipts that the filing does disclose correctly. And as a governance observation, a misstatement of the company’s own statutory royalty rate in the audited tax footnote — on a nine-figure annual charge — is a disclosure-quality lapse that should temper the reader’s confidence in the precision of Note-level tax disclosure generally.
The royalty sits within a broader tightening trend: the recent Mining Law amendments shortened concession terms, added water-use conditions, closure and remediation guarantees, and a contribution from new projects’ earnings to indigenous communities — changes now under Supreme Court review, with the company expecting no negative impact, a characterization that is management’s view rather than a settled outcome. A constitutional reform introducing popular election of judges creates effects on the judicial system the company itself says cannot currently be determined, and drug-related violence has disrupted commercial logistics in certain states, so far with limited operational impact. In Peru, new progressive-closure guarantee regulation opens a multi-year window that could raise funding requirements. §
Probability: High that the fiscal direction in both jurisdictions remains tighter; Low–Medium for a further step-change within the forecast horizon | Timeframe: Immediate (the higher royalty is already enacted) to 3–5 years (mining-law litigation, judicial reform) | Impact: The royalty operates as a permanent margin haircut on the Mexican segments — the larger half of the asset base — and the correct, higher rate must flow through any forward tax and cash-flow modeling; the valuation in Sections 4 and 6 uses the verified enacted rate.
2.2 Upside Catalysts
sources The catalyst picture is thinner than the risk picture, and that asymmetry should be stated plainly: five identified risks against three catalysts, of which only one is a discrete, dateable event. The catalysts are real — one is already in the run-rate — but they are operational and macro in nature, not binary re-rating events, and the largest of them (Tia Maria) is simultaneously the locus of the fourth risk above.
Tia Maria commissioning — the first new production unit in years
sources Construction is advancing after a decade of delay: earthworks, access infrastructure, the electrical substation and transmission line are progressing, and management targets operations in 2027. As a low-cost SX-EW cathode operation with desalinated process water, Tia Maria would add copper volume precisely where the existing Peruvian pits are losing it to grade decline — converting the heaviest line in the capital program into earning assets and validating, for the first time since the project’s permitting ordeal began, the company’s ability to deliver a greenfield project in Peru. Successful delivery would also materially de-risk the rest of the Peruvian pipeline in the market’s eyes, since the binding constraint on Los Chancas and Michiquillay is precedent as much as capital. §
Probability: Medium-High for start-up broadly on the 2027 timeline | Timeframe: 1–2 years | Monitoring trigger: Quarterly construction-progress disclosures; resolution of the pending nullification lawsuits; any recurrence of community disruption in Islay province; explanation of the unquantified project write-off in subsequent filings.
The by-product engine — zinc, molybdenum and silver compressing net cash cost
sources This catalyst is already materializing and has room to run. The Buenavista zinc concentrator operated at full capacity in its first complete year, driving zinc output sharply higher; molybdenum and silver production rose across most operations; and the net unit cash cost of copper fell sharply as by-product credits absorbed fixed costs. The structural point is that by-product revenue diversifies the cash-cost position even though it does not diversify commodity exposure: every dollar of by-product credit pushes the company further down the copper cost curve, widening trough-cycle survivability and peak-cycle conversion. Management’s production guidance for the coming year points to continued by-product strength even as copper grades soften.
Probability: High (the assets are built and running) | Timeframe: Immediate and ongoing | Monitoring trigger: Quarterly by-product volumes and the net cash-cost-per-pound trend; zinc and molybdenum prices, which determine how much of the volume gain reaches the credit line.
Copper market deficit and structurally tight inventories
sources Management estimates a copper market deficit for the coming year, with global inventories covering only days of demand, against a demand backdrop structurally supported by electrification and the energy transition — a dynamic the filing itself highlights, alongside rising buyer preference for responsibly certified copper, which the company has pledged to deliver across its entire production. For the lowest-cost producers, a deficit market is the highest-leverage environment available: price strength flows through a cost base that is simultaneously being compressed by the by-product engine. The honest caveat is that this catalyst is entirely outside the company’s control, is already partly reflected in the near-record prices at which the year ended, and is the mirror image of Risk 3 — the same provisional-pricing mechanism that poses reversal risk would extend gains if tightness persists.
Probability: Medium (deficit forecasts are management’s view of a notoriously cyclical market) | Timeframe: Immediate to 1–2 years | Monitoring trigger: Exchange inventory levels; Chinese refined-copper demand indicators; the trajectory of U.S. tariff policy on copper products, which the filing flags as a live volatility channel in both directions.
2.3 Risk & Catalyst Summary
sources | # | Item | Type | Probability | Timeframe | Status | Monitoring Trigger | |—|—|—|—|—|—|—| | 1 | Grupo Mexico related-party economics and controlled-board discretion | Risk | High | Immediate / continuous | Active | Related-party purchase and payable trends in each 10-K; further discretionary payments approved by the board; pension allocation to parent shares | | 2 | Peruvian labor-shares litigation (Garcia Ataucuri enforcement) | Risk | Medium | Immediate (rulings due 2026) | Active | Superior Court and constitutional appeal rulings in Lima during 2026 | | 3 | Copper price reversal amplified by provisional-pricing marks; estimate-driven cost credits | Risk | Medium-High | Immediate (H1 2026 settlements) | Active | Q1–Q2 2026 provisional-pricing settlement effects; receivable balance; any further ARO credits or leach-pad assumption changes | | 4 | Peruvian social license and project execution (Tia Maria, Los Chancas, elections) | Risk | Medium | 1–2 years | Active | Tia Maria lawsuit outcomes and construction milestones; Los Chancas site control; April 2026 election result and mining policy of the incoming government | | 5 | Mexican fiscal and regulatory tightening; royalty-rate disclosure error | Risk | High (enacted) | Immediate to 3–5 years | Active | FY2026 10-K correction of the royalty disclosure; Supreme Court ruling on Mining Law amendments; judicial-reform implementation | | 6 | Tia Maria commissioning toward 2027 start-up | Catalyst | Medium-High | 1–2 years | Monitoring | Construction progress disclosures; legal docket; community relations in Islay | | 7 | By-product engine compressing net cash cost | Catalyst | High | Immediate / ongoing | Active | Quarterly by-product volumes and net cash-cost trend | | 8 | Copper market deficit and tight inventories | Catalyst | Medium | Immediate to 1–2 years | Monitoring | Exchange inventories; Chinese demand; U.S. tariff developments |
2.4 Risk Interdependencies
sources These risks do not sit in separate compartments — they share transmission channels, and the governance risk sits upstream of all of them. A copper price retracement is the single most connective event: it would mechanically reverse the provisional-pricing gains and deflate the receivable (Risk 3), arrive precisely as the capital program peaks into Tia Maria’s final construction phase (Risk 4), and squeeze the cash flow from which both the parent-bound dividend and the affiliate purchases are funded — at which point the filing’s own warning that a stressed parent could extract loans, higher dividends or other funding (Risk 1) stops being theoretical. The Peruvian channel compounds separately: the April 2026 election determines, through one outcome, the judicial and political environment in which the labor-shares appeals are decided (Risk 2), the social-license climate around Tia Maria and Los Chancas (Risk 4), and the durability of the fiscal regime applied to the Peruvian Branch. A populist outcome would not trigger one risk — it would re-price three at once. On the Mexican side, the enacted higher royalty, the Sonora contribution, related-party power pricing and any leach-pad or ARO assumption reversals all land on the same segment income statements, meaning the Mexican open-pit economics could deteriorate through four independent doors simultaneously. The deepest interdependency, however, is structural: because minority shareholders cannot influence the board’s response to any of these events, every risk on this list is borne without the standard mitigant of shareholder pressure. Governance is not the fifth risk — it is the multiplier on the other four.
2.5 ESG & Regulatory Exposure
sources The ESG profile is genuinely two-sided, and both sides are specific to this filing. On the credit side: the company reports a meaningful reduction in lost-time injuries versus the prior year, running well below the comparable U.S. industry benchmark; its open-pit mines in both countries hold The Copper Mark accreditation including compliance with the ICMM Global Industry Standard on Tailings Management, with a new internal tailings-review committee; clean-energy certificates indicate the Peruvian operations’ electricity was fully renewable, meeting the company’s target ahead of schedule; sustainability ratings improved, including continued index inclusion; and the company has pledged certification of its entire copper production under international responsible-sourcing standards — directly relevant given the filing’s observation that buyers increasingly demand responsibly sourced copper. The social architecture around Tia Maria — education, healthcare, supplier development, large-scale infrastructure through Peru’s Works for Taxes mechanism, a grievance mechanism at all sites and a UN-guided human rights due diligence process — is the company’s explicit answer to its most expensive historical ESG failure: lost years of project delay.
On the debit side, the same filing records workforce fatalities during the year; a tailings-dam risk disclosure that is candid about catastrophic potential; a legacy environmental docket including dozens of pending civil, collective and constitutional actions from the 2014 Buenavista spill (all characterized by the company as without merit and immaterial in aggregate — its view, not a settled outcome); the Guaymas terminal acid-spill matter approaching restart; and the unresolved Taxco strike, now old enough that it functions as a standing illustration of labor-relations failure at one unit even as Peru’s long-term no-stoppage agreements demonstrate the opposite. Two ESG items also loop back into governance: the renewable power earning the company its climate progress is purchased from Grupo Mexico affiliates under long-dated contracts whose pricing is not independently benchmarked, and the Sonora “solidarity contribution” blurs the line between community investment and parent-aligned political spending.
The regulatory exposure map is concentrated and live: the enacted higher Mexican mining royalty (with the filing’s own erroneous disclosure of it); the Mining Law amendments under Supreme Court review; Mexican judicial reform with effects the company says cannot be determined; Peru’s progressive-closure guarantee regulation opening a funding-requirement window; the April 2026 Peruvian elections; and U.S. tariff policy on copper products, which the filing links directly to volatility in both its product prices and its stock. None of these is generic sector backdrop — each attaches to a specific disclosure in this 10-K, and each carries a date or docket on which it can be monitored.
Section 3 — Financial Analysis & Historical Performance
sources
Three-Statement Linkage Confirmation: - Net Income ties (Income Statement → Cash Flow Statement): confirmed via the recalculated workbook. Net income throughout this section is income attributable to Southern Copper Corporation (i.e., net of the non-controlling interest in subsidiaries), consistent with the figure that opens the consolidated cash flow statement reconciliation. - Cash ties (Balance Sheet → Cash Flow Statement): confirmed via the recalculated workbook — year-end cash and equivalents on the balance sheet agree with the ending cash position of the cash flow statement in each year presented. - Retained Earnings reconciliation (Beg RE + NI − Dividends = End RE): confirmed via the recalculated workbook, noting that distributions include both cash dividends and the stock dividends paid from treasury shares beginning in 2024, both of which are charged against retained earnings. This is why retained earnings decline across the period even as the company earns record profits — a capital-return artifact, not an operating one, and it is analyzed in 3.2B.
3.1A Income Statement
sources | | FY2021 | FY2022 | FY2023 | FY2024 | FY2025 | |—|—|—|—|—|—| | Revenue ($M) | 10,934.1M | 10,047.9M | 9,895.8M | 11,433.4M | 13,420.0M | | YoY Growth | 36.9% | -8.1% | -1.5% | 15.5% | 17.4% | | Cost of Goods Sold ($M) | 3,894.4M | 4,649.1M | 4,687.7M | 4,841.4M | 5,359.2M | | Gross Profit ($M) | 7,039.7M | 5,398.8M | 5,208.1M | 6,592.0M | 8,060.8M | | Gross Margin | 64.4% | 53.7% | 52.6% | 57.7% | 60.1% | | D&A ($M) | 806.0M | 796.3M | 833.6M | 845.9M | 868.4M | | EBITDA ($M) | 6,871.1M | 5,232.1M | 5,025.9M | 6,400.6M | 7,870.1M | | EBITDA Margin | 62.8% | 52.1% | 50.8% | 56.0% | 58.6% | | EBITDA Growth | 76.4% | -23.9% | -3.9% | 27.4% | 23.0% | | EBIT ($M) | 6,065.1M | 4,435.8M | 4,192.3M | 5,554.7M | 7,001.7M | | EBIT Margin | 55.5% | 44.1% | 42.4% | 48.6% | 52.2% | | Interest Expense ($M) | 387.9M | 387.1M | 376.3M | 376.5M | 416.7M | | Pre-Tax Income ($M) | 5,696.8M | 4,247.8M | 3,955.8M | 5,357.4M | 6,784.3M | | Tax Expense ($M) | 2,299.2M | 1,596.1M | 1,518.9M | 1,975.3M | 2,470.1M | | Effective Tax Rate | 40.4% | 37.6% | 38.4% | 36.9% | 36.4% | | Net Income ($M) | 3,397.1M | 2,638.5M | 2,425.2M | 3,376.8M | 4,334.9M | | Net Margin | 31.1% | 26.3% | 24.5% | 29.5% | 32.3% | | Net Income Growth | 116.4% | -22.3% | -8.1% | 39.2% | 28.4% | | Diluted EPS | $4.39 | $3.41 | $3.05 | $4.21 | $5.24 | | EPS Growth | 116.3% | -22.3% | -10.6% | 38.0% | 24.5% | | Diluted Shares (M) | 773 | 773 | 795 | 803 | 827 |
Source: Southern Copper Corporation Form 10-K filings, consolidated statements of operations, FY2021–FY2025, as compiled in the verified workbook. Net income is attributable to Southern Copper Corporation. Per-share basis note: FY2023–FY2025 per-share figures and share counts are retroactively adjusted for the stock dividends paid since 2024, per the FY2025 10-K; FY2021–FY2022 figures are as printed in the original filings on a pre-stock-dividend basis and are not directly comparable with FY2023–FY2025. EPS growth rates and any EPS or share-count CAGR spanning the FY2022→FY2023 boundary therefore mix the two bases.
CAGR Summary
| Metric | 3Y CAGR | 5Y CAGR | 10Y CAGR |
|---|---|---|---|
| Revenue | 10.1% | 10.9% | 10.3% |
| EBITDA | 14.6% | 15.1% | 15.1% |
| Net Income | 18.0% | 22.5% | 19.4% |
| Diluted EPS | 15.4% | 20.9% | — |
| FCF | 22.7% | 9.3% | — |
Source: verified workbook (SCCO_Portfolio.xlsx), figures traceable via lineage.json to the cited filings.
3.1B Income Statement — Analysis
sources The revenue story is a price story with a volume kicker — and the volume is not copper. The five-year arc traces a full commodity cycle: the FY2021 copper price surge produced 36.9% growth to 10,934.1M, the FY2022–FY2023 retracement took revenue down -8.1% and then -1.5% to a trough of 9,895.8M, and the recovery delivered record net sales of 11,433.4M and then 13,420.0M. The composition of the FY2025 record matters more than its size. Management attributes it to higher sales volumes of molybdenum, zinc and silver, higher prices for copper, silver, molybdenum and zinc, and upward adjustments on provisionally priced sales — while copper mine production itself declined modestly on lower ore grades at Toquepala, Cuajone and Buenavista, where the new concentrator was dedicated to zinc. In other words, the record year rests on price and by-product volume, not copper volume. That distinction is structurally important: the by-product volume gain (principally the Buenavista zinc concentrator running at full capacity in its first complete year) is durable and compounds, whereas the price component — including the provisional-pricing mark discussed below — reverses with the commodity cycle. The 10.9% five-year revenue CAGR should accordingly be read as a cycle-amplified figure measured trough-to-peak, not a sustainable organic growth rate.
Margins are recovering toward — but have not regained — the FY2021 cycle peak, and not all of the recovery is operational. Gross margin traced the cycle from 64.4% at the FY2021 peak down to 52.6% at the trough and back to 60.1%, with EBITDA margin following the same path from 62.8% to 50.8% to 58.6%. The mechanism is classic mining operating leverage: cost of sales grew from 3,894.4M to 5,359.2M across the period — a steady grind higher through both halves of the cycle, driven by workers’ participation (profit-linked, so partly self-correcting), purchased copper, repair materials, energy and exchange-rate effects — while revenue swung far more violently around it. The margin recovery since FY2023 is therefore predominantly a revenue-side, cyclical phenomenon, with one genuine structural assist: by-product revenue from zinc, molybdenum and silver, which cut the net unit cash cost of copper sharply and pushes the company further down the industry cost curve. Two cautions temper the headline margin, both from the forensic review and developed under Quality of Earnings below: recurring asset-retirement-obligation estimate credits flattered cost of sales in both FY2024 and FY2025, and part of the FY2025 revenue line is a mark-to-market on unsettled copper.
Major Movers
-
Metal prices and the provisional-pricing swing — cyclical, and partly unsettled. The single largest driver of the 17.4% top-line gain was price, and within it the swing on provisionally priced sales: FY2025 net sales include a positive provisional-pricing adjustment where the prior year’s was negative, with copper marked near the year’s record price on volumes settling January–June 2026. This is standard industry mechanics, properly disclosed — but it means a slice of the record revenue and the associated receivable is a price mark, not settled cash, and it reverses mechanically if copper retraces through the settlement windows. Historically this is exactly the pattern of FY2021→FY2022, when revenue fell -8.1% as the price peak unwound.
-
The Buenavista zinc concentrator and the by-product engine — structural. Zinc production rose sharply on the concentrator’s first full year at capacity, and molybdenum and silver output increased across most operations. This is the one component of the FY2025 record that does not depend on the copper price: it adds volume, diversifies the revenue mix, and — through by-product credits — drove the sharp fall in net unit cash cost even as the gross cash cost per pound rose slightly on lower copper production. It is the principal reason EBITDA of 7,870.1M now exceeds the FY2021 cycle-peak level of 6,871.1M despite lower copper output.
-
Cost-of-sales inflation, including a growing related-party component — partly structural. COGS rose from 4,841.4M to 5,359.2M, led by workers’ participation, purchased copper, repair materials, sales expenses, exchange-rate effects and energy. The forensic review flags, at red level, that a material and growing share of this cost base flows to Grupo Mexico affiliates — captive power for the Mexican operations under long-dated contracts with parent-owned generators, rail freight, construction, services, and metal purchases from sister company Asarco that rose by an order of magnitude — with affiliate purchases growing faster than revenue and no independent benchmarking of pricing disclosed. For the income statement, the implication is that a portion of the cost structure is priced inside the controlled group and is unverifiable as arm’s-length from the filing; minority holders bear it pro-rata.
-
ARO estimate credits to cost of sales — non-operational and recurring in the same direction. The forensic review flags, at yellow level, that updates to Mexican mine-closure estimates (mainly the Buenavista life-of-mine update) produced a credit to cost of goods sold in FY2025, following a similar and slightly larger credit in FY2024, with a further small Peruvian credit in late 2025 — in a jurisdiction where, by the company’s own disclosure, no enacted law requires closure, so the obligation rests heavily on management estimates. A change in estimate that recurs in the same direction, two years running, at the same unit, argues for treating a portion of the reported cost improvement as accounting rather than operations when extrapolating the margin trend.
-
The tax line — structurally heavy, and with an unresolved disclosure contradiction. The effective tax rate has sat far above the U.S. federal statutory rate throughout the period (40.4% at the FY2021 peak, 36.4% in FY2025), driven by Peruvian and Mexican rate differentials, mining royalties, the special mining tax and non-deductible interest. The forensic review (yellow) is explicit that this burden is structural, not transient: the U.S. foreign-tax-credit carryforward carries a full valuation allowance that grew again in 2025, with management itself stating the excess credits are unlikely ever to be used — so double taxation is not relieved in practice and the full blended rate is the right modeling input. Compounding this, the forensic review identified a red-level contradiction between consecutive filings on the Mexican mining royalty rate — the FY2025 tax footnote describes a 2025 rate below the increase the FY2024 filing disclosed as enacted, with no explanation, and the filing’s internal tax-reconciliation dynamics do not cohere with a single stated rate. As established in Section 2, external verification against the enacting decree resolves the contradiction in favor of the higher rate; the point for this section is that a misstatement of the company’s own statutory royalty rate, in the audited tax footnote, on a nine-figure recurring charge, is a disclosure-quality lapse that should temper confidence in Note-level tax precision generally.
Quality of earnings. Beyond the ARO credits and the provisional-pricing mark already covered, three further items condition the FY2025 result. First, non-operating results deteriorated on a swing in other income that included an unquantified write-off of certain Tia Maria project expenses (versus an insurance recovery the prior year) — flagged by the forensic review as a soft signal of scope or capitalization revisions the filing does not explain — plus higher interest expense following Minera Mexico’s February 2025 note issuance (interest expense rose from 376.5M to 416.7M), partially offset by higher interest income on the enlarged cash balance. Second, the auditor’s sole critical audit matter remains the capitalization of leachable material on Mexican leach pads — a large, judgment-intensive balance whose recoverability rests on grade, solubility and recovery assumptions; no adverse indicator surfaced this year, but a downward revision would charge a substantial asset to cost of sales. Third, on a per-share basis, the record is diluted in transit: stock dividends paid from treasury shares have grown the diluted count from 795M to 827M in two years, so EPS of $5.24 grew 24.5% against net income growth of 28.4% — a roughly four-point annual drag that is policy-driven and ongoing.
⚠ Items to Watch. If gross margin falls back below the 52.6% trough level, the cyclical margin recovery has fully reversed and the by-product cost cushion has been overwhelmed — trough-cycle earnings assumptions would need rebasing. If the effective tax rate rises above the 40.4% FY2021 level, the Mexican royalty escalation is biting harder than the structural mid-30s base and forward FCF modeling must be re-cut. If FY2026 interim filings show a negative provisional-pricing adjustment, quantify it against the 17.4% FY2025 growth print before annualizing any revenue trend. And EPS growth persistently lagging net income growth by more than the current gap (compare 24.5% vs 28.4%) would indicate the stock-dividend dilution is accelerating as treasury shares deplete.
3.2A Balance Sheet
sources | | FY2021 | FY2022 | FY2023 | FY2024 | FY2025 | |—|—|—|—|—|—| | ASSETS | | | | | | | Cash & Equivalents ($M) | 3,002.0M | 2,069.7M | 1,151.5M | 3,258.1M | 4,304.6M | | Receivables ($M) | 1,358.7M | 1,394.1M | 1,141.1M | 1,189.6M | 1,951.2M | | Inventory ($M) | 972.9M | 1,014.0M | 1,016.9M | 1,048.9M | 1,058.1M | | Total Current Assets ($M) | 6,139.6M | 5,188.0M | 4,429.5M | 6,174.3M | 8,352.5M | | PP&E, net ($M) | 9,464.4M | 9,597.0M | 9,782.9M | 9,883.3M | 10,272.2M | | Goodwill & Intangibles ($M) | 138.1M | 135.0M | 130.2M | 124.6M | 122.4M | | Total Assets ($M) | 18,297.6M | 17,277.0M | 16,725.3M | 18,713.5M | 21,381.4M | | LIABILITIES & EQUITY | | | | | | | Short-term Debt ($M) | 299.7M | 0.0M | 0.0M | 499.8M | 0.0M | | Total Current Liabilities ($M) | 2,250.0M | 1,236.0M | 1,388.5M | 2,248.1M | 2,145.1M | | Long-term Debt ($M) | 6,247.9M | 6,251.0M | 6,254.6M | 5,758.5M | 6,750.7M | | Total Debt ($M) | 6,547.6M | 6,251.0M | 6,254.6M | 6,258.3M | 6,750.7M | | Net Debt ($M) | 3,545.6M | 4,181.3M | 5,103.1M | 3,000.2M | 2,446.1M | | Total Liabilities ($M) | 10,089.8M | 9,130.8M | 9,244.1M | 9,475.3M | 10,276.5M | | Shareholders’ Equity ($M) | 8,149.2M | 8,084.2M | 7,418.1M | 9,171.6M | 11,038.1M | | Retained Earnings ($M) | 7,769.7M | 7,702.0M | 7,033.5M | 6,839.6M | 5,797.2M | | Key Ratios | | | | | | | Current Ratio | 2.7x | 4.2x | 3.2x | 2.7x | 3.9x | | Net Debt / EBITDA | 0.5x | 0.8x | 1.0x | 0.5x | 0.3x | | Debt / Equity | 0.8x | 0.8x | 0.8x | 0.7x | 0.6x | | Book Value / Share | $10.54 | $10.46 | $9.33 | $11.42 | $13.35 |
Source: Southern Copper Corporation Form 10-K filings, consolidated balance sheets, FY2021–FY2025, as compiled in the verified workbook. Short-term debt of zero in FY2023 and FY2025 reflects the balance sheet as printed — no current portion of long-term debt was outstanding at those year-ends.
3.2B Balance Sheet — Analysis
sources Asset composition: a capital-intensive organic story, with one judgment-heavy balance inside it. This is a miner’s balance sheet built by drilling, not dealmaking: PP&E of 10,272.2M is the largest asset, goodwill and intangibles are immaterial at 122.4M and shrinking, and the asset base has grown from 16,725.3M to 21,381.4M over two years almost entirely through retained cash and capital projects. The most consequential change is liquidity: cash and equivalents rebuilt from a trough of 1,151.5M to 4,304.6M — a deliberate war chest, since the company carries no committed revolver and management explicitly rests its liquidity plan on cash on hand and internally generated funds. One asset deserves standing scrutiny: the long-term ore-stockpiles-on-leach-pads balance, the auditor’s sole critical audit matter for a second consecutive year, whose carrying value depends on copper grade, solubility-index and recovery-rate estimates. In 2025 consumption slightly exceeded additions, so the balance edged down — no adverse signal, but it remains the single highest-judgment account on this balance sheet and a multi-hundred-million-dollar charge to cost of sales if recovery assumptions are cut.
Leverage: gross debt static, net leverage melting, structure clean — with one typographical caveat. Total debt has been essentially flat for five years (6,547.6M to 6,750.7M); the deleveraging is entirely a cash phenomenon, with net debt falling from a 5,103.1M peak to 2,446.1M and Net Debt/EBITDA from 1.0x to 0.3x. The forensic review’s structural assessment is favorable: all debt is USD fixed-rate, the April 2025 maturity was repaid and only a small Yankee bond tranche matures within five years, the single disclosed financial maintenance covenant was met with very wide headroom, the new Minera Mexico 2032 notes are rated investment grade by all three agencies, and no cross-defaults, restricted cash or borrowing-base facilities are disclosed. Refinancing and covenant risk is minimal at current profitability — the trade-off, again, is that with no revolver, liquidity is the cash balance. One disclosure-quality note from the forensic review: the filing states two different coupons for the new 2032 notes in the debt table versus the narrative — a typographical error inside the filing that the verified workbook resolves in favor of the narrative rate, but a second instance (after the royalty-rate contradiction) of imprecision in audited note disclosure. This trajectory is consistent with management’s stated priority of a prudent capital structure; the question raised in Section 2 — whether the growing cash pile is also an attractive resource for a controlling parent with funding needs — is a governance question, not a credit one.
Working capital: the receivables build is the flag, and it is a price mark, not a collection problem. Receivables jumped from 1,189.6M to 1,951.2M — growth several times the 17.4% revenue growth rate — concentrated in the Mexican open-pit segment, and the forensic review (yellow) traces it to provisionally priced copper marked near the year’s record price, with the embedded-derivative receivable more than doubling and the largest customer’s share of year-end receivables rising markedly. DSO accordingly stretched from 37 days to 43 days. The right reading is earnings-quality, not credit-quality: if copper retraces through the H1 2026 settlement windows, the receivable deflates and the associated revenue reverses. Outside this item, working capital discipline is genuinely improving — the cash conversion cycle has tightened from 75 days in FY2021 to 64 days, inventory is essentially flat at 1,058.1M against a much larger revenue base, and the current ratio of 3.9x is ample. Separately, note the optics of retained earnings falling from 7,769.7M to 5,797.2M across five record-profit years: this is the arithmetic of cash dividends plus stock dividends charged against retained earnings, not accumulated losses — but it does mean the equity base is being rebuilt through paid-in capital mechanics rather than retention, and at the current distribution pace the treasury-share pool funding stock dividends depletes within a few years.
⚠ Items to Watch. If Net Debt/EBITDA returns above the 1.0x FY2023 peak, the deleveraging narrative has reversed — most plausibly through a copper downturn coinciding with the enlarged capital program — and the absence of a committed revolver becomes a live constraint rather than a footnote. If DSO holds above the FY2022 level of 50 days after the H1 2026 provisional-pricing settlements wash through, the receivables build is no longer explainable by price marks and demands customer-credit scrutiny, particularly given the rising single-customer concentration. And if cash falls back toward the 1,151.5M FY2023 trough while the dividend is maintained, the liquidity buffer that substitutes for a revolver is being spent.
3.3A Cash Flow Statement
sources | | FY2021 | FY2022 | FY2023 | FY2024 | FY2025 | |—|—|—|—|—|—| | Cash from Operations ($M) | 4,292.4M | 2,802.5M | 3,573.1M | 4,421.7M | 4,752.1M | | Capital Expenditures ($M) | -892.3M | -948.5M | -1,008.6M | -1,027.3M | -1,325.3M | | Free Cash Flow ($M) | 3,400.1M | 1,854.0M | 2,564.5M | 3,394.4M | 3,426.8M | | FCF Margin | 31.1% | 18.5% | 25.9% | 29.7% | 25.5% | | FCF / Share | $4.40 | $2.40 | $3.22 | $4.23 | $4.15 | | FCF Conversion (FCF/NI) | 100.1% | 70.3% | 105.7% | 100.5% | 79.1% | | CapEx / Revenue | 8.2% | 9.4% | 10.2% | 9.0% | 9.9% | | CapEx / D&A | 1.1x | 1.2x | 1.2x | 1.2x | 1.5x | | Dividends Paid ($M) | -2,473.8M | -2,705.8M | -3,092.4M | -1,637.2M | -2,485.1M | | Share Repurchases ($M) | — | — | — | — | — |
Source: Southern Copper Corporation Form 10-K filings, consolidated statements of cash flows, FY2021–FY2025, as compiled in the verified workbook. The share repurchase program has registered no activity since 2016; quarterly stock dividends paid from treasury shares since 2024 are a non-cash distribution and do not appear in this table.
3.3B Cash Flow — Analysis
sources Operating cash flow is genuinely strong, but FY2025 conversion tells you where the earnings quality sits. Cash from operations reached a record 4,752.1M, capping a recovery from the 2,802.5M FY2022 trough, and across the five years FCF conversion has averaged near or above 100% — the signature of a low-cost producer with real cash earnings. The FY2025 wrinkle is instructive: conversion fell to 79.1% from 100.5% even as net income rose 28.4%. The cash went two places, and both are identifiable. First, the working-capital drag from the provisionally priced receivables build documented in 3.2B — earnings recognized at marked prices that have not yet settled into cash; if copper holds, the cash arrives in H1 2026, and if it doesn’t, the earnings partially reverse. Second, the deliberate step-up in capital spending. Neither is a red flag in isolation; together they mean FY2025’s record net income overstates FY2025’s spendable cash by a wider margin than in the prior two years.
CapEx: the harvest period is over. Capital expenditure rose from -1,027.3M to -1,325.3M, taking CapEx/D&A from 1.2x to 1.5x — comfortably in growth-investment territory and the highest of the five years. The filing identifies where it went: the new tailings deposit and concentrator at Buenavista, IMMSA mine development, and the ramp-up of Tia Maria and Los Chancas spending in Peru, with the Board approving a substantially larger program for the coming year centered on Tia Maria and El Pilar. The filing does not split maintenance from growth CapEx, but the trajectory and project list make the inference safe: the company is funding the 2033 volume plan, and investment intensity (CapEx/Revenue of 9.9%) will rise before it falls. The asterisk, per the forensic review, is the unquantified write-off of certain Tia Maria expenses in the same year management reports roughly a quarter of construction complete — unexplained in the filing, and worth a direct question to management, because capitalization discipline on the flagship project is precisely what the enlarged budget will test.
Capital allocation: a dividend machine with no second gear. Over the five years, cash dividends — -2,473.8M, -2,705.8M, -3,092.4M, -1,637.2M, -2,485.1M — absorbed the large majority of cumulative free cash flow, with payout ratios swinging from 48.5% at the FY2024 low to above-earnings levels of 102.6% and 127.5% in the trough years, when the company paid out more than it earned and ran down cash to do it. Buybacks are nonexistent — dormant since 2016, with the remaining authorization covering a trivial number of shares at the current price — and since 2024 the company has layered quarterly stock dividends on top, growing the share count rather than shrinking it. Whether this mix fits the opportunity set is the central capital-allocation question: a company guiding to substantially higher copper volume by 2033, with an enlarged capital program, is simultaneously distributing most of its free cash — and, as the forensic review (red) underscores, the overwhelming share of every cash dividend flows to Grupo Mexico, holder of a super-majority of the stock, consistent with the filing’s own risk-factor language about parent funding needs. The same lens applies to the post-year-end item flagged at yellow: a Board-approved voluntary contribution of meaningful size to government programs in Sonora, Mexico — discretionary, not approved by minority holders, disclosed under commitments rather than subsequent events, and a direct FY2026 claim on cash that benefits the controlling group’s broader operating relationships. The distribution policy, in short, is set by and for the parent; minority holders ride along.
⚠ Items to Watch. If FCF conversion stays below the 70.3% FY2022 trough level for a second consecutive year, cash generation is structurally lagging reported earnings rather than timing-lagging them, and the dividend is being funded from the balance sheet. If the payout ratio returns above the 127.5% FY2023 level while the enlarged capital program is running, something must give — the dividend, the program, or the cash buffer. And if CapEx/Revenue rises materially beyond 9.9% without commensurate Tia Maria progress disclosure, capital intensity is escalating faster than project delivery.
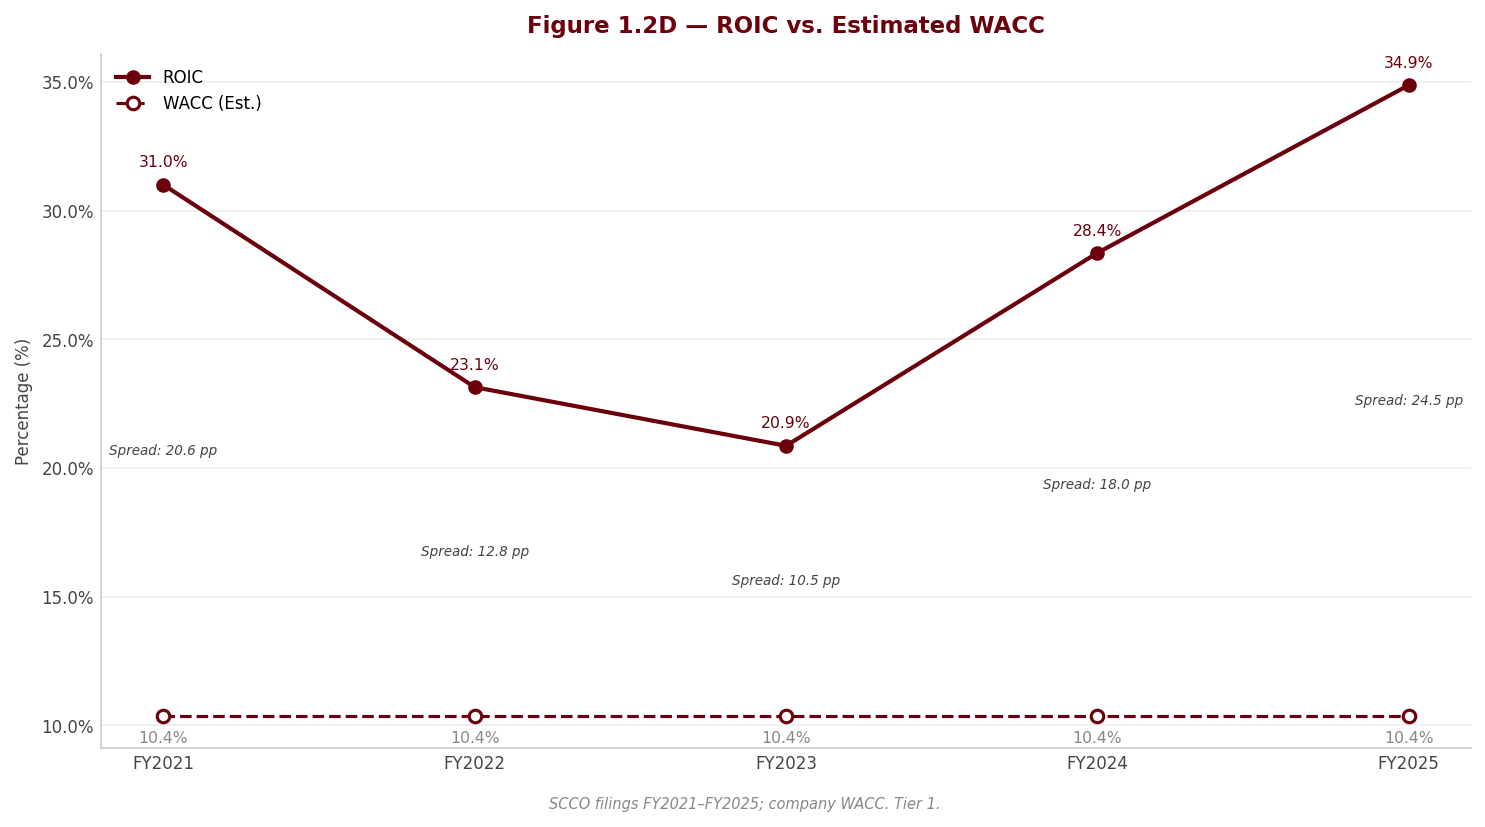
3.4 Returns Analysis
sources | | FY2021 | FY2022 | FY2023 | FY2024 | FY2025 | |—|—|—|—|—|—| | ROIC | 31.1% | 23.1% | 20.8% | 28.4% | 34.7% | | ROE | 44.2% | 32.5% | 31.3% | 40.7% | 42.9% | | ROA | 19.3% | 14.8% | 14.3% | 19.1% | 21.6% | | Interest Coverage | 15.6x | 11.5x | 11.1x | 14.8x | 16.8x |
ROIC is the headline finding of this section: at 34.7%, returns on invested capital sit far above any plausible cost of capital for a Latin American miner — the WACC derived in Section 4 will quantify the spread, but no defensible discount rate approaches this level — and critically, even the FY2023 cyclical trough of 20.8% would clear the hurdle comfortably. That trough reading is the more analytically important number: it says the value-creation spread survives the bottom of the copper cycle, which is the direct financial expression of the bottom-quartile cost position described in Section 1. The driver of the spread is the by-product-subsidized cash cost — the company earns a structurally wide gross margin on a price it does not set — and the FY2023→FY2025 expansion from 20.8% to 34.7% is mostly the copper price plus the zinc concentrator, on an invested-capital base that grew only modestly. Two qualifications carry over from earlier subsections: the FY2025 numerator includes the provisional-pricing mark and ARO credits discussed in 3.1B, so the true run-rate ROIC is somewhat below the printed peak; and the enlarged capital program will grow the denominator ahead of the revenue it generates, mechanically compressing ROIC through 2027 even in a flat price environment — a timing effect, not an impairment of the franchise, provided Tia Maria delivers.
The DuPont decomposition shows ROE of 42.9% built as net margin of 32.3% × asset turnover of 0.67x × an equity multiplier of 1.98x. The structure is unambiguous: margin is both the level driver and the swing factor. Asset turnover is low and stable — the physics of a capital-intensive miner, ranging only between 0.56x and 0.67x across the cycle — and the equity multiplier has declined from 2.29x to 1.98x as cash built and equity grew, meaning leverage is subtracting from, not propping up, the ROE trend. An ROE of this magnitude achieved with falling leverage and flat turnover is entirely a margin phenomenon — which is to say, entirely a commodity-price-times-cost-position phenomenon. The practical read-through: model ROE off the copper price deck and the cash-cost curve; the other two DuPont legs are near-constants. Interest coverage of 16.8x — against a fixed-rate, long-dated debt stack — confirms that the capital structure is nowhere near constraining returns.
Source: verified workbook (SCCO_Portfolio.xlsx), figures traceable via lineage.json to the cited filings.
3.5 Altman Z-Score (Most Recent FY)
sources | Component | FY2023 | FY2024 | FY2025 | |—|—|—|—| | X1 (Working Capital / Total Assets) | 0.182 | 0.210 | 0.290 | | X2 (Retained Earnings / Total Assets) | 0.421 | 0.365 | 0.271 | | X3 (EBIT / Total Assets) | 0.251 | 0.297 | 0.327 | | X4 (Equity / Total Liabilities) | 0.802 | 0.968 | 1.074 | | X5 (Revenue / Total Assets) | 0.592 | 0.611 | 0.628 | | Z-Score | 2.71 | 2.93 | 3.08 | | Zone | Gray | Gray | Safe |
The Z-Score of 3.08 crosses back into the safe zone in FY2025 after two years in the upper gray zone (2.71 in FY2023, 2.93 in FY2024), and the trend is moving decisively away from the boundary. The component detail matters more than the headline, because the gray-zone readings were never a distress signal: the soft component throughout is X2 (retained earnings to assets), which is falling — 0.421 to 0.271 — purely because the dividend and stock-dividend policy charges distributions against retained earnings faster than income replenishes them, the capital-return artifact established in 3.2B. Every operating and solvency component is strengthening: X1 (liquidity) rose to 0.290 on the cash build, X3 (asset profitability) to 0.327, and X4 (equity cushion) to 1.074. Read alongside the fixed-rate post-2030 maturity wall, the wide covenant headroom and 16.8x interest coverage, the credit picture is unambiguous: bankruptcy-model risk is not a live concern for this issuer, and the FY2023–FY2024 gray readings were the model penalizing a distribution policy, not detecting fragility. The honest caveat runs the other way — the Z-Score is calibrated to manufacturers and reads a commodity producer’s peak-cycle X3 at face value, so the score will fall mechanically in the next copper downturn; the durable credit anchors are the debt structure and trough-cycle cash generation, not this year’s Z.
Section 4 — Valuation Methodology
sources
4.1 Cost of Capital (WACC)
sources All inputs to the WACC are verified market data (from market-researcher output) or approved assumptions. Computed metrics are marked accordingly.
4.1.1 Cost of Equity
sources | Component | Value | Source | |—|—|—| | Risk-Free Rate (10Y UST) | 4.47% | US Treasury daily yield curve, dual-verified vs. Fed H.15 | | Equity Risk Premium | 4.18% | Damodaran implied ERP (US, trailing, adjusted payout) | | Beta (Levered) | 1.11 | 5-year monthly regression, cross-checked across four sources; used raw, not relevered | | Size Premium | 0.00% | Not applied — mega-cap issuer | | Company-Specific Risk Premium | 2.25% | Damodaran country risk premium dataset (January 2026), Peru/Mexico revenue-weighted | | Cost of Equity (Ke) | 11.61% | CAPM: Rf + β × (ERP + CRP) |
At 11.61%, the cost of equity is demanding for a mega-cap natural-resources issuer — comfortably above what a US-domiciled industrial of comparable scale would carry — and that is by design. With effectively no leverage in the capital structure, the dominant driver of Ke is the premium stack itself: a beta of 1.11 applied to the sum of the equity risk premium and the country risk premium. Beta is used raw rather than relevered. The capital structure has been stable across the past four fiscal years — total debt moved only marginally, with the February 2025 note issuance largely offset by the April 2025 repayment of maturing notes — and at market values the debt-to-equity ratio is trivial, so relevering would alter beta by an amount with no effect on the result.
The country risk premium of 2.25% is not a discretionary add-on. It is taken from the Damodaran country risk premium dataset published in January 2026 and weighted by the company’s revenue split between its two operating geographies, Peru and Mexico, with Peru carrying the larger weight. Every dollar of Southern Copper’s cash flow is generated in these two jurisdictions; pricing the equity off a US-only premium would understate the political, fiscal and social-license risk that the company’s own disclosures document at length (Section 2). One deliberate methodological choice deserves note: the qualitative governance and litigation findings from the forensic review are carried in conviction and in the scenario framing, not as an additional increment to the discount rate — the CRP reflects verified country-level data only, which keeps the WACC auditable.
4.1.2 Cost of Debt
| Component | Value |
|---|---|
| Pre-tax Cost of Debt (Kd) | 6.41% |
| Marginal Tax Rate | 38.25% |
| After-tax Cost of Debt | 3.96% |
The pre-tax cost of debt is derived from actuals: FY2025 interest expense divided by average total debt across FY2024–FY2025, both taken from the verified workbook. This actuals-based approach was chosen deliberately over a coupon build-up because the debt footnote in the FY2025 filing states the coupon on the newest notes inconsistently in two places — a forensic watch item — and deriving Kd from cash interest paid sidesteps that ambiguity entirely. The resulting 6.41% is consistent with the company’s credit profile: an all-fixed-rate, US-dollar bond stack with long-dated maturities and no maturity wall, where the blended rate reflects legacy low-coupon issuance alongside the more expensive 2025 vintage. The after-tax cost applies the projected marginal tax rate of 38.25%, which is the trailing three-year average effective rate stepped up for the enacted increase in the Mexican special mining duty effective 2025 — the same rate used throughout the DCF (see 4.2.1).
4.1.3 Capital Structure & WACC
| Component | Value |
|---|---|
| Equity Weight (market value) | 98.3% |
| Debt Weight (market value) | 1.7% |
| WACC | 11.48% |
Source: approved valuation assumptions (valuation_assumptions.json) and market_data.json; capital-structure weights at market values using net debt — market capitalization 142,890.5M against net debt of 2,446.1M (total debt 6,750.7M less cash 4,304.6M).
At 98.3% equity and 1.7% debt at market values, the capital structure is near-zero leverage for discounting purposes — a consequence of the market capitalization dwarfing a modest net debt position. The practical implication is that the WACC of 11.48% is, to within rounding, the cost of equity: the cheap after-tax debt is too small a sliver to pull the blended rate down meaningfully, and the WACC moves essentially one-for-one with any change in Ke while being almost completely insensitive to the cost of debt. The discount rate debate for this name is therefore entirely an equity-side debate — beta, the equity premium, and above all the country risk premium — and the sensitivity analysis in 4.3 should be read with that in mind. Market-value weights are used throughout; the company discloses no management leverage target, and the book-value capital mix is irrelevant for this purpose.
4.2 DCF Model — Three Scenarios
sources The DCF uses a five-year explicit projection period plus a terminal value. Five years is the right window for this asset: reserve life is multi-decade, but the only dated, fully committed catalyst is the Tía María project with its targeted 2027 start-up; beyond the ramp of that project the business is steady-state and the terminal value captures it, so a longer explicit window would add assumption risk without adding information. Terminal value is computed under two methods — perpetuity growth and exit multiple — with the selected method and the rationale for the choice shown in 4.2.3. Three scenarios are run: Base, Bear and Bull, differing in revenue growth, EBITDA margin and terminal growth per the standard adjustments below. All three scenarios discount at the same WACC — the scenarios test operating outcomes, not the discount rate, which is stress-tested separately in 4.3.
4.2.1 Key Assumptions
sources | Assumption | Bear | Base | Bull | |—|—|—|—| | Revenue Growth — each year | Base − 2pp | 6.0% (Y1) → 3.0% (Y5) | Base + 2pp | | EBITDA Margin — each year | Base − 1pp | 55.0% (Y1) → 56.0% (Y5) | Base + 1pp | | CapEx / Revenue | unchanged | 12.0% (Y1–Y2) → 10.0% (Y4–Y5) | unchanged | | D&A / Revenue | unchanged | 6.5% (Y1–Y2) → 7.0% (Y3–Y5) | unchanged | | Δ NWC / Incremental Revenue | unchanged | 15.0% | unchanged | | Effective Tax Rate | unchanged | 38.2% | unchanged | | Terminal Growth Rate | Base − 0.5pp | 2.5% | Base + 0.5pp | | Exit EV/EBITDA Multiple | 9.0x | 9.0x | 9.0x | | WACC | 11.48% | 11.48% | 11.48% |
Note: Bear and Bull use the standard adjustments above (per the valuation-agent methodology), applied to every projection year. The resulting fair values appear in Section 6.2 ($44.83 / $59.86).
Revenue growth path. Year-1 growth of 6.0% sits well below the trailing three-year revenue CAGR documented in Section 3 and dramatically below sell-side consensus for FY2026 — a deliberate and, relative to the street, aggressive act of conservatism that should be understood as such. The reasoning: FY2025 revenue was set at record copper prices and, as Section 3 details, included a positive mark-to-market on provisionally priced, unsettled copper sales that is exposed to reversal in early FY2026 if prices retrace — and copper has in fact retraced from its highs. Consensus revenue estimates predate that retracement. The base case therefore assumes price normalization rather than extrapolation. Year 2 steps up to 7.0% as Tía María — the committed greenfield project targeted for 2027 start-up, adding cathode capacity equivalent to a meaningful slice of current copper volume — begins to contribute, with Year 3 at 6.0% capturing the full ramp on flat prices. Years 4 and 5 fade to 4.0% and 3.0%, converging toward the terminal rate, because there is nothing dated behind Tía María: the next projects in the pipeline are either physically obstructed (Los Chancas) or a decade-plus away (Michiquillay), as Section 2 develops. Growth in this model is volume-led, not price-led — the opposite of what drove the FY2025 print.
Margin path. The base case carries EBITDA margin from 55.0% in Year 1 to 56.0% by Year 3 and holds it there. This is set near the trailing three-year average margin and deliberately below the FY2025 record, for reasons the forensic review makes concrete: the FY2025 margin was flattered by the positive provisional-pricing marks noted above and by a second consecutive year of downward asset-retirement-obligation estimate revisions credited against cost of sales — neither of which is a repeatable source of margin. The modest rise across the projection credits genuine operating leverage from Tía María volume on a largely fixed cost base, without extrapolating the price peak. The supporting assumptions are anchored to history from the verified workbook: capital intensity is held at 12.0% of revenue in Years 1–2 — above the FY2025 actual of 9.9% and above the recent-year range of 10.2%–9.0% — to fund Tía María completion, easing to 10.5% in Year 3 and 10.0% thereafter; this is internally consistent with the Year 2–3 volume growth, since cutting the capex assumption would require cutting the growth it funds. D&A steps up from 6.5% to 7.0% of revenue from Year 3, when the project’s capital cost begins depreciating. Working capital absorbs 15.0% of incremental revenue, set at the trailing average rather than the FY2025 level, which was inflated by the provisional-pricing receivables build. The tax rate of 38.2% applies to all years and the terminal period: it is the trailing three-year average effective rate — itself structurally elevated by the Peru/Mexico fiscal regimes, with effective rates of 38.4%, 36.9% and 36.4% across FY2023–FY2025 and no recovery of US foreign tax credits assumed — stepped up for the enacted increase in the Mexican special mining duty effective 2025, which resolves the royalty-rate contradiction flagged in the forensic review and discussed in Section 2.
Terminal growth rate. The terminal rate of 2.5% sits comfortably below long-run nominal GDP growth of either operating geography — the hard ceiling for any perpetuity assumption — and at the bottom of the range this framework would allow for a commodity producer with multi-decade reserve life. The bottom of the band is chosen for three reasons, stated plainly: copper mining is a finite-resource business and the company’s growth pipeline beyond Tía María is legally and socially obstructed; the terminal economics accrue to a minority float exposed to the documented related-party leakage and litigation tail risks carried in Section 2; and energy-transition copper demand is judged sufficient to keep the rate from falling below this level, not to lift it above. The terminal value represents 68% of total enterprise value in the base case — a high concentration, and the honest reading is that roughly two-thirds of this valuation rests on the perpetuity assumptions rather than on the explicit forecast. That concentration is the price of a five-year window on a multi-decade asset; it makes the TGR and WACC the two most consequential numbers in this report, which is precisely why both are stress-tested in 4.3 and why the terminal-method choice in 4.2.3 is documented rather than buried.
4.2.2 Base Case UFCF Projection
| Base (FY2025) | Year 1 | Year 2 | Year 3 | Year 4 | Year 5 | |
|---|---|---|---|---|---|---|
| Revenue ($M) | 13,420.0M | 14,225.2M | 15,221.0M | 16,134.2M | 16,779.6M | 17,283.0M |
| EBITDA ($M) | — | 7,823.9M | 8,447.6M | 9,035.2M | 9,396.6M | 9,678.5M |
| EBIT ($M) | — | 6,899.2M | 7,458.3M | 7,905.8M | 8,222.0M | 8,468.7M |
| NOPAT ($M) | — | 4,260.3M | 4,605.5M | 4,881.8M | 5,077.1M | 5,229.4M |
| Unlevered FCF ($M) | — | 3,357.1M | 3,619.0M | 4,180.1M | 4,476.9M | 4,635.4M |
| PV of UFCF ($M) | — | 3,011.4M | 2,912.0M | 3,017.2M | 2,898.6M | 2,692.2M |
The shape of the cash flow profile is worth a sentence: unlevered free cash flow steps up most sharply in Year 3, not because of margin, but because the Tía María construction capex rolls off at the same time as the project’s volume arrives — the projection deliberately makes the shareholder pay for the growth before receiving it, which is how the cash flows will actually sequence.
4.2.3 Terminal Value & Enterprise Value Bridge
sources | Item | Value | |—|—| | Sum of PV of UFCFs ($M) | 14,531.3M | | Terminal Value — Perpetuity Growth ($M) | 52,909.6M | | Terminal Value — Exit Multiple ($M) | 87,106.2M | | Selected Terminal Value ($M) | 52,909.6M | | PV of Terminal Value ($M) | 30,729.1M | | Terminal Value as % of Enterprise Value | 68% | | Enterprise Value ($M) | 45,260.4M | | Less: Net Debt ($M) | 2,446.1M | | Less: Minority Interest ($M) | 66.8M | | Equity Value ($M) | 42,747.5M | | Shares Outstanding (M — market count used in the per-share bridge) | 826 | | DCF Fair Value / Share (Base) | $51.75 | | Upside / Downside vs. Current Price | -70.1% |
The perpetuity-growth method is selected. The choice matters enormously here and is the single most contestable judgment in the model after the terminal growth rate itself: the exit-multiple terminal value of 87,106.2M is materially higher than the perpetuity value of 52,909.6M, because the 9.0x exit multiple is anchored to a peer group currently trading at cycle-elevated valuations. Selecting the exit method would hard-code today’s peer multiples into perpetuity — embedding a cyclical observation into a structural assumption — which is exactly the error the perpetuity method avoids. The cost of that discipline is acknowledged openly: at this WACC, the perpetuity terminal value implies an exit EV/EBITDA multiple below the bottom of the peer trading range, which some readers will judge too punitive for the lowest-cost large copper producer in the sector. The exit-multiple cross-check table in 4.3 quantifies precisely what the fair value becomes if that judgment is rejected. Two further points on the bridge: minority interest of 66.8M is a rounding error against the equity value and does not move the result, and the share count deserves a flag — the company pays recurring stock dividends that expand the count by low-single-digit percentages annually, so per-share fair values computed today will drift down mechanically as the denominator grows, an erosion borne entirely by holders measured per share.
4.3 WACC Sensitivity
sources The price target is sensitive to both the WACC and the terminal growth rate — unavoidably so, with 68% of enterprise value sitting in the terminal period. The table below shows the implied fair value per share across combinations of these two inputs; the base case is the center cell, at the 11.48% WACC derived in 4.1 and the 2.5% terminal growth rate, producing $51.75.
WACC × Terminal Growth Rate → DCF Fair Value (Base Case)
| WACC \ TGR | 1.50% | 2.00% | 2.50% | 3.00% | 3.50% |
|---|---|---|---|---|---|
| 10.48% | 53.6 | 56.0 | 58.8 | 62.0 | 65.6 |
| 10.98% | 50.5 | 52.6 | 55.1 | 57.8 | 60.9 |
| 11.48% | 47.7 | 49.6 | 51.7 | 54.1 | 56.8 |
| 11.98% | 45.2 | 46.9 | 48.8 | 50.9 | 53.2 |
| 12.48% | 42.9 | 44.4 | 46.1 | 48.0 | 50.0 |
The striking feature of this grid is not the range within it but the distance of the entire grid from the market. Across a full percentage point of WACC in either direction and a two-percentage-point span of terminal growth, the fair value moves within a band whose most generous corner — the lowest discount rate paired with the highest terminal growth — remains far below the current share price of $172.97. There is no combination of WACC and terminal growth within any defensible range that reproduces the market price. Inverting the question makes the point sharper: for the perpetuity framework to solve to $172.97, the implied terminal growth rate would have to rise toward the discount rate itself — perpetual growth far above the long-run nominal GDP of Peru and Mexico, which no going-concern assumption can support. The market, in other words, is not pricing a different set of DCF assumptions; it is pricing something this framework deliberately excludes — structurally higher long-run copper prices, a materially lower required return, or the scarcity value of a tightly held float — themes taken up in Sections 5 and 6.
Because the terminal-method choice in 4.2.3 carries so much weight, the same grid is shown under the exit-multiple method as a cross-check. This is what the valuation becomes if the reader rejects the perpetuity discipline and instead assumes the business sells in Year 5 at a peer-anchored multiple:
WACC × Exit EV/EBITDA Multiple → DCF Fair Value (Cross-Check)
| WACC \ Exit EV/EBITDA | 7.0x | 8.0x | 9.0x | 10.0x | 11.0x |
|---|---|---|---|---|---|
| 10.48% | 64.9 | 72.0 | 79.1 | 86.2 | 93.3 |
| 10.98% | 63.5 | 70.5 | 77.4 | 84.4 | 91.3 |
| 11.48% | 62.2 | 69.0 | 75.8 | 82.6 | 89.4 |
| 11.98% | 60.9 | 67.5 | 74.2 | 80.9 | 87.5 |
| 12.48% | 59.6 | 66.1 | 72.7 | 79.2 | 85.7 |
The cross-check raises fair value meaningfully at every node — that is the arithmetic of capitalizing terminal EBITDA at peer multiples rather than at the rate implied by an 11.48% discount rate — yet even its most aggressive corner, the lowest WACC against the richest exit multiple in the peer range, still sits far below $172.97. The conclusion of the sensitivity work is therefore robust to the methodological choice: the gap between intrinsic value and the market price is not an artifact of the terminal-value method, the discount rate, or the growth assumption taken individually. It would require all three to move to indefensible levels simultaneously.
Source for all tables in this section: approved valuation assumptions as written to the Valuation sheet; every figure traceable via lineage.json.
Section 5 — Financial Metrics & Peer Benchmarking
5.1 Peer Selection
sources The peer set comprises four listed copper producers with Americas-weighted asset bases: Freeport-McMoRan, Teck Resources, Hudbay Minerals and Capstone Copper. Freeport-McMoRan is the anchor comparison — the only other large-capitalization, copper-dominant producer reporting under US GAAP on a 10-K, which makes it the single peer against which Southern Copper Corporation’s margins and returns can be compared without an accounting-standard translation layer. Its principal distortion is structural rather than accounting: roughly half of Freeport’s consolidated net income accrues to noncontrolling interests at PT Freeport Indonesia and Cerro Verde, which depresses every attributable-income metric (net margin, ROE, ROA, P/E) relative to Southern Copper Corporation, whose minority interests are negligible. Teck Resources provides the diversified-major comparison with a copper growth engine in the Quebrada Blanca ramp-up; Hudbay Minerals adds a mid-cap comparator with directly overlapping Peruvian operating exposure; and Capstone Copper is the closest thing to a pure-play copper mid-cap in the Americas, albeit one whose FY2025 base year is distorted by the Mantoverde ramp-up and therefore not a like-for-like growth comparison.
The set’s limitations need to be stated as plainly as its logic. Three of the four peers — Teck, Hudbay and Capstone — report under IFRS while Southern Copper Corporation and Freeport report under US GAAP, and the differences are not cosmetic in FY2025: both Hudbay and Capstone booked impairment reversals into operating income that US GAAP prohibits outright, and all three IFRS reporters classify interest paid as a financing outflow, structurally flattering their operating and free cash flow against the two GAAP filers. Teck additionally reports in Canadian dollars, so its absolute USD figures carry translation estimation, and its printed leverage rests on a debt definition that excludes interest-bearing JV partner advances. Capstone is not an SEC registrant — its statements come from the SEDAR+-filed annual financials and it trades on the TSX under the symbol CS. Finally, there is a scale asymmetry: Hudbay and Capstone are roughly an order of magnitude smaller than Southern Copper Corporation by revenue. The practical reading rule for this section: Freeport is the clean like-for-like; Teck, Hudbay and Capstone comparisons are directional, and every margin, return and cash-flow gap involving them should be read alongside the caveats in 5.7. No peer replicates Southern Copper Corporation’s vertically integrated, by-product-heavy, two-country model — which is itself part of the investment case rather than a defect of the peer set.
| Peer | Ticker | Exchange | Filing Type | Accounting Standard | Fiscal Year End | Comparability Note |
|---|---|---|---|---|---|---|
| Freeport-McMoRan Inc. | FCX | NYSE | 10-K | US GAAP | December | Cleanest comp by scale and standard; large noncontrolling interests depress all attributable-income metrics (5.7, C006) |
| Teck Resources Limited | TECK | TSX / NYSE | 40-F | IFRS | December | CAD reporter, USD figures translated; printed net-cash position excludes QB partner advances (5.7, C002/C003) |
| Hudbay Minerals Inc. | HBM | TSX / NYSE | 40-F | IFRS | December | FY2025 operating income includes a material IFRS impairment reversal (5.7, C004) |
| Capstone Copper Corp. | CMMC | TSX (trades as CS) | Annual FS (SEDAR+) | IFRS | December | IFRS, SEDAR+ filer; FY2025 includes an impairment reversal and the Mantoverde ramp-up base effect (5.7, C004) |
5.2 Profitability Comparison
sources Comparative: Most Recent Full Fiscal Year
| Metric | Southern Copper Corporation | Freeport-McMoRan Inc. | Teck Resources Limited | Hudbay Minerals Inc. | Capstone Copper Corp. |
|---|---|---|---|---|---|
| Revenue ($M) | 13,420.0M | 25,915.0M | 7,694.9Mᶠ | 2,211.0Mᶠ | 2,359.9Mᶠ |
| Gross Margin | 60.1% | 28.2% | 24.7%ᶠ | 33.6%ᶠ | —ᶠ |
| EBITDA Margin | 58.6% | 33.8%ᶜ | 37.2%ᶠᶜ | 61.3%ᶠ | 50.3%ᶠ |
| EBIT Margin | 52.2% | 25.2% | 20.9%ᶠ | 41.5%ᶠ | 29.9%ᶠ |
| Net Margin | 32.3% | 8.5% | 13.0%ᶠ | 25.7%ᶠ | 13.4%ᶠ |
| FCF Margin | 25.5% | 4.3% | -3.3%ᶠ | 10.9%ᶠ | 7.0%ᶠ |
Flag legend (applies to all tables in this section): ᶠ = IFRS-reported (Teck additionally CAD-translated) — directional only; ᵐ = market-sourced; ᶜ = computed from filing components. Source: Freeport-McMoRan Inc. (10-K, FY2025); Teck Resources Limited (40-F, FY2025); Hudbay Minerals Inc. (40-F, FY2025); Capstone Copper Corp. (annual financial statements via SEDAR+, FY2025).
Historical: Southern Copper Corporation Own 5-Year Progression
| Metric | FY2021 | FY2022 | FY2023 | FY2024 | FY2025 |
|---|---|---|---|---|---|
| Gross Margin | 64.4% | 53.7% | 52.6% | 57.7% | 60.1% |
| EBITDA Margin | 62.8% | 52.1% | 50.8% | 56.0% | 58.6% |
| EBIT Margin | 55.5% | 44.1% | 42.4% | 48.6% | 52.2% |
| Net Margin | 31.1% | 26.3% | 24.5% | 29.5% | 32.3% |
| FCF Margin | 31.1% | 18.5% | 25.9% | 29.7% | 25.5% |
The cross-sectional finding is unambiguous: Southern Copper Corporation sits at or near the top of the set on every profitability line, and the gap is mostly genuine. The structural drivers are the ones established in Sections 1 and 3 — high-grade, long-life Peruvian and Mexican ore bodies, vertical integration through smelting and refining, and a by-product engine (zinc, molybdenum, silver) that subsidizes the net cash cost of copper and pushes the company toward the bottom of the industry cost curve. That advantage is cycle-tested: the company’s own FY2023 trough EBIT margin, visible in the historical table above, exceeds the FY2025 — that is, cycle-recovered — EBIT margin of every peer in the set. A margin lead that holds at the bottom of the copper cycle against peers measured at the top of it is a cost-position statement, not a price-capture statement.
Three accounting artifacts qualify, but do not reverse, that conclusion — each developed fully in 5.7. First, the gross margin row is the least comparable line in the table: Southern Copper Corporation prints no gross profit subtotal and presents cost of sales exclusive of depreciation, so its computed gross margin is structurally flattered against Freeport (whose cost of sales includes DD&A) and against the IFRS peers (whose gross profit deducts depreciation); the EBITDA margin row is the cleaner cross-sectional comparison. Second, the Hudbay and Capstone EBIT and net margins are inflated by non-cash IFRS impairment reversals booked into FY2025 operating income — credits that cannot arise under US GAAP. Stripping them would lower both peers’ printed operating margins materially and widen, not narrow, Southern Copper Corporation’s lead; Hudbay’s EBITDA margin, the one line that surpasses Southern Copper Corporation’s, carries the related normalization caveat and should not be read as evidence of a superior cost position. Third, the FCF margin comparison is biased in the IFRS peers’ favor, because Teck, Hudbay and Capstone classify interest paid as a financing outflow while Southern Copper Corporation and Freeport absorb it in operating cash flow — adjusting for cash interest would reduce all three IFRS peers’ FCF margins. Southern Copper Corporation’s FCF margin lead over the whole set is therefore understated as printed. Freeport’s weak net margin, finally, is largely an ownership artifact rather than a cost problem: nearly half its earnings leak to minority partners, so its EBIT and EBITDA margins are the appropriate comparators — and on those, Southern Copper Corporation’s lead remains roughly two-to-one.
5.3 Returns Comparison
sources Comparative: Most Recent Full Fiscal Year
| Metric | Southern Copper Corporation | Freeport-McMoRan Inc. | Teck Resources Limited | Hudbay Minerals Inc. | Capstone Copper Corp. |
|---|---|---|---|---|---|
| ROIC | 34.7% | 11.7%ᶜ | 5.8%ᶠᶜ | 15.4%ᶠᶜ | 11.2%ᶠᶜ |
| ROE | 42.9% | 11.7% | 5.6%ᶠ | 17.6%ᶠ | 9.3%ᶠ |
| ROA | 21.6% | 3.8% | 3.1%ᶠ | 9.1%ᶠ | 4.4%ᶠ |
| Asset Turnover | 0.63x | 0.45x | 0.24xᶠ | 0.36xᶠ | 0.33xᶠ |
Historical: Southern Copper Corporation Own 5-Year Progression
| Metric | FY2021 | FY2022 | FY2023 | FY2024 | FY2025 |
|---|---|---|---|---|---|
| ROIC | 31.1% | 23.1% | 20.8% | 28.4% | 34.7% |
| ROE | 44.2% | 32.5% | 31.3% | 40.7% | 42.9% |
| ROA | 19.3% | 14.8% | 14.3% | 19.1% | 21.6% |
The returns table is where the peer comparison stops being close. Southern Copper Corporation’s ROIC of 34.7% is a multiple of every peer’s, runs roughly three times the 11.48% cost of capital derived in Section 4, and — the more durable observation — its FY2023 cyclical trough ROIC of 20.8% still exceeds the FY2025 ROIC of every company in this set. No peer earns at its cycle peak what Southern Copper Corporation earned at its trough. The value-creation spread over the cost of capital is, on this evidence, unique within the comparable universe rather than merely best-in-class.
Separating signal from artifact: the gap is overwhelmingly an operating phenomenon, but each peer’s figure needs an adjustment in the reader’s head. Hudbay’s and Capstone’s ROE, ROA and ROIC all carry the FY2025 impairment-reversal credits in their numerators — exclude those non-recurring, non-cash items and their returns fall further behind. Freeport’s ROE and ROA are computed on income attributable to common stockholders against consolidated equity and assets, so its 47%-of-income minority leakage at Grasberg and Cerro Verde structurally depresses them; its ROIC, computed on consolidated operating profit, is the fairer measure of asset quality — and still runs at roughly a third of Southern Copper Corporation’s. Teck’s returns are genuinely the weakest in the set, but partly for a timing reason: Quebrada Blanca’s capital sits fully in the invested-capital denominator while its earnings contribution is still ramping. The asset-turnover line reinforces the operational reading — Southern Copper Corporation generates the most revenue per dollar of assets in the set despite being fully integrated through smelting and refining, while peers carry large, not-yet-productive construction balances. One forward-looking qualification carries over from Section 3: Southern Copper Corporation’s own enlarged capital program will grow its denominator ahead of revenue, mechanically compressing ROIC over the next few years even in a flat price environment, so the current spread over peers is at or near its cyclical maximum.
5.4 Leverage & Liquidity Comparison
sources Comparative: Most Recent Full Fiscal Year
| Metric | Southern Copper Corporation | Freeport-McMoRan Inc. | Teck Resources Limited | Hudbay Minerals Inc. | Capstone Copper Corp. |
|---|---|---|---|---|---|
| Net Debt / EBITDA | 0.3x | 0.6xᶜ | -0.3xᶠᶜ | 0.3xᶠᶜ | 0.6xᶠᶜ |
| Total Debt / Equity | 0.6x | 0.5x | 0.2xᶠ | 0.3xᶠ | 0.3xᶠ |
| Interest Coverage | 16.8x | 17.7x | 2.5xᶠ | 15.1xᶠ | 4.8xᶠ |
| Current Ratio | 3.9x | 2.3x | 2.5xᶠ | 0.9xᶠ | 1.2xᶠ |
| FCF Margin | 25.5% | 4.3% | -3.3%ᶠ | 10.9%ᶠ | 7.0%ᶠ |
The whole set is conservatively levered by mining standards, so the differentiation lies in the details — and the table’s most eye-catching figure is also its least reliable. Teck’s printed net-cash position rests on a total-debt definition that excludes CAD 4.7B of interest-bearing advances from its Quebrada Blanca JV partners; treated as the economic financing obligations they are, Teck flips from the set’s only net-cash name to a meaningful net-debt position (caveat C003 in 5.7). Its interest coverage, the lowest in the table, is the more honest indicator of its true financing burden. Freeport’s consolidated debt, conversely, includes subsidiary-level borrowings that are non-recourse to the parent, which overstates parent-level leverage somewhat. Southern Copper Corporation’s position needs no definitional defense: net leverage of 0.3x, interest coverage of 16.8x against a fully fixed-rate, dollar-denominated, long-dated debt stack, and a current ratio of 3.9x — the most liquid balance sheet in the set, measured the most conservatively. Relative to its FCF generation capacity the company is arguably under-levered, but in context the slack is a feature: it pre-funds the enlarged capital program described in Section 3 and buys optionality against Peruvian and Mexican fiscal or permitting shocks without recourse to capital markets. The leverage gap to peers is genuine financial positioning, not an accounting artifact — with the singular exception of Teck’s headline net-cash figure, which should not be quoted without its caveat.
5.5 Valuation Multiples Comparison
sources Comparative: Current Price
| Metric | Southern Copper Corporation | Freeport-McMoRan Inc. | Teck Resources Limited | Hudbay Minerals Inc. | Capstone Copper Corp. |
|---|---|---|---|---|---|
| EV/EBITDA | 18.5x | 11.0xᵐ | 10.3xᵐᶠ | 7.8xᵐ | 6.8xᵐ |
| P/E | 33.0x | 41.7xᵐ | 30.5xᶠᵐ | 17.8xᶠᵐ | 23.4xᶠᵐ |
| FCF Yield | 2.4% | 1.2%ᵐ | -0.9%ᵐᶠ | 2.4%ᵐᶠ | 2.3%ᵐᶠ |
All peer valuation multiples combine market prices as of the June 5, 2026 close with FY2025 filing fundamentals. June 5 was a sharply negative session for the entire copper group, so these multiples are depressed relative to the prior day and volatile; they are subject to change with price movements.
Historical: Southern Copper Corporation EV/EBITDA — today’s share price applied to each year’s capital structure, against that year’s EBITDA
| FY2021 | FY2022 | FY2023 | FY2024 | FY2025 |
|---|---|---|---|---|
| 20.0x | 26.4x | 28.4x | 22.2x | 18.5x |
Southern Copper Corporation is the expensive name in the group on enterprise value — its EV/EBITDA of 18.5x stands at a clear premium to every peer — and the preceding subsections explain why the market pays it: the widest margins, the highest returns on capital, the strongest balance sheet, and the only ROIC profile that clears the cost of capital at the bottom of the cycle. The P/E column, by contrast, ranks the companies misleadingly in both directions and deserves little weight. Freeport’s and Teck’s earnings multiples are inflated by structurally depressed attributable earnings — minority leakage in Freeport’s case, the Quebrada Blanca ramp in Teck’s — while Hudbay’s and Capstone’s are understated because their FY2025 earnings denominators include non-recurring impairment-reversal credits. On FCF yield, Southern Copper Corporation leads the set even before adjustment, and the true gap is wider than printed: the three IFRS peers’ free cash flow excludes cash interest paid (classified as financing), so their yields are structurally flattered.
The historical table reframes the premium as cyclical risk. Period-end historical multiples are not computed in the workbook, so the table applies today’s share price to each year’s capital structure (that year’s share count and net debt) against that year’s EBITDA — a stress-test framing rather than a price history. Read that way: today’s price represents 18.5x the record FY2025 EBITDA, but 28.4x the FY2023 cyclical-trough EBITDA. In other words, today’s valuation is conditional on cycle-elevated earnings; if EBITDA were to retrace toward its trough level — and Section 3 established that the FY2025 record rests partly on price, provisional-pricing marks and ARO credits — the effective multiple expands by roughly half without the share price moving. The premium to peers is justified by quality; the absolute level is justified only if FY2025 profitability proves closer to mid-cycle than to peak. That tension is the central valuation question and is taken up in Section 6.
5.6 Efficiency Comparison
sources | Metric | Southern Copper Corporation | Freeport-McMoRan Inc. | Teck Resources Limited | Hudbay Minerals Inc. | Capstone Copper Corp. | |—|—|—|—|—|—| | Days Sales Outstanding | 43 days | 14 days | 87 daysᶠ | 62 daysᶠ | 55 daysᶠ | | Days Inventory Outstanding | 72 days | 147 days | 124 daysᶠ | 50 daysᶠ | 55 daysᶠ | | Days Payables Outstanding | 50 days | 90 days | 153 daysᶠ | 85 daysᶠ | 101 daysᶠ | | Cash Conversion Cycle | 64 days | 71 days | 57 daysᶠ | 27 daysᶠ | 8 daysᶠ | | CapEx / Revenue | 9.9% | 17.3% | 17.1%ᶠ | 21.1%ᶠ | 22.0%ᶠ |
The working-capital rows should be read as approximate, not as a ranking — the definitional ground shifts under every column. Southern Copper Corporation’s inventory and payables days are computed on cost of sales exclusive of depreciation, which shortens its apparent days relative to peers; several peers’ payables lines bundle accrued and other liabilities, which stretches their apparent DPO and compresses their cash conversion cycles. Capstone’s near-zero cycle and Hudbay’s short one are partly artifacts of those definitions rather than evidence of superior working-capital discipline. What does survive the noise: Southern Copper Corporation’s cycle sits comfortably mid-pack with no red flags in any component, and Freeport’s long inventory days reflect the large capitalized leach-pad and materials balances characteristic of its asset mix — the same judgment-intensive balance that constitutes Southern Copper Corporation’s own critical audit matter, as discussed in Section 3.
The CapEx/Revenue row is the analytically loaded one. Southern Copper Corporation spent the least of the set relative to revenue in FY2025 — roughly half the intensity of the heaviest spenders — while simultaneously posting the set’s highest returns on capital. That combination is the financial signature of an installed, long-life, high-grade asset base that does not need heavy reinvestment to hold its position. The peers’ elevated ratios are predominantly growth construction — Quebrada Blanca at Teck, Mantoverde at Capstone, development assets at Hudbay — so the gap is a difference in capital-cycle phase, not solely in efficiency. The forward caveat cuts against extrapolation, however: as detailed in Sections 2 and 3, the Board has approved a substantially enlarged capital program centered on Tia Maria and El Pilar, with the stated ambition of raising copper production materially by 2033. Southern Copper Corporation’s capital intensity is set to converge toward the peer group’s by design, and FY2025 likely marks the low point of this row rather than its steady state.
5.7 Comparability Caveats
sources The following material comparability issues, identified in the peer-researcher’s reconciliation work, condition every cross-sectional table in this section. None of them, individually or in aggregate, reverses the section’s central finding — Southern Copper Corporation’s profitability and returns lead is genuine — but several of them change the magnitude of specific gaps, and two of them change the sign of a headline figure.
1. Accounting-standard split (Teck, Hudbay, Capstone — all metrics). Teck, Hudbay and Capstone report under IFRS; Southern Copper Corporation and Freeport-McMoRan report under US GAAP. Three differences bind in FY2025: IFRS permits reversal of prior impairments into operating income, which US GAAP prohibits and which both Hudbay and Capstone recognized this year; IFRS cash-flow classification lets all three peers report interest paid as a financing outflow, flattering their operating and free cash flow against the GAAP filers; and capitalization of exploration, stripping and leases differs in detail. Every cross-standard comparison in this section is directional, not precise.
2. Teck currency translation (revenue, EV-based and per-share multiples). Teck reports in Canadian dollars. Its revenue was translated at the FY2025 Bank of Canada average rate of 1.3978 CAD per USD; balance-sheet items used in enterprise value were translated at the year-end closing rate of 1.3706; the cross-currency market-cap bridges use the June 5, 2026 spot rate. Teck’s margins and ratios are computed in CAD and are currency-invariant — they carry only the IFRS caveat — but its absolute USD figures and cross-currency multiples embed translation estimation.
3. Teck’s debt definition and the QB partner advances (net debt, leverage). Teck’s balance sheet carries CAD 4,745M of interest-bearing advances from its Quebrada Blanca JV partners (Sumitomo group), plus lease liabilities, neither of which is included in the total-debt definition behind the net-cash figure shown in 5.4. Treating the QB advances as the economic debt they resemble would flip Teck to a meaningful net-debt position and lift its leverage to roughly the middle of the peer range. Southern Copper Corporation has no equivalent structure. Teck’s printed leverage understates its economic financing obligations and should never be cited without this caveat.
4. Hudbay and Capstone impairment reversals (margins, returns, earnings multiples). FY2025 operating income includes IFRS impairment reversals of $322.3M at Hudbay (Copper World/Nevada-related assets) and $209.5M at Capstone (mineral properties) — non-cash, non-recurring credits unavailable under US GAAP. As documented in the peer-researcher’s figure notes, Hudbay’s EBIT margin excluding the reversal is 26.9% against the 41.5% printed, and Capstone’s is 21.0% against 29.9%. Net income, ROE, ROA, ROIC and P/E for both peers are correspondingly flattered as printed. Per the pipeline’s no-normalization rule the tables show as-reported figures; the reader should mentally strip the reversals, which widens Southern Copper Corporation’s profitability and returns lead in every affected row.
5. IFRS interest-paid classification (operating and free cash flow). Teck, Hudbay and Capstone all classify interest paid within financing activities, whereas Southern Copper Corporation and Freeport deduct it inside operating cash flow. The IFRS peers’ OCF, FCF margins and FCF yields are therefore structurally overstated relative to the two GAAP filers by the amount of their cash interest; Teck’s FCF additionally excludes capitalized stripping reported on a separate investing line. Adjusting for this would reduce every IFRS-peer figure in the FCF margin and FCF yield rows.
6. Freeport’s noncontrolling interests (net margin, ROE, ROA, P/E). Roughly 47% of Freeport’s consolidated FY2025 net income accrues to noncontrolling interests — principally the Indonesian ownership of PT Freeport Indonesia and the Cerro Verde minorities — so attributable-income metrics computed against consolidated revenue, assets and market value look structurally weak. Southern Copper Corporation’s minority interests are negligible. The gap between the two companies’ net margins and ROE is therefore partly an ownership-structure difference, not solely a cost-performance difference; Freeport’s consolidated EBIT and EBITDA margins and its ROIC are the fair basis of comparison, and on those Southern Copper Corporation’s lead stands.
Three further informational items qualify specific rows. Freeport’s consolidated debt includes subsidiary-level borrowings non-recourse to the parent, modestly overstating its parent-level leverage in 5.4. Cost-of-sales presentation differs across the entire set — Southern Copper Corporation prints no gross-profit subtotal and excludes depreciation from cost of sales — so the gross margin row in 5.2 and the working-capital day counts in 5.6 are approximate rather than rankable. And all market-sourced multiples in 5.5 are struck on the June 5, 2026 close, a sharply negative session for the whole copper complex, against FY2025 fundamentals that are roughly five months old; Capstone additionally trades on the TSX as CS, and its FY2025 revenue base reflects the Mantoverde ramp-up rather than a like-for-like organic year.
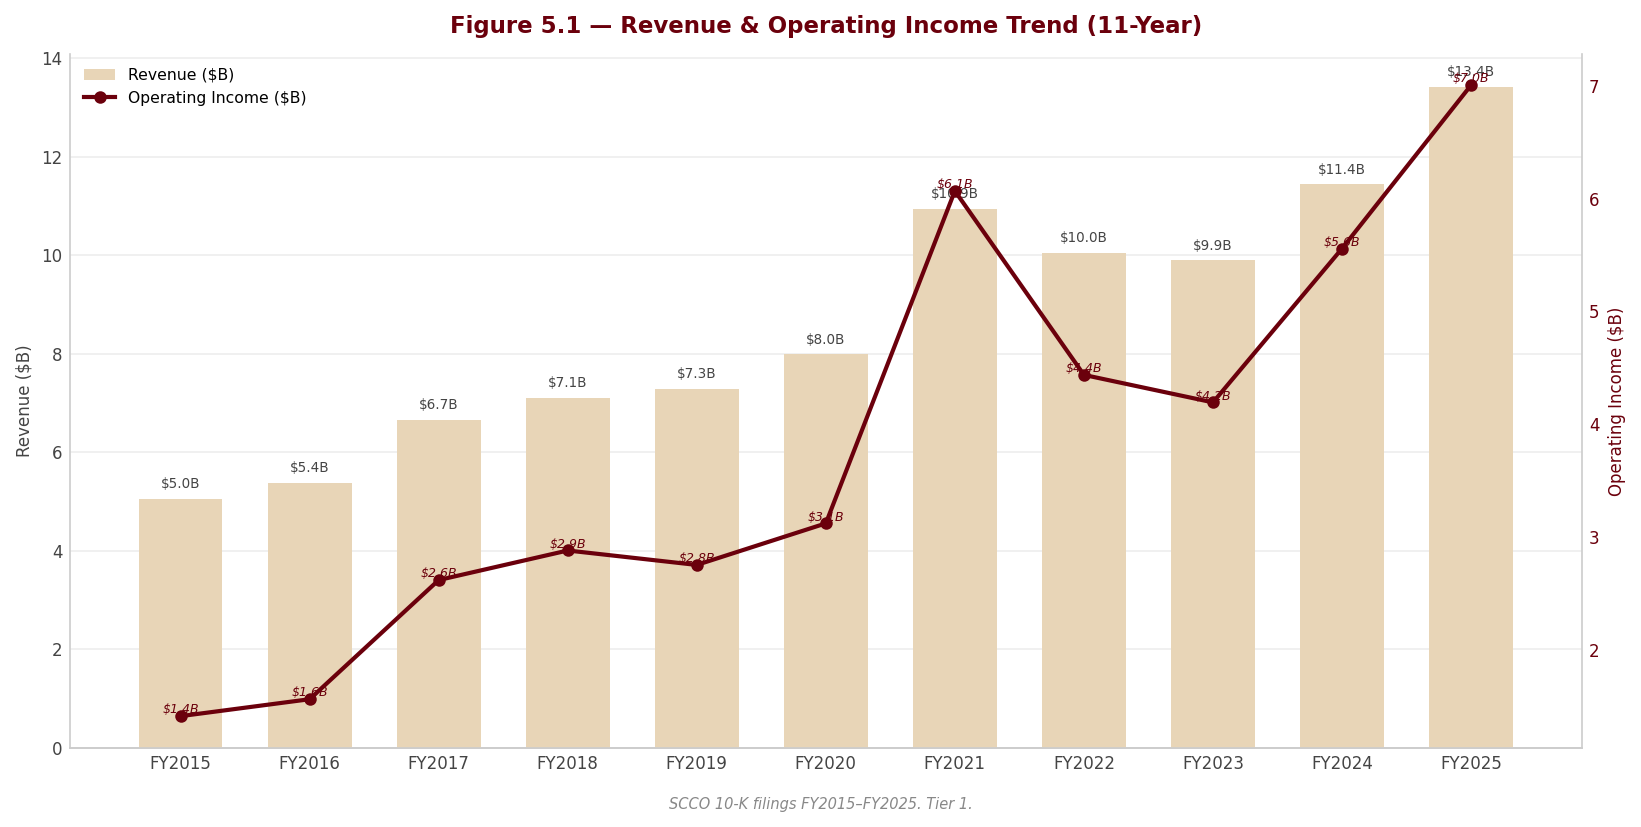
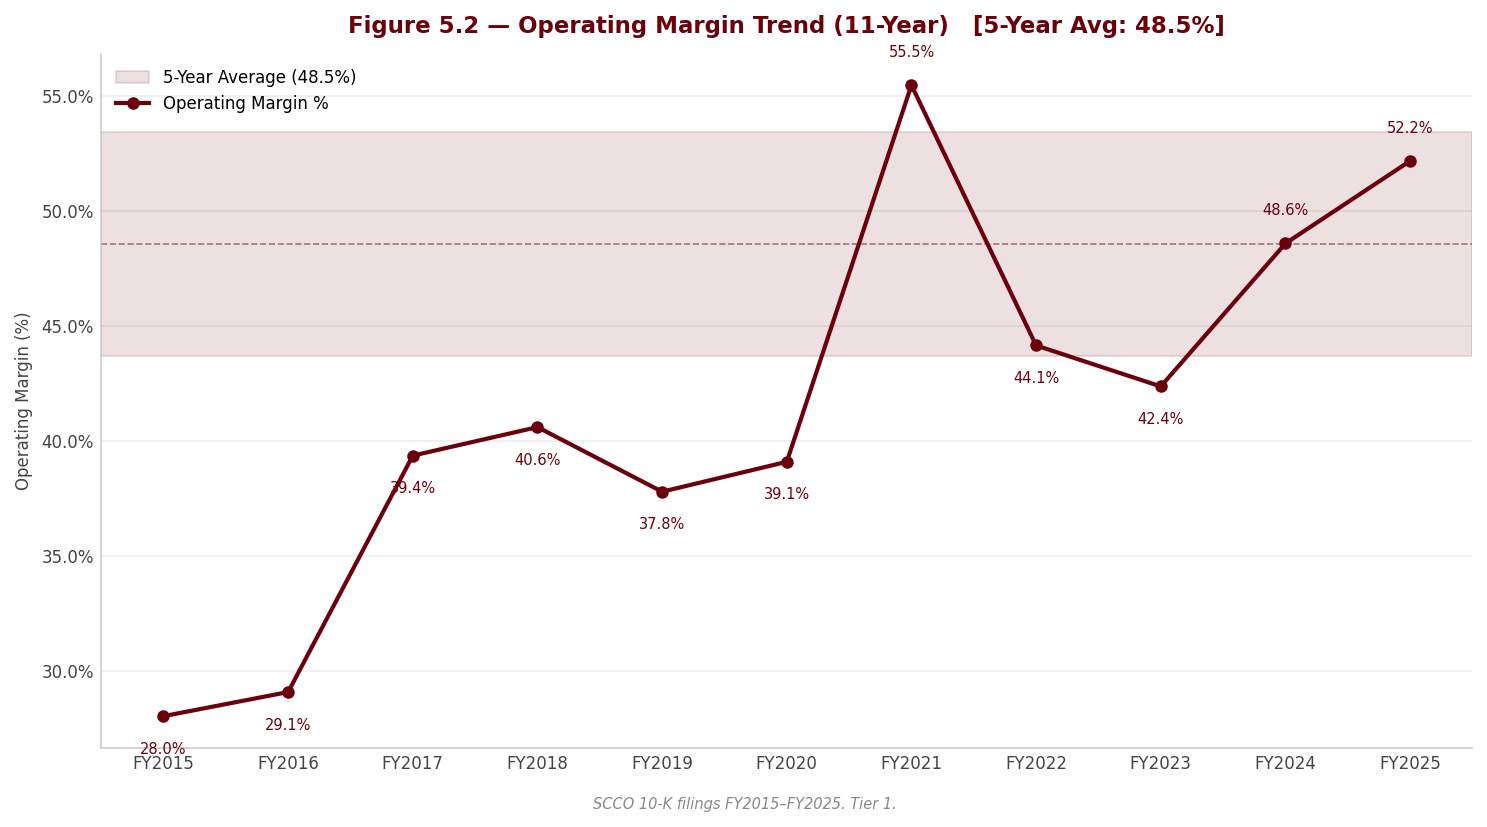
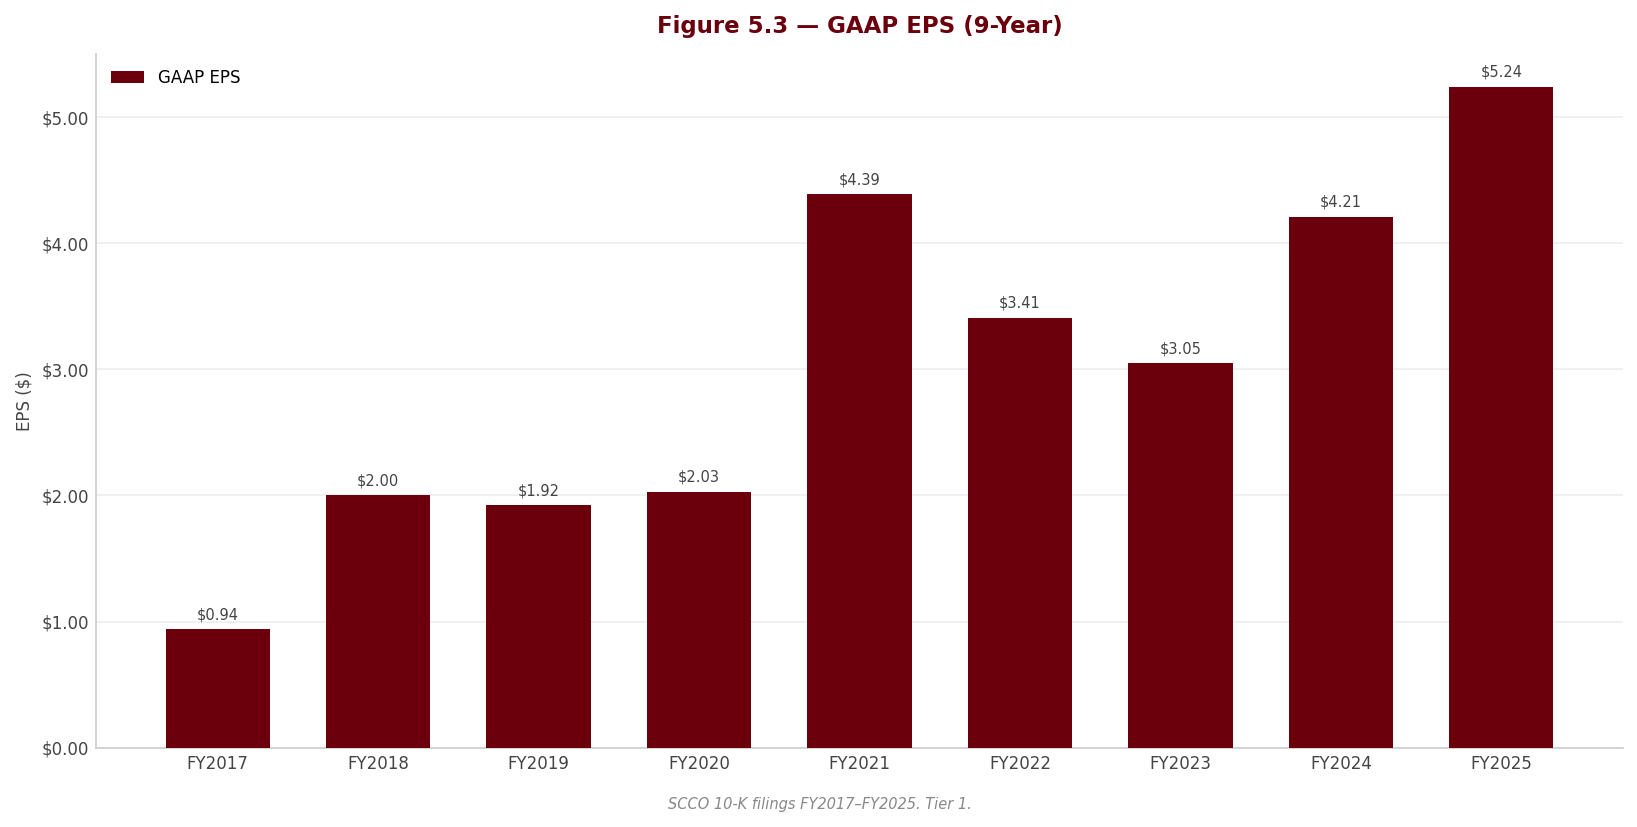
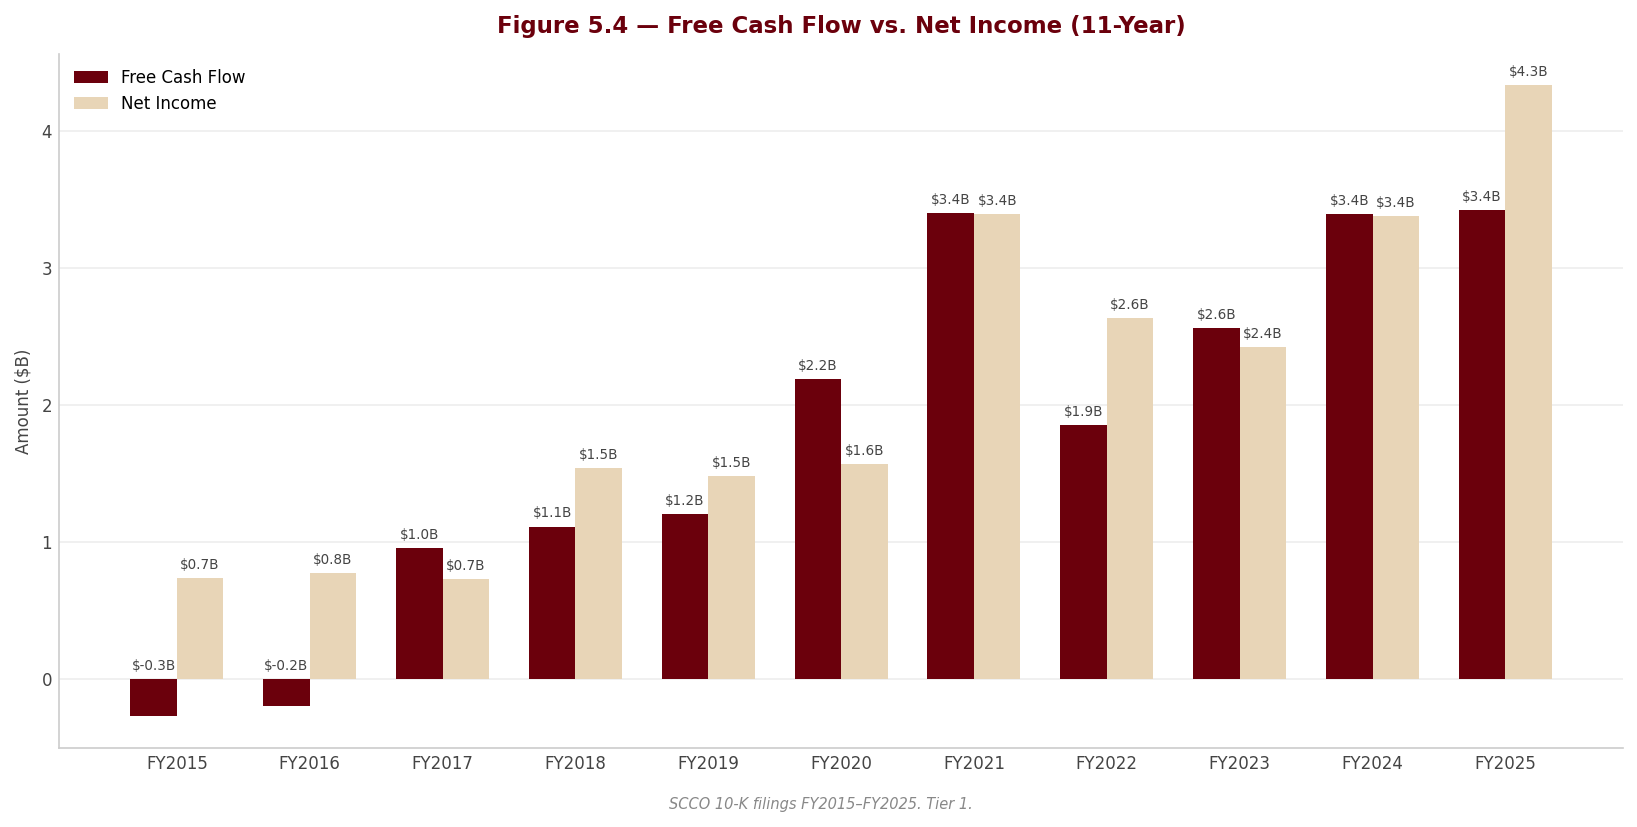
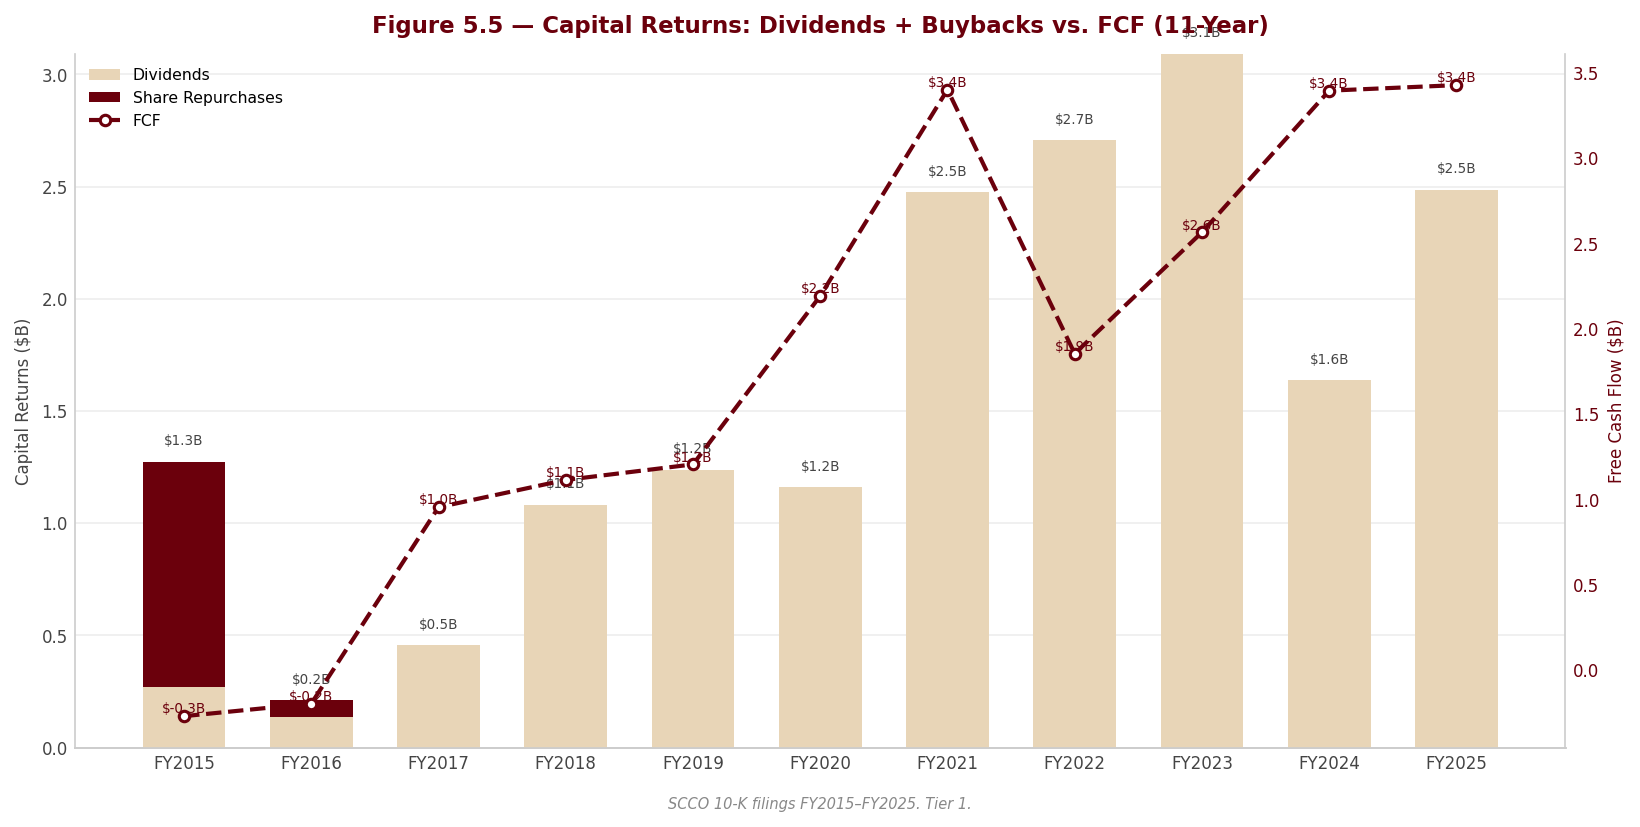
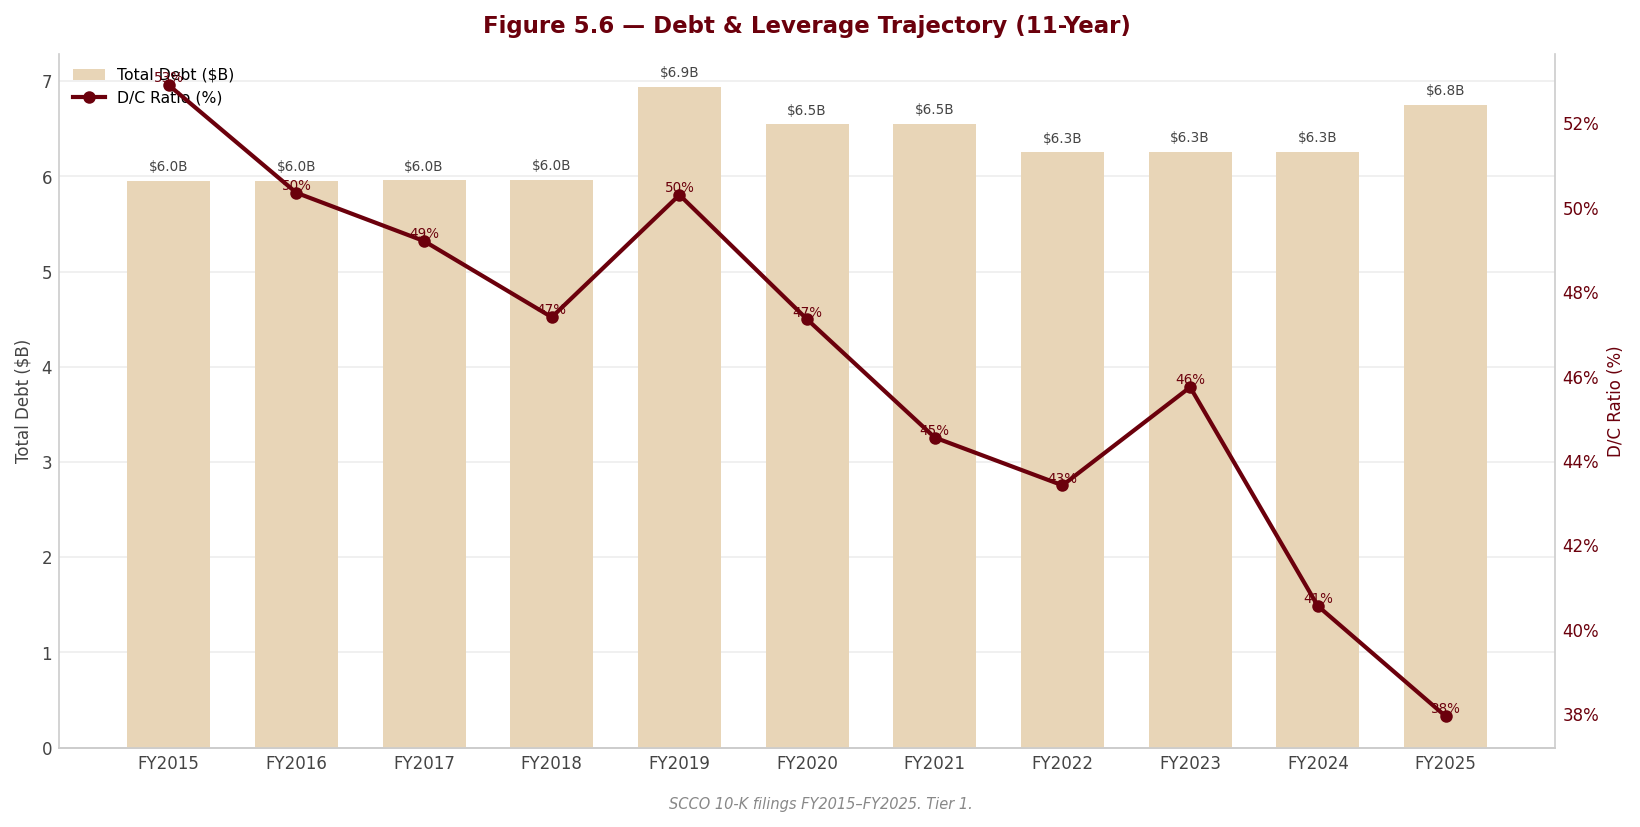
Section 6 — Valuation & Price Target
sources
6.1 Valuation Framework
sources The price target is built from four independent methods — a three-scenario DCF, relative P/E, relative EV/EBITDA, and an FCF-yield capitalization — combined as an equal-weighted average (25% each) within each scenario. The Bear, Base and Bull composites are each the simple mean of the four methods under that scenario’s assumptions; $95.50 is the central reference and the Bear and Bull composites bound the honest range. No probability weights are applied, because none are computed: the scenarios are assumption sets, not forecasts with assigned likelihoods.
Each method earns its quarter of the weight by covering a blind spot in the others. The DCF is the only method that prices what Sections 2 through 4 actually documented — the country-loaded discount rate, the structurally high effective tax burden with no foreign-tax-credit relief assumed, the enacted Mexican royalty, and a growth pipeline whose largest projects are legally or socially obstructed. Its weakness is concentration: roughly two-thirds of its value sits in the terminal assumptions. The two relative methods discipline the DCF against what the market demonstrably pays for copper earnings today, with EV/EBITDA the cleaner of the pair — capital-structure-neutral and the sector standard — while P/E, as Section 5.5 showed, ranks this peer set misleadingly in both directions. The FCF-yield method tests whether the equity offers an acceptable cash return at a given price, which matters for a company whose distribution policy routes the great majority of every dividend dollar to its controlling shareholder. For a commodity producer the relative methods would normally deserve the most attention; here the caveat runs the other way. Both relative methods inherit the cycle twice over — peer multiples observed at cycle-elevated levels, applied to record FY2025 fundamentals — so it is the DCF, not the multiples, that carries the more conservative information in this report. The equal weighting is preserved regardless; the argument changes how the range should be read, not how it is computed.
| Method | Weight | Rationale |
|---|---|---|
| DCF (3 scenarios) | 25% | Intrinsic value; the only method pricing the country risk, fiscal burden and blocked pipeline directly; most sensitive to terminal assumptions |
| P/E Relative | 25% | Earnings-based market anchor; least reliable in this peer set, where minority leakage and impairment reversals distort peer denominators |
| EV/EBITDA Relative | 25% | Capital-structure-neutral; the sector’s standard currency and the cleanest cross-company line in Section 5 |
| FCF Yield | 25% | Cash-generation quality; tests the price an owner pays per dollar of distributable cash |
6.2 DCF Results Summary
sources | Scenario | Fair Value / Share | Upside / Downside vs. Current Price ($172.97, June 5, 2026 close) | |—|—|—| | Bear | $44.83 | Far below the market price — the deepest discount of any cell in this report | | Base | $51.75 | -70.1% | | Bull | $59.86 | Still a fraction of the market price — the bull case does not close the gap |
The result is stark and should be stated without hedging: the base-case DCF of $51.75 sits -70.1% below the market, and the relevant sanity check fails in the opposite direction from the usual one. The question is normally whether the current price holds above the bear-case floor; here the current price of $172.97 stands far above the bull case of $59.86. The spread between Bear and Bull — $44.83 to $59.86 — is modest relative to the chasm between the entire range and the market, which means the operating scenarios are not the argument. As Section 4.3 demonstrated, no combination of WACC and terminal growth within a defensible range reproduces the market price either: with terminal growth already at 2.5% and the terminal value already 68% of enterprise value, justifying the quote would require the discount rate to collapse toward the terminal growth rate, or long-run copper prices to be treated as permanently and structurally higher than anything in the historical record. The market is not pricing a different DCF; it is pricing things this framework deliberately excludes — scarcity of the float, copper-cycle momentum, and a quality premium without a quantity limit.
6.3 Multiples-Based Valuation
sources | Method | Company Metric (FY2025) | Target Multiple (Base) | Implied Price (Base) | |—|—|—|—| | P/E × EPS | $5.24 | 22.0x | $115.28 | | EV/EBITDA × EBITDA | 7,870.1M | 12.0x | $111.28 | | EV/EBIT × EBIT | 7,001.7M | 13.5x | — | | P/FCF × FCF | 3,426.8M | 25.0x | — | | FCF Yield → Price | 3,426.8M | — | $103.70 |
Three of these methods — P/E, EV/EBITDA and FCF yield — carry into the composite alongside the DCF; the EV/EBIT and P/FCF targets serve as corroborating cross-checks on the multiple levels rather than as composite inputs. The anchoring deserves emphasis because every target here is set generously. The 12.0x EV/EBITDA target stands above the trading multiple of every peer in the Section 5 set — Freeport-McMoRan, Teck, Hudbay and Capstone — a deliberate premium for the margin leadership, returns profile and balance sheet that Section 5 established as genuine and cycle-tested. The 22.0x earnings target is similarly a quality-premium multiple for a commodity producer, applied to record FY2025 earnings that Section 3 showed rest partly on price, provisional-pricing marks and credit items rather than volume. And still the implied prices land at little more than half the market quote: the stock trades at 18.5x EV/EBITDA and 33.0x earnings against targets that already embed the largest justifiable premium in the peer group. For a copper producer, EV/EBITDA and FCF yield are the multiples that matter — earnings are too easily distorted by non-cash and cycle effects, a point Section 5.5 documented peer by peer — and it is precisely those two methods that deliver the verdict: paying today’s price means paying roughly half again the most generous quality-adjusted multiple this peer universe supports.
6.4 Composite Fair Value
sources | Method | Bear | Base | Bull | |—|—|—|—| | DCF | $44.83 | $51.75 | $59.86 | | P/E Relative | $97.99 | $115.28 | $132.57 | | EV/EBITDA Relative | $94.13 | $111.28 | $128.43 | | FCF Yield | $90.18 | $103.70 | $122.00 | | Composite Fair Value | $81.78 | $95.50 | $110.72 |
Each scenario’s composite is the equal-weighted average of the four methods (25% each). The Base case is the central reference; Bear and Bull bound the range.
Composite Fair Value (Base): $95.50
Current Price: $172.97 | Implied Upside / Downside: -44.8%
The dispersion in this matrix runs across methods, not across scenarios, and that is the analytically important reading. Within any single method, the Bear-to-Bull spread is contained — the operating assumptions move the answer, but not dramatically. Between methods, the gap is wide: the DCF column sits at roughly half the relative-value columns. The driver has a name. The relative methods import today’s market pricing — peer multiples observed at cycle-elevated levels, capitalizing record FY2025 earnings — while the DCF prices the same cash flows at a discount rate that respects Peru and Mexico country risk and a terminal assumption that respects resource depletion. The composite range of $81.78 to $110.72 is therefore wide, and the honest interpretation of that width is methodological uncertainty about how much of today’s market pricing regime persists — not uncertainty about the business, whose quality every section of this report has affirmed.
What the matrix removes all doubt about is the relationship to the market. Not one of the fifteen cells reaches the current price. The single most generous figure in the table — the bull-case P/E value, a premium earnings multiple on a bull operating scenario — still sits well below $172.97. When the most aggressive defensible combination of method and scenario cannot justify the quote, the valuation question stops being which cell is right and becomes what the market is paying for that no cash-flow-based method can see. Section 6.6 answers that directly.
6.5 Sensitivity Analysis
The sensitivity of the base-case DCF fair value to WACC and terminal growth is shown below; the bolded row is the base-case discount rate derived in Section 4.1. The exercise of locating the current share price of $172.97 in this grid fails by construction: the price is not implied at any node. Even the most generous corner — the lowest discount rate in the grid paired with the highest terminal growth rate — produces a fair value far below the market, and the base node, at the Section 4 WACC and 2.5% terminal growth, sits at less than a third of the quote. The assumptions implied by the market price are therefore not aggressive readings within this framework; they lie outside it altogether. To solve the perpetuity arithmetic to $172.97 the terminal growth rate must rise toward the discount rate itself — perpetual real growth no finite-resource business can promise — or the discount rate must fall to a level that ignores the two-country political, fiscal and social-license risk this company’s own filing documents at length. Section 4.3 ran the same test under the exit-multiple method as a cross-check and reached the same conclusion at every node. The gap to the market is robust to the discount rate, the growth assumption and the terminal method; it is not a modeling artifact.
WACC × Terminal Growth Rate — DCF Fair Value / Share
| WACC \ TGR | 1.50% | 2.00% | 2.50% | 3.00% | 3.50% |
|---|---|---|---|---|---|
| 10.48% | 53.6 | 56.0 | 58.8 | 62.0 | 65.6 |
| 10.98% | 50.5 | 52.6 | 55.1 | 57.8 | 60.9 |
| 11.48% | 47.7 | 49.6 | 51.7 | 54.1 | 56.8 |
| 11.98% | 45.2 | 46.9 | 48.8 | 50.9 | 53.2 |
| 12.48% | 42.9 | 44.4 | 46.1 | 48.0 | 50.0 |
6.6 Investment Recommendation
sources Rating: SELL | 12-Month Price Target: $95.50 | Conviction: Medium
The recommendation is SELL with a target of $95.50 — the base-case composite — inside a Bear-to-Bull fair-value range of $81.78 to $110.72, against a market price of $172.97. The thesis in one paragraph: this is a genuinely excellent business trading at a price that requires the buyer to ignore four documented defects, each of which transfers value away from the minority holder who pays that price. The market is paying for the widest margins in the peer group, the only cycle-trough ROIC that clears the cost of capital, a fortress balance sheet, and — decisively — scarcity: an exceptionally small free float, with Grupo México controlling the overwhelming majority of the shares, in the sector most levered to the energy-transition copper narrative. All of that is real. What the price does not reflect is what this report’s forensic work surfaced, and these four findings are the risk pillars of the rating.
First — minority value leakage through the controlling shareholder (forensic RED flag). The footnotes disclose a pervasive web of related-party transactions with Grupo México and Larrea-family entities — services, rail freight, construction, and long-dated captive power contracts with parent-owned generators whose pricing is not independently benchmarked in the filing. Related-party purchasing grew faster than revenue in the latest year and the payable balance to affiliates expanded sharply. The minority holder funds a pro-rata share of every one of those dollars, on arm’s-length assurances that rest on internal governance alone. Second — the Peruvian labor-shares litigation (forensic RED flag). Courts in Lima escalated a decades-old case to ordering the physical delivery of millions of investment shares, on an interpretation that, if it stands and extends across the broader class, would transfer economic interests in the Peruvian Branch to plaintiffs. The exposure is undisclosed in amount, was absent from the prior year’s litigation section, and the favorable constitutional ruling obtained early this year is first-instance and provisional. The valuation cannot quantify this tail; the rating carries it. Third — the Mexican royalty (forensic RED flag, resolved conservatively). The FY2025 tax footnote states a royalty rate that contradicts the increase the company itself disclosed as enacted a year earlier; Section 2 concluded the enacted higher rate is the better-evidenced reading, and the valuation taxes the Mexican operations accordingly. The flag remains a disclosure-quality defect in its own right: a recurring nine-figure fiscal charge should not be ambiguous between two consecutive filings. Fourth — the blocked pipeline and the dilution drift. The growth projects beyond Tía María are obstructed — one by illegal mining occupation, others by community and permitting risk in a politically unstable Peru — while recurring stock dividends expand the share count by low single digits annually, mechanically eroding every per-share fair value in this report as the treasury stock that funds them depletes.
Conviction is Medium, not High, for one honest reason: the scarcity premium has no arbitrage mechanism and no expiry date. A float this small in the sector’s flagship pure-play can stay expensive indefinitely, and a sharp copper rally would widen, not close, the gap this report measures. The rating says the price is wrong; the conviction level concedes that nothing forces it to correct on a twelve-month clock. Even so, the asymmetry is the worst in this report’s coverage: the bull composite sits far below the market, so the upside case requires the premium itself to expand, while any of the four pillars above — a delivered adverse judgment, a parent liquidity event, a copper rollover against record-earnings comparisons — collapses it.
Key Catalyst: Any event that converts scarcity into supply — a Grupo México secondary placement, issuance-funded stock dividends once treasury shares are exhausted, or index/flow changes that reprice the float — removing the principal prop under the premium.
Key Risk: The premium persists or expands — a copper-price surge on deficit conditions lifts cycle earnings and the scarcity bid simultaneously, sustaining the market price far above any cash-flow-derived fair value for years.
Upgrade Triggers (conditions that would raise the rating or target)
sources | # | Trigger | Threshold | Timeframe | |—|—|—|—| | 1 | Price–value convergence | Share price falls below the bull composite of $110.72 → revisit toward HOLD; approaches the base composite of $95.50 → consider upgrade to BUY | Any point over 12 months | | 2 | Tía María delivers | First commercial cathode production declared on or ahead of the targeted 2027 start-up, with ramp metrics confirming the volume case | 12–24 months | | 3 | Volume-led earnings beat | FY2026 reported EBITDA exceeds the base-case Year-1 projection of 7,823.9M, driven by production volume rather than realized price | Next four quarters | | 4 | Litigation tail removed | Final, non-appealable resolution of the labor-shares case with no share delivery and no class-wide valuation precedent | 6–18 months | | 5 | Mexican fiscal relief | Next 10-K resolves the royalty contradiction in favor of the lower stated rate, via documented repeal or reversal of the enacted increase | Next filing cycle (~12 months) |
Downgrade Triggers (conditions that would lower the rating or target)
sources | # | Trigger | Threshold | Timeframe | |—|—|—|—| | 1 | Float event | Grupo México secondary placement, or stock dividends funded by new issuance after treasury depletion → scarcity premium unwinds; raise conviction to High, target unchanged or cut toward $81.78 | Any time | | 2 | Labor-shares delivery executed | Appellate or constitutional courts uphold physical delivery of investment shares, or the one-for-one valuation precedent extends to the broader class | 6–12 months | | 3 | Copper-cycle rollover | FY2026 reported EBITDA falls below the FY2024 level of 6,400.6M → bear composite $81.78 becomes the working target | Next four quarters | | 4 | Tía María stoppage | Renewed community or political suspension of construction in Arequipa as Peru’s post-election governing direction clarifies | 12 months | | 5 | Related-party leakage accelerates | FY2026 related-party purchases again grow faster than revenue, or affiliate payables expand further without independent benchmarking of captive power pricing | Next annual filing |
Format: metric breaches threshold within the stated timeframe → revise rating or target as indicated.
Source for all tables in this section: Valuation sheet of the verified workbook (approved assumptions); peer anchors per Section 5; every figure traceable via lineage.json.
Section 7 — Quarterly Update: Q1 2026
sources This quarterly update assumes the reader has Sections 1–6. Quarter notation: Q1 2026 = the quarter under review; comparisons are year-over-year (vs Q1 2025) and sequential (vs Q4 2025).
Portfolio Action
sources REDUCE
| Assessment | |
|---|---|
| Action | REDUCE |
| Reason | Q1 2026 revenue of $4,251.4M (+36.2% YoY) was entirely price-driven — copper sales volume fell 4.9% and mined copper production fell 4.0%, while cash cost before by-product credits rose 12.3% to $2.31/lb — confirming the SELL thesis that earnings are a commodity-price windfall on a flat-to-declining volume base; the quarter’s strength offers exit liquidity. |
| Thesis intact? | YES — the SELL thesis (price far above composite fair value) was confirmed: every driver of the 66.7% net income jump was a metal price (LME copper +37.5%, silver +157.9%, molybdenum +24.2%, zinc +14.0%), none was volume or cost improvement, and royalty/tax leakage grew faster than sales (Mexican royalty +75.1% YoY). |
| Trigger to revisit | Copper settling materially above the $5.59/lb provisional price on the 236.5 million lbs open at March 31, 2026 (each $0.10/lb = $89.2M of net income per the 10-Q sensitivity table), combined with a copper volume recovery above the 511.0M lbs sold in Q1 2026, would force a fair value re-check. |
7.1 Results at a Glance
sources | Metric | Q1 2026 | Q1 2025 | YoY Δ | Q4 2025 | QoQ Δ | |—|—|—|—|—|—| | Revenue ($M) | 4,251.4M | 3,121.9M | +36.2% | 3,869.8M | +9.9% | | Gross Profit ($M) | 2,752.6M | 1,802.7M | +52.7% | 2,398.3M | +14.8% | | Gross Margin | 64.7% | 57.7% | +7.0 pp | 62.0% | +2.8 pp | | EBITDA ($M) | 2,706.1M | 1,759.3M | +53.8% | 2,341.1M | +15.6% | | EBITDA Margin | 63.7% | 56.4% | +7.3 pp | 60.5% | +3.2 pp | | EBIT ($M) | 2,480.4M | 1,535.5M | +61.5% | 2,110.4M | +17.5% | | EBIT Margin | 58.3% | 49.2% | +9.2 pp | 54.5% | +3.8 pp | | Net Income ($M) | 1,576.9M | 945.9M | +66.7% | 1,307.9M | +20.6% | | Net Margin | 37.1% | 30.3% | +6.8 pp | 33.8% | +3.3 pp | | Diluted EPS | $1.92 | $1.19 | +61.3% | $1.53 | +25.5% |
Computation conventions for this subsection: YoY Δ = (CQ − PYSQ) / |PYSQ| × 100, e.g. Revenue (4,251.4 − 3,121.9) / 3,121.9 × 100 = +36.2%. QoQ Δ = (CQ − PQ) / |PQ| × 100, e.g. Revenue (4,251.4 − 3,869.8) / 3,869.8 × 100 = +9.9%. Margins = line item / Revenue × 100, e.g. Gross Margin CQ = 2,752.6 / 4,251.4 × 100 = 64.7%. Margin deltas in percentage points (pp). EPS deltas computed on the data-pack values ($1.92 vs $1.19 vs $1.53); note that the 10-Q itself restates Q1 2025 EPS to $1.15 retroactively for subsequent stock dividends (10-Q p. 37), on which basis the YoY change is +66.8%.
Source: Southern Copper Corporation Form 10-Q for the quarterly period ended March 31, 2026 — Condensed Consolidated Statements of Earnings (10-Q p. 4).
7.2 P&L Drivers
sources Revenue: The +36.2% YoY increase to $4,251.4M was entirely price- and by-product-driven: LME copper averaged $5.83/lb vs $4.24 (+37.5%), silver $83.33/oz vs $32.31 (+157.9%), molybdenum $25.37/lb vs $20.43 (+24.2%) and zinc +14.0%, with silver volume +11.6% and zinc volume +16.4%, while copper sales volume fell 4.9% to 511.0M lbs and molybdenum volume fell 2.8% (10-Q pp. 39, 46). Mined copper production fell 4.0% to 508.3M lbs on lower ore grades at Cuajone (−11.9%), Toquepala (−8.4%) and Buenavista (−0.8%) (10-Q p. 40). Silver became the largest by-product at $531.5M, 12.5% of sales vs 5.7% in Q1 2025 (10-Q pp. 34, 38, 46).
Cost and margin: COGS rose to $1,498.8M in Q1 2026 from $1,319.2M in Q1 2025 (+13.6%), driven by a $28.7M Sonora “solidarity contribution,” +$20.7M labor, +$18.0M workers’ participation, +$17.0M leachable material and +$94.9M higher volume/cost of third-party metal purchases at the Mexican open-pit segment (10-Q pp. 48, 51). D&A was $225.7M vs $223.8M (+0.8%). Operating cash cost before by-product credits rose 12.3% to $2.31/lb from $2.05/lb; the 7.0 pp gross margin gain and 9.2 pp EBIT margin gain are therefore price-driven and temporary, not structural — by-product credits of $2.41/lb (vs $1.29) pushed cash cost net of by-products to a credit of $(0.11)/lb from a cost of $0.77/lb (10-Q pp. 41–42, 55).
Below the line: Interest expense was $104.5M (vs $102.3M PYSQ); non-operating net expense fell to $36.3M from $57.0M, partly because the Q1 2025 base included a $9.9M Tia Maria asset impairment, while equity earnings of affiliate (Coimolache gold) jumped to $28.7M from $3.3M and the effective tax rate rose to 36.5% from 36.0% (10-Q pp. 4, 48). EPS of $1.92 rose +$0.73 (+61.3%) YoY on data-pack values and +$0.39 (+25.5%) QoQ.
7.3 Balance Sheet & Cash Flow
sources | Metric | Q1 2026 | Q1 2025 | YoY Δ | Q4 2025 | QoQ Δ | |—|—|—|—|—|—| | Cash ($M) | 4,915.4M | 4,116.3M | +19.4% | 4,304.6M | +14.2% | | Net Debt ($M) | 1,836.5M | 3,130.7M | −41.3% (a) | 2,446.1M | −24.9% (a) | | Net Debt / LTM EBITDA | 0.2× | — | — | — | — | | Total Assets ($M) | 21,929.9M | 19,791.2M | +10.8% | 21,381.4M | +2.6% | | Equity ($M) | 11,787.6M | 9,568.3M | +23.2% | 11,038.1M | +6.8% | | OCF ($M) | 1,694.5M | 721.4M | +134.9% | 1,494.3M | +13.4% | | CapEx ($M) | -441.9M | -317.8M | −39.1% (b) | -422.6M | −4.6% (b) | | FCF ($M) | 1,252.6M | 403.6M | +210.4% | 1,071.7M | +16.9% | | Dividends Paid ($M) | -819.2M | -553.3M | −48.1% (b) | -731.1M | −12.1% (b) |
Computation conventions for this subsection: YoY Δ = (CQ − PYSQ) / |PYSQ| × 100, e.g. Cash (4,915.4 − 4,116.3) / 4,116.3 × 100 = +19.4%. QoQ Δ = (CQ − PQ) / |PQ| × 100, e.g. Cash (4,915.4 − 4,304.6) / 4,304.6 × 100 = +14.2%.
(a) Net Debt deltas and the leverage ratio are verified directly against the 10-Q: long-term debt $6,751.9M − cash and cash equivalents $4,915.4M = $1,836.5M (10-Q p. 6), consistent with the Excel net-debt convention (total debt − cash) verified against Q4 2025 ($6,750.7M − $4,304.6M = $2,446.1M). YoY: (1,836.5 − 3,130.7) / 3,130.7 × 100 = −41.3%; QoQ: (1,836.5 − 2,446.1) / 2,446.1 × 100 = −24.9%.
(b) CapEx and dividends are stored as negative outflows; the deltas show the change in the signed value per the formula (a more negative number = a larger outflow): CapEx outflow grew 39.1% YoY, dividend outflow grew 48.1% YoY.
Net Debt / LTM EBITDA: LTM EBITDA = Q2 2025 $1,793.2M + Q3 2025 $1,976.6M + Q4 2025 $2,341.1M + Q1 2026 $2,706.1M = $8,817.0M (Q2/Q3 2025 standalone EBITDA taken from the data pack’s source workbook, Data sheet row 20, cols 19–20, as the section-7 data pack carries only CQ/PYSQ/PQ). Net Debt $1,836.5M / LTM EBITDA $8,817.0M = 0.2×.
Source: Form 10-Q for the quarterly period ended March 31, 2026 — Condensed Consolidated Balance Sheets (10-Q p. 6) and Condensed Consolidated Statements of Cash Flows (10-Q p. 7).
Balance sheet note: Cash rose $610.8M QoQ to $4,915.4M with no debt issuance this quarter (Q1 2025 had included $993.8M of debt proceeds), long-term debt essentially flat at $6,751.9M vs $6,750.7M, and short-term investments drawn down $170.5M (10-Q pp. 6–7, 9). Accrued income taxes fell from $634.4M to $460.5M on tax payments at the Peruvian and Mexican operations, and treasury stock fell $163.7M as 6,961,959 treasury shares were used for the February 27, 2026 stock dividend (10-Q pp. 6, 28, 53).
Cash flow note: FCF conversion = FCF / Net Income = 1,252.6 / 1,576.9 × 100 = 79.4%, with net income equal to 93.1% of OCF — cash flow tracked earnings closely this quarter. The working-capital drag was only $56.1M vs $504.9M in Q1 2025, because the receivables build was just $65.1M (vs $358.6M) and payables/accrued liabilities fell $109.9M on income tax payments (10-Q pp. 7, 52–53).
7.4 Footnote Review
sources Footnote 1 — Description of the Business (10-Q p. 9) Grupo México, through wholly-owned subsidiary Americas Mining Corporation, owned 88.9% of SCC’s capital stock at March 31, 2026; accounting policies are unchanged from the 2025 10-K. Confirmed unchanged vs. Q1 2025 in substance (ownership was also 88.9% range; policies identical) (10-Q p. 9). Significance: the controlled-company structure that drives the related-party risk in the thesis is fully intact.
Footnote 2 — Short-Term Investments (10-Q pp. 9–10) Trading securities of $434.0M (weighted average rate 3.9%) plus $0.1M available-for-sale, total $434.1M vs $604.6M at December 31, 2025 — a $170.5M drawdown that funded part of the quarter’s cash build. Interest earned on trading securities was $15.3M vs $9.6M in Q1 2025 (10-Q p. 10). No analytical concern; portfolio remains plain-vanilla public bonds.
Footnote 3 — Inventories (10-Q p. 10) Current inventory fell to $959.2M from $1,058.1M at year-end 2025, mainly work-in-process ($263.3M vs $327.9M); long-term leach-pad inventory was $1,116.0M vs $1,114.5M. Leaching costs capitalized were $55.9M vs $69.2M in Q1 2025, while leaching inventory recognized in cost of sales rose to $69.3M from $58.0M — leach-pad inventory is now being consumed slightly faster than it is built, a modest headwind to future low-cost SX-EW output.
Footnote 4 — Income Taxes (10-Q pp. 10–11) Total provision $891.0M vs $532.8M (+67.2%); effective tax rate 36.5% vs 36.0%. Inside it: Mexican mining royalty $83.0M vs $47.4M (+75.1%), Peruvian royalty $33.5M vs $15.1M, Peruvian special mining tax $43.8M vs $25.0M (combined Peruvian royalty+SMT accrual $77.3M vs $40.1M). The filing attributes the increases to higher taxable mining profits on higher metal prices; it does not disclose the Mexican royalty rate applied, so the enacted 8.5% Mexican royalty rate cannot be confirmed from this 10-Q — what is observable is that the Mexican royalty accrual grew at more than twice the rate of consolidated sales (+75.1% vs +36.2%) (page unconfirmed for the rate itself — verify against the 2025 10-K royalty disclosure; accrual figures 10-Q pp. 10–11). OBBBA had no material effect; Pillar Two is not enacted in SCC’s operating jurisdictions; no payments for uncertain tax positions this quarter, with a $15.2M net current Peruvian liability (10-Q p. 11). Significance: fiscal leakage is rising structurally with prices — directly supportive of the SELL thesis’s margin-quality concern.
Footnote 5 — Related Party Transactions (10-Q pp. 11–15) See the mandatory related-party block below — fully documented with CQ and comparative dollar amounts.
Footnote 6 — Leases (10-Q pp. 15–16) Operating lease expense $29.4M vs $28.8M in Q1 2025, essentially all in cost of sales; weighted average remaining term ~6 years, discount rate 4.93%; total undiscounted lease payments $759.1M, present value $649.7M (10-Q pp. 15–16). Confirmed substantially unchanged vs. Q1 2025 (10-Q p. 15). Note the lessor overlap with related parties (power facilities — see Note 5).
Footnote 7 — Asset Retirement Obligation (10-Q pp. 15–16) ARO rose to $485.0M from $471.1M at January 1, 2026 (+$9.2M changes in estimates, +$5.8M accretion, −$1.1M payments), vs $532.9M a year earlier; Peruvian closure guarantees provided total $110.3M (26% pledged Lima office complex, 74% stand-by letter of credit). The December 2025 Mexican ARO reduction ($106.7M obligation decrease, $57.9M credited to COGS) does not recur this quarter; Law 31347 progressive-closure guarantees are not expected to be material (10-Q pp. 15–16). No thesis impact.
Footnote 8 — Benefit Plans (10-Q pp. 16–17) Net periodic pension benefit of $(0.8)M vs $(0.2)M; the Expatriate Plan termination (effective December 1, 2025, settled via annuity purchase) is expected to complete by April 30, 2026 with no material impact; retiree health care cost $0.6M vs $0.5M (10-Q pp. 16–17). Confirmed immaterial and unchanged vs. Q1 2025 except the disclosed plan termination (10-Q p. 16).
Footnote 9 — Commitments and Contingencies (10-Q pp. 17–27) Environmental capital spend $45.5M vs $42.0M in Q1 2025 (10-Q p. 17). The litigation and commitment content is covered in the dedicated contingencies block below. Two quarter-specific items: (i) the Board approved in January 2026 a “voluntary and solidarity contribution” of up to MXN 1.5 billion (~$87M) for Sonora state programs, of which MXN 500M (~$29M) was paid to the Mexican Institute of Social Security on February 9, 2026 (10-Q p. 27) — $28.7M of this ran through Q1 cost of sales (10-Q p. 48); (ii) committed capital investment projects stood at $1,486.9M at quarter-end (10-Q p. 27). The Sonora contribution is quasi-fiscal leakage with no contractual obligation — a recurring-risk data point for the governance leg of the thesis.
Footnote 10 — Stockholders’ Equity (10-Q pp. 28–30) Treasury held 58,531,045 SCC shares at March 31, 2026 vs 65,497,804 at year-end; the February 27, 2026 stock dividend of 0.0085 shares per share consumed 6,961,959 treasury shares ($172.8M). Treasury also holds 51,328,315 Grupo México shares ($418.0M) — SCC capital parked in parent stock. Directors’ Stock Award Plan expense $1.0M vs $0.3M; employee stock purchase plans (2018 plan at MXN 37.89 and 2025 plan at MXN 92.52 per Grupo México share) had combined expense of $0.3M (10-Q pp. 28–30). The Grupo México treasury holding is a small but standing related-party allocation of SCC capital.
Footnote 11 — Fair Value Measurement (10-Q pp. 31–33) Long-term debt carrying value $6,751.9M vs fair value $6,800.7M (Level 1 except $51.2M Yankee bonds at Level 2). Provisionally-priced receivables (embedded derivatives, Level 1): copper $1,248.2M, molybdenum $425.4M, zinc $46.5M — $1,720.1M of receivables marked to forward prices, vs $1,761.6M at December 31, 2025 (10-Q p. 32). Significance: nearly a third of total assets’ current receivables ride on quarter-end forward metal prices; see Note 12.
Footnote 12 — Revenue (10-Q pp. 33–35) Geographic mix: Mexico $1,081.2M, U.S. $584.7M, Switzerland $472.2M, China $330.7M, all up YoY. By product: copper $2,982.6M (70.2% of sales vs 77.9%), silver $531.5M (12.5% vs 5.7%), molybdenum $445.5M (10.5%), zinc $145.0M (3.4%). Open provisionally priced sales at March 31, 2026: copper 236.5M lbs at $5.59/lb (settling April–August 2026), molybdenum 16.5M lbs at $26.50/lb, zinc 47.9M lbs at $1.47/lb; the quarter’s provisional adjustment was −$31.6M for copper, +$16.2M molybdenum, +$3.2M zinc (10-Q p. 35). Significance: Q1 revenue already embeds a negative copper mark; if copper settles below $5.59/lb, Q2 2026 revenue takes the hit — the price dependence cuts both ways.
Footnote 13 — Segment and Related Information (10-Q pp. 35–36) Operating income: Mexican open-pit $1,427.5M (vs $965.5M), Peruvian operations $923.7M (vs $561.5M), IMMSA $140.8M (vs $18.4M — +663.4% on silver/zinc prices). Peruvian copper sales volume fell 15.6% while Mexican open-pit rose 3.6% (10-Q pp. 36, 49). Significance: the Peruvian volume decline (grade-driven at Toquepala/Cuajone) is the quarter’s clearest operational negative.
Footnote 14 — Earnings Per Share (10-Q p. 37) Basic and diluted EPS $1.92 vs $1.15 as restated; Q1 2025 EPS was retroactively adjusted for the stock dividends of May 19, 2025 (0.0099), September 4, 2025 (0.0101), November 28, 2025 (0.0085) and February 27, 2026 (0.0085 shares per share). Weighted average shares 821.7M vs 821.6M. Changed vs. PYSQ presentation only through the retroactive share adjustment; methodology unchanged (10-Q p. 37). The rolling stock dividends quietly grow the share count (~826.1M shares outstanding at April 29, 2026, cover page p. 1).
Footnote 15 — Subsequent Events (10-Q p. 37) Covered in the subsequent events block below.
Related-party transactions (10-Q pp. 11–15) All amounts in $M, Q1 2026 vs Q1 2025 unless noted. Purchases from Grupo México and affiliates totaled $93.8 vs $106.2 (totals as printed in the 10-Q; the component lines below sum to $106.0, the remainder being minor affiliates/rounding in the filing’s own table): MGE power purchases 51.3 vs 59.7; Parque Eólico de Fenicias power 10.7 vs 8.6; México Compañía Constructora (construction) 9.5 vs 14.2; Ferrocarril Mexicano (freight) 6.8 vs 5.5; Grupo México Servicios de Ingeniería (engineering) 5.8 vs 2.3; Grupo México Servicios (admin/management services) 5.4 vs 5.0; AMMINCO (admin services) 3.0 vs 2.5; Asarco LLC (cathodes/concentrate/starter sheets) 1.2 vs 7.8; Eólica El Retiro (wind power) 0.1 vs 0.4 (10-Q p. 13). Sales to Grupo México affiliates totaled $19.8 vs $31.4: Asarco 13.0 vs 13.0; MGE 6.8 vs 18.4; AMMINCO and Ferromex each <0.1 (10-Q p. 13). Larrea-family (“controlling group”) companies: purchases $0.8 vs $1.0 (Mextransport aviation 0.6 vs 0.8; Boutique Bowling 0.1 vs 0.1; Operadora de Cinemas 0.1 vs 0.1) and sales $0.9 vs $0.8 (Mextransport 0.6 vs 0.7; Empresarios Industriales de México security services 0.2 vs 0.1) (10-Q p. 14). Balances: related-party receivables $11.9 vs $16.2 at December 31, 2025; related-party payables $133.4 vs $138.4 at December 31, 2025, the largest being Asarco $52.7, MGE $32.1, AMMINCO $15.8 (10-Q p. 12). Terms: no change disclosed — the MGE power contract runs through 2032 and the Fenicias contract (611,400 MWh/yr) for 20 years from Q3 2024; the Article Nine independent-committee review threshold for Material Affiliate Transactions remains $10.0M (10-Q pp. 11, 13–14). Notable shifts: MGE diverted 15.1% of its power output to third parties vs 3.7% a year ago, and Eólica El Retiro supplied only 17.1% of output to SCC units vs 33.3% (10-Q pp. 13–14) — related-party generators selling more elsewhere while SCC stays contracted. Equity stakes: 44.2% in Coimolache (equity earnings $28.7 vs $3.3) and 30.0% in Apu Coropuna, which SCC is evaluating liquidating after unfavorable exploration (10-Q p. 14). Aggregate related-party purchase leakage of $94.6M this quarter ($93.8M + $0.8M) is down from $107.2M, but the structural dependence (power, freight, construction, engineering, admin) is unchanged — the thesis’s governance discount stands.
Contingencies and litigation (10-Q pp. 17–27) - Peruvian labor shares (García Ataucuri) (10-Q pp. 19–20): the most active matter. In execution stage on 10,501,857 investment shares. On December 22, 2025 the First Civil Court of Lima ordered physical delivery of 8,488,383 investment shares held by Compañía Minera Los Tolmos and instructed CAVALI to register them to plaintiffs; SCC appealed December 30, 2025. On February 11, 2026 the 9th Constitutional Court ruled SCC’s constitutional challenge well-founded, nullifying the attachment resolutions (Nos. 505, 518 and 08), and on February 24, 2026 ordered the First Civil Court to provisionally refrain from any transfer of ownership; the defendant has appealed, the Superior Court is expected to rule during 2026, and as of March 31, 2026 the First Civil Court had not yet acted on the constitutional judgment. Materially changed vs. prior quarters — a favorable interim ruling, but the delivery order is suspended, not extinguished; no contingency amount is estimable. Tail risk to the thesis remains live. - Tia Maria (10-Q pp. 20–21): eight lawsuits pending (the newest, Arocena Canazas, served March 4, 2026 and answered March 18, 2026); the Gobierno Regional de Arequipa case was won at first instance on January 23, 2026 but appealed March 19, 2026; all others pending resolution; contingency not estimable. Construction progress 32.5% with $948M committed and start-up targeted Q3 2027 (10-Q p. 43). - Pasto Grande tailings-dam demolition claim (10-Q pp. 21–22): pending after the Superior Court reinstated the proceeding in 2023; no change this quarter; amount not estimable. - Buenavista 2014 spill (10-Q pp. 22–23): the 2018 dismissal of PROFEPA’s criminal complaint remains under appeal; the 2023 SEMARNAT criminal complaint is outstanding; 3 collective actions, 40+ civil actions and several constitutional lawsuits remain pending, all unchanged (“remain in the same stage” as of March 31, 2026); the Company states none would be material individually or in aggregate. - Labor (10-Q pp. 23–24): Peruvian CBAs locked with all six unions, expiries 2027–2033, after signing payments of ~$62M (Q4 2024) and ~$6.3M (February 2025); San Martín strike termination order is under an amparo pending resolution; Taxco strike (since July 2007) pending at the Supreme Court with a non-material impairment recognized. - Guaymas sulfuric acid spill (10-Q p. 18): partial shutdown of the marine terminal storage/transport continues; SCC expects to restart in the future. Confirmed unchanged vs. Q1 2025 (10-Q p. 18). - Michiquillay (10-Q p. 25): $375.0M residual purchase price deferred three years under the April 2025 extension ($21.0M paid for the extension, plus $15M committed social investment); not a present obligation. - 2023 Mexican Mining Law amendments (10-Q p. 19): still before the Supreme Court; the Company expects no negative impact.
Subsequent events (10-Q p. 37) Two events disclosed: (1) President and CEO Oscar González Rocha passed away unexpectedly on April 7, 2026; on April 23, 2026 the Board appointed Leonardo Contreras Lerdo de Tejada as CEO (he signs this 10-Q, p. 65) — a leadership transition at a company already controlled 88.9% by Grupo México. (2) On April 23, 2026 the Board authorized a quarterly cash dividend of $1.00 per share plus a stock dividend of 0.0100 shares per share, payable May 29, 2026 (record May 13, 2026), with fractional shares cashed out at $187.45 (10-Q p. 37).
7.5 What Changed This Quarter
sources - The earnings record is pure price beta: revenue +36.2% to $4,251.4M and net income +66.7% to $1,576.9M while copper sales volume fell 4.9% (511.0M lbs) and mined production fell 4.0% (508.3M lbs) on lower ore grades at Cuajone (−11.9%) and Toquepala (−8.4%) (10-Q pp. 39–40). The SELL thesis’s core claim — that the market is capitalizing a commodity-price windfall, not growth — was confirmed, not weakened. - By-product dependence reached an extreme: silver at $83.33/oz (+157.9%) became the top by-product at 12.5% of sales, flipping cash cost net of by-products from $0.77/lb to a credit of $(0.11)/lb even as gross cash cost rose 12.3% to $2.31/lb (10-Q pp. 41–42). Underlying cost inflation is running double digits and is currently masked by silver. - Fiscal and quasi-fiscal leakage accelerated: Mexican royalty accrual $83.0M (+75.1% YoY), Peruvian royalty + special mining tax $77.3M (vs $40.1M), ETR up to 36.5%, plus a discretionary $29M Sonora “solidarity contribution” paid in February 2026 out of an approved ~$87M, with $28.7M expensed in COGS this quarter (10-Q pp. 10–11, 27, 48). Government take is climbing faster than revenue. - Peru labor-shares litigation turned, but is not closed: a December 2025 order to physically deliver 8,488,383 investment shares was neutralized by the February 11, 2026 constitutional ruling and the February 24, 2026 suspension of transfers, but the defendant’s appeal and the Superior Court’s 2026 ruling are pending (10-Q pp. 19–20). The tail risk is suspended, not removed. - Provisional pricing exposure is large and now marks against the company: 236.5M lbs of copper open at $5.59/lb settling April–August 2026, with Q1 already absorbing a −$31.6M copper mark; each $0.10/lb move in copper is $89.2M of annual net income (10-Q pp. 35, 42). - Tia Maria advanced to 32.5% completion with $948M committed, $90.2M spent this quarter, and start-up guided to Q3 2027 (10-Q pp. 43, 53) — on-track execution, the one genuine positive for future volume. - Leadership change at the top: CEO Oscar González Rocha died April 7, 2026; Grupo México-aligned Leonardo Contreras Lerdo de Tejada was appointed CEO April 23, 2026 (10-Q p. 37) — continuity of parent control, no strategy change signaled. - Distributions stepped up into strength: $819.2M cash dividends paid ($1.00/sh vs $0.70), a further $1.00 cash + 0.0100 stock dividend declared April 23, 2026, funded comfortably by $1,252.6M FCF, leaving net debt at $1,836.5M and leverage at 0.2× (10-Q pp. 7–8, 37).
7.6 Portfolio Decision
sources Why REDUCE: The quarter validated the SELL thesis rather than challenging it. The 66.7% net income increase to $1,576.9M decomposes entirely into metal prices (LME copper +37.5%, silver +157.9%, molybdenum +24.2%) and by-product volumes, while the copper engine itself shrank — sales volume −4.9%, production −4.0%, Peruvian segment volume −15.6% — and gross cash cost rose 12.3% to $2.31/lb. The footnote review adds three thesis-supporting facts: royalty/tax leakage growing at roughly twice the pace of sales (Mexican royalty +75.1% to $83.0M), a discretionary ~$87M quasi-fiscal Sonora contribution with $28.7M already through COGS, and continuing related-party purchases of $93.8M from Grupo México affiliates. With 236.5M lbs of copper provisionally booked at $5.59/lb and a $0.10/lb sensitivity of $89.2M to net income, current earnings are levered to spot prices in both directions. The balance sheet (0.2× net debt / LTM EBITDA, $4,915.4M cash) and the Tia Maria progress (32.5%) argue against a forced EXIT; the valuation gap and the price-dependence of earnings argue for selling into this quarter’s strength.
What would change this view: - Upgrade condition: two consecutive quarters of copper sales volume above the prior-year quarter (i.e., genuine volume recovery), with cash cost before by-products back below $2.05/lb and Tia Maria still tracking its Q3 2027 start — that combination would force the fair-value estimate up and the action back to HOLD or ADD. - Downgrade condition: a Superior Court reversal of the February 11, 2026 constitutional ruling reinstating the order to deliver 8,488,383 investment shares, or copper settling materially below the $5.59/lb provisional price driving negative revenue marks on the 236.5M open pounds in Q2 2026 — either would move the action to EXIT.
Report Versions
Every published version of this report, newest first.
| Version date | Files |
|---|---|
| 2026-06-07-2 Current | Excel Word |
| 2026-06-07 | Excel Word |
| 2026-06-05 | Excel Word |