
Salesforce, Inc.
Section 1 — Business Overview, Operations & Competitive Positioning
1.1 The Business
sources Salesforce sells enterprise software as a subscription: customers pay recurring fees — mostly under one-to-three-year contracts recognized ratably — to use its customer-relationship-management and, increasingly, AI applications delivered from a shared multi-tenant cloud, and the company earns its return by landing an account on one product and then expanding seats, products and usage across a widening suite over many renewal cycles. The economic engine is not a single sale; it is the compounding of a contracted, high-retention revenue base.
Salesforce is the largest independent vendor of customer-relationship-management software and a top-tier enterprise-software franchise more broadly, with FY2026 revenue of $41,525.0M. The overwhelming majority of that revenue is subscription and support; a small and currently shrinking professional-services line rounds it out and runs at or near break-even. The product set — repackaged during the year under the “Agentforce” brand but economically unchanged — spans sales, service, the Slack-and-platform grouping (its fastest-growing bucket, now including the acquired Informatica data-management business), Data Cloud, marketing and commerce, MuleSoft integration and Tableau analytics, and a set of industry-vertical suites. Sales are made worldwide, principally through a direct salesforce and secondarily through consulting and system-integrator partners. The company employs a large global workforce that it has actively reduced through successive restructurings, and frames its culture and its sales, engineering and customer-success talent as competitive assets. The shares trade on the NYSE under CRM.
Scale is the point of the story. [Rating and price target withdrawn — see the note at the top.] Management discloses in the same filing that the Informatica acquisition, completed in November 2025, contributed a substantial slice of that revenue, and that currency movements added roughly two percentage points. [Rating and price target withdrawn — see the note at the top.] The deceleration has not yet broken; the reported acceleration is bought and borrowed, and this report treats it accordingly. Because subscription revenue is recognized ratably, reported growth lags bookings in any case, so a genuine inflection would appear first in remaining performance obligation and in consumption disclosure rather than in the revenue line.
One caveat belongs up front, because it changes how the headline profitability should be read. FY2026 reported net income and diluted EPS are flattered by a large, non-cash gain on Salesforce’s portfolio of strategic (venture) investments — a mark-to-market item that sits below the operating line, is concentrated in a single privately held position valued on unobservable inputs, and was a drag on earnings in each of the two prior years before swinging to a benefit. It is reversible and tells the reader nothing about the operating business. [Rating and price target withdrawn — see the note at the top.] The cleaner read on this company is the operating line — and there, as Section 3 details, the improvement is genuine.
[Rating and price target withdrawn — see the note at the top.]
Key Information
| Item | Value |
|---|---|
| Ticker | CRM |
| Sector / Industry | Information Technology / Application Software |
| Report Date | 2026-08-05 |
| Most Recent FY Revenue | $41,525.0M |
| EBIT Margin (Most Recent FY) | 20.1% |
| Diluted Weighted-Average Shares | 956M |
| Current Price | $190.99 |
Source: Company SEC filings (10-K); see Appendix A.1.
1.2 Operating Segments
sources Salesforce reports as a single operating segment, so there is no segment-level revenue or operating-income split to analyze — a deliberate reflection of how management runs the company: as one balanced product portfolio sold into a shared customer base, where the same account often buys several overlapping offerings and revenue is booked by the product ordered rather than by the business need it serves. What the filing does describe is a set of service offerings, and each is worth understanding as a driver even though none is a reportable segment. Sales and Service remain the two largest offerings; the Platform, Slack and Other grouping is the fastest-growing and now absorbs the acquired Informatica revenue; Data Cloud is the unifying data engine positioned beneath everything else; and marketing, commerce, MuleSoft integration, Tableau analytics and the industry suites fill out the front-office footprint.
Across all of them the single economic variable that matters is the same: the net growth in contracted subscription value — new customers, plus seat and product expansion inside existing accounts, minus attrition — because ratable recognition converts that contracted base into revenue over the following quarters. Two offerings behave differently and are worth flagging. The Integration (MuleSoft) and Analytics (Tableau) grouping includes term software licenses recognized at a point in time, which makes its revenue lumpier from quarter to quarter; and the commerce business is seasonal. Data Cloud and Agentforce, meanwhile, are sold partly on a consumption basis that management itself describes as new, with limited pricing experience.
The system logic is a data-and-agent flywheel. Data Cloud unifies customer data into a single governed source of truth; the applications sit on top of it; Agentforce layers autonomous AI agents that act on that data inside the workflow the customer already uses. Each additional offering a customer adopts deepens the shared data foundation and raises the cost of leaving, which is what powers cross-sell and underpins retention. The fragility is the mirror image. The offerings overlap, so growth in any one is not independent of the others; the newest and most-promoted layer — agents and consumption pricing — is also the least proven economically; and the model’s core strength, ratable recognition, cuts both ways: a downturn in bookings would surface only slowly, but an upturn cannot be monetized quickly either. §
1.3 Geographic Exposure
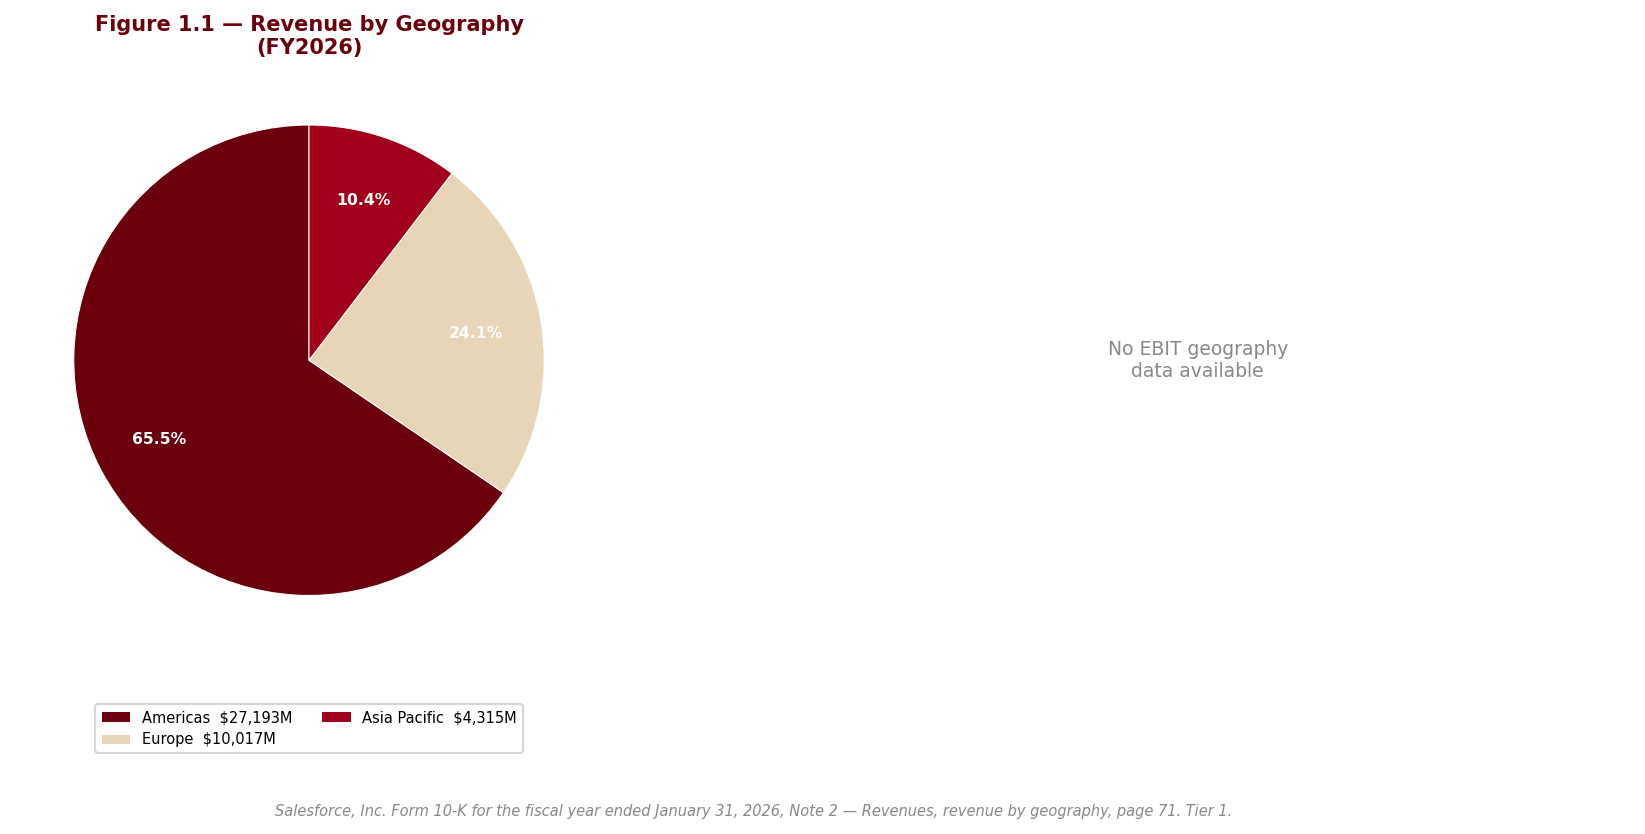
sources The business is run across three regions — the Americas, Europe and Asia Pacific — with the Americas the largest by revenue and both Europe and Asia Pacific growing faster than the Americas in FY2026, so the geographic mix is gradually diversifying away from the home market. Customer concentration is not a concern: management discloses that no single customer accounted for a material share of revenue in any period presented, and subscriptions per customer range from one to many thousands. The flip side of international growth is currency. A material share of revenue and cost is non-dollar — principally the euro, sterling and yen, alongside Canadian, Australian, Brazilian and Indian exposure — and hedging is limited in scope, so reported growth carries a foreign-exchange translation component in both directions. Salesforce also runs its infrastructure through co-located data centers in the United States, Europe and Asia, which intersects with tightening data-localization and cross-border-transfer rules; the detailed regulatory and currency risk is taken up in Section 2.
1.4 Management Team
sources Salesforce remains a founder-led company, and that is both its anchor and its principal key-person risk. Marc Benioff, who co-founded the business, is still Chair and Chief Executive, and the filing is explicit that the company’s success depends substantially on his continued service — an unusually direct dependence for a company of this size. Co-founder Parker Harris remains on the board as Chief Technology Officer of Slack, preserving founder continuity on the technology side. The most significant recent change is the elevation of Robin Washington — a long-serving director and former lead independent director — to President and Chief Operating and Financial Officer during the year, consolidating operating and financial authority in a single executive. That is a double-edged development: it signals confidence in a proven insider and sharpens accountability, but it also concentrates two of the most demanding roles in one person and thins the independent-director bench she came from. Srinivas Tallapragada’s expansion to President and Chief Engineering and Customer Success Officer similarly centralizes product delivery and retention under one leader. Management names succession planning as important to long-term success — which reads as an acknowledgment that the founder-dependence and the recent concentration of authority are live governance considerations rather than settled ones. The company is widely held with no controlling shareholder, so this is founder influence, not founder control.
1.5 Capital Allocation Track Record
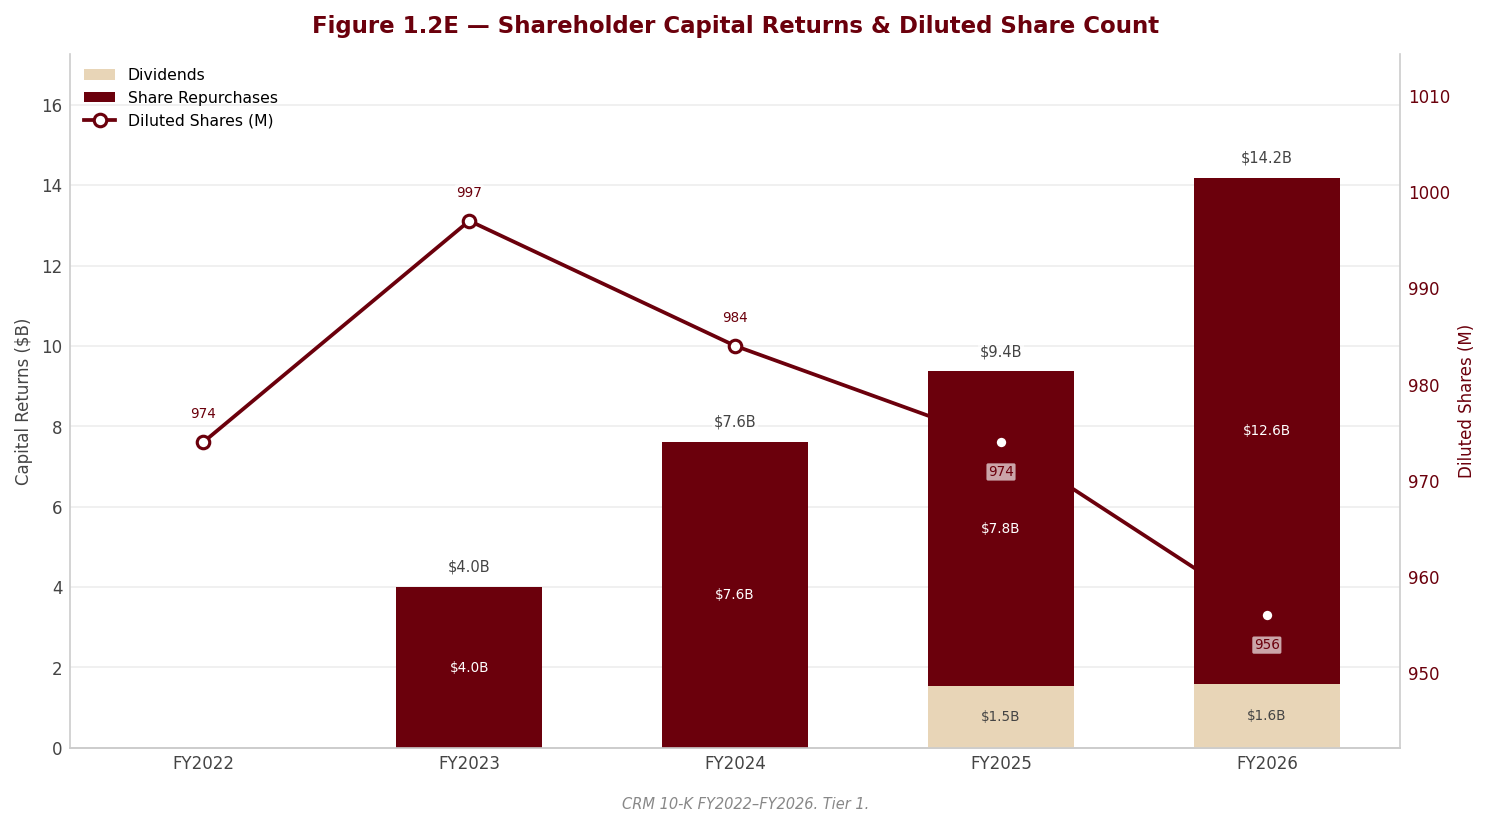
sources Capital allocation is where Salesforce’s strategic shift is most visible. In its earlier growth era the company deployed capital overwhelmingly into growth — organic sales capacity and a run of large acquisitions — and returned essentially nothing to shareholders. Over the last three years it has pivoted hard toward profitable growth and shareholder return: it initiated a dividend, scaled buybacks sharply, and has continued to use the balance sheet for acquisitions.
| Year | Dividends Paid ($M) | Share Repurchases ($M) | CapEx ($M) |
|---|---|---|---|
| FY2022 | — | $0.0M | $717.0M |
| FY2023 | $0.0M | $4,000.0M | $798.0M |
| FY2024 | $0.0M | $7,620.0M | $736.0M |
| FY2025 | $1,537.0M | $7,829.0M | $658.0M |
| FY2026 | $1,587.0M | $12,596.0M | $594.0M |
Source: Company SEC filings (10-K), Consolidated Statements of Cash Flows and Stockholders’ Equity; see Appendix A.1.
The mix tells the story. Capital expenditure is modest and roughly flat — Salesforce is an asset-light, multi-tenant software business whose real investment runs through the income statement (people, R&D and capitalized software and sales commissions) rather than through physical plant, so the small CapEx line confirms that growth is funded operationally, not through a heavy asset base. Cash returns, by contrast, have risen steeply: buybacks have accelerated year over year and now dwarf the dividend, producing a total shareholder yield of 7.8% in FY2026 on a dividend payout of 21.3% of earnings — a deliberately buyback-weighted policy that preserves flexibility, since buybacks are discretionary while a dividend, once set, is sticky.
Two features of the program deserve emphasis rather than applause. First, a large share of the buyback is not incremental return but the mechanism that offsets equity dilution: stock-based compensation of $3,509.0M is a genuine economic cost handed to shareholders as newly issued shares, and the repurchases substantially exist to mop those shares back up — so the reduction in share count is bought, at cash cost, not earned for free. Second, and most important for anyone valuing the company today, the capital structure changed after the fiscal year-end: Salesforce issued a large tranche of notes to fund an accelerated share repurchase, moving the balance sheet from net cash to net debt and retiring a meaningful slice of the share count in a single quarter. The buyback is therefore now partly debt-funded rather than purely cash-flow-funded — shareholder-friendly, but a change in the balance sheet’s character that the reader should carry into the valuation, where it is treated in full.
1.6 Competitive Positioning & Moat
sources Industry structure. Enterprise application software is a large and still-growing market, but it is intensely competitive, fragmented and subject to rapid technological change, with low barriers to initial entry. Returns in this industry do not accrue to whoever ships the best single feature — features are copied — but to whoever can convert a large installed base and a proprietary data position into recurring revenue, high switching costs and operating leverage. The economics favor scale: a multi-tenant architecture spreads the cost of delivery and innovation across the entire customer base, so the largest platforms can out-invest and out-distribute point competitors. That is the structural reason a handful of suite vendors, Salesforce among them, earn durable returns while a long tail of point solutions does not.
Competitive advantages. Salesforce’s moat rests on four reinforcing sources. The first is switching cost: enterprise customers sink substantial personnel and budget into implementing and integrating the platform, and management’s own framing is that they are reluctant to migrate once embedded — a lock-in that lengthens customer life and supports pricing. The second is data gravity and breadth: as a customer unifies its data in Data Cloud and adopts more of the suite, the platform becomes the system of record for the front office, and every added product raises the cost of leaving. The third is the ecosystem — the AppExchange marketplace, a large community of certified developers and administrators, and a deep bench of consulting and system-integrator partners — which together supply talent, applications and implementation capacity that a new entrant cannot quickly replicate. The fourth is the multi-tenant scale architecture itself. The strongest evidence that these advantages are real and not rhetorical is the margin record: operating margin expanded from 3.3% to 20.1% over three years even as revenue growth slowed — precisely the signature of a business with pricing power and scale economics converting a maturing top line into profit rather than defending it with spend.
Competitive vulnerabilities. The vulnerabilities are concentrated in one place — artificial intelligence — and they cut both ways. Salesforce’s advantages were built around a seat-based subscription model layered on human workflows. AI-native competitors that put large-language-model reasoning at the core of their architecture could, in management’s own words, bypass those traditional workflows or displace established interfaces; and if agents accomplish more work with fewer human seats, the seat-based pricing that underpins today’s revenue could compress even where Salesforce’s products remain competitive. Larger rivals with greater resources and established distribution can embed AI into adjacent productivity suites and reach the same customers. And the company’s own answer — consumption-based monetization for Agentforce and Data Cloud — is, by management’s admission, new, with limited pricing experience and uncertain customer acceptance. The barriers that protect the installed base do not fully protect the pricing model.
Verdict. On balance the competitive position is strong and, crucially, the margin evidence shows it is still translating into durable and improving profitability — which is the central reason this is a Hold and not a Sell. The switching costs, data position and ecosystem are genuine and will not erode quickly. What is unresolved is the long-run pricing question posed by AI: the same technology that could re-accelerate growth and deepen lock-in through Agentforce and Data Cloud could also compress seat economics if AI-native competition monetizes it first. Near-term margin durability looks well supported; the long-run margin and growth trajectory is the genuine open question, and it is the swing factor between the bull and bear cases developed later in this report.
Section 2 — Key Risks & Catalysts
2.1 Downside Risks
sources The risks that matter for Salesforce are not the generic threats a screener would flag for any large-cap software name. They cluster in two places: a single strategic question — whether agentic AI expands or erodes a business built on selling human seats — and a set of earnings-quality and balance-sheet changes that, taken together, make FY2026’s reported profitability look better and its balance sheet look safer than the underlying economics warrant. [Rating and price target withdrawn — see the note at the top.]
AI disruption of the seat-based model — the central unresolved question
sources Salesforce’s entire revenue architecture rests on selling seats: recurring subscriptions priced per user, layered on top of human workflows. Agentic AI cuts directly across that logic. If autonomous agents accomplish work that previously required people, the number of humans needing a seat can fall even as the customer does more with the platform — and management’s own answer, consumption-based pricing for Agentforce and Data Cloud, is by its own admission new, with limited pricing history and unproven customer acceptance. The risk is genuinely two-sided and unresolved: the same technology that could re-accelerate growth and deepen lock-in could also compress seat economics if AI-native competitors monetize it first, or if customers simply need fewer licenses. This is not a risk that resolves cleanly in one direction; it is the swing factor between the bull and bear cases, and honesty requires presenting it as open rather than pretending it can be adjudicated today. It hits the financials through the top line — the durability of subscription growth and the pricing per customer — and it would materialize gradually rather than in a single event, which is precisely what makes it hard to price.
Probability: Medium | Timeframe: 3–5 years (beginning now) | Quantified potential impact: Not reliably quantifiable — the range of outcomes spans re-acceleration of subscription growth to a structural compression of seat-based pricing. It is the primary driver of the gap between the bull and bear valuation scenarios in the separate valuation, and cannot be collapsed to a point estimate without false precision.
Earnings quality — reported net income flatters the underlying result
sources [Rating and price target withdrawn — see the note at the top.] First, a large, non-cash mark-to-market gain on the strategic-investment portfolio swung from a drag in each of the two prior years to a substantial benefit in FY2026, concentrated in a single privately held position valued on unobservable inputs — an item that sits below the operating line, tells the reader nothing about the business, and is inherently reversible in any quarter. [Rating and price target withdrawn — see the note at the top.] Third, stock-based compensation is a large share of both revenue and GAAP operating income and is a real economic cost transferred to shareholders through dilution, not a free non-cash add-back; the 10-K itself contains no non-GAAP reconciliation, so the higher “adjusted” operating margin the market quotes is a press-release construct absent from the audited filing. None of this is fraud or a control failure — the opinion is clean — but any P/E applied to reported EPS without normalizing these items will overstate quality.
[Rating and price target withdrawn — see the note at the top.] Section 3 and the separate valuation build the valuation off normalized earnings for exactly this reason.
The balance sheet is no longer a fortress
sources For its entire history Salesforce carried net cash, and much of the bull thesis has rested implicitly on that. That is now stale. During FY2026 the Informatica acquisition, funded partly with new bank debt, moved the company from a net-cash to a net-debt position — a decisive change in balance-sheet character in a single year — and a slice of that debt is classified current, maturing within twelve months and requiring refinancing or repayment. After the fiscal year-end, in March 2026, the company issued a further large tranche of notes to fund an accelerated share repurchase, extending the debt-funded posture. The absolute leverage remains modest against EBITDA and is not a solvency concern; the point is the change in character. Liquid reserves have fallen, near-dated maturities now exist where none did, and capital returns running ahead of earnings are now part debt-assisted rather than purely funded by free cash flow. [Rating and price target withdrawn — see the note at the top.]
Probability: High (the change has occurred) | Timeframe: Immediate, with the near-dated maturity a 1–2 year watch item | Impact: Not a solvency risk at current leverage, but it removes a genuine cushion and commits future free cash flow. the separate valuation reflects net debt, not net cash, in the equity-value bridge.
Accounting structure — negative tangible book, recurring “one-off” charges, and off-balance-sheet commitments
sources A cluster of watch items, individually amber but collectively meaningful, all work in the same direction: they make the reported result look cleaner than the cash economics. Goodwill and acquired intangibles together now exceed total stockholders’ equity, so tangible book value is negative and the balance sheet’s book equity is almost entirely acquisition-driven. [Rating and price target withdrawn — see the note at the top.] Restructuring charges have now recurred for a third consecutive year despite the repeated “not expected to recur near-term” language; a charge that appears every year is an operating cost in substance, not a one-off, and it is added back in the non-GAAP presentation that widens the adjusted-to-GAAP gap. Capitalized sales commissions were again capitalized faster than they were amortized, deferring current-period expense off the income statement and flattering margins for as long as bookings grow — a SaaS-specific lever that reverses if bookings decelerate and amortization catches up. And a large book of enforceable purchase commitments to infrastructure and cloud providers sits off the balance sheet, a material portion due within a year — a fixed cost floor that limits margin flexibility if revenue growth slows.
Probability: Medium | Timeframe: 1–2 years (impairment and commission-reversal risk are bookings-contingent) | Impact: Each item modestly flatters reported profitability or understates committed spend; the impairment tail is the one with a large, if low-probability, hit to reported equity. Section 3 normalizes for restructuring and the commission lever; the separate valuation sizes the off-balance-sheet obligations.
Litigation, competitive intensity and execution
sources Two distinct exposures sit here. On litigation, Note 14 describes an extensive and expanding set of Backpage-related sex-trafficking actions naming Salesforce as a defendant, several consolidated, with one trial currently expected in the autumn of 2026; management states it cannot reasonably estimate possible losses in excess of amounts accrued and discloses no reserve, so an adverse verdict would be an unaccrued charge carrying reputational as well as financial tail risk. Residual Slack-related securities matters are largely wound down but not fully closed. On competition and execution, Salesforce faces well-resourced incumbents — Microsoft, Oracle, SAP, ServiceNow, HubSpot and Adobe — several of whom can embed AI into adjacent productivity suites and reach the same customers, alongside AI-native entrants attacking the seat model directly. The company’s serial-acquisition strategy, of which Informatica is only the latest, carries integration and impairment risk, and the recent consolidation of operating and financial authority in a single executive, atop an explicit disclosed dependence on the founder-CEO, concentrates key-person and governance risk that management itself flags through its emphasis on succession planning.
Probability: Medium | Timeframe: Immediate (litigation trial date) to 3–5 years (competitive erosion) | Impact: The litigation loss is unquantified and unaccrued but bounded by the company’s characterization as not material; competitive and execution risk feeds the same top-line and margin lines as the AI question and compounds it.
2.2 Upside Catalysts
sources The picture is asymmetric, and it should be stated plainly: the risks are more numerous and, on balance, weightier than the catalysts, and the single largest catalyst is the favorable resolution of the single largest risk — the AI question. The catalysts below are real, but three of the four are the mirror image of a downside, which is itself the reason this is a Hold rather than a Buy.
Evidence that Agentforce and Data Cloud consumption is re-accelerating growth
sources The bull case turns on one thing: proof that agentic and data-consumption revenue is converting the large remaining performance obligation into re-accelerating subscription and consumption growth. That proof does not yet exist. [Rating and price target withdrawn — see the note at the top.] The company’s own disclosure of growth excluding acquisitions makes the same point. Because subscription revenue is recognized ratably, reported growth lags bookings, so a genuine inflection would show up first in current remaining performance obligation and in consumption disclosures before it reaches reported revenue — and those forward indicators are currently ambiguous rather than confirming, with the remaining-performance-obligation trend and the billings implied by the unearned-revenue roll-forward pointing in different directions. [Rating and price target withdrawn — see the note at the top.] The burden of proof, however, now sits with the company.
Probability: Medium | Timeframe: 1–2 years | Monitoring trigger: Sustained acceleration in current remaining performance obligation, explicit Agentforce/Data Cloud consumption revenue disclosure, and reported subscription growth confirming the recent quarter was not a one-off.
Continued operating-margin expansion
sources Operating margin has expanded materially over the last three years even as growth slowed — the signature of scale economics converting a maturing top line into profit. Continued expansion would support the valuation independent of the growth question. The report deliberately assumes margin plateaus in the mid-twenties rather than reaching the company’s own quoted “adjusted” figure, because that adjusted number strips out stock-based compensation, acquired-intangible amortization and recurring restructuring — all real costs. Expansion beyond the assumed plateau, achieved on a genuine GAAP basis rather than through add-backs, would be a clean upside.
Probability: Medium | Timeframe: 1–2 years | Monitoring trigger: GAAP operating margin expanding further without a widening reliance on non-GAAP add-backs; discipline on stock-based compensation as a share of revenue.
Further capital return
sources The buyback has accelerated sharply and a large fresh authorization is in place, and repurchases have reduced the diluted share count, supporting per-share metrics. This is a real but qualified catalyst: the return is now partly debt-funded and substantially exists to offset the dilution from stock-based compensation rather than to deliver incremental value, so it should be read as a mechanism that converts SBC dilution into a lower share count at cash cost, not as free return. Additional buyback continues to support EPS, but it is the weakest of the catalysts precisely because it is now leveraged.
Probability: High (program is authorized and active) | Timeframe: Immediate | Monitoring trigger: Pace of repurchase relative to free cash flow and to SBC issuance; whether returns remain debt-assisted or revert to being funded from operating cash flow.
Resolution of the litigation overhang
A favorable or immaterial resolution of the Backpage matters — particularly the trial expected in autumn 2026 — would remove an unquantified, unaccrued tail from the thesis. This is a binary, event-driven catalyst rather than an operational one, and its upside is the removal of a discount rather than the addition of value.
Probability: Low-to-Medium | Timeframe: Immediate (autumn 2026 trial) to 1–2 years | Monitoring trigger: Trial outcomes and any newly disclosed accrual or settlement in the legal-proceedings footnote.
2.3 Risk & Catalyst Summary
| # | Item | Type | Probability | Timeframe | Status | Monitoring Trigger |
|---|---|---|---|---|---|---|
| 1 | AI disruption of the seat-based model | Risk | Medium | 3–5 yrs | Active | Subscription growth and pricing per customer; consumption-revenue traction |
| 2 | [Rating and price target withdrawn — see the note at the top.] | Risk | High | Immediate | Active | [Rating and price target withdrawn — see the note at the top.] |
| 3 | Balance sheet moved to net debt; debt-funded buyback | Risk | High | Immediate / 1–2 yrs | Active | Near-dated maturity refinancing; net-debt trajectory; liquidity |
| 4 | Negative tangible book, recurring restructuring, off-balance-sheet commitments | Risk | Medium | 1–2 yrs | Monitoring | Goodwill impairment triggers; restructuring recurrence; commission cap-vs-amort gap |
| 5 | Litigation, competition and key-person/execution | Risk | Medium | Immediate / 3–5 yrs | Active | [Rating and price target withdrawn — see the note at the top.] |
| 6 | Agentforce / Data Cloud consumption re-accelerating growth | Catalyst | Medium | 1–2 yrs | Monitoring | cRPO acceleration; consumption-revenue disclosure |
| 7 | Continued GAAP operating-margin expansion | Catalyst | Medium | 1–2 yrs | Active | GAAP margin trend without wider add-backs |
| 8 | Further capital return / litigation resolution | Catalyst | High / Low–Med | Immediate | Active | Buyback pace vs FCF and SBC; litigation settlement or verdict |
Source: Company SEC filings (10-K) and forensic footnote review; see Appendix A.1.
2.4 Risk Interdependencies
sources These risks are not independent; they share common triggers, and the danger is that a single adverse development lights up several at once. The AI question is the hub. A stall in Agentforce and Data Cloud adoption would not merely slow the top line (Risk 1) — it would simultaneously undermine the acquired data and AI assets that sit inside goodwill and acquired intangibles, moving the single-reporting-unit impairment test from comfortably covered to pressured (Risk 4), and it would expose the debt-funded buyback and the large committed infrastructure spend as commitments made against growth that failed to arrive (Risk 3). [Rating and price target withdrawn — see the note at the top.] The litigation overhang is the one largely uncorrelated risk, which is the reason its resolution is treated as a standalone catalyst rather than part of the operating story.
2.5 ESG & Regulatory Exposure
sources Salesforce’s ESG and regulatory profile is dominated by the “S” and “G” rather than the “E.” On the social and regulatory front, the business is fundamentally a custodian of customer data, so its most material exposure is data privacy, security and cross-border-transfer regulation: the company runs its infrastructure through co-located data centers across the United States, Europe and Asia, which intersects directly with tightening data-localization and cross-border-transfer rules, and a cybersecurity or privacy failure would carry both regulatory and reputational cost given the sensitivity of the data it holds. Emerging AI-specific regulation adds a second, still-forming layer of compliance risk precisely as the company pushes agentic AI to the center of its strategy. The Backpage sex-trafficking litigation is a social-license exposure as much as a financial one, with reputational tail risk attached to a scheduled 2026 trial and no disclosed reserve. On governance, the picture is mixed. Salesforce is founder-led — the filing discloses an unusually direct dependence on the founder-CEO — yet widely held with no controlling shareholder, so this is founder influence rather than founder control, and the value-extraction risk associated with controlled companies is low. The recent consolidation of operating and financial authority in a single executive sharpens accountability but concentrates two demanding roles and thins the independent-director bench, a live governance consideration that management itself signals through its emphasis on succession planning. Two housekeeping points round out the governance read: related-party disclosure resides in the proxy statement rather than the 10-K, so no related-party conclusion can be drawn from the filing alone; and the single-operating-segment structure and the mid-year renaming of service offerings under the Agentforce brand are presentation matters with no reallocation of revenue, so neither distorts comparability. The auditor issued a clean, unqualified opinion on both the financial statements and internal control with no going-concern or emphasis-of-matter paragraph, identifying two critical audit matters — revenue standalone-selling-price judgment and the valuation of the Informatica acquired intangibles — which align with the genuine judgment areas an analyst would independently flag; the auditor’s long tenure warrants a one-line independence note but is common for mega-caps and is not itself a finding. On the environmental dimension, the material exposure is the energy and infrastructure footprint implied by the large committed spend with cloud and data-center providers as the company scales AI compute, rather than any direct heavy-industry impact.
Section 3 — Financial Analysis & Historical Performance
sources Three-Statement Linkage Confirmation (completed before writing): - Net Income ties (Income Statement → Cash Flow Statement): Confirmed. Reported net income is the opening line of the operating cash-flow reconciliation in each year of the window, and no reconciling break appears between the two statements. - Cash ties (Balance Sheet → Cash Flow Statement): Confirmed. The closing cash and cash-equivalents balance on the balance sheet equals the ending cash position rolled forward on the cash-flow statement in every year presented. - Retained Earnings reconciliation (Beg RE + NI - Dividends = End RE): Confirmed within rounding. Opening retained earnings plus net income less declared dividends reconciles to the closing balance each year; the small residuals reflect dividend-equivalent and other equity adjustments disclosed in the Statement of Stockholders’ Equity, not a linkage error.
3.1A Income Statement
Source: Salesforce FY2026 Form 10-K, Consolidated Statements of Operations; YoY growth rates, margins and effective tax rates are analyst-computed (underlined). Tier 1.
CAGR Summary
| Metric | 3Y CAGR | 5Y CAGR | 10Y CAGR |
|---|---|---|---|
| Revenue | 9.8% | 14.3% | 20.1% |
| EBITDA | 35.4% | 29.4% | 34.0% |
| Net Income | 229.7% | 12.9% | -% |
| Diluted EPS | 233.7% | 12.2% | -% |
| FCF | 31.6% | 28.6% | 26.4% |
Source: Company SEC filings (10-K); figures per the FL model — see Appendix A.1–A.2. CAGRs are analyst-computed (underlined).
Accounting-basis note (read before interpreting any multi-year growth rate). The figures in this report are presented as originally reported. Salesforce adopted the current revenue standard (ASC 606) in FY2019 and restated the two immediately preceding years, so FY2016–FY2018 sit on the prior revenue basis and FY2019 onward on the current basis. Any growth rate that spans the FY2018-to-FY2019 boundary — including the 10-year CAGRs in the table above — straddles two accounting regimes and is not strictly like-for-like. The effect on reported revenue is small; the effect on reported operating income is proportionally larger, because the standard changed the timing of both revenue and the associated deferred contract costs. The five-year and three-year columns, and every annual table in this section (FY2022–FY2026), sit entirely on the current basis and are directly comparable.
3.1B Income Statement — Analysis
sources The revenue story: a growth machine that matured. The defining feature of the top line is deceleration. Revenue growth ran at 24.7% in FY2022 and stepped down every year to 8.7% in FY2025 before a marginal re-acceleration to 9.6% in FY2026. This is not a demand failure; it is the arithmetic of a very large subscription base. As revenue compounded toward $41,525.0M, each incremental point of growth required more absolute new bookings, and the era of large, growth-additive acquisitions that padded the reported top line in the prior decade gave way to a more disciplined, organic cadence. The growth that remains is overwhelmingly subscription and recurring — the point-in-time term-license and professional-services revenue is small and, in the case of services, near break-even — so the trajectory is best read as price and seat/product expansion inside a maturing installed base rather than volume in any unit sense. [Rating and price target withdrawn — see the note at the top.] On an organic basis FY2026 growth was marginally below FY2025, not above it. The same pattern repeats, and more strongly, in the first quarter of FY2027 (Section 7). [Rating and price target withdrawn — see the note at the top.]
The margin trajectory: the headline of the decade. If revenue growth is the fading story, margin is the ascendant one, and it is structural. Operating margin was trapped in a low-single-digit band — 2.1% in FY2022 and 3.3% in FY2023 — for essentially the whole growth era. It then stepped up to 14.4% in FY2024 and climbed further to 19.0% and 20.1%. In absolute terms operating income moved from $1,030.0M to $5,011.0M in a single year and to $8,331.0M by FY2026 — an order-of-magnitude change. The driver is not gross margin alone (though gross margin also improved, from 73.5% to 77.7% on subscription mix and scale); it is operating leverage on sales and marketing, delivered through headcount restructuring and a deliberate slowdown in acquisition-driven expansion. The company converted a growth machine into a profit machine, and it did so precisely as growth slowed — the textbook signature of a scale business harvesting a maturing top line. [Rating and price target withdrawn — see the note at the top.]
Major movers.
-
The operating-margin step-change (FY2023 → FY2024), structural. The single largest mover in the entire statement is the jump in operating income from $1,030.0M to $5,011.0M, lifting EBIT margin from 3.3% to 14.4% in a single year. It reflects the first full year of a disciplined-profitability program — workforce reductions and tighter sales-and-marketing spend against a still-growing revenue base. Because it was achieved by resetting the cost structure rather than by a one-off gain, it has held and extended in the two subsequent years; it is durable.
-
Gross-margin expansion, structural. Gross margin rose from 73.5% to 77.7%. For a multi-tenant software business this is scale plus mix — a growing share of high-margin subscription revenue spread over a shared delivery cost base. It is a slow, compounding tailwind rather than a step, and it should persist while subscription mix holds.
-
Net income is the least reliable line in the statement, and must be treated as such. Net income is repeatedly distorted below the operating line. [Rating and price target withdrawn — see the note at the top.] First, FY2026 net income and diluted EPS are materially flattered by a large, non-cash gain on strategic (venture) investments that sits below the operating line — a mark-to-market item concentrated in a single privately held position valued on unobservable inputs, which was a drag on earnings in each of the two prior years before swinging to a benefit, and is reversible in any quarter. It is added straight back in operating cash flow, confirming it is non-cash and tells the reader nothing about the business. A rational reading strips it out before applying any earnings multiple. This is why pre-tax income of $9,520.0M grew far faster than operating income of $8,331.0M: the gap is a non-operating investment mark, not better operations.
-
[Rating and price target withdrawn — see the note at the top.] The valuation allowance rose every year across this period. [Rating and price target withdrawn — see the note at the top.]
-
Stock-based compensation, a real and rising cost sitting inside the operating line. Stock-based compensation was $3,509.0M in FY2026, up from $2,787.0M in FY2024, against operating income of $8,331.0M and revenue of $41,525.0M — that is, a cost equivalent to a meaningful share of revenue and a substantial fraction of GAAP operating profit, borne inside the reported operating margin. Acquired-intangible amortization is likewise embedded in the operating line. This matters because the “adjusted” operating margin the market quotes for Salesforce — materially above the GAAP figure — is built by adding these items back. Critically, the FY2026 10-K contains no non-GAAP reconciliation and no free-cash-flow definition; the adjusted margin and non-GAAP EPS are earnings-release (8-K) constructs, not audited figures in this filing. Any non-GAAP number cited in this report is sourced to the 8-K and labeled as such, and stock-based compensation is treated as the recurring economic cost it is, not a free add-back. The GAAP-to-non-GAAP operating-margin bridge is, in order of size, stock-based compensation, then acquired-intangible amortization, then restructuring.
Quality of earnings. Beyond the tax and investment-mark distortions above, two recurring items warrant naming so the reader can follow the arithmetic. Restructuring charges have now recurred for a third consecutive year despite repeated “not expected to recur near-term” language; a charge that appears every year is an operating cost in substance, not a one-off. Note its statement treatment: restructuring is reported on its own line and is excluded from the sales-and-marketing, R&D and G&A expense lines but included in total operating expenses — so it already sits inside the GAAP operating margin, and it is added back only in the company’s non-GAAP presentation. Capitalized sales commissions are a SaaS-specific earnings-quality lever: Salesforce capitalizes incremental commissions and amortizes new-contract costs over four years — a period the company itself describes as longer than the typical initial contract term — and in FY2026 it again capitalized more than it amortized, deferring a slice of current-period selling cost off the income statement. As long as bookings grow, the deferred asset grows and flatters margins; if bookings decelerate, amortization catches up and the tailwind reverses. Neither item is a control failure — the audit opinion is clean — but both make reported operating income look modestly higher-quality than the underlying cash cost of selling.
⚠ Items to Watch. If GAAP operating margin falls back below 19.0%, it would signal that the FY2024–FY2026 cost reset is unwinding and would force a re-evaluation of the operating-leverage thesis. If gross margin retreats below 75.5%, it would suggest the subscription-mix tailwind has stalled — plausibly a symptom of consumption-priced products carrying a heavier delivery cost. [Rating and price target withdrawn — see the note at the top.]
3.2A Balance Sheet
Source: Salesforce FY2026 Form 10-K, Consolidated Balance Sheets; net debt, ratios and book value per share are analyst-computed (underlined). Tier 1.
3.2B Balance Sheet — Analysis
sources Asset composition: an acquisition-built balance sheet, not a capital-intensive one. Salesforce carries almost no physical operating assets and no inventory — the inventory line is blank because a multi-tenant software vendor holds none — and PP&E is a minor share of a $112,305.0M asset base. The balance sheet is dominated instead by acquired goodwill and intangibles, which grew to $57,941.0M in FY2026 as the Slack-era book was extended by Informatica and other deals. This is the single most important structural fact about the balance sheet: goodwill alone now approaches the entire $59,142.0M equity base, and once acquired intangibles are added, intangible assets exceed total stockholders’ equity — so tangible book value is negative. Reported book equity is, in substance, capitalized acquisition premium. Book value per share reflects this, easing from $62.81 to $61.86 in FY2026. Because the company tests goodwill as a single reporting unit and discloses no fair-value headroom, near-term impairment risk is low while market capitalization comfortably exceeds book equity — but the cushion is unmeasurable from the filing, and a growth stall in the acquired data/AI assets would put the test under pressure, at which point any write-down would fall straight through reported equity.
The balance sheet changed character — from net cash to net debt. For most of the past decade Salesforce ran a net-cash balance sheet; as recently as FY2025 it was in a net-cash position. FY2026 reversed that decisively. Total debt rose from $8,433.0M to $14,439.0M as the company drew new bank borrowings to fund the Informatica acquisition, moving net debt from -$415.0M (a net-cash position) to $7,112.0M. Any thesis that still describes Salesforce as a “net-cash, fortress balance sheet” company is stale. Two nuances matter for how worried to be. First, the absolute leverage remains modest: net debt/EBITDA of 0.6x and debt/equity of 0.2x are comfortably investment-grade, and interest coverage (Section 3.4) is very high — this is a change in character, not a solvency concern. Second, the composition introduces near-term refinancing exposure: short-term debt jumped from $0.0M to $4,000.0M, reflecting a facility that matures within twelve months and must be repaid or refinanced. That single current maturity is also why the current ratio fell below one — from 1.1x to 0.8x — for the first time in the window; it is a maturity-classification effect, not a liquidity crisis, but it is a genuine change. The full net-debt determination and the total-obligations picture (debt, leases and off-balance-sheet purchase commitments) are.
Equity fell despite record earnings — because capital returns exceeded them. The most telling line on the balance sheet is that total stockholders’ equity declined in FY2026, from $61,173.0M to $59,142.0M, even though the company earned $7,457.0M. The reconciliation is straightforward: share repurchases of $12,596.0M plus dividends of $1,587.0M — roughly double net income — drove equity down despite retained earnings continuing to build to $22,221.0M. Capital returns are now running ahead of earnings and were part-funded by new debt and by drawing down liquid reserves. This is shareholder-friendly, but it is not “free”: it is the mechanism converting stock-based-compensation dilution into a lower share count at cash cost, and it is now leveraged rather than purely self-funded.
Working capital — a caveat, not a conclusion. Days-sales-outstanding is meaningful for this business and is stable-to-tightening: it ran at 112 days in FY2025 and 116 days in FY2026, with the modest FY2026 uptick consistent with the receivables acquired alongside Informatica rather than any collection deterioration; receivables rose to $14,339.0M largely on the acquisition and on billings growth, not out of proportion to revenue. The payables-side metric requires an explicit warning. The days-payables figure computed here (294 days in FY2026) uses the balance sheet’s combined “accounts payable, accrued expenses and other liabilities” line, because Salesforce does not disclose trade payables separately. It is therefore not a trade-payment period and must not be read as one — it is dominated by accrued compensation and other operating accruals. For the same reason, a conventional cash-conversion cycle is not a useful construct here: Salesforce bills subscriptions in advance, so it is structurally financed by customer prepayments (unearned revenue), and its working-capital dynamics are not comparable with an industrial company’s. The right read is simply that the model is negative-working-capital by design, which is a source of cash, not a drain.
⚠ Items to Watch. If net debt/EBITDA rises materially above 0.6x — for example, if the near-dated maturity is refinanced with fresh borrowing rather than repaid, or a further debt-funded acquisition or buyback is layered on — the balance-sheet character would shift from modestly levered toward genuinely levered, and would begin to constrain the capital-return flexibility that currently underpins per-share metrics. If the current ratio remains below 0.8x once the current maturity is addressed, it would warrant closer attention to short-term liquidity management. [Rating and price target withdrawn — see the note at the top.]
3.3A Cash Flow Statement
| FY2022 | FY2023 | FY2024 | FY2025 | FY2026 | |
|---|---|---|---|---|---|
| Cash from Operations ($M) | $6,000.0M | $7,111.0M | $10,234.0M | $13,092.0M | $14,996.0M |
| — Depreciation & Amortization ($M) | $3,298.0M | $3,786.0M | $3,959.0M | $3,477.0M | $3,631.0M |
| Capital Expenditures ($M) | $717.0M | $798.0M | $736.0M | $658.0M | $594.0M |
| Free Cash Flow ($M) | $5,283.0M | $6,313.0M | $9,498.0M | $12,434.0M | $14,402.0M |
| FCF Margin | 19.9% | 20.1% | 27.2% | 32.8% | 34.7% |
| FCF / Share | $5.42 | $6.33 | $9.65 | $12.77 | $15.06 |
| FCF Conversion (FCF/NI) | 365.9% | 3035.1% | 229.6% | 200.6% | 193.1% |
| CapEx / Revenue | 2.7% | 2.5% | 2.1% | 1.7% | 1.4% |
| CapEx / D&A | 0.2x | 0.2x | 0.2x | 0.2x | 0.2x |
| Dividends Paid ($M) | — | $0.0M | $0.0M | $1,537.0M | $1,587.0M |
| Share Repurchases ($M) | $0.0M | $4,000.0M | $7,620.0M | $7,829.0M | $12,596.0M |
Source: Salesforce FY2026 Form 10-K, Consolidated Statements of Cash Flows; free cash flow, margins, conversion and per-share metrics are analyst-computed (underlined). Tier 1.
3.3B Cash Flow — Analysis
sources Operating cash flow is genuinely strong — but free cash flow overstates the cash available to shareholders. Operating cash flow compounded from $6,000.0M to $14,996.0M, and free cash flow from $5,283.0M to $14,402.0M, lifting the FCF margin to 34.7% in FY2026. That FCF margin is the single most impressive number in the model — and it is also the most important to interrogate, because it sits far above the 20.1% operating margin that the $8,331.0M of operating income represents. An operating margin around that level does not organically generate a free-cash-flow margin as high as 34.7%; the wedge has to come from somewhere, and it is important to say plainly what it is. The two largest bridges are (i) stock-based compensation of $3,509.0M, added back in full as a “non-cash” charge even though it is a real economic cost transferred to shareholders via dilution, and (ii) the timing benefit of customers paying for annual subscriptions upfront, which flows through unearned revenue and deferred contract costs. A third, smaller lever is the capitalized-commission deferral discussed above. The correct conclusion for a valuation is that free cash flow overstates the cash truly distributable to shareholders, because a large slice of it is funded by issuing stock (which must then be bought back to hold the share count) and by working-capital timing that only persists while bookings grow. When stock-based compensation is treated as the cash-equivalent cost it economically is, the distributable figure is materially lower than the reported FCF headline. FCF conversion against net income is also a distorted lens here — the FY2023 conversion figure is meaningless because it is measured against a near-zero net-income denominator — so operating cash flow, adjusted for SBC, is the cleaner cash yardstick.
CapEx: asset-light and getting lighter. Capital expenditure is small and falling in absolute terms, from $717.0M to $594.0M, and CapEx/D&A sits far below one at 0.2x — the D&A line is dominated by amortization of acquired intangibles rather than by wear on physical assets that must be replaced. This is not underinvestment: Salesforce’s real investment runs through the income statement (R&D, sales capacity and capitalized software and commissions) and through the M&A line, not through plant. The sub-one CapEx/D&A ratio confirms the business is genuinely asset-light and that maintenance capital needs are trivial relative to cash generation. The material forward capital commitment is not CapEx at all but the large, off-balance-sheet purchase obligations to infrastructure and cloud providers, which the separate valuation sizes.
Capital-allocation waterfall. The allocation story is the clearest evidence of the strategic pivot from growth-at-all-costs to shareholder return. Dividends did not exist until FY2025 ($1,537.0M), rising to $1,587.0M in FY2026. Buybacks began in earnest in FY2023 ($4,000.0M) and accelerated sharply to $12,596.0M by FY2026. Over the FY2022–FY2026 window, essentially all cumulative free cash flow has been routed to repurchases and, latterly, dividends, with acquisitions (Informatica) funded on top via debt rather than from the FCF stream. In FY2026 alone, buybacks plus dividends absorbed close to the entire $14,402.0M of free cash flow, and the incremental acquisition was debt-funded — which is why equity fell and net debt appeared in the same year. For a business whose organic reinvestment needs are modest and whose highest-return use of capital is arguably continued tuck-in M&A into the data/AI stack, a buyback-weighted return policy is defensible; the qualification is that the pace is now leveraged and substantially exists to offset SBC dilution rather than to shrink the share count on a net basis — diluted shares fell only from 984M to 956M despite $12,596.0M spent in the final year.
⚠ Items to Watch. If the gap between free cash flow and stock-based compensation-adjusted cash flow widens — i.e., if SBC as a share of revenue climbs from the $3,509.0M FY2026 level — the quality of the reported FCF margin deteriorates even as the headline holds. If buybacks continue to exceed free cash flow while net debt builds beyond $7,112.0M, the return program becomes progressively more debt-financed, a materially lower-quality driver of per-share metrics than self-funded repurchase. And a sustained decline in operating cash flow below net income (adjusted for the investment mark) would signal that the working-capital tailwind from advance billings has turned — the first place a bookings slowdown would surface in cash.
3.4 Returns Analysis
| FY2022 | FY2023 | FY2024 | FY2025 | FY2026 | |
|---|---|---|---|---|---|
| ROIC | 1.0% | 0.5% | 6.8% | 9.9% | 10.3% |
| ROE | 2.9% | 0.4% | 7.0% | 10.3% | 12.4% |
| ROA | 1.8% | 0.2% | 4.2% | 6.1% | 6.9% |
| Interest Coverage | 2.5x | 3.6x | 17.7x | 26.5x | 25.7x |
Source: Company SEC filings (10-K); figures per the FL model — see Appendix A.1–A.2. All return metrics are analyst-computed (underlined).
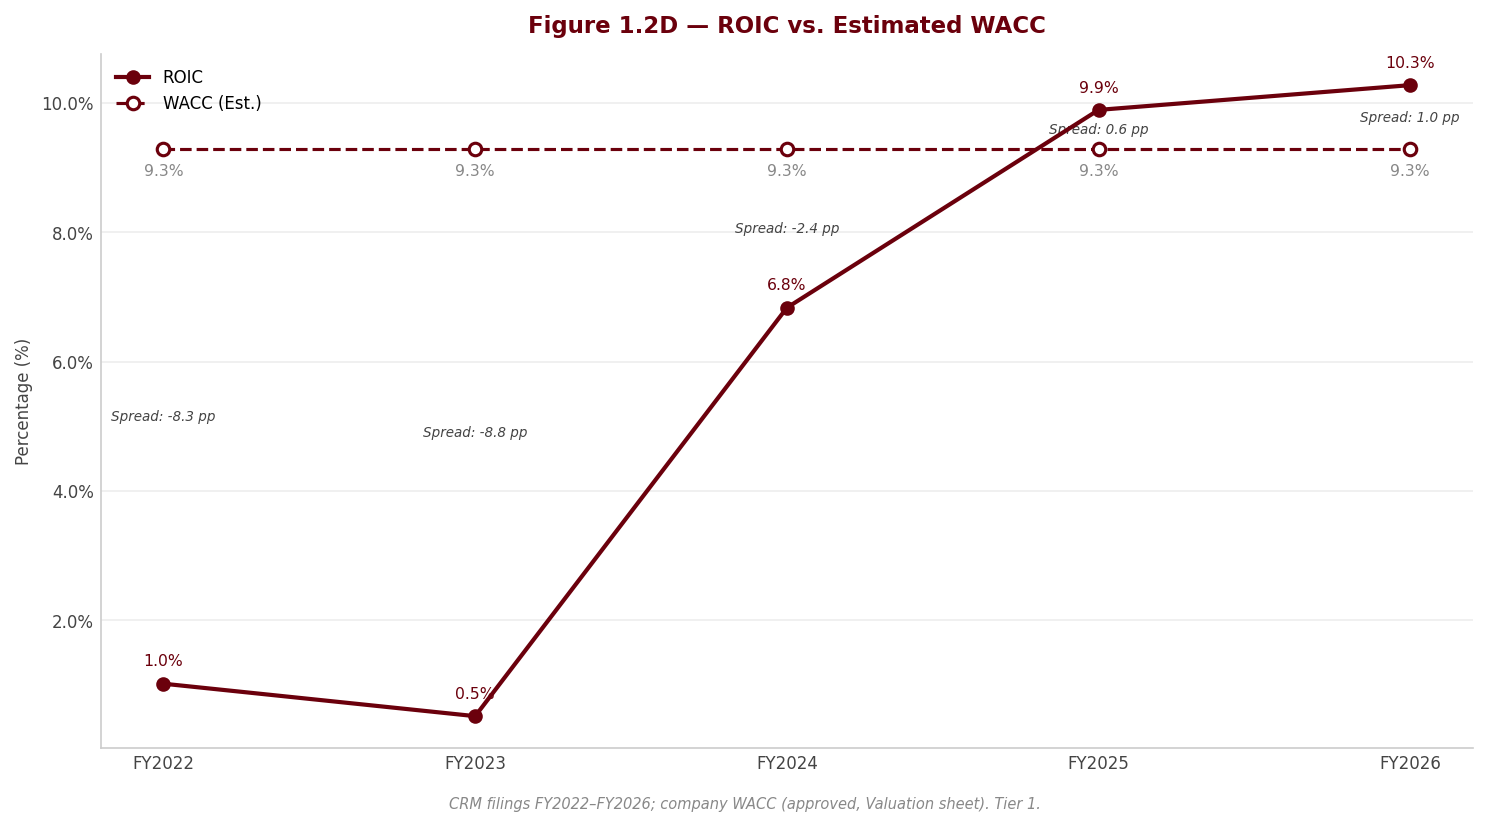
ROIC is the metric that matters, and it only recently cleared its hurdle. Return on invested capital tells the same story as the operating margin but with the capital base included, which for an acquisition-built company is the harder test. ROIC was effectively nil during the growth era — 1.0% in FY2022 and 0.5% in FY2023 — because a modest operating profit was being earned on an enormous invested-capital base swollen by goodwill. [Rating and price target withdrawn — see the note at the top.] This is the crux of the long-term case: for most of the past decade Salesforce destroyed economic value on an ROIC-versus-cost-of-capital basis, because the returns on its large acquisitions did not cover their cost. Only in the last two years has ROIC risen to roughly the level of a large-cap software cost of capital — the spread over WACC has, on these figures, only just turned positive, and the separate valuation tests that comparison formally against the derived WACC. Two cautions temper the improvement. [Rating and price target withdrawn — see the note at the top.] Second, the denominator is dominated by goodwill; a business that has to keep acquiring to grow must keep clearing a rising invested-capital bar. The trajectory is unambiguously positive and structural, but the spread over the cost of capital is thin and newly earned, not wide and established — which is central to why this report treats the equity as fairly valued rather than cheap.
DuPont decomposition. Decomposing FY2026 ROE of 12.4% into its drivers, the components are a net margin of 18.0%, an asset turnover of 0.39x, and an equity multiplier of 1.79x. The signature is distinctive: ROE is lifted by a high net margin and held down by a very low asset turnover — the mirror image of a capital-light-but-asset-heavy structure, where “asset-heavy” means goodwill rather than plant. Net margin is the swing factor that drove ROE from near-zero in FY2023 to double digits in FY2026, and it is precisely the line most exposed to the tax and investment-mark distortions flagged above, so the FY2026 ROE flatters the durable return by the same margin that reported net income does. The equity multiplier ticked up in FY2026 as debt entered the structure, adding a modest, and newly leveraged, contribution to ROE. In short, the returns improvement is real and margin-led, but the quality of the FY2026 endpoint is overstated by the same non-operating items that inflate net income, and its ROE is now getting a small assist from leverage that did not exist a year earlier. Interest coverage, at 25.7x, remains very high and confirms that the new debt is trivial against operating earnings — the leverage is a change in character, not a burden on the income statement.
3.5 Altman Z-Score (Most Recent FY)
| Component | FY2024 | FY2025 | FY2026 |
|---|---|---|---|
| X1 (Working Capital / Total Assets) | 0.024 | 0.017 | -0.079 |
| X2 (Retained Earnings / Total Assets) | 0.117 | 0.159 | 0.198 |
| X3 (EBIT / Total Assets) | 0.050 | 0.070 | 0.074 |
| X4 (Equity / Total Liabilities) | 1.485 | 1.465 | 1.112 |
| X5 (Revenue / Total Assets) | 0.349 | 0.368 | 0.370 |
| Z-Score | 1.60 | 1.72 | 1.46 |
| Zone | Gray/Distress boundary | Gray/Distress boundary | Gray/Distress boundary |
Source: Company SEC filings (10-K); figures per the FL model — see Appendix A.1–A.2. Z-Score and components are analyst-computed (underlined).
Variant note: X4 here is book equity to total liabilities, not the market value of equity used in Altman’s original formulation — the book-value treatment belongs to the Z’‘/non-manufacturer variant. The score foots exactly as printed from the components below, but it should be read as the book-equity variant rather than the classic Z.
Interpret the score, then discount it heavily for the model. On its face the Altman Z-Score sits below the 1.81 distress threshold across all three years — 1.60, 1.72 and 1.46 — and it actually fell in FY2026 even though FY2026 was the most profitable year in the company’s history. Both facts are model artifacts, not credit signals, and it would be an analytical error to read them literally. The FY2026 decline is mechanical: the FY2026 current debt maturity of $4,000.0M turned working capital negative (X1 flipped to -0.079), and the new debt cut the equity-to-liabilities ratio (X4 fell to 1.112 from 1.465); the profitability components (X3, X5) actually improved. More fundamentally, the Z-Score was calibrated on mid-twentieth-century manufacturers, and it systematically understates the resilience of an asset-light software company for two structural reasons visible in the components here. First, X5 (asset turnover) is inherently low — 0.370 — because revenue is generated off a goodwill-inflated asset base rather than off working plant, penalizing a company that needs far less revenue-per-asset to be safe. Second, X1 and X4 are depressed by the negative tangible book and the advance-billing model (unearned revenue is a current liability that makes working capital look negative even though it is customer-funded float, a source of strength). Corroborating evidence contradicts the distress reading outright: interest coverage of 25.7x, net debt/EBITDA of 0.6x, and $14,402.0M of free cash flow describe an unambiguously investment-grade credit. The honest conclusion is that the Z-Score is uninformative for this issuer, and the trend within it — a mechanical dip driven by one refinanceable maturity — should not be mistaken for deteriorating credit quality. It is included for completeness and disclosure, not because it carries a credit verdict here.
4. Valuation withdrawn
This section stated what the shares were worth and what to do about them. It rested on an exit multiple set by hand — across the coverage it averaged 24% below where each company actually traded — so the conclusion largely restated that assumption instead of testing it. Rather than leave it standing, it has been withdrawn while the method is rebuilt.
Nothing else in this report depends on it: the financial analysis above and below is drawn from the company's own filings, and every figure links to the page it was verified against.
Section 5 — Financial Metrics & Peer Benchmarking
5.1 Peer Selection
sources Salesforce has no true like-for-like comparable — no other company is a pure-play enterprise CRM vendor at its scale — so the peer set is built deliberately around three axes of comparability rather than one, and each name is included for a specific, defensible reason. ServiceNow, Inc. is the closest pure-play: an enterprise-workflow SaaS business with an almost identical gross-margin structure and subscription model, differing from Salesforce mainly in that it is roughly a third of the size and still growing considerably faster. Oracle Corporation and Microsoft Corporation are the two scale competitors Salesforce names directly in its own competition disclosure — they are the incumbents whose platforms bundle CRM-adjacent functionality and against whom Salesforce competes for enterprise IT budget; they are included because a benchmarking section that omitted the competitors management itself cites would be incomplete. [Rating and price target withdrawn — see the note at the top.]
The set has two stated limitations that govern how the tables below must be read, and both are developed in 5.7. First, the fiscal calendars do not line up. Salesforce’s year ends 31 January; ServiceNow, Inc.’s December and Adobe Inc.’s late-November year-ends fall within a month or two and are treated as comparable, but Oracle Corporation’s May year-end is roughly eight months stale relative to Salesforce and Microsoft Corporation’s June year-end is roughly five months ahead — so those two capture a different slice of the AI/cloud cycle and their figures are directional only. Second, Oracle Corporation and Microsoft Corporation are diversified, capital-heavy businesses, not pure software: both are spending a third or more of revenue building owned AI infrastructure, which pulls their blended margins and free-cash-flow economics onto a different basis from Salesforce’s asset-light model. They are scale competitors, not clean multiples.
| Peer | Ticker | Exchange | Filing Type | Accounting Standard | Fiscal Year End | Comparability Note |
|---|---|---|---|---|---|---|
| ServiceNow, Inc. | NOW | NYSE | 10-K | US GAAP | December | Closest pure-play enterprise-workflow SaaS comparable; December year-end (~1 month before CRM) treated comparable. |
| Oracle Corporation | ORCL | NYSE | 10-K | US GAAP | May | Named scale competitor, but May year-end is ~8 months stale and the business mixes software with a capital-heavy data-center buildout — directional only. |
| Adobe Inc. | ADBE | NASDAQ | 10-K | US GAAP | November/December | Closest large-cap application-software comparable on growth and margin; November year-end (~2 months before CRM) treated comparable. |
| Microsoft Corporation | MSFT | NASDAQ | 10-K | US GAAP | June | Named scale competitor, but June year-end is ~5 months ahead and the business spans cloud infrastructure, gaming and devices — directional only. |
Source: Peer-company SEC filings; comparability notes in 5.7 — see Appendix A.1.
All four peers report under US GAAP, so there is no IFRS-translation distortion in this set — the comparability problems here are period-alignment, business-mix and stock-based-compensation intensity, not accounting standard.
5.2 Profitability Comparison
sources Comparative: Most Recent Full Fiscal Year
| Metric | Salesforce, Inc. | ServiceNow, Inc. | Oracle Corporation | Adobe Inc. | Microsoft Corporation |
|---|---|---|---|---|---|
| Revenue ($M) | $41,525.0M | $13,278.0M | $57,399.0M | $23,769.0M | $331,839.0M |
| Gross Margin | 77.7% | 77.5% | 70.5%ᶜ | 89.3% | 67.9% |
| EBITDA Margin | 28.8% | 19.3% | 41.6% | 40.1% | 58.4% |
| EBIT Margin | 20.1% | 13.7% | 30.8% | 36.6% | 46.8% |
| Net Margin | 18.0% | 13.2% | 21.7% | 30.0% | 40.3% |
| FCF Margin | 34.7% | 34.5% | -0.7% | 41.4% | 20.2% |
Source: Peer-company SEC filings; comparability notes in 5.7 — see Appendix A.1.
Flag legend: ᶠ = IFRS-translated (directional only); ᵐ = market-sourced; ᶜ = computed from filing components. Oracle Corporation prints no gross-profit line, so its gross margin (ᶜ) is analyst-computed and, because it excludes intangible amortization booked as a separate operating line, is not defined on the same basis as the other four — see 5.7.
The honest read is that Salesforce sits squarely in the middle of the pack on profitability — better than the fast-grower, well behind the diversified incumbents — and that the gap in either direction is as much about business mix and cost accounting as about operating quality. On gross margin, Salesforce is effectively level with ServiceNow, Inc. and below Adobe Inc., whose markedly higher gross margin reflects a more mature, lower-support product mix; Oracle Corporation’s lower figure is not comparable at all (computed, and diluted by hardware and a heavy owned-infrastructure cost base). It is on operating margin that the picture is most instructive: Salesforce’s EBIT margin sits comfortably above ServiceNow, Inc. — the pure-play peer earns a materially thinner operating margin because it carries by far the heaviest stock-based-compensation load in the group inside its GAAP operating line — but well below Adobe Inc., Oracle Corporation and Microsoft Corporation. Some of that shortfall is real (Salesforce’s operating leverage is younger and less complete, as Section 3 traced), but a meaningful part is not like-for-like: Oracle Corporation’s and Microsoft Corporation’s margins blend pure-software economics with capital-heavy infrastructure and, in Microsoft Corporation’s case, cover a fiscal year ending five months later that captures more of the AI/cloud upswing. The FCF-margin row tells the cleanest story of the group — Salesforce is roughly level with ServiceNow, Inc. and behind only Adobe Inc., while Oracle Corporation’s is negative and Microsoft Corporation’s is depressed to roughly half its EBITDA margin — but that row is driven almost entirely by capital intensity and is dissected in 5.4 and 5.6.
The single most important caveat before reading any margin in this table is stock-based compensation, which differs enormously across the group and is expensed inside every GAAP figure here. As a share of revenue it ranges from the heaviest at ServiceNow, Inc. — roughly double Salesforce’s load — down through Salesforce, Adobe Inc. and Oracle Corporation at broadly similar mid-single-digit-to-high-single-digit levels, to the lightest at Microsoft Corporation, whose SBC is less than half Salesforce’s as a percentage of sales. That dispersion alone can move GAAP operating and net margins by several points, and it flatters the lighter diluters (Microsoft Corporation) relative to the heavier ones (ServiceNow, Inc., Salesforce) in a way that has nothing to do with underlying cash economics. Cross-company margin comparisons in this table are therefore not like-for-like until SBC is normalized — the ranking above understates ServiceNow, Inc.’s and Salesforce’s true cash margins relative to Microsoft Corporation’s. This is the caveat that matters most in the whole section, and it recurs in the valuation discussion in 5.5.
Historical: Salesforce, Inc. Own 5-Year Progression
| Metric | FY2022 | FY2023 | FY2024 | FY2025 | FY2026 |
|---|---|---|---|---|---|
| Gross Margin | 73.5% | 73.3% | 75.5% | 77.2% | 77.7% |
| EBITDA Margin | 14.5% | 15.4% | 25.7% | 28.2% | 28.8% |
| EBIT Margin | 2.1% | 3.3% | 14.4% | 19.0% | 20.1% |
| Net Margin | 5.5% | 0.7% | 11.9% | 16.4% | 18.0% |
| FCF Margin | 19.9% | 20.1% | 27.2% | 32.8% | 34.7% |
Source: Peer-company SEC filings; comparability notes in 5.7 — see Appendix A.1.
The company’s own five-year path reframes the cross-sectional snapshot: Salesforce is mid-pack today because it spent this period climbing. [Rating and price target withdrawn — see the note at the top.] The point for benchmarking is that Salesforce’s mid-pack standing is the endpoint of a steep, recent, and largely structural improvement, not a stable equilibrium; whether it keeps closing the gap to Adobe Inc. and the diversified incumbents, or plateaus in the mid-twenties as the base case in the separate valuation assumes, is the live question. The margin the market appears to disbelieve is the one still to be earned, not the one already banked.
5.3 Returns Comparison
sources Comparative: Most Recent Full Fiscal Year
| Metric | Salesforce, Inc. | ServiceNow, Inc. | Oracle Corporation | Adobe Inc. | Microsoft Corporation |
|---|---|---|---|---|---|
| ROIC | 10.3% | 13.1% | 15.1% | 57.3%ⁿᵐ | 27.1% |
| ROE | 12.4% | 15.5% | 82.4%ⁿᵐ | 55.4%ⁿᵐ | 34.0% |
| ROA | 6.9% | 7.5% | 8.0% | 23.9% | 19.4% |
| Asset Turnover | 0.37x | 0.57x | 0.37x | 0.80x | 0.48x |
Source: Peer-company SEC filings; comparability notes in 5.7 — see Appendix A.1.
ⁿᵐ Not meaningful: Oracle Corporation’s ROE and Adobe Inc.’s ROE and ROIC are computed on a book-equity base hollowed out by sustained buybacks (and, for Oracle Corporation, an accumulated deficit), inflating the ratio without reflecting superior returns — see 5.7.
Read literally, this table appears to rank Salesforce near the bottom on returns; read correctly, it does not, because the highest figures in it are artifacts of capital structure rather than evidence of better businesses. Adobe Inc.’s ROIC of 57.3% and ROE of 55.4%, and Oracle Corporation’s ROE of 82.4%, are not returns superiority — they are the mechanical result of years of buybacks shrinking the denominator, to the point where Oracle Corporation’s book equity is depressed by a large accumulated deficit and Adobe Inc.’s is a small residual after tens of billions of treasury stock. These figures are flagged not-meaningful and must not be presented to a portfolio manager as proof those companies earn better returns on capital; they are a warning about the denominator. Strip them out and the meaningful comparison is narrower: Salesforce’s ROIC of 10.3% sits below ServiceNow, Inc.’s and well below Microsoft Corporation’s, and its ROE and ROA are likewise mid-pack. On ROA — the return metric least distorted by leverage and buybacks — Salesforce’s asset-light-but-goodwill-heavy structure shows through: its very low asset turnover of 0.37x, driven by a goodwill-inflated asset base rather than working plant, holds ROA down relative to Adobe Inc. and Microsoft Corporation.
[Rating and price target withdrawn — see the note at the top.] That is the central reason this report treats the equity as fairly valued rather than cheap: unlike the mature incumbents whose returns comfortably clear their cost of capital, Salesforce has only lately crossed into value creation, and the durability of that crossing is not yet established. One structural caveat cuts across all book-based figures in this table and is worth flagging as a monitoring item: Salesforce’s own book equity is almost entirely goodwill and intangibles — its tangible book is negative — so its ROE and invested-capital denominators are, like Oracle Corporation’s and Adobe Inc.’s, distorted, just in the opposite direction (bloated by acquisition premium rather than shrunk by buybacks). Book-based returns are noisy across this entire group; ROIC on a normalized operating basis, and ROA, are the cleaner cross-company reads.
Historical: Salesforce, Inc. Own 5-Year Progression
| Metric | FY2022 | FY2023 | FY2024 | FY2025 | FY2026 |
|---|---|---|---|---|---|
| ROIC | 1.0% | 0.5% | 6.8% | 9.9% | 10.3% |
| ROE | 2.9% | 0.4% | 7.0% | 10.3% | 12.4% |
| ROA | 1.8% | 0.2% | 4.2% | 6.1% | 6.9% |
Source: Peer-company SEC filings; comparability notes in 5.7 — see Appendix A.1.
[Rating and price target withdrawn — see the note at the top.] The improvement is unambiguous and structural, but it is young. A peer set in which the mature names have earned high returns for years, and Salesforce has earned an adequate one for two, is exactly a set in which Salesforce should trade at a discount on returns-based logic — which, as 5.5 shows, it does.
5.4 Leverage & Liquidity Comparison
sources Comparative: Most Recent Full Fiscal Year
| Metric | Salesforce, Inc. | ServiceNow, Inc. | Oracle Corporation | Adobe Inc. | Microsoft Corporation |
|---|---|---|---|---|---|
| Net Debt / EBITDA | 0.6x | -1.9x | 3.4x | -0.0x | -0.2x |
| Total Debt / Equity | 0.2x | 0.1x | 4.4xⁿᵐ | 0.5x | 0.1x |
| Interest Coverage | 25.7x | 79.3x | 4.9x | 33.1x | 50.9x |
| Current Ratio | 0.8x | 1.0x | 0.8x | 1.0x | 1.2x |
| FCF Margin | 34.7% | 34.5% | -0.7% | 41.4% | 20.2% |
Source: Peer-company SEC filings; comparability notes in 5.7 — see Appendix A.1.
ⁿᵐ Oracle Corporation’s debt/equity is not meaningful — the ratio is inflated by the same depressed book-equity denominator noted in 5.3, not solely by high debt.
The one genuine leverage signal in this group belongs to Oracle Corporation, and it should be treated as one. ServiceNow, Inc., Adobe Inc. and Microsoft Corporation all sit in net-cash positions (negative net debt/EBITDA), and Salesforce is modestly net-levered. Oracle Corporation alone carries a material net-debt load — net debt/EBITDA of 3.4x — the direct consequence of funding its owned data-center buildout with heavy borrowing. Unlike its not-meaningful ROE, this is not a book-value artifact: it is a real, cash-servicing obligation, and it shows up in the interest-coverage row, where Oracle Corporation’s coverage is by far the lowest in the group while every other name (including Salesforce, at 25.7x) covers interest many times over. Oracle Corporation’s total-debt/equity optically screams the loudest, but that figure is distorted by the depressed equity denominator and overstates the true leverage gap; net debt/EBITDA and interest coverage are the honest measures, and on those Oracle Corporation is the clear outlier.
Two cautions apply specifically to Salesforce’s own figures in this table. First — and this is the load-bearing caveat — Salesforce’s leverage here is dated at its 31 January 2026 balance sheet and understates its current leverage. As Section 3 established, in March 2026 the company issued roughly twenty-five billion dollars of notes to fund an accelerated buyback, lifting noncurrent debt to roughly thirty-nine billion dollars. The net debt/EBITDA of 0.6x and debt/equity of 0.2x shown above therefore predate that step-up; today’s leverage is higher, though still investment-grade and comfortably serviced. Any enterprise-value multiple for Salesforce must state which balance-sheet date it uses, because the leverage figures here and the EV figures in 5.5 sit on two different dates by construction. Second, Salesforce’s current ratio dipping under one is not a liquidity warning — it fell below that mark for the first time this year purely because the four-billion-dollar Informatica facility maturing within twelve months reclassified into current liabilities, a maturity-classification effect on a business that is financed by advance customer billings, not a working-capital squeeze. Finally, the FCF-margin row is repeated here as a reminder that it is not measuring the same thing across the group: Oracle Corporation’s is negative and Microsoft Corporation’s is depressed because both are pouring cash into capex, a distinction developed in 5.6.
5.5 Valuation Multiples Comparison
sources Comparative: Current Price
| Metric | Salesforce, Inc. | ServiceNow, Inc. | Oracle Corporation | Adobe Inc. | Microsoft Corporation |
|---|---|---|---|---|---|
| EV/EBITDA | 15.6x | 46.4x | 20.4x | 11.1x | 18.2x |
| P/E | 24.5x | 70.8x | 32.5x | 14.9x | 26.6x |
| FCF Yield | 7.9% | 3.7% | -0.1% | 9.3% | 1.9% |
Source: Peer-company SEC filings; comparability notes in 5.7 — see Appendix A.1.
All peer valuation multiples are market-sourced (prices at the 2026-08-04 close) over each company’s own most-recent fiscal-year fundamentals; for Oracle Corporation and Microsoft Corporation the price date and the fundamental period differ by eight and five months respectively (see 5.7). Subject to change with price movements.
Lead with EV/EBITDA, not P/E — because net income is distorted in different directions for several of these companies and the enterprise-value measure is the only one that reads cleanly across the set. Microsoft Corporation’s net income is inflated by large non-operating investment gains, Oracle Corporation’s is weighed down by heavy interest expense, and Salesforce’s own is flattered by the reversible strategic-investment mark flagged throughout this report — so P/E is comparing five differently-distorted bottom lines. It also embeds the SBC dispersion from 5.2. EV/EBITDA neutralizes the capital-structure and non-operating noise (though not, on its own, the SBC add-back or the capex differences). [Rating and price target withdrawn — see the note at the top.] The P/E and FCF-yield rows corroborate rather than contradict this: Salesforce carries one of the lower P/Es and one of the higher free-cash-flow yields in the set.
The interpretation is the crux of the whole report. Salesforce screens cheap on every valuation line here not because the market has mispriced it, but because the market is already pricing it as a mature, decelerating business rather than a growth compounder — exactly the profile Section 3 described. The premium multiples in this table (ServiceNow, Inc. above all) are attached to the names with faster growth or higher, more-established returns; the discounted ones (Adobe Inc., Salesforce) are attached to the mature de-raters. A low multiple is only opportunity if the business is better than the multiple implies, and the returns and growth analysis above does not support that claim: Salesforce’s ROIC has only just cleared its cost of capital and its growth is decelerating. The multiple, in other words, looks about right for what the fundamentals show — which is precisely why this report concludes fairly valued rather than expensive or cheap. One mechanical caveat must accompany Salesforce’s numbers here: its EV is struck on the current, post-buyback share count and the 2026-08-04 price, whereas its leverage inputs in 5.4 are dated at the January year-end — the two are deliberately on different dates, and the reader should not blend them.
Historical: Salesforce, Inc. EV/EBITDA (period-end price)
| FY2022 | FY2023 | FY2024 | FY2025 | FY2026 |
|---|---|---|---|---|
| 60.2x | 35.5x | 30.9x | 31.1x | 17.6x |
Source: Peer-company SEC filings; comparability notes in 5.7 — see Appendix A.1.
Against its own history the same conclusion holds. [Rating and price target withdrawn — see the note at the top.] But the compression is the market’s verdict on decelerating growth, not an anomaly waiting to correct. [Rating and price target withdrawn — see the note at the top.]
5.6 Efficiency Comparison
| Metric | Salesforce, Inc. | ServiceNow, Inc. | Oracle Corporation | Adobe Inc. |
|---|---|---|---|---|
| Days Sales Outstanding | 116 days | 72 days | 54 days | 36 days |
| Days Inventory Outstanding | - days | 0 days | 0 days | 0 days |
| Days Payables Outstanding | 294 days | 25 days | 110 days | 60 days |
| Cash Conversion Cycle | -178 days | 47 days | -56 days | -24 days |
| CapEx / Revenue | 1.4% | 6.5% | 37.0% | 0.8% |
Source: Peer-company SEC filings; comparability notes in 5.7 — see Appendix A.1.
The working-capital rows in this table carry very little information for subscription-software businesses, and should not be used to rank these companies. All four bill in advance and hold no meaningful inventory, so days-inventory-outstanding is effectively nil (not-meaningful) across the set, and the cash-conversion cycle — which nets inventory, receivables and payables — is not measuring an operating cycle that exists here. The economically important working-capital line for all of these companies is deferred/unearned revenue, the customer prepayment that funds the business as negative working capital; that does not appear in DSO/DIO/DPO/CCC at all. Two specific distortions compound the problem for Salesforce: its days-payables and cash-conversion figures are computed off a single combined balance-sheet line (“accounts payable, accrued expenses and other liabilities”), because Salesforce does not disclose trade payables separately — so its DPO is dominated by accrued compensation and operating accruals, is not a trade-payment period, and its CCC is correspondingly meaningless. Days-sales-outstanding is the one row here with genuine content, and on it Salesforce collects broadly in line with the group; the modest reading is unremarkable for enterprise software billed annually.
The row that does matter is CapEx/Revenue, and it exposes the deepest non-comparability in the peer set. Salesforce is genuinely asset-light — its capex is a tiny fraction of revenue — while Oracle Corporation is spending well over a third of revenue building owned AI infrastructure (with Microsoft Corporation, whose working-capital metrics are omitted from this table because it is the only name in the set carrying a real inventory line and the most diversified of the four, so its cash-conversion cycle measures a different business mix rather than a comparable software one, at a similar third of revenue). That single difference drives free cash flow in opposite directions: it is why Oracle Corporation’s FCF margin in 5.2/5.4 is negative and Microsoft Corporation’s is roughly half its EBITDA margin, while Salesforce converts a far higher share of EBITDA to cash. “Free cash flow margin” is therefore not comparing the same thing across this group — for the capex-heavy names it is measured after a massive, partly discretionary, growth-infrastructure outlay that Salesforce simply does not incur. One important qualification keeps Salesforce’s asset-light screen honest: the company rents its compute rather than owning it, and the separate valuation sized its off-balance-sheet infrastructure and cloud purchase commitments at roughly seventeen billion dollars, with a portion due within twelve months. Salesforce’s true committed compute spend is far larger than its trivial capex line suggests — it simply runs through operating cost and off-balance-sheet obligations rather than through property and equipment. The asset-light advantage is real, but the gap to Oracle Corporation and Microsoft Corporation is narrower in economic substance than the capex row alone implies.
5.7 Comparability Caveats
sources The comparison above is only as good as its caveats. The following material issues govern how every table in this section must be read; each is already reflected in the commentary above rather than raised here for the first time.
1. Fiscal-period mismatch — Oracle Corporation and Microsoft Corporation (material). Salesforce’s FY2026 ended 31 January 2026. ServiceNow, Inc. (December) and Adobe Inc. (late November) fall within roughly a month or two and are treated as comparable. But Oracle Corporation’s fiscal year ended in May 2025 — about eight months before Salesforce’s period, so its figures predate two-plus quarters of AI/cloud momentum and are materially stale — and Microsoft Corporation’s ended in June 2026, about five months after, capturing extra growth Salesforce’s year does not. Neither is period-aligned with Salesforce; every Oracle Corporation and Microsoft Corporation figure in this section is directional only, and their valuation multiples in 5.5 pair a same-date market price against fundamentals from a different period-end.
2. Business mix and capital intensity — Oracle Corporation and Microsoft Corporation (material). Both are diversified, capital-heavy businesses, not pure software: Oracle Corporation carries hardware and a large owned data-center (OCI) buildout with capex above a third of revenue and negative free cash flow; Microsoft Corporation spans cloud infrastructure, gaming, devices and advertising, also at roughly a third of revenue in capex. Their blended gross, operating and EBITDA margins and their FCF margins are not on the same basis as Salesforce’s asset-light model (capex a low-single-digit percent of revenue, high FCF conversion). Additionally, Oracle Corporation prints no gross-profit line, so its gross margin in 5.2 is analyst-computed (ᶜ) and excludes intangible amortization it reports as a separate operating line — it is not defined on the same basis as the other four and should be read as directional.
3. Stock-based compensation dispersion — all four peers (material). SBC as a share of revenue ranges from roughly double Salesforce’s at ServiceNow, Inc. down to less than half at Microsoft Corporation, and it is expensed inside every GAAP margin and every P/E in this section. This materially distorts cross-company GAAP-margin and P/E comparisons: it depresses the heavy diluters’ (ServiceNow, Inc., Salesforce) reported margins relative to the light diluter’s (Microsoft Corporation) without any difference in underlying cash economics. This is why the valuation comparison in 5.5 leads with EV/EBITDA and EV/EBIT-type enterprise measures rather than P/E, and why the reader should not treat GAAP net-margin or P/E rankings as like-for-like. Non-operating items compound the P/E problem — Microsoft Corporation’s net income carries large investment gains, Oracle Corporation’s heavy interest expense, Salesforce’s the reversible strategic-investment mark.
4. Buyback-distorted book equity — Oracle Corporation and Adobe Inc. (material). Oracle Corporation’s ROE of 82.4% and Adobe Inc.’s ROE of 55.4% / ROIC of 57.3% are not return superiority. Oracle Corporation’s equity is depressed by a large accumulated deficit from years of buybacks (with correspondingly not-meaningful debt/equity and book value per share); Adobe Inc.’s equity is a small residual after tens of billions of treasury stock. Both are flagged not-meaningful (ⁿᵐ) in 5.3–5.4 and must not be read as evidence those companies earn better returns. By contrast, Oracle Corporation’s net debt/EBITDA of 3.4x is a genuine leverage signal versus the net-cash peers and is treated as one. Salesforce’s own book equity is a mirror-image distortion — almost entirely goodwill and intangibles, with negative tangible book — so its book-based returns are also noisy; ROIC on a normalized operating basis and ROA are the cleaner reads across the whole group.
5. Salesforce’s post-year-end capital-structure change (material). All of Salesforce’s balance-sheet-derived figures in this section — net debt/EBITDA, debt/equity, current ratio — are dated at the 31 January 2026 balance sheet and understate current leverage. In March 2026 the company issued roughly twenty-five billion dollars of notes to fund a twenty-five-billion-dollar accelerated buyback, taking noncurrent debt to roughly thirty-nine billion dollars and cutting the share count. Salesforce’s EV multiples in 5.5, by contrast, use the current (post-buyback) share count and the 2026-08-04 market cap — so the company’s leverage figures and its EV figures sit on two different dates by construction. The reader must not blend them without this caveat.
6. Working-capital and cash-conversion metrics — all four peers (informational). DIO/DPO/CCC carry low information content for subscription software that bills in advance and holds no inventory; only Microsoft Corporation has a meaningful inventory line. For Salesforce specifically, days-payables and the cash-conversion cycle are additionally distorted because they are computed off a single combined “accounts payable, accrued expenses and other liabilities” line rather than trade payables. These rows should not be used to rank the companies; deferred/unearned revenue growth, not CCC, is the economically relevant working-capital measure.
7. Market-sourced valuation multiples (informational). All EV/EBITDA, P/E, EV/Revenue-type and FCF-yield figures in 5.5 are Tier-2 / market-sourced, struck at the 2026-08-04 close over each company’s own most-recent fiscal-year fundamentals. Because those period-ends differ (per caveat 1), Oracle Corporation’s multiple prices today’s equity against roughly eight-month-old EBITDA and Microsoft Corporation’s against a year ending five months later. [Rating and price target withdrawn — see the note at the top.]
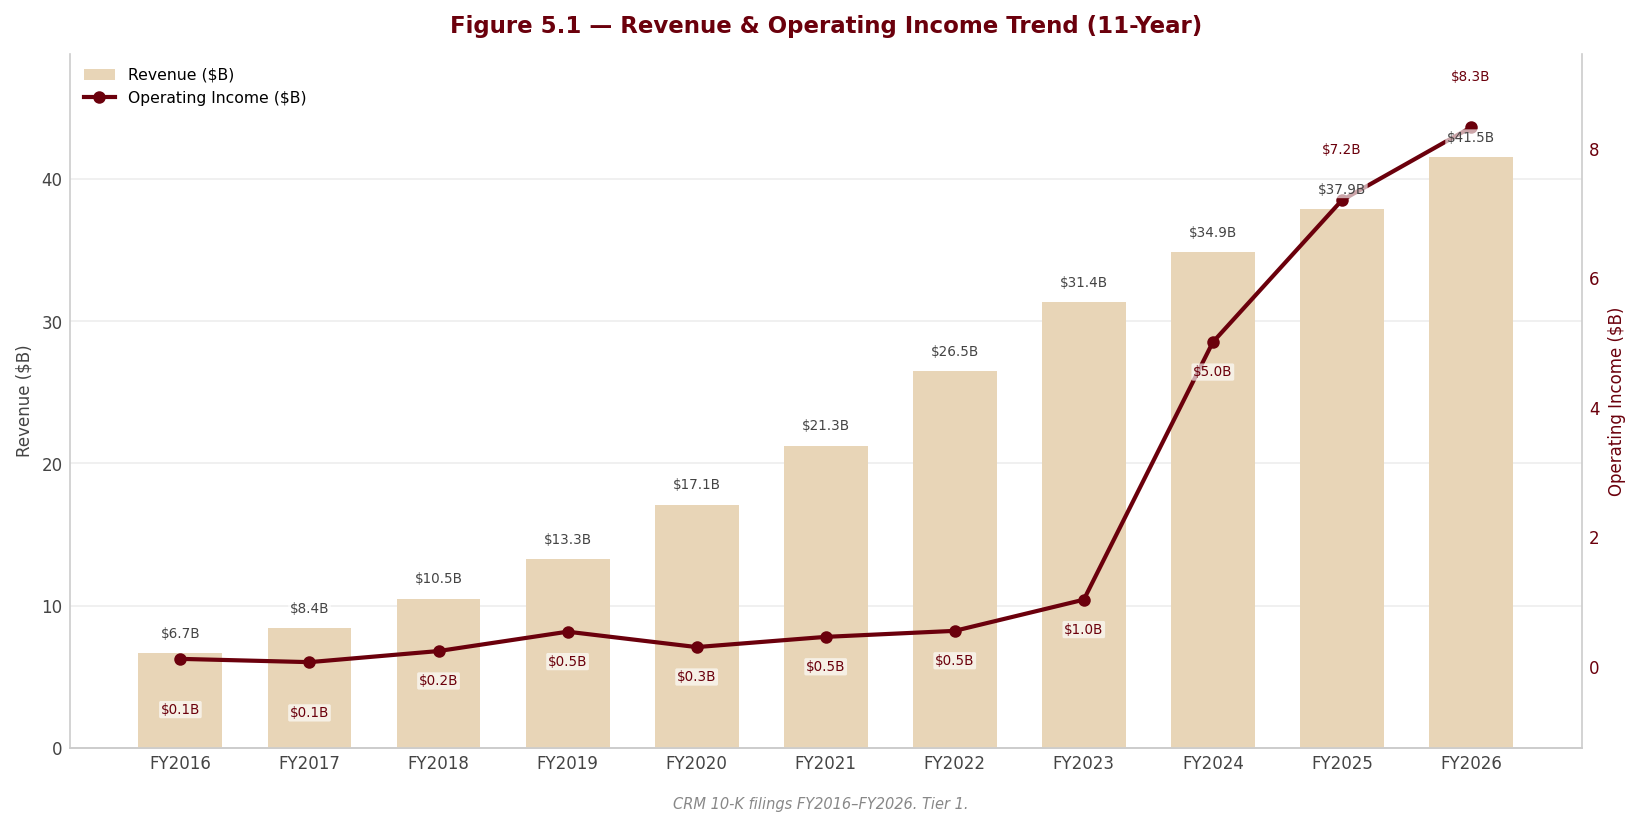
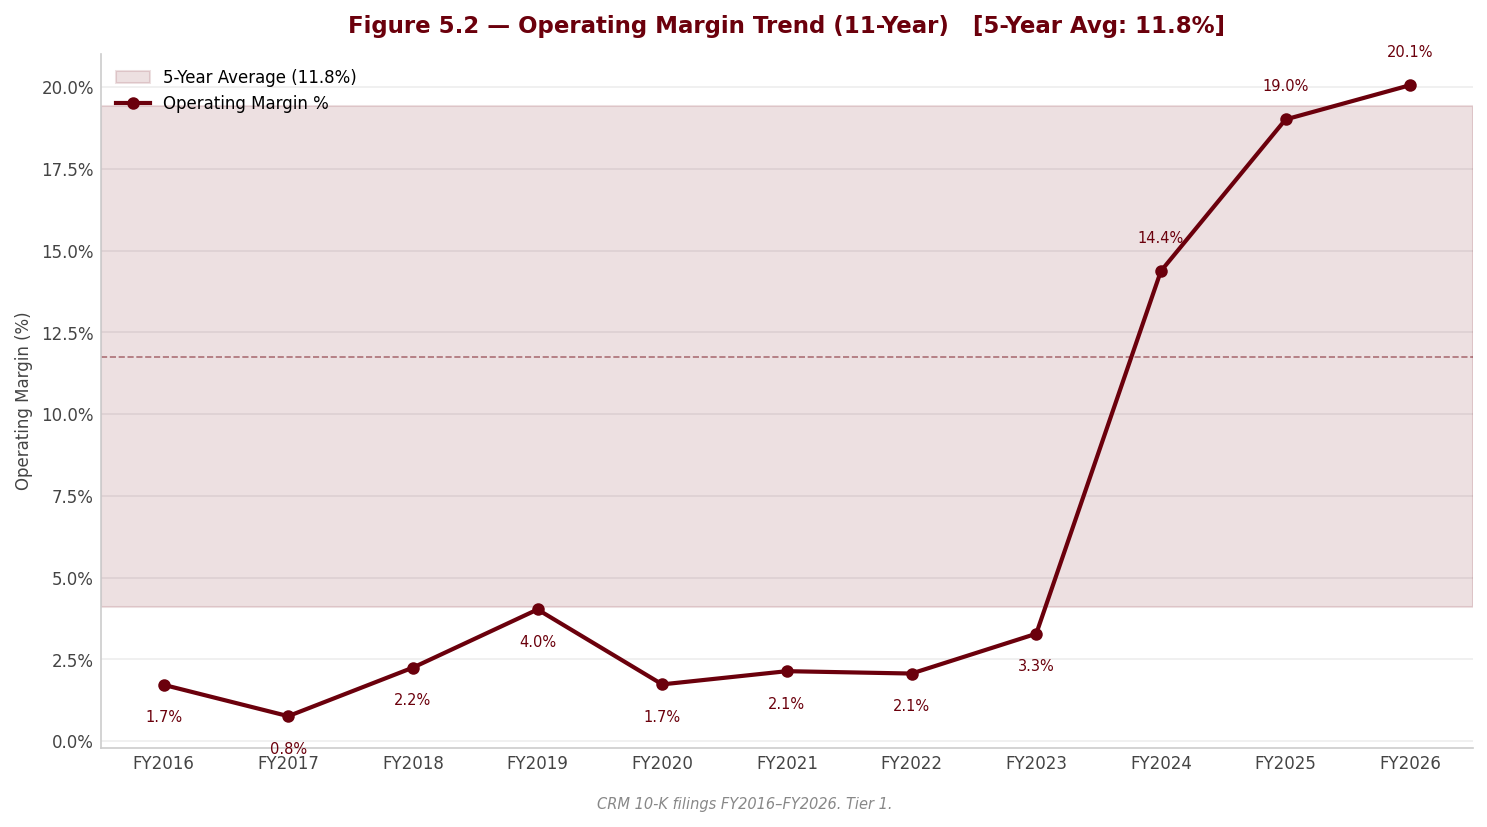
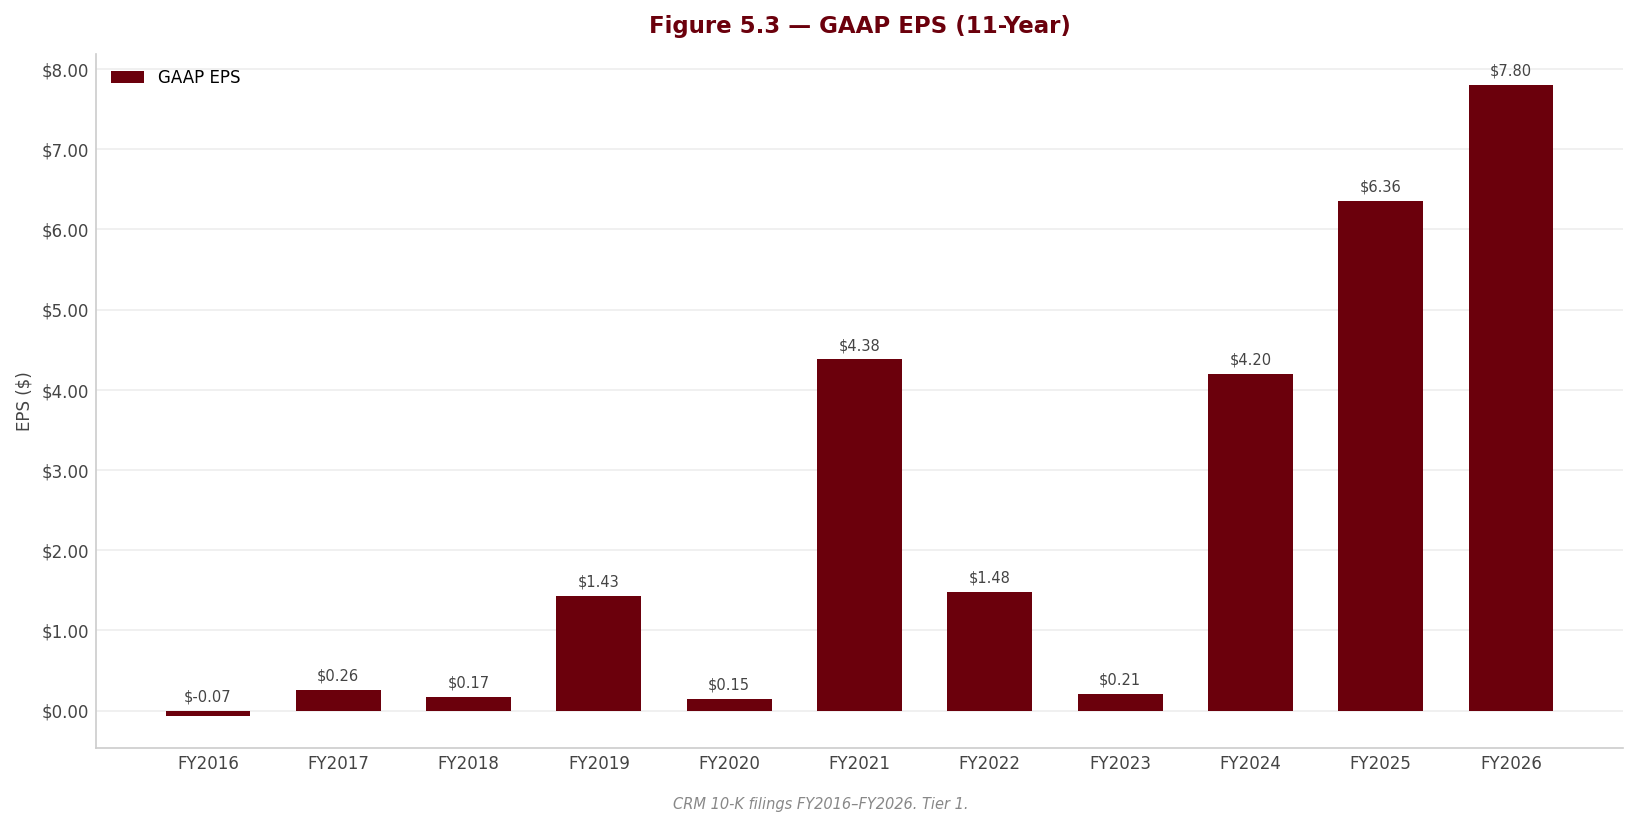
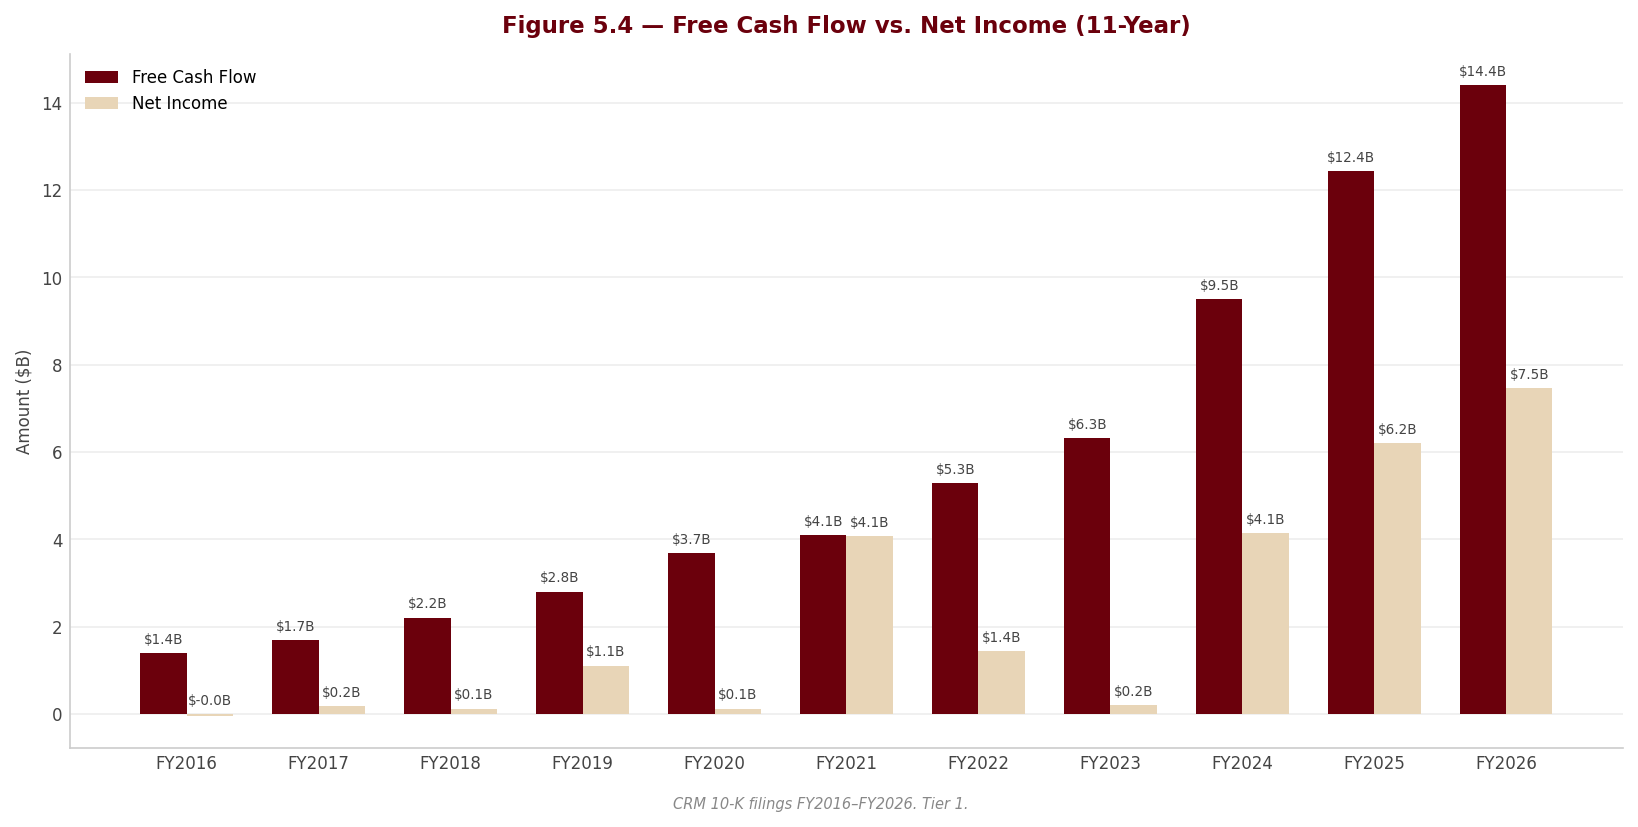
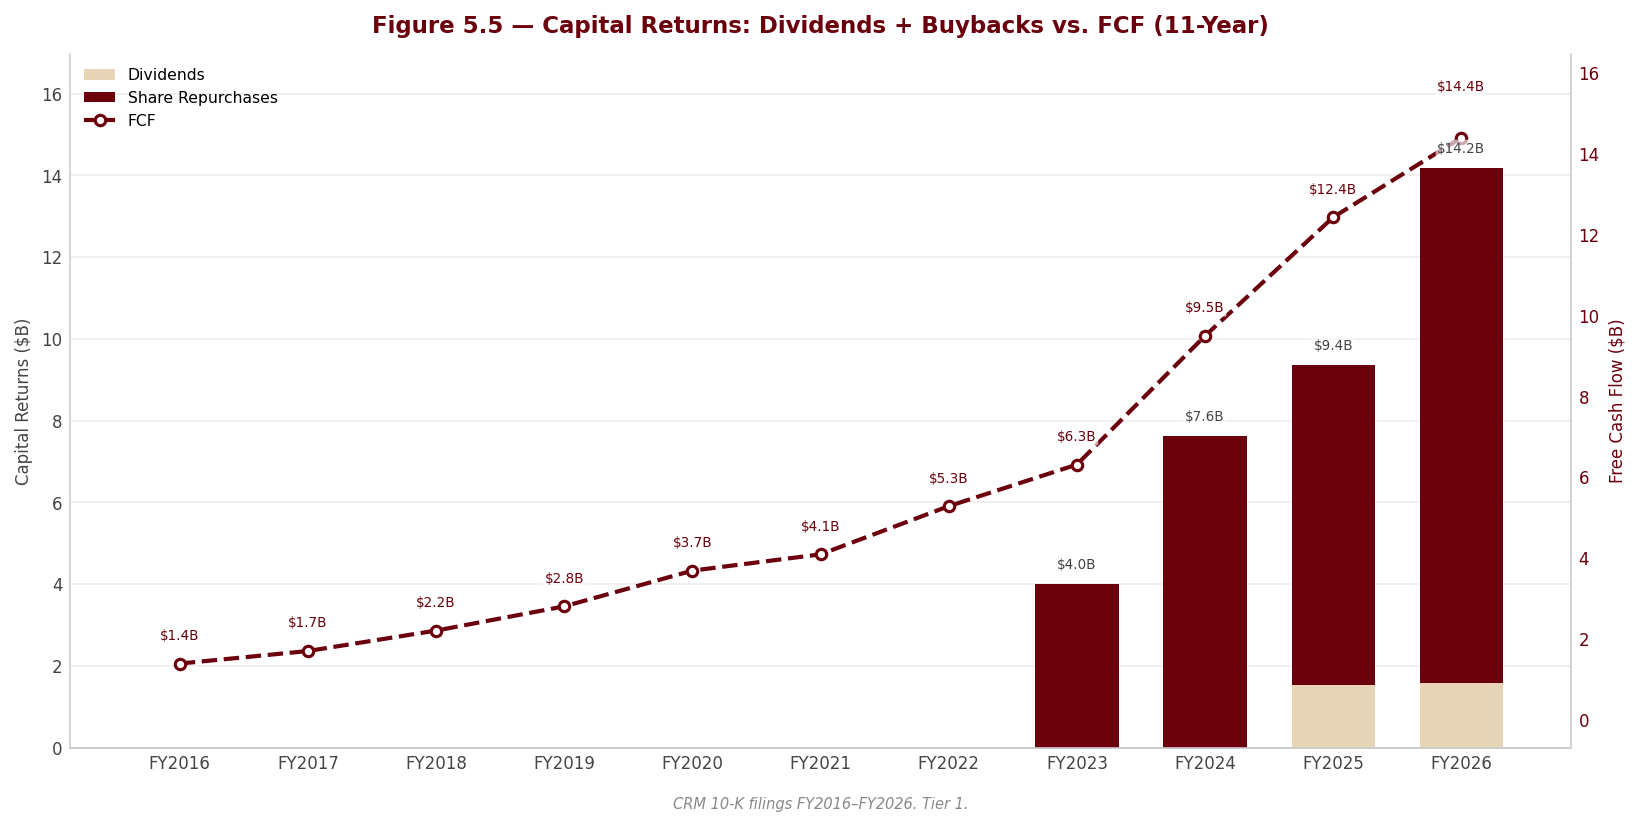
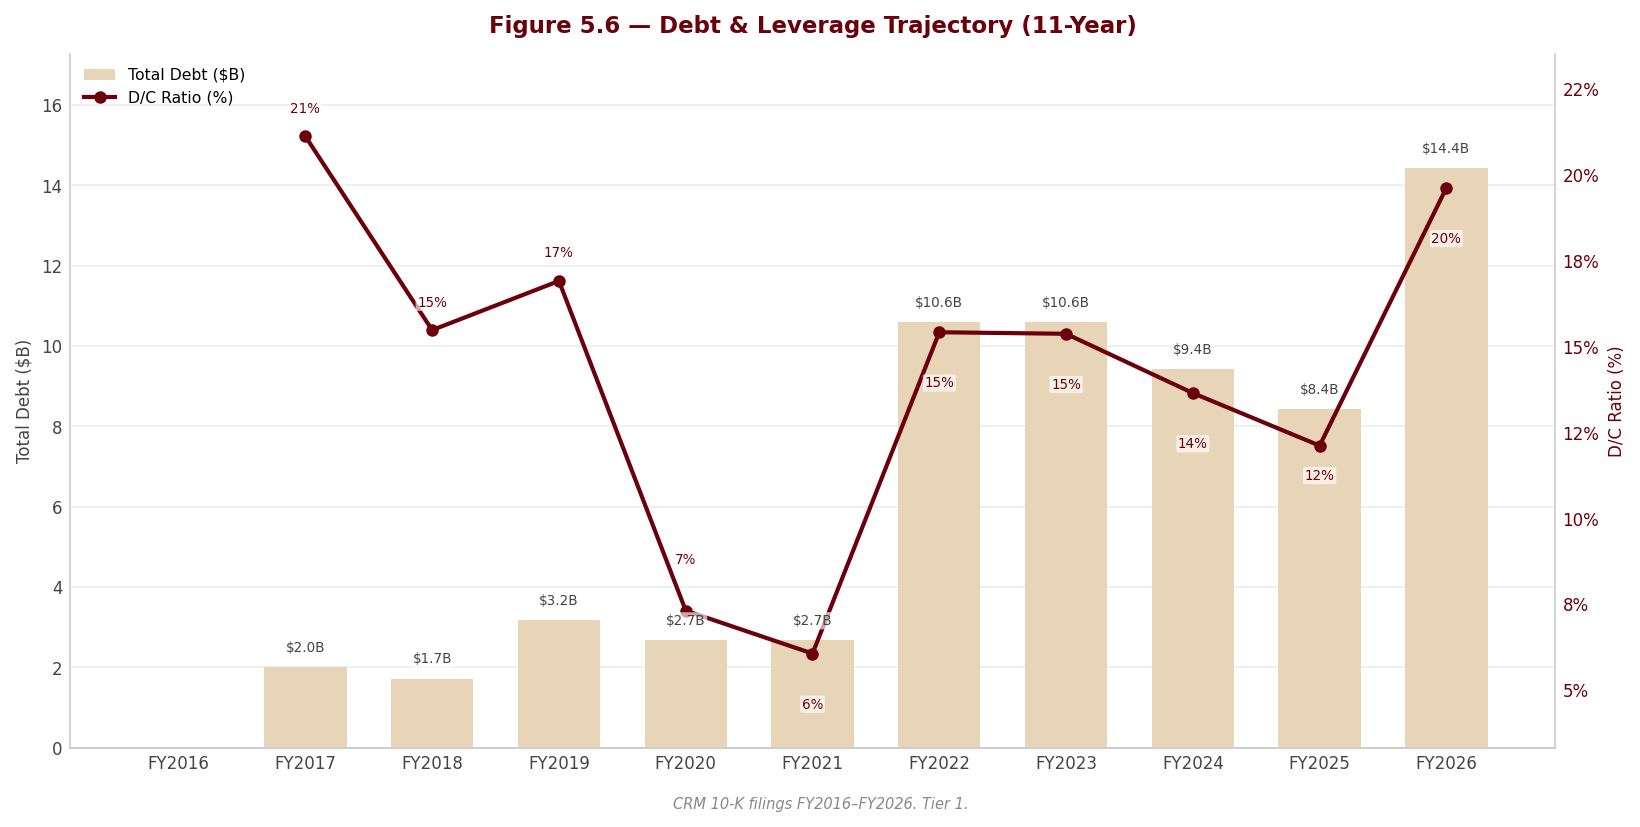
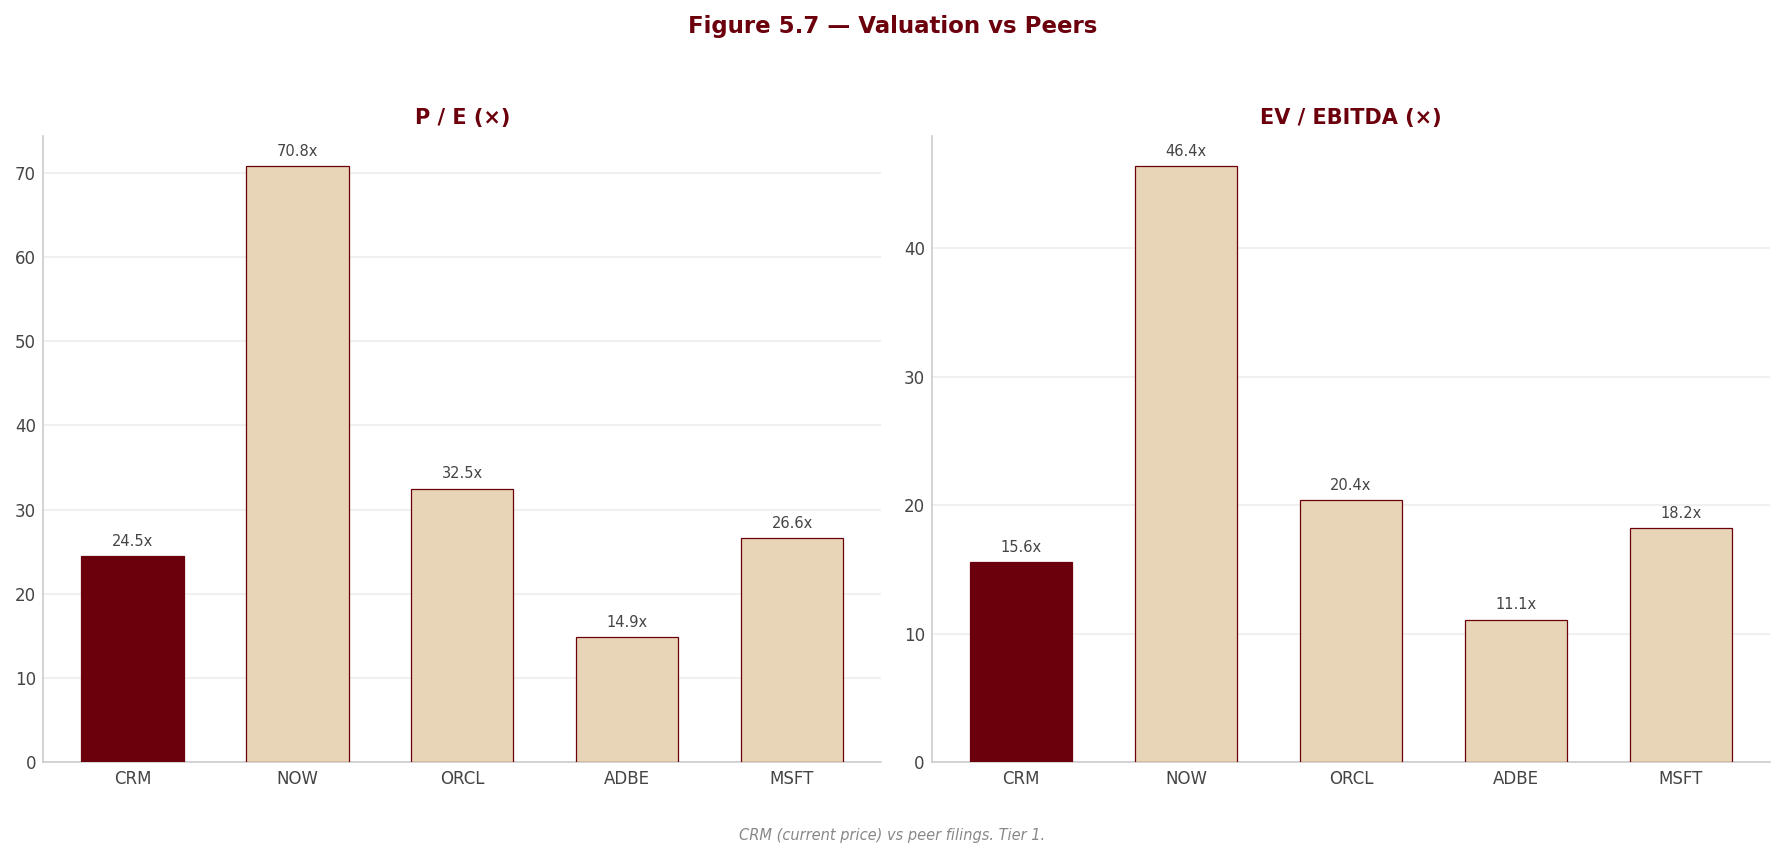
6. Valuation & Price Target withdrawn
This section stated what the shares were worth and what to do about them. It rested on an exit multiple set by hand — across the coverage it averaged 24% below where each company actually traded — so the conclusion largely restated that assumption instead of testing it. Rather than leave it standing, it has been withdrawn while the method is rebuilt.
Nothing else in this report depends on it: the financial analysis above and below is drawn from the company's own filings, and every figure links to the page it was verified against.
Section 7 — Quarterly Update: Q1 2027
sources Quarter labels follow the model’s fiscal convention: Q1 2027 is the fiscal first quarter ended 30 April 2026; Q1 2026 is the prior-year same quarter ended 30 April 2025; Q4 2026 is the prior sequential quarter ended 31 January 2026 (a derived column — flows are the fiscal year less the first nine months, balances are the fiscal year-end). Source document throughout: Salesforce, Inc. Form 10-Q for the quarterly period ended 30 April 2026, filed 27 May 2026.
Portfolio Action
sources [Rating and price target withdrawn — see the note at the top.]
| Assessment | |
|---|---|
| Action | [Rating and price target withdrawn — see the note at the top.] |
| Reason | Reported revenue grew +13.3% YoY to $11,133.0M, but Informatica contributed $444M of the $1,304M increase (10-Q p. 35) and FX added ~2 pp (10-Q p. 31), leaving ex-acquisition growth of +8.8% — and organic constant-currency growth of roughly +7%, below the +9.6% the company delivered for full-year FY2026 — while net debt / LTM EBITDA moved to 2.4× from a net-cash position a year ago. |
| Thesis intact? | PARTIALLY — the operating-leverage leg strengthened (EBIT margin 21.1%, +1.32 pp YoY, on flat gross margin), but the growth re-acceleration is bought rather than organic and earnings quality deteriorated: a $558M non-cash strategic-investment gain is 20.5% of pre-tax income, without which pre-tax income grew only +6.2%. |
| Trigger to revisit | [Rating and price target withdrawn — see the note at the top.] |
Source: Salesforce Form 10-Q, quarterly period ended 30 April 2026 (pages cited inline); growth rates, margins and leverage are analyst-computed from the section-7 data pack and the Data sheet of the FL workbook. Tier 1.
7.1 Results at a Glance
| Metric | Q1 2027 | Q1 2026 | YoY Δ | Q4 2026 | QoQ Δ |
|---|---|---|---|---|---|
| Revenue ($M) | $11,133.0M | $9,829.0M | +13.3% | $11,201.0M | -0.6% |
| Gross Profit ($M) | $8,563.0M | $7,564.0M | +13.2% | $8,693.0M | -1.5% |
| Gross Margin | 76.9% | 77.0% | -0.04 pp | 77.6% | -0.68 pp |
| EBITDA ($M) | $3,332.0M | $2,785.0M | +19.6% | $2,989.0M | +11.5% |
| EBITDA Margin | 29.9% | 28.3% | +1.59 pp | 26.7% | +3.24 pp |
| EBIT ($M) | $2,347.0M | $1,942.0M | +20.9% | $1,869.0M | +25.6% |
| EBIT Margin | 21.1% | 19.8% | +1.32 pp | 16.7% | +4.40 pp |
| Net Income ($M) | $2,107.0M | $1,541.0M | +36.7% | $1,943.0M | +8.4% |
| Net Margin | 18.9% | 15.7% | +3.25 pp | 17.3% | +1.58 pp |
| Diluted EPS | $2.42 | $1.59 | +52.2% | — | —ᵃ |
ᵃ A standalone Q4 2026 diluted EPS is not separable. The Q4 2026 column is derived by subtracting the first nine months from the fiscal year; earnings per share is a ratio, not an additive flow, so it cannot be derived that way. The dash is an omission, not a missing filing figure.
Computation shown once for each derived type: YoY Δ = (CQ - PYSQ) / |PYSQ| × 100 — revenue: (11,133 - 9,829) / 9,829 × 100 = +13.3%. QoQ Δ = (CQ - PQ) / |PQ| × 100 — revenue: (11,133 - 11,201) / 11,201 × 100 = -0.6%. Margin = line / revenue × 100 — gross margin CQ: 8,563 / 11,133 × 100 = 76.9%; EBITDA margin CQ: 3,332 / 11,133 × 100 = 29.9%; EBIT margin CQ: 2,347 / 11,133 × 100 = 21.1%; net margin CQ: 2,107 / 11,133 × 100 = 18.9%. Margin delta (pp) = CQ margin - comparison margin — gross margin YoY: 76.92% - 76.96% = -0.04 pp.
Source: Salesforce Form 10-Q, quarterly period ended 30 April 2026, Condensed Consolidated Statements of Operations, p. 4 (income-statement lines); EBITDA and free cash flow are FL-workbook derivations from p. 4 and the Condensed Consolidated Statements of Cash Flows, p. 7. Tier 1. Growth rates, margins and margin deltas are analyst-computed.
7.2 P&L Drivers
sources Revenue: The $1,304M YoY increase was, on management’s own disclosure, largely bought and translated rather than earned: Informatica — acquired November 2025 — contributed approximately $444M of total revenue in the quarter (10-Q p. 35), and foreign currency added approximately two percentage points to total revenue growth (10-Q pp. 31, 36), leaving organic constant-currency growth of roughly 7% against the +13.3% headline. Stripping only Informatica gives +8.8% ((11,133 - 444) / 9,829 - 1), which is below the +9.6% Salesforce delivered for full-year FY2026 — so the apparent re-acceleration does not survive the acquisition adjustment. The internal split makes the same point more sharply: Agentforce Apps, the seat-based core at 65% of subscription revenue, grew only +8.9% to $6,910M, while “Data 360, Headless Platform, and Other” — the bucket that now contains Informatica — grew +24.8% to $3,683M (10-Q p. 36). Geographically Europe led at +17.8% to $2,754M against Americas +11.8% to $7,233M and Asia Pacific +12.0% to $1,146M (10-Q pp. 17, 36), consistent with the FX benefit being concentrated outside the United States; management attributes the subscription increase to volume from new business and states explicitly that “pricing was not a significant driver” (10-Q p. 35).
Cost and margin: COGS of $2,570.0M against $2,265.0M in Q1 2026 rose +13.5%, essentially in line with revenue, so gross margin was flat at 76.9% versus 77.0% (-0.04 pp) — subscription cost of revenue deteriorated 2 pp to 18% of revenue on service-delivery expense and Informatica intangible amortisation, offset by professional-services cost falling to 5% from 7% (10-Q p. 36). Every basis point of the +1.32 pp EBIT-margin expansion therefore came from operating-expense leverage, not from mix: total operating expenses fell to 55.8% of revenue from 57.2%, with R&D at 14.6% (from 14.9%), sales and marketing at 33.9% (from 34.9%) and G&A at 6.6% (from 7.1%) (10-Q p. 34). That leverage is structural and was achieved while absorbing two rising costs — acquired-intangible amortisation of $561M against $395M (10-Q p. 22) and restructuring of $80M against $36M (10-Q p. 4). D&A of $985.0M versus $843.0M in Q1 2026 (+16.8%) grew faster than revenue for the same acquisition reason, which is why the EBITDA margin expanded more (+1.59 pp) than the EBIT margin.
Below the line: Interest expense of $317.0M appears as a discrete line on the face of the income statement for the first time, against $68M in Q1 2026 (10-Q p. 4) — a $249M, +366.2% increase management attributes to the March 2026 debt offering and expects to persist through fiscal 2027 (10-Q p. 38). [Rating and price target withdrawn — see the note at the top.]
7.3 Balance Sheet & Cash Flow
| Metric | Q1 2027 | Q1 2026 | YoY Δ | Q4 2026 | QoQ Δ |
|---|---|---|---|---|---|
| Cash ($M) | $8,935.0M | $10,928.0M | -18.2% | $7,327.0M | +21.9% |
| Net Debt ($M) | $30,345.0M | -$2,493.0M | +1,317.2%ᵇ | $7,112.0M | +326.7% |
| Net Debt / LTM EBITDA | 2.4× | — | — | — | — |
| Total Assets ($M) | $106,680.0M | $98,610.0M | +8.2% | $112,305.0M | -5.0% |
| Equity ($M) | $34,235.0M | $60,666.0M | -43.6% | $59,142.0M | -42.1% |
| OCF ($M) | $6,701.0M | $6,476.0M | +3.5% | $5,464.0M | +22.6% |
| CapEx ($M)ᶜ | $145.0M | $179.0M | -19.0% | $141.0M | +2.8% |
| FCF ($M) | $6,556.0M | $6,297.0M | +4.1% | $5,323.0M | +23.2% |
| Dividends Paid ($M)ᶜ | $365.0M | $402.0M | -9.2% | $391.0M | -6.6% |
ᵇ The YoY change on net debt is arithmetically valid but economically misleading, because Q1 2026 net debt was negative $2,493M — a net-cash position. The formula (CQ - PYSQ) / |PYSQ| × 100 = (30,345 - (-2,493)) / 2,493 × 100 = +1,317.2%. The meaningful statement is the level: a $32,838M swing from net cash to net debt in twelve months. ᶜ CapEx and dividends are stored in the workbook as positive magnitudes and are shown here as stored; both are cash outflows — $145M of capital expenditure and $365M of dividends and dividend equivalents paid in the quarter (10-Q p. 7). A negative YoY Δ on these lines therefore means a smaller outflow.
Net Debt / LTM EBITDA: LTM EBITDA = Q2 2026 (3,149) + Q3 2026 (3,039) + Q4 2026 (2,989) + Q1 2027 (3,332) = 12,509; Net Debt CQ / LTM EBITDA = 30,345 / 12,509 = 2.4×. Net debt is computed as current debt (nil) plus noncurrent debt ($39,280M) less cash and cash equivalents ($8,935M); it excludes the $2,902M marketable-securities portfolio, which on management’s “cash, cash equivalents and marketable securities” basis of $11.8bn (10-Q p. 35) would reduce net debt to $27,443M and leverage to 2.2×.
Source: Salesforce Form 10-Q, quarterly period ended 30 April 2026, Condensed Consolidated Balance Sheets, p. 3, and Condensed Consolidated Statements of Cash Flows, p. 7; quarterly EBITDA series from the Data sheet of the FL workbook (row 20, quarterly columns), derived from those statements. Tier 1. Growth rates, net debt, free cash flow, LTM EBITDA and leverage are analyst-computed.
Balance sheet note: The balance sheet was rebuilt inside the quarter, and it is the single most consequential fact in the filing. Debt went from $4,000M current plus $10,439M noncurrent at 31 January 2026 to nil current and $39,280M noncurrent at 30 April 2026 — the current portion was extinguished and total carrying value rose $24,841M — as the $25.0bn March 2026 Notes were issued and the $4.0bn 364-day and $2.0bn three-year Informatica credit agreements were refinanced into a $6.0bn five-year term loan (10-Q pp. 3, 23–24). Total stockholders’ equity fell 42.1% sequentially to $34,235.0M because $27,366M was charged against it for repurchases — $22,800M to treasury stock and $4,566M to additional paid-in capital (10-Q p. 6) — which is also why total assets fell 5.0% QoQ despite $1,350M of goodwill being added (10-Q p. 23); the $9,259M sequential fall in accounts receivable to $5,080M is the ordinary Q1 collection of the seasonally heavy Q4 billings (10-Q pp. 3, 32).
Cash flow note: FCF conversion = FCF / Net Income = 6,556 / 2,107 × 100 = 311.2%, a figure that should be read as seasonal rather than as evidence of earnings quality — management states the fiscal first quarter is typically its largest collections and operating-cash-flow quarter (10-Q pp. 32, 63). Cash flow badly lagged earnings on the margin: net income rose +36.7% but OCF rose only +3.5%, because the larger receivables inflow ($9,431M vs $7,591M) was consumed by a bigger unearned-revenue drawdown (-$3,999M vs -$2,944M) and a near-doubling of the payables and accrued-liabilities outflow (-$1,897M vs -$1,007M), the latter reflecting accrued compensation falling from $3.3bn to $1.9bn (10-Q pp. 7, 21). The gap is also mechanical: $558M of the net income was a non-cash investment gain and is reversed out in the operating section.
7.4 Footnote Review
sources Note 1 — Summary of Business and Significant Accounting Policies (10-Q pp. 9–16) Read in full. The accounting-policy body — revenue recognition, capitalised contract costs (four-year new, two-year renewal amortisation), marketable securities, strategic investments, leases, business combinations, restructuring, stock-based compensation, income taxes, foreign currency, warranties and indemnification — is confirmed unchanged vs. Q1 2026 (10-Q pp. 10–16). Four items did change and matter. First, Salesforce continues to report as one operating segment, with the CODM assessing performance on consolidated net income (10-Q p. 10) — there is therefore no reportable-segment operating income anywhere in this filing, and the geographic and service-offering splits below are revenue disaggregations only. Second, beginning in Q1 2027 the Company started designating certain forward contracts as cash flow hedges for Euro- and Yen-denominated revenue, a new policy not present a year ago; designated notional is $1.4bn, and non-designated notional rose to $17.8bn from $11.9bn at 31 January 2026 (10-Q p. 13) — a 50% increase in gross FX hedging in one quarter, consistent with FX having become a two-percentage-point contributor to reported growth. Third, two pronouncements are pending: ASU 2024-03 on expense disaggregation (effective annual periods after 15 December 2026) and ASU 2025-06 on internal-use software (after 15 December 2027), both under evaluation (10-Q p. 16). ASU 2024-03 is thesis-relevant — it will eventually force disclosure of employee compensation and amortisation by expense caption, which is precisely the opacity this report has flagged. Fourth, prior-period revenue disaggregation was reclassified to conform to the new presentation, with no effect on total subscription and support revenue (10-Q p. 16). Concentrations are unchanged: no customer at ten percent or more of receivables or revenue, US assets 82% of total (10-Q p. 10).
Note 2 — Revenues (10-Q pp. 16–18) Three disclosures, and the direction is mixed. (i) The service-offering split was re-cut this quarter into just two buckets — Agentforce Apps $6,910M (+8.9%) and “Data 360, Headless Platform, and Other” $3,683M (+24.8%) — replacing the prior multi-cloud presentation (10-Q pp. 16, 36). Informatica sits inside the second bucket (10-Q p. 36), so organic Data 360 growth is no longer separately observable. This is a reduction in disclosure quality and moves away from the standalone Agentforce/Data Cloud quantification the thesis requires as an upgrade condition. (ii) Remaining performance obligation: total RPO $67.9bn and current RPO (cRPO) $33.6bn at 30 April 2026, against $72.4bn and $35.1bn at 31 January 2026 (10-Q p. 18). [Rating and price target withdrawn — see the note at the top.] The +4.3% billings figure and the +14% cRPO figure point in different directions on the same forward demand question; the honest reading is that forward indicators are ambiguous, not confirmatory. Contract assets were $905M against $818M at 31 January 2026 (10-Q p. 17).
Note 3 — Investments (10-Q pp. 18–19) [Rating and price target withdrawn — see the note at the top.] The consequential half is strategic investments: the portfolio stands at $7,772M against $7,591M at 31 January 2026, of which $7,612M (98%) is carried under the measurement alternative — cost adjusted only for observable transactions or impairment (10-Q p. 19). The $558M net gain decomposes into realised gains of $350M, unrealised gains on privately held securities of $328M, impairments of $119M and $1M of public-market losses (10-Q p. 19), and management discloses that a single exited position produced $268M of the realised gain and a single position produced $268M of the unrealised mark (10-Q p. 38). Two positions therefore generated $536M of the $558M. Against Q1 2026’s $63M loss this is a $621M swing, and it is 20.5% of pre-tax income. This is exactly the earnings-quality exposure the report flagged, materialising at larger scale and in the favourable direction — which makes it flattering now and a headwind whenever it reverses.
Note 4 — Fair Value Measurement (10-Q pp. 19–21) The three-tier hierarchy and its application are confirmed unchanged vs. Q1 2026 (10-Q p. 19). Recurring fair-value assets totalled $9,874M ($5,675M Level 1, $4,199M Level 2, nil Level 3) against $7,407M at 31 January 2026, with $143M of FX derivative assets and $124M of FX derivative liabilities newly measured (10-Q pp. 20–21). The material point is what sits outside the recurring table: substantially all privately held strategic investments, approximately $7.8bn, are Level 3 measured on a non-recurring basis using unobservable inputs, market approaches and option-pricing models (10-Q p. 21). The largest single driver of this quarter’s net income growth is therefore valued on management judgement rather than on an observable market price.
Note 5 — Leases and Other Commitments (10-Q p. 21) Operating lease cost was $146M against $147M in Q1 2026 — effectively flat and immaterial to the quarter. Lease liabilities total $2,604M operating and $664M finance, and the total lease commitment including leases not yet commenced is $4.4bn, of which ~$3.7bn is facilities (10-Q p. 21). Accrued compensation fell to approximately $1.9bn from $3.3bn at 31 January 2026 (10-Q p. 21) — a $1.4bn seasonal bonus-payment outflow that explains most of the payables movement in the cash flow statement.
Note 6 — Business Combinations (10-Q p. 22) Qualified.com, Inc., an agentic AI marketing provider, was acquired in April 2026 for $1.2bn of consideration, primarily $1.1bn cash, generating $954M of goodwill (not tax-deductible) and approximately $290M of intangibles with five- and eight-year lives; results were not material and the valuation is provisional pending finalisation within one year (10-Q p. 22). There was no comparable transaction in Q1 2026 (business combinations, net of cash acquired, were nil, 10-Q p. 7). Informatica is not re-disclosed here but is quantified in MD&A at approximately $444M of revenue contribution in the quarter (10-Q p. 35). The thesis point is unchanged and reinforced: growth continues to be purchased, and $1,452M of cash left the business for acquisitions in a single quarter (10-Q p. 7).
Note 7 — Intangible Assets and Goodwill (10-Q pp. 22–23) Gross intangibles rose to $14,535M from $14,139M with net carrying value of $6,650M and a 5.4-year weighted-average remaining life; amortisation was $561M against $395M in Q1 2026, a +42.0% increase (10-Q p. 22). Future amortisation is scheduled at $1,356M for the remaining nine months of fiscal 2027 and $1,495M in fiscal 2028 (10-Q p. 22). Goodwill rose to $59,291M from $57,941M, comprising $954M from Qualified and $396M of other acquisitions, adjustments and FX (10-Q p. 23). Goodwill plus net intangibles of $65,941M now exceeds total stockholders’ equity of $34,235.0M by $31,706M, so tangible book value is more deeply negative than at any prior point in the report — a direct consequence of the buyback, not of any impairment. No impairment was recorded and none is indicated; the annual test occurs in the fiscal fourth quarter (10-Q p. 14).
Note 8 — Debt (10-Q pp. 23–24) This is the footnote of the quarter and it is documented in full. March 2026 Notes: $25.0bn aggregate principal of unsecured senior notes issued in March 2026, net proceeds $24.8bn, interest semi-annual in arrears, redeemable at the Company’s option, with proceeds used to fund the accelerated share repurchase (10-Q p. 24). The eight tranches and their terms (10-Q p. 23) are: March 2028 $3,500M at 4.50%; March 2029 $4,250M at 4.65%; September 2031 $3,750M at 4.90%; March 2033 $2,750M at 5.20%; March 2036 $4,500M at 5.55%; March 2046 $1,500M at 6.40%; March 2056 $3,750M at 6.55%; March 2066 $1,000M at 6.70%. The long end is expensive — $6,250M was placed at 6.40–6.70% in the 2046, 2056 and 2066 tranches, against the 2021-vintage notes still on the books at 1.50–3.05%. [Rating and price target withdrawn — see the note at the top.] Those two Informatica facilities carried $4,000M and $2,000M at 31 January 2026 and are now nil (10-Q p. 23) — the near-dated maturity the report was watching has been extended to 2031, which is a genuine positive. Totals: principal outstanding $39,500M, carrying value $39,280M, against $14,439M at 31 January 2026; current portion nil against $4,000M (10-Q p. 23). The principal maturity ladder is nil in the remaining nine months of fiscal 2027, nil in fiscal 2028, $6,000M in fiscal 2029, $4,250M in fiscal 2030, nil in fiscal 2031 and $29,250M thereafter (10-Q p. 24) — no refinancing wall inside two years. Covenants: “The Company was in compliance with all debt covenants as of April 30, 2026” (10-Q p. 23); the indentures and the Revolving Loan Credit Agreement impose covenants (10-Q p. 62) but no covenant level and no actual ratio are disclosed anywhere in the filing, so compliance headroom cannot be assessed from this document. The $5.0bn revolving facility maturing October 2029 was undrawn (10-Q p. 24). Mark-to-market: the senior notes’ fair value was $31.4bn against $6.7bn at 31 January 2026 (10-Q p. 23), below their approximately $33.3bn carrying value (10-Q p. 39) — a ~$1.9bn discount arising from the legacy low-coupon tranches. One forward-looking item: cash interest paid was only $87M against a $317M P&L charge (10-Q p. 8), because the semi-annual coupons had barely begun to settle; cash interest will step up sharply from here.
Note 9 — Stockholders’ Equity / Share Repurchase (10-Q pp. 25–26) The second half of the balance-sheet transformation. In February 2026 the Board authorised $50.0bn, replacing the previous remaining authorisation (10-Q p. 25). In March 2026 the Company entered accelerated share repurchase agreements for an aggregate $25.0bn, paid $25.0bn up front and received an initial delivery of approximately 103 million shares at an average $198.34, representing about 80% of the total shares expected; $20.6bn was recorded to treasury stock for the delivered shares, fees and excise taxes, and $4.6bn was recorded as a reduction to additional paid-in capital for the unsettled forward component, with final settlement expected in the second half of fiscal 2027 (10-Q pp. 26, 40). Separately, open-market repurchases were 11 million shares at an average $192.00 for $2,145M, against 10 million at $273.42 for $2,681M in Q1 2026 (10-Q p. 26) — the Company bought 10% more shares for 20% less money because the average price fell 29.8% year over year. Total shares repurchased in the quarter were 114 million (February 8M at $190.31; March 3M at $196.21; ASR 103M at $198.34; April nil), and $22.9bn of authorisation remained at 30 April 2026 (10-Q pp. 26, 65). Cash outflow for repurchases was $27,248M (10-Q p. 7) against operating cash flow of $6,701.0M — the buyback consumed 4.07× the quarter’s operating cash flow and was funded by the notes, not by the business. Shares outstanding fell to 819 million (1,077M issued less 258M treasury) from 929 million at 31 January 2026, -11.8% in one quarter (10-Q pp. 3, 6). Stock-based compensation was $859M charged to equity (10-Q p. 6) and $857M in the cash flow statement (10-Q p. 7), against $814M in Q1 2026; the income-statement footnote components sum to $880M for Q1 2027 (10-Q p. 4) but reconciled exactly to $814M in Q1 2026 — a $23M unexplained gap this quarter that the filing does not reconcile, immaterial in size but new. [Rating and price target withdrawn — see the note at the top.]
Note 10 — Income Taxes (10-Q p. 26) [Rating and price target withdrawn — see the note at the top.] On uncertain positions the Company states it believes reserves are adequate and identifies open examinations in the United States, Germany, Israel and India; no dollar amount of unrecognised tax benefits is disclosed in this 10-Q (10-Q p. 26). Two forward exposures are flagged in risk factors rather than the note: potential Corporate Alternative Minimum Tax under the OBBBA, and OECD Pillar Two, where January 2026 guidance introduced a “side-by-side safe harbor” that may exempt US-parented groups from certain provisions without relieving foreign subsidiaries from jurisdiction-specific minimum taxes (10-Q p. 61). [Rating and price target withdrawn — see the note at the top.]
Note 11 — Net Income Per Share (10-Q pp. 26–27) The method is confirmed unchanged vs. Q1 2026 — treasury stock method for dilutive awards (10-Q p. 26). Weighted-average diluted shares fell to 871 million from 970 million, -10.2%, on a basic count of 868 million against 960 million with only 3 million shares of dilution from employee awards against 10 million (10-Q p. 27). Two exclusions deserve attention: 31 million employee stock awards were anti-dilutive this quarter against just 2 million a year ago — the mechanical signature of a share price that has fallen below award reference levels — and 36 million shares representing the unsettled forward component of the ASR agreements are excluded from the diluted count (10-Q p. 27). The latter means the reported diluted share count does not yet reflect the full ASR, so per-share arithmetic will move again on final settlement in the second half of fiscal 2027, in a direction that depends on the share price.
Note 12 — Legal Proceedings and Claims (10-Q pp. 27–29) See “Contingencies and litigation” below, where this note is treated in full.
Related-party transactions (10-Q pp. 9, 12, 16, 65) Salesforce discloses no related-party transactions footnote and has no controlling shareholder; the filing contains no related-party note, and this was confirmed by reading all twelve notes in this session. What the filing does disclose, and which is the closest analogue, is documented here with amounts. (i) Consolidation and intercompany: the financial statements include only wholly-owned subsidiaries and all significant intercompany balances and transactions are eliminated (10-Q p. 9); there is no non-controlling interest line on the balance sheet — total equity of $34,235.0M equals total stockholders’ equity (10-Q p. 3). (ii) Equity-method holdings: privately held securities over which the Company exercises significant influence are accounted for under the equity method (10-Q p. 12), but no equity-method income line, carrying value or transaction amount is separately disclosed; the residual “Other” measurement category totals $157M of the $7,772M strategic-investment portfolio ($117M equity securities and $40M other investments) against $171M at 31 January 2026 (10-Q p. 19), and that is the only quantification available. (iii) Officer and director arrangements: the Company indemnifies directors and executive officers for costs arising from their service, maintains D&O insurance, and has accrued no material liability for these obligations (10-Q p. 16). (iv) Insider transactions: on 31 March 2026 Marc Benioff, Chair and Chief Executive Officer, terminated a Rule 10b5-1 trading arrangement adopted 10 October 2025 that provided for the sale of up to 351,607 shares between 1 April 2026 and 26 February 2027 (10-Q p. 65); no other director or officer adopted or terminated a trading arrangement in the quarter. There was no comparable disclosure in Q1 2026. (v) Equity issued in acquisitions: 105,993 shares on 2 March 2026, 87,796 shares on 3 March 2026 and 262,928 shares on 1 April 2026 were issued unregistered in connection with acquisitions (10-Q p. 65). No terms changed, because no related-party terms are disclosed to change. The reader should note the structural limitation: Salesforce reports related-party detail in its proxy statement, not in its periodic filings, so this 10-Q cannot support a related-party conclusion in either direction.
Contingencies and litigation (10-Q pp. 27–29, 45) Read in full; every open matter is listed. The general provision is unchanged from Q1 2026: a liability is recorded when a loss is probable and estimable, and management states it “is not able to reasonably estimate the amount or range of possible losses in excess of any amounts accrued” and expects resolution of all current matters not to be materially adverse (10-Q p. 27). No reserve amount is disclosed for any matter, and no amount at stake is quantified in any of them — every action seeks “unspecified monetary damages,” which is itself the finding: a large and growing litigation book carries a zero disclosed number. - Slack securities litigation: the Federal Action (Dennee v. Slack Technologies) concluded on 10 November 2025 when the district court entered judgment for defendants following the Ninth Circuit’s reversal and the Supreme Court’s certiorari denial on 6 October 2025. The consolidated State Court Action (In re Slack Technologies Shareholder Litigation, Lead Case No. 19CIV05370) had its stay lifted on 7 November 2025 to permit discovery and a renewed class-certification motion; it seeks unspecified damages on behalf of investors in Slack’s registration-statement shares (10-Q pp. 27–28). Net change vs. a year ago: the federal exposure is closed, the state exposure reopened. - Backpage-related sex-trafficking actions: the docket expanded materially during and around this quarter. Newly identified in this filing are seven actions by fourteen plaintiffs in the Northern District of California, fourteen actions by fourteen plaintiffs in the Central District of California, A.A. (No. 4:26-CV-00757), J.L.D. (No. 26-CV-01580) and E.Y.W. (No. 1:26-CV-02632); already-pending consolidations include 244 plaintiffs in the six G.G.-consolidated cases, 30 plaintiffs in S.M.A., 21 in A.S., 13 in A.G.B. and 18 in the Texas state MDL (In re Jane Doe Cases, MDL 2020-28545) (10-Q pp. 28–29). - The decisive procedural change: a large share of these matters has been stayed under 18 U.S.C. § 1595(b) pending final adjudication of the criminal proceedings involving Backpage — A.B. (October 2025), S.M.A. and A.S. (October 2025), I.H. (December 2025), the G.G. consolidated cases (March 2026, with a reconsideration motion pending), C.S. (April 2026) and A.G.B., J.L.D. and E.Y.W. (March–May 2026); a stay motion in A.A. was filed in May 2026 and remains pending (10-Q pp. 28–29). In February 2026 the Texas MDL court granted dismissal on forum non conveniens grounds as to B.I.R., C.V. and T.K., pending written order (10-Q p. 29). The analytical implication is significant and cuts against the report’s prior framing: the near-term trial catalyst has largely evaporated — the overhang has been deferred, not resolved, converting a dated binary event into an open-ended tail with no disclosed reserve and a plaintiff count still rising. - Other: a Dutch GDPR proceeding brought by the Privacy Collective remains pending before the Dutch Supreme Court after an initial dismissal was reversed on appeal (10-Q p. 57). Item 1 Legal Proceedings adds no matter beyond Note 12 (10-Q p. 45).
Subsequent events (10-Q pp. 1, 29, 40) There is no standalone subsequent-events footnote in this filing; the balance-sheet date is 30 April 2026 and the report was signed 27 May 2026 (10-Q p. 68). Four post-quarter disclosures exist and are listed in full. (i) Management states that subsequent to 30 April 2026 the Company had not completed any additional share repurchases under the Share Repurchase Program (10-Q p. 40) — so the $22.9bn remaining authorisation was untouched into late May. (ii) The cover page reports approximately 819 million shares outstanding as of 21 May 2026 (10-Q p. 1), unchanged from the 30 April count and corroborating (i). (iii) In the litigation note, in May 2026 the Company filed a motion to stay A.A. under 18 U.S.C. § 1595(b), which remains pending (10-Q p. 29). (iv) Also in the litigation note, responses to complaints in the Northern District of California were due in May and June 2026 and in the Central District of California in June and July 2026 (10-Q p. 29). Nothing was disclosed regarding the ASR final settlement, additional debt, further acquisitions or any change to guidance.
7.5 What Changed This Quarter
sources - The revenue acceleration is acquired, not organic. Reported revenue rose +13.3% to $11,133.0M, but Informatica contributed approximately $444M (10-Q p. 35) and FX approximately two percentage points (10-Q p. 31). [Rating and price target withdrawn — see the note at the top.] The single most direct read on the core franchise is Agentforce Apps at +8.9% (10-Q p. 36). The thesis condition was evidence that agentic and data monetisation is re-accelerating growth; on the filing’s own numbers, it has not yet. - Salesforce became a materially levered company inside twelve weeks. Carrying value of debt rose from $14,439M to $39,280M and net debt from a net-cash -$2,493M a year ago to $30,345M, taking net debt / LTM EBITDA to 2.4× (LTM EBITDA $12,509M). The report’s own downgrade threshold was ~1.0×. This is mitigated by three facts from the debt note: the current portion is nil, no principal matures before fiscal 2029, and the near-dated Informatica facilities were termed out to March 2031 (10-Q pp. 23–24) — but the balance-sheet cushion that underwrote the earlier thesis is gone. - $27,248M of cash left the company for buybacks against $6,701M of operating cash flow (10-Q p. 7) — 4.07× the quarter’s cash generation, funded by the $24,842M of net debt proceeds. Shares outstanding fell 11.8% to 819 million and diluted weighted-average shares fell 10.2% to 871 million (10-Q pp. 6, 27), with $22.9bn of authorisation still open (10-Q p. 26). Capital return is now unambiguously leverage-funded, which is what the report anticipated but at larger scale than modelled. - Earnings quality got worse, not better. A $558M non-cash strategic-investment gain — 20.5% of pre-tax income, of which $536M came from two single positions (10-Q pp. 19, 38) — replaced a $63M loss. Strip it and pre-tax income grew +6.2%, against the +37.8% headline. Of the $0.83 EPS increase, $0.14 is the ASR (management, 10-Q p. 31) and roughly $0.49 the tax-effected investment mark. [Rating and price target withdrawn — see the note at the top.] - The operating case genuinely improved, and it is the strongest single positive. EBIT margin reached 21.1%, +1.32 pp YoY and +4.40 pp QoQ, entirely from operating-expense leverage (opex 55.8% of revenue vs 57.2%) on a flat gross margin — and achieved while absorbing $166M more intangible amortisation and $44M more restructuring (10-Q pp. 4, 22, 34). - Restructuring recurred for a fourth consecutive year at more than double the prior-year charge — $80M vs $36M (10-Q p. 4) — accompanied once more by the statement that no significant additional charges are expected near term, while MD&A simultaneously discloses $130–150M of expected future restructuring cash payments (10-Q pp. 37, 41). A charge that appears every year is an operating cost. - Forward indicators are ambiguous rather than confirmatory. cRPO grew +14% YoY to $33.6bn including ~1 pp of FX (10-Q pp. 18, 31, 41), marginally ahead of revenue but short of the ≥15% upgrade threshold; billings in the unearned-revenue roll-forward grew only +4.3% ($7,179M vs $6,885M, 10-Q p. 17). The two disagree. - Disclosure of the very metric the thesis needs got worse. The service-offering split was re-cut into two buckets this quarter, with Informatica folded into “Data 360, Headless Platform, and Other” (10-Q pp. 16, 36), making organic Data 360 growth unobservable. The upgrade condition requiring Agentforce/Data Cloud to be disclosed as a quantified standalone driver is now further away, not closer. - The litigation overhang was deferred, not resolved. The Slack federal action concluded on 10 November 2025, but the state action’s stay was lifted, and most Backpage matters — now involving several hundred plaintiffs across at least eight federal districts and a Texas MDL — have been stayed under 18 U.S.C. § 1595(b) pending the Backpage criminal proceedings (10-Q pp. 27–29). No reserve is disclosed and no amount is quantified in any matter. - Two second-order items worth carrying forward: cash interest paid was $87M against a $317M P&L charge (10-Q p. 8), so cash debt service will step up sharply; and 36 million shares of unsettled ASR forward plus 31 million anti-dilutive employee awards sit outside the diluted count (10-Q p. 27), so the share-count arithmetic is not finished.
7.6 Portfolio Decision
sources [Rating and price target withdrawn — see the note at the top.] This quarter improved the operating case and simultaneously removed the balance-sheet cushion, and neither effect is large enough to overwhelm the other. On the positive side the operating leverage is real and verifiable: EBIT margin of 21.1% (+1.32 pp YoY) was delivered on a flat gross margin purely through opex discipline, while absorbing $166M more acquired-intangible amortisation and $44M more restructuring — that is a genuine confirmation of the margin-expansion catalyst. Against that, the headline growth story does not survive contact with the footnotes: Informatica’s ~$444M and roughly two points of FX reduce +13.3% reported growth to +8.8% ex-acquisition and about 7% organic constant-currency, below FY2026’s +9.6%, and the seat-based core (Agentforce Apps, 65% of subscription revenue) grew just +8.9%. The footnote review makes the earnings-quality position worse rather than better: a $558M non-cash mark, 20.5% of pre-tax income and driven by two single Level 3 positions, is the difference between +37.8% and +6.2% pre-tax growth, and roughly three-quarters of the $0.83 EPS gain came from below the operating line or from the share count. On leverage, net debt / LTM EBITDA of 2.4× is decisively through the ~1.0× level the report set as a downgrade trigger — but this specific event was already known and already priced into the recommendation, because the valuation was deliberately struck on the post-buyback capital structure rather than the fiscal-year-end balance sheet. What this filing adds is confirmation of the size and the terms, not new information; and the terms are better than feared — nil current debt, no principal maturity before fiscal 2029, and the near-dated Informatica facilities termed out to March 2031. [Rating and price target withdrawn — see the note at the top.]
What would change this view: [Rating and price target withdrawn — see the note at the top.] Any of these would convert this quarter’s ambiguous forward signal into the re-acceleration evidence the bull case requires. [Rating and price target withdrawn — see the note at the top.]
Report Versions
Every published version of this report, newest first — each one kept so a reader can see what changed and when.
| Version date | Files |
|---|---|
| 2026-08-10 Current | Model (Excel) |
| 2026-08-06 | Model (Excel) |