
Waste Management, Inc.
Section 1 — Business Overview, Operations & Competitive Positioning
sources
1.1 The Business
sources Waste Management makes its money by controlling the disposal end of the North American waste chain: it operates the largest network of landfills in the United States and Canada and preferentially routes its own collected waste into disposal sites and transfer stations it owns — a practice it calls internalization — so that the tipping fee is captured internally at every step rather than paid away to a third party. That vertical integration, not the act of hauling trash, is what turns a low-growth, capital-intensive service into a high-margin, cash-generative franchise.
Waste Management, Inc. (WM, NYSE) is North America’s leading provider of comprehensive environmental services, operating through subsidiaries across all U.S. states, parts of Canada and — following the late-2024 Stericycle acquisition — parts of Western Europe. Its revenue is overwhelmingly recurring and contract-based: commercial and industrial customers are served under multi-year agreements, and most residential collection is provided under exclusive municipal contracts, franchises or household subscriptions. Revenue reached a record $25,204.0M in FY2025, up materially from $22,063.0M the prior year. That headline growth, however, is where a portfolio manager should slow down: it was almost entirely acquisition-driven — the first full year of the Stericycle-based Healthcare Solutions segment — rather than organic. On a per-share earnings basis the year actually went backwards, as a full year of acquisition debt, a step-change in intangible amortization and integration costs outran the incremental revenue (developed in Section 3). The workforce is large and operationally weighted toward physically demanding, safety-critical roles — drivers, equipment operators, technicians and sorters — a portion of it covered by collective-bargaining agreements; management frames labor cost and safety, and the automation program designed to reduce dependence on high-turnover jobs, as central to the operating model.
This is therefore a business we hold rather than chase: a genuinely defensive, moat-protected compounder that the market already prices for its recovery. [Rating and price target withdrawn — see the note at the top.]
Key Information
| Item | Value |
|---|---|
| Ticker | WM |
| Sector / Industry | Industrials — Environmental & Waste Services |
| Report Date | 2026-08-10 |
| Most Recent FY Revenue | $25,204.0M |
| EBIT Margin (Most Recent FY) | 17.1% |
| Diluted Weighted-Average Shares | 404M |
| Current Price | $226.44 |
Source: Company SEC filings (10-K); see Appendix A.1.
1.2 Operating Segments
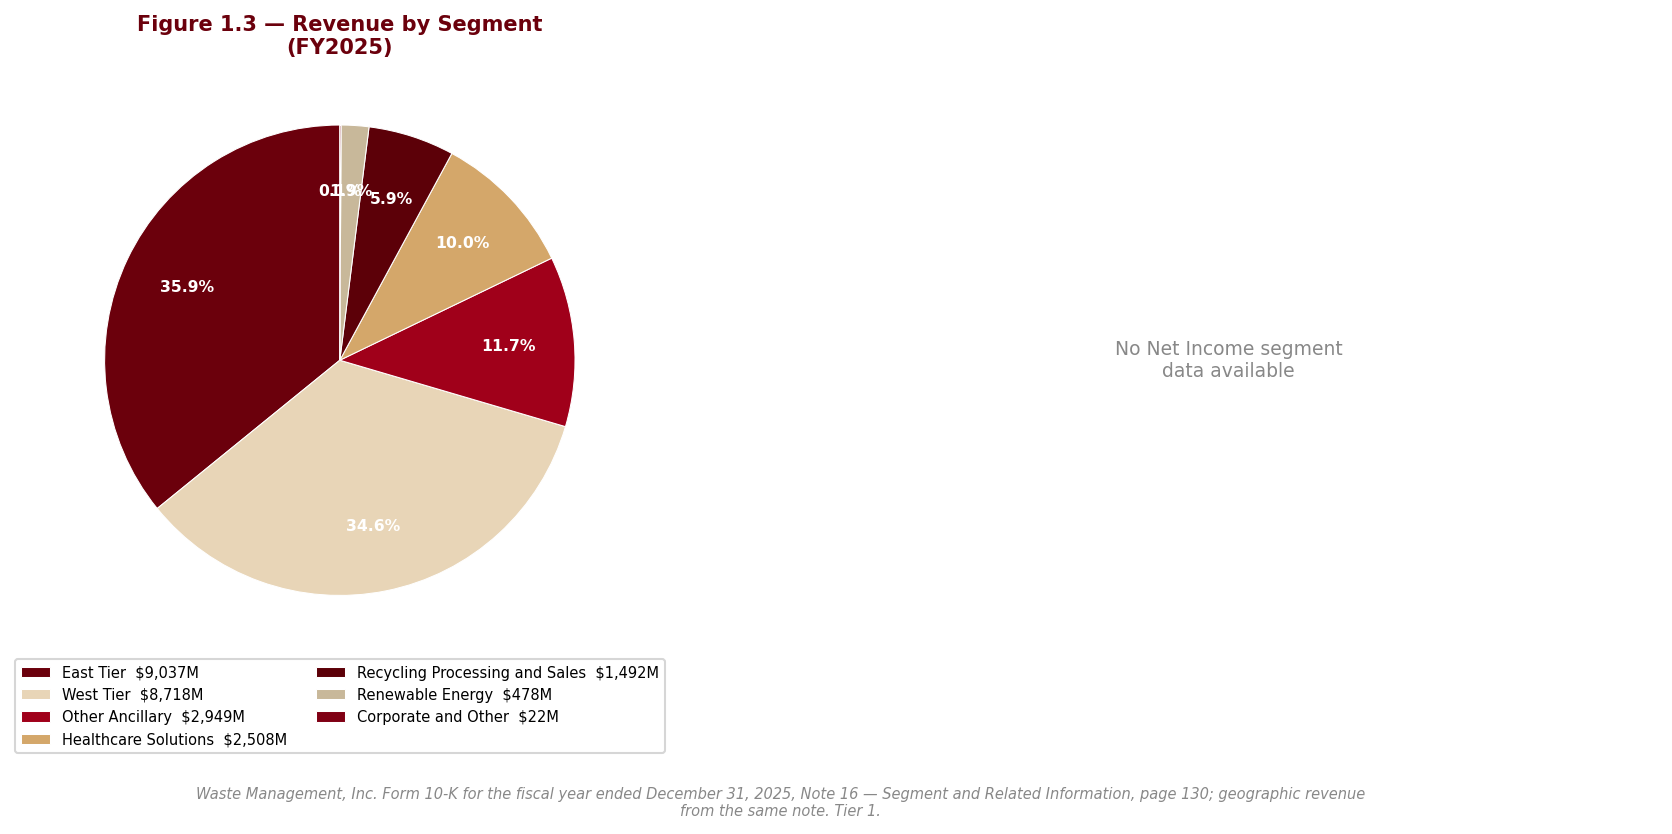
sources Waste Management reports through five reportable segments — Collection and Disposal, Recycling Processing and Sales, Renewable Energy, Healthcare Solutions, and Corporate and Other — a structure reshaped in FY2024–FY2025 by the Stericycle acquisition and a reorganization of the core waste business into two geographic tiers. §
Collection and Disposal is the economic core of the company and comprises two geographic tiers — the East Tier (the Eastern U.S., the Great Lakes region and substantially all of Canada) and the West Tier (the Western, Southern and Central U.S., the upper Midwest and British Columbia) — together with certain Other Ancillary services that support collection and disposal but are not managed through the tiers. Its revenue model is collection fees plus landfill tipping fees, and the single variable that drives it is landfill yield — the price realized per unit of disposal airspace, led by municipal solid waste. Because landfill disposal carries the highest margins in the business and because owning the disposal asset lets the company keep fees it would otherwise pay third parties, this segment is both the profit engine and the source of the moat.
Recycling Processing and Sales separates reusable paper, cardboard, plastic, glass and metal from the waste stream for processing and resale, and also runs brokerage and organics (composting and anaerobic digestion). Its economic driver is recycled-commodity prices, which are volatile and policy-sensitive; management is deliberately shifting the business from the old rebate model toward a fee-for-service model designed to recover processing cost plus margin regardless of where commodity prices sit, precisely to blunt that exposure. Even so, this segment swung to an operating loss in FY2025 as single-stream prices fell and a plastic-film recycling business was impaired — a recurring fragility, not a one-off (Section 3).
Renewable Energy captures methane from decomposing landfill waste and converts it into renewable natural gas, electricity, heat and steam. Its revenue is the sale of that energy plus environmental attributes — RINs under the federal Renewable Fuel Standard, low-carbon-fuel credits and renewable-energy credits — which under WM’s accounting carry no allocated cost and therefore convert at near-100% margin. That makes the segment high-margin but structurally exposed to volatile, policy-driven credit prices; the current federal rule-making backdrop is a genuine headwind (Section 2).
Healthcare Solutions, operated through the acquired Stericycle subsidiary, is a business-to-business provider of regulated medical, pharmaceutical and hazardous-waste services and secure information destruction, serving the U.S., Canada and Western Europe. It is the second-largest revenue base in the portfolio, but it ran an operating loss in its first full year (FY2025) — heavy amortization of acquired customer-relationship and ERP intangibles, integration costs and billing-system friction more than offset its positive underlying earnings. Its trajectory toward breakeven is the single most important operational swing factor in the near-term story.
Corporate and Other captures activities not managed through the operating segments — the corporate office, long-term incentive programs, expanded-service and technology investments, and closed landfill sites.
How the system fits together. The flywheel is internalization: owned collection volumes flow into owned transfer stations, which consolidate waste into larger, more efficient loads bound for owned landfills, so disposal economics are captured internally and consolidated margins rise. Renewable Energy then monetizes the methane those same landfills produce — and, in a genuine circular loop, the renewable natural gas fuels WM’s own natural-gas collection fleet. The fragilities sit at the edges of this core: Recycling introduces commodity-price and impairment volatility, and Healthcare Solutions introduces integration, cash-conversion and goodwill risk that did not previously exist in the business. The core disposal engine is durable; the newer, “sustainability-growth” and healthcare wings are where earnings quality is most contestable.
1.3 Geographic Exposure
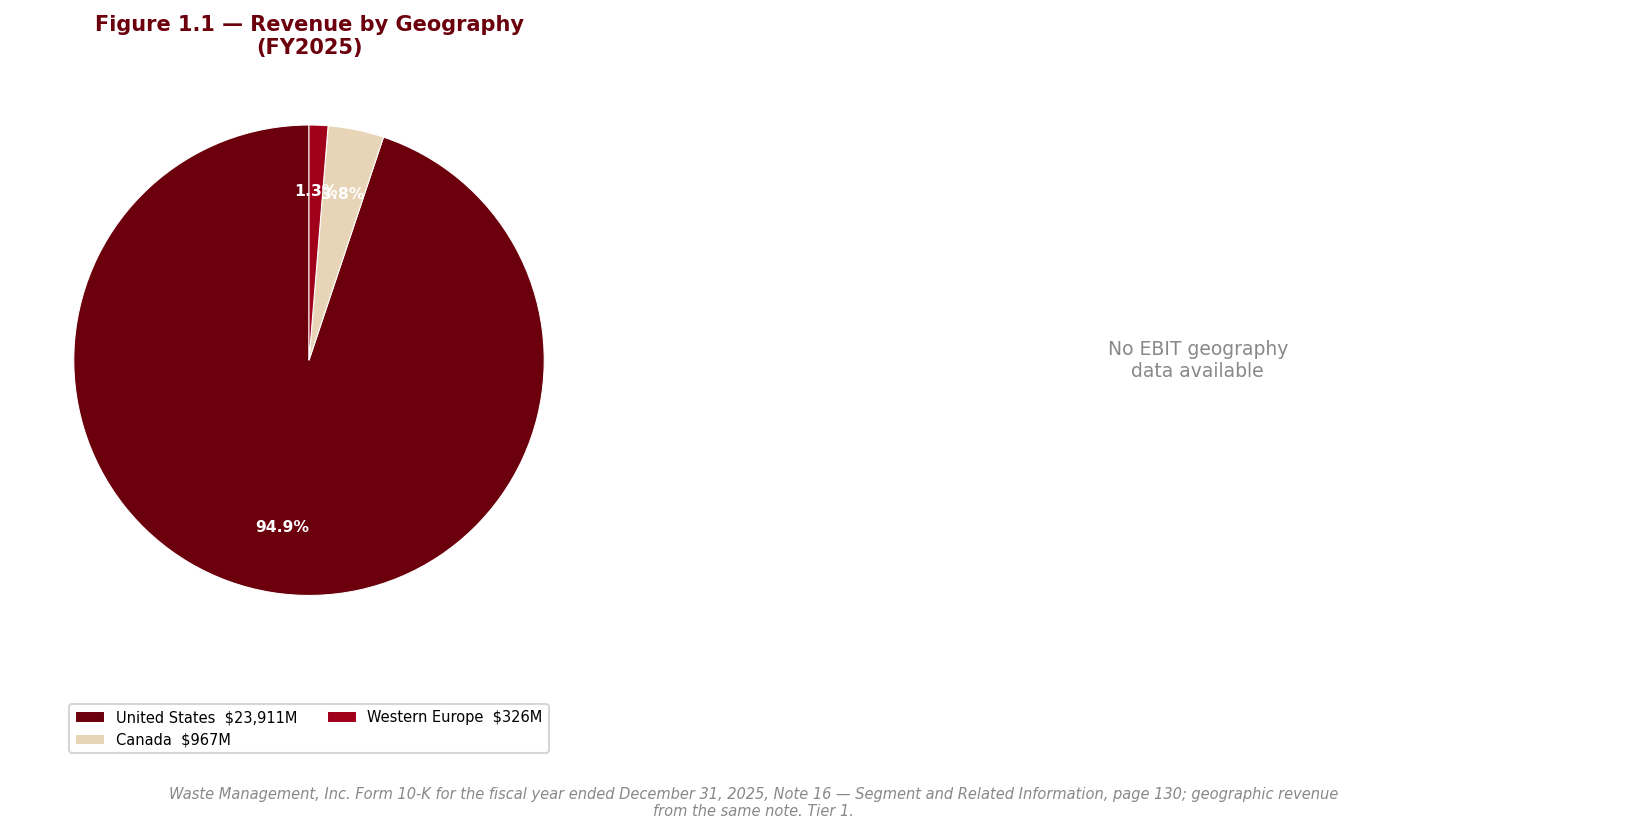
sources The company’s operations remain overwhelmingly North American. It operates across all U.S. states plus the District of Columbia and parts of Canada, with the Western European footprint added largely through the Stericycle acquisition and administrative and support functions also located in India. Principal executive offices are leased in Houston, Texas. Practically, this is a U.S.-dollar business with modest Canadian-dollar exposure and a small, recently acquired European tail; currency translation is not a material swing factor. The geographic realities that do matter are operational and regulatory rather than currency-driven — disposal-capacity scarcity near major metropolitan areas, a state-by-state patchwork of recycling, diversion and flow-control rules, and emerging-contaminant (PFAS) regulation that raises landfill operating costs. Those are geography-specific risks; they are addressed in Section 2.
1.4 Management Team
sources Management should be assessed here on demonstrated priorities and discipline rather than on biography, because the current leadership is being tested on one thing above all: whether it can integrate Stericycle and restore the earnings the deal temporarily diluted. Two things stand out. First, strategic continuity — management explicitly states its “fundamental strategy has not changed,” anchoring on pricing discipline (yield leadership over lower-margin volume), continuous cost-to-serve reduction through automation, and the sustainability-growth build-out in Renewable Energy and Recycling. That consistency is a credibility asset in a mature industry where the temptation is to chase volume. [Rating and price target withdrawn — see the note at the top.]
The credible risk sits in execution, not intent. The Stericycle integration has already surfaced billing- and collection-system problems (“data and system challenges”) that drove a rising bad-debt provision and pressured Healthcare Solutions cash conversion, and management has flagged the ERP integration itself as an internal-control risk. The auditor’s clean, unqualified opinion on both the financial statements and internal control — from a firm that has audited the company for more than two decades — is a reassuring counterweight, but the integration is the live test of this team’s operational credibility over the next several reporting periods.
1.5 Capital Allocation Track Record
| Year | Dividends Paid ($M) | Share Repurchases ($M) | CapEx ($M) |
|---|---|---|---|
| FY2021 | $970.0M | $1,350.0M | $1,904.0M |
| FY2022 | $1,077.0M | $1,500.0M | $2,587.0M |
| FY2023 | $1,136.0M | $1,302.0M | $2,895.0M |
| FY2024 | $1,210.0M | $262.0M | $3,231.0M |
| FY2025 | $1,334.0M | $0.0M | $3,227.0M |
Source: Company SEC filings (10-K); see Appendix A.1.
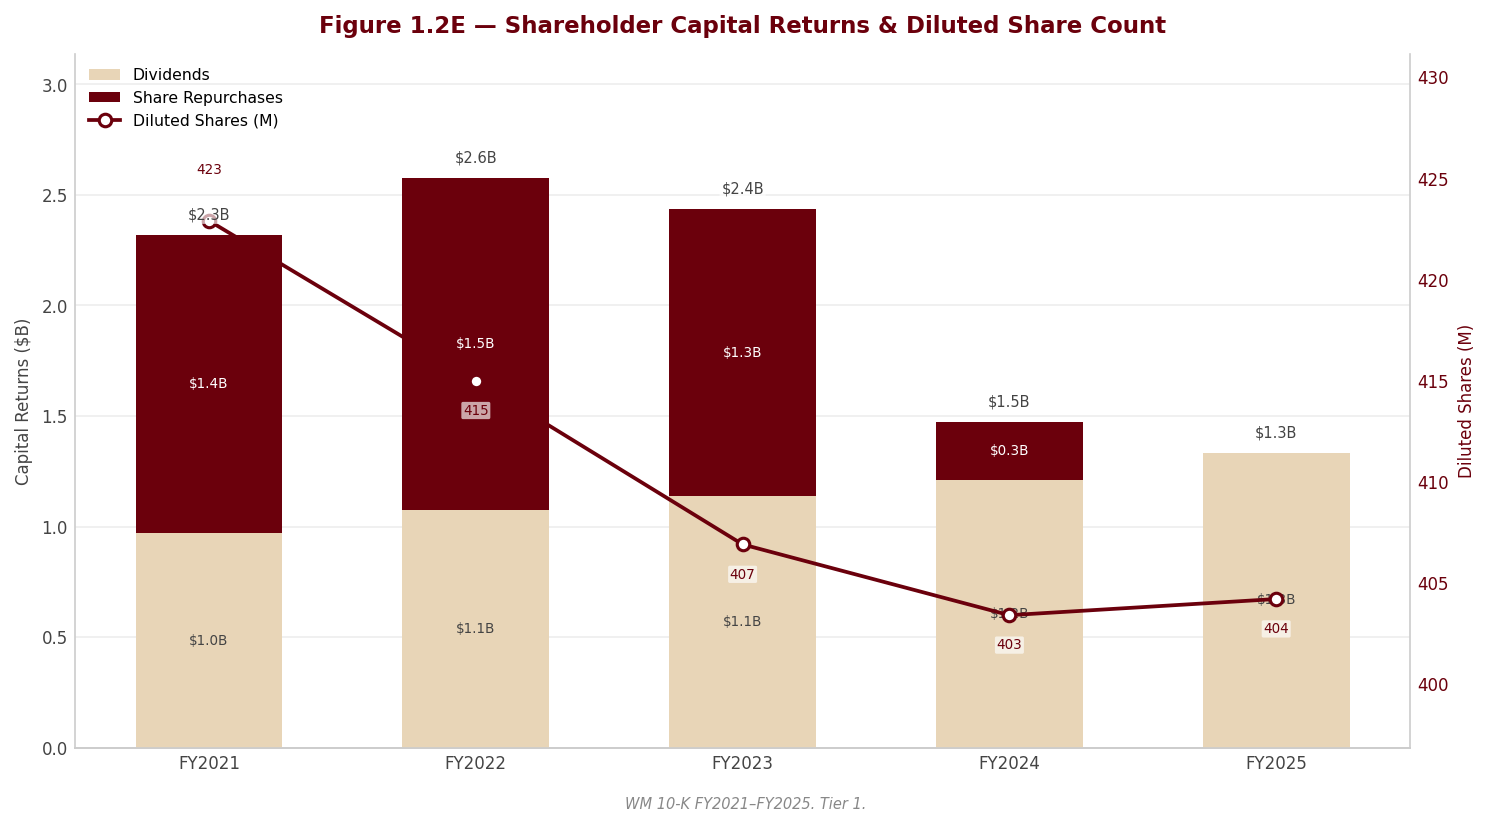
The five-year pattern reads as a deliberate reordering of priorities around the Stericycle acquisition rather than a change in philosophy. The dividend has been raised every year — management characterizes it as a multi-decade unbroken streak and treats it as a signal of consistent cash generation — and at the FY2025 payout ratio of 49.3% it remains comfortably covered, with a total shareholder-return yield of 1.5%. Share repurchases tell the more informative story: they were cut to $0.0M in FY2025, a full suspension, as management redirected capital to de-leverage after funding the acquisition with debt. [Rating and price target withdrawn — see the note at the top.]
Capital expenditure has run well above pure maintenance levels through the period, reflecting the “sustainability-growth” build-out — recycling automation and renewable-natural-gas facilities — layered on top of base-business fleet and landfill capital. Management distinguishes capex “to support the business” from “sustainability-growth” capital and signals that the growth portion is now declining as that portfolio moves past peak construction toward harvesting returns, which underpins its expectation of improving free cash flow. The read-through: capital has been deployed into the business and into de-leveraging over the past two years rather than returned to shareholders, and the coming inflection — falling growth capex plus resumed buybacks — is a central plank of the forward story rather than an accomplished fact.
1.6 Competitive Positioning & Moat
sources Industry structure. Solid-waste is a comparatively mature, stable, locally-oligopolistic industry in which returns are earned through disposal ownership and route density, not growth. Competition comes from large national operators, from counties and municipalities that run their own collection and disposal (and enjoy tax-revenue and tax-exempt-financing advantages), and from regional and local specialists; management characterizes competition as based on price, service quality and breadth of offering. The winners are the operators that own scarce disposal capacity in a given geography and can fill it efficiently with internalized volume — a structural advantage that is very difficult to replicate.
Competitive advantages. The moat is real and rests on three reinforcing pillars, each supported by the filing. First, landfill airspace and permitting: management stresses that all solid-waste companies must have access to disposal, that the capital required to develop a landfill is itself a barrier, and — critically — that permits to build or expand landfills have become materially harder, slower and more expensive to obtain amid zoning, environmental and community review, with land scarcity near major metros constraining new capacity. The extensive environmental regulation applicable to the industry thus operates as a barrier to entry that protects the incumbent. Second, internalization / network scale: routing owned collection into owned transfer stations and the largest disposal-asset base in North America lets WM retain fees it would otherwise pay away and move larger, more efficient loads, which management ties directly to higher consolidated margins and stronger operating cash flow — a network effect that strengthens with scale. Third, contract stickiness: multi-year commercial agreements and exclusive municipal franchises create recurring, high-retention revenue and switching costs on the collection side that feed the disposal engine.
Competitive vulnerabilities. Three erosions warrant watching. Recycling and Renewable Energy — the “sustainability-growth” wings management is investing behind — introduce genuine commodity- and policy-price volatility (recycled-commodity swings and a deteriorating federal RFS/RIN backdrop), and the recycling growth investments have a demonstrated pattern of impairment when prices turn. Structural waste diversion — recycling mandates, composting, zero-waste goals and disposal bans — could over time reduce the high-margin landfill volumes on which the moat depends, and simultaneously lower the landfill-gas feedstock for Renewable Energy. And the Healthcare Solutions acquisition imported integration, cash-conversion and goodwill-impairment risk that did not previously sit in this business — the segment’s FY2025 operating loss is the visible symptom, and the goodwill carried against a loss-making reporting unit is the headline financial-risk exposure carried forward to Section 2.
Verdict. The core disposal franchise is one of the more durable moats in the industrials universe — permitting scarcity and internalization are not eroding, and pricing-led yield growth gives the company a structural lever most cyclicals lack. The honest qualification is that reported profitability is currently at a cyclical/acquisition-driven trough: the FY2025 operating margin of 17.1% understates the underlying earning power of the disposal engine because it absorbs Stericycle’s dilution, a recycling-commodity down-cycle and elevated amortization. Long-run margin durability is therefore high for the core and contingent for the newer wings — the investment question is not whether the moat holds, but whether the market is already paying for the margin recovery that the moat should deliver. That question is settled in the separate valuation, not here.
Section 2 — Key Risks & Catalysts
sources
2.1 Downside Risks
sources The risk that dominates this name is not operational or macroeconomic — the core disposal franchise is about as recession-resistant as an industrial gets — but acquisition-specific and accounting-driven. Every material downside converges on one decision: the debt-funded, late-2024 purchase of Stericycle. That transaction created the Healthcare Solutions segment, imported the goodwill and integration risk that now sit at the top of this list, and put the balance sheet under strain. The secondary layer is the estimate-heavy nature of landfill accounting and the policy/commodity exposure of the “sustainability-growth” wings. Section 1’s investment case — a moat-protected compounder priced for a recovery — lives or dies on whether these risks resolve as management expects, and this section tests exactly that.
Risk 1 — Goodwill impairment on the Healthcare Solutions segment
sources This is the single most material financial-reporting exposure in the filing, and it carries the loudest possible signal from the people paid to be skeptical: the auditor. Healthcare Solutions — the segment built from Stericycle — ran an operating loss in its first full year despite being the second-largest revenue base in the company, weighed down by heavy amortization of acquired customer-relationship and ERP intangibles plus integration cost. Against that loss-making unit sits a very large concentration of goodwill, equal to a substantial fraction of the company’s entire equity base. For FY2025 the auditor’s third critical audit matter changed: it moved from getting the Stericycle purchase accounting right (the FY2024 concern) to whether that goodwill is still recoverable at all. Management ran a quantitative impairment test on this reporting unit specifically because of its sensitivity, concluded there was no impairment — but disclosed no headroom cushion, no “fair value substantially exceeds carrying value” language. [Rating and price target withdrawn — see the note at the top.]
A portfolio manager must weigh what a write-down would and would not do. It would be non-cash: it would not touch operating cash flow and would not, by itself, reduce the unlevered free cash flow that drives the valuation, nor would it trip the leverage covenant (which is measured on debt-to-EBITDA, not equity). But it would matter in two real ways. [Rating and price target withdrawn — see the note at the top.] Second, it would erode the equity base of the company that already carries the most stretched balance sheet in its peer set, compounding Risk 2. The counter-evidence is genuine and recent: through the first half of FY2026 the segment’s operating loss narrowed sharply toward breakeven, with no impairment and no interim trigger disclosed. The tail risk is intact; the near-term trajectory is improving. The binding date is the annual impairment test on 1 October 2026. (FY2025 10-K, p.75.)
Probability: Medium | Timeframe: Immediate (annual test 1 October 2026) | Quantified potential impact: A charge would be non-cash and would not directly move the DCF’s unlevered free cash flow, but a large impairment relative to equity would confirm deal-value destruction and pressure the equity base; the magnitude is undisclosed because management quotes no headroom.
Risk 2 — Balance-sheet leverage and constrained capital return
sources The Stericycle deal was funded with debt, and it left WM with the most leveraged balance sheet — the highest net-debt-to-EBITDA — in its closest peer group. Interest expense rose steeply year-over-year as acquisition debt was drawn, turning into a structural drag on both earnings per share and free cash flow that persists until the company delevers. [Rating and price target withdrawn — see the note at the top.] The most restrictive covenant is a maximum leverage ratio on the revolving facility; management states it was in compliance but quotes no numeric headroom, so the cushion against an EBITDA shock is unknowable from the outside. [Rating and price target withdrawn — see the note at the top.] Since FY2025, repurchases have resumed and the dividend has again been raised — but importantly, net debt has stayed roughly flat, because the deleveraging is being achieved through EBITDA growth rather than actual debt paydown. WM is therefore choosing shareholder returns over building a debt-reduction cushion, which leaves the leverage ratio exposed if EBITDA stumbles. (FY2025 10-K, p.100.)
Probability: Medium | Timeframe: 1–2 years | Impact: Structural drag on EPS and free cash flow from elevated interest cost; capital-return capacity is a function of the deleveraging path, and covenant headroom is undisclosed, so an EBITDA shock is the key monitorable.
Risk 3 — Stericycle integration: billing, receivables and control friction
sources Integration risk is not abstract here — it has already shown up in the numbers. Stericycle’s customer-engagement and ERP systems produced billing and collection problems that management itself labels “data and system challenges.” A large gross allowance for doubtful accounts was established on the acquired opening balance sheet, elevated write-offs followed, the bad-debt provision rose materially, and receivables were a significant use of operating cash in FY2025 — WM’s days-sales-outstanding is the highest in its peer set. This is simultaneously an operational problem (cash conversion in Healthcare Solutions), an earnings problem (the provision weighs on an already loss-making segment), and a control-adjacent problem: management explicitly flags the ERP integration as an internal-control-over-financial-reporting risk, even though the auditor’s opinion on internal control was clean and unqualified. The direction of travel is favorable — through H1 FY2026 the provision and write-offs are normalizing — but “normalizing” is not “resolved,” and until the systems are fully integrated the quality of Healthcare Solutions receivables and revenue is harder to assess than the rest of the company. (FY2025 10-K, p.83.)
Probability: Medium (normalizing) | Timeframe: Immediate–1 year | Impact: Drag on Healthcare Solutions cash conversion and segment profitability; a live internal-process risk until the ERP/billing integration is complete.
Risk 4 — Landfill accounting: the largest recurring estimate
sources Landfill accounting is the single most judgemental estimate in the business, and it drives two of the auditor’s three critical audit matters — depletion expense (computed on airspace estimates) and the asset-retirement obligation for final capping, closure and post-closure costs. [Rating and price target withdrawn — see the note at the top.] The estimate is demonstrably live — FY2025 saw a material upward revision to the landfill liability that lifted depletion — which is precisely why it matters: a change in airspace, cost or timing assumptions moves reported depreciation, depletion and amortization, and therefore operating income, directly. The specific tail risk is that expansion airspace is included in the depletable base before permits are granted; a denied or abandoned expansion could force accelerated depletion or an impairment. This is well-governed — the auditor uses engineering specialists and took no exception — so this is not a red flag in the sense of a suspected error. It is a red flag in the sense that it is the biggest single lever on reported earnings quality, and it must be understood as such rather than treated as a fixed cost. (FY2025 10-K, p.74.)
Probability: Low–Medium | Timeframe: Ongoing | Impact: Estimate revisions move reported D&A and operating income directly; a denied expansion could trigger accelerated depletion or impairment on affected sites.
Risk 5 — Policy and commodity exposure across the sustainability-growth wings
sources The two segments management is investing behind for growth — Renewable Energy and Recycling — are also the two most exposed to forces WM does not control. In Renewable Energy, environmental credits (RINs under the federal Renewable Fuel Standard, low-carbon-fuel credits and renewable-energy credits) are recognized at essentially 100% margin because no cost is allocated to them when generated, so their revenue and profit swing directly with volatile, policy-driven credit prices. The federal backdrop has deteriorated: the current administration retroactively lowered prior-year blending volumes, proposed reductions and low future targets, and granted small-refinery exemptions — all of which depress RIN demand and value. [Rating and price target withdrawn — see the note at the top.] There is a partial offset — newer clean-fuel production credits extend the benefit through 2029 — but the credit stream is being re-based onto still-evolving Treasury rules rather than de-risked. In Recycling, the exposure is commodity prices: the segment swung to an operating loss in FY2025 as single-stream prices fell and a plastic-film recycling business was impaired — and critically, that same business had already been impaired two years earlier, so the “sustainability-growth” capital has a demonstrated pattern of value destruction when commodity prices turn. Analysts should treat these impairments as a recurring feature, not one-offs. (Renewable/RFS policy: FY2025 10-K, p.70; recycling impairment: p.114.)
[Rating and price target withdrawn — see the note at the top.]
Risk 6 — Segment-reporting discontinuity limits clean like-for-like history
sources This is an analytical caveat rather than a cash risk, but it is one a portfolio manager should hear plainly. WM has reshaped its reportable-segment structure repeatedly in a short window — the reorganization of collection and disposal into East and West Tiers, the addition of Healthcare Solutions, and a mid-year (Q3 2025) change that grossed up Healthcare Solutions with intra-segment activity recast into the prior year. None of these change consolidated results or the segment’s operating loss, and the reportable-segment set has been stable since FY2024 — but they do complicate genuine like-for-like comparison of the segment lines and inflate the gross Healthcare Solutions revenue figure. The practical consequence: the multi-year segment history is not as clean as it looks, and gross Healthcare revenue must not be misread as growth.
Probability: Certain (already occurred) | Timeframe: Ongoing | Impact: No cash or earnings impact; reduces the reliability of multi-year segment comparisons and demands use of net, recast figures.
2.2 Upside Catalysts
sources Be honest about the asymmetry: this is a risk-heavier story than a catalyst-rich one, and the single largest “catalyst” is really the removal of a risk rather than new upside creation. [Rating and price target withdrawn — see the note at the top.] The catalysts below are largely operational and already in motion, which raises their probability but caps their surprise value.
Catalyst 1 — Healthcare Solutions reaches operating breakeven
sources The most valuable thing that can happen to this stock is the quietest: Healthcare Solutions turning operating-profit-positive. Doing so would simultaneously defuse the goodwill-impairment overhang (Risk 1), remove the segment’s drag on consolidated EPS, and validate the entire Stericycle thesis that the FY2025 numbers called into question. The evidence that this is happening is concrete — the segment’s operating loss more than halved in the first half of FY2026 as integration costs rolled off and billing normalized, moving it close to breakeven. This is the pivot the whole near-term story turns on.
Probability: Medium–High | Timeframe: 1–2 years | Monitoring trigger: Segment income from operations turning positive; no impairment or interim trigger at the 1 October 2026 annual test; continued normalization of the bad-debt provision.
Catalyst 2 — Free-cash-flow inflection and resumed capital return
sources Two forces are converging to lift free cash flow: the “sustainability-growth” capital program is moving past its peak-construction phase toward harvesting returns, so growth capex is declining, and the working-capital drag from Stericycle integration is normalizing. Management has already acted on its confidence — repurchases have resumed after the FY2025 suspension, with a multi-billion-dollar authorization still available, and the dividend has again been raised. The caveat, carried from Risk 2, is that this capital return is being funded alongside broadly flat net debt rather than out of a built-up cash cushion, so the buyback resumption should be read as an EPS support and a signal of management’s leverage comfort, not as evidence of balance-sheet deleveraging.
Probability: High (already underway) | Timeframe: Immediate–1 year | Monitoring trigger: Declining sustainability-growth capex; the pace of buybacks against the remaining authorization; free-cash-flow conversion improving as receivables normalize.
Catalyst 3 — Core pricing discipline and margin recovery
sources Underneath the acquisition noise, the core disposal engine performed well in FY2025 — Collection and Disposal core yield was solidly positive and the consolidated operating-expense margin improved as efficiency gains, a younger fleet and disciplined shedding of lower-margin residential contracts took hold. This is the durable part of the story: pricing-led yield growth is a structural lever most cyclicals lack, and as the Stericycle dilution and the recycling down-cycle fade, reported margins should re-converge toward the underlying earning power of the franchise. Section 1 argued that the FY2025 operating margin understates true earning power; the realization of that gap is the third catalyst.
Probability: High | Timeframe: Ongoing | Monitoring trigger: Collection and Disposal core yield holding above cost inflation; consolidated operating-expense margin continuing to improve; evidence the margin recovery is core-driven, not commodity-driven.
Catalyst 4 — Clean-fuel production credits extend the RNG tax benefit
A partial policy offset to Risk 5: newer clean-fuel production tax credits, realizable through 2029, are beginning to be recognized at WM’s RNG facilities, extending and re-basing the sustainability-driven tax benefit that the older investment tax credits (which wind down through 2027) had been providing. [Rating and price target withdrawn — see the note at the top.]
[Rating and price target withdrawn — see the note at the top.]
2.3 Risk & Catalyst Summary
| # | Item | Type | Probability | Timeframe | Status | Monitoring Trigger |
|---|---|---|---|---|---|---|
| 1 | Healthcare Solutions goodwill impairment | Risk | Medium | Immediate (Oct-2026 test) | Active | Segment operating result; no impairment at annual test |
| 2 | Balance-sheet leverage / constrained capital return | Risk | Medium | 1–2 years | Active | Debt/EBITDA path; covenant headroom; net-debt trend |
| 3 | Stericycle billing / receivables / control friction | Risk | Medium | Immediate–1 year | Monitoring | Bad-debt provision and write-offs normalizing; DSO |
| 4 | Landfill accounting estimate (depletion & ARO) | Risk | Low–Medium | Ongoing | Latent | Estimate revisions; expansion-permit outcomes |
| 5 | Policy & commodity exposure (RIN/RFS/tax credits; recycling) | Risk | Medium–High | Immediate–3 years | Active | Federal RFS rules; RIN/commodity prices; ETR drift |
| 6 | Segment-reporting discontinuity | Risk | Certain | Ongoing | Latent | Use of net, recast segment figures |
| 7 | Healthcare Solutions reaches operating breakeven | Catalyst | Medium–High | 1–2 years | Monitoring | Segment income turning positive; no impairment trigger |
| 8 | FCF inflection & resumed capital return | Catalyst | High | Immediate–1 year | Active | Falling growth capex; buyback pace; FCF conversion |
| 9 | Core pricing discipline & margin recovery | Catalyst | High | Ongoing | Active | Core yield vs inflation; opex-margin trend |
| 10 | Clean-fuel production credits extend RNG tax benefit | Catalyst | Medium | 1–3 years | Monitoring | Treasury rule finalization; credit recognition |
Source: Company SEC filings (10-K) and forensic footnote review; see Appendix A.1.
2.4 Risk Interdependencies
sources These risks are not independent draws — they share a common node, and that is what makes the tail scenario dangerous rather than merely uncomfortable. Healthcare Solutions sits at the center: if integration stalls and the segment stays loss-making, three risks fire at once — the goodwill-impairment trigger (Risk 1) becomes live, the billing/receivables cash drag (Risk 3) persists, and the EPS dilution the acquisition caused does not unwind. Each of those individually is manageable; arriving together they would turn a “priced-for-recovery” stock into a “recovery-is-not-happening” stock.
The more financially acute interaction is between an EBITDA shock and the balance sheet. A goodwill write-down does not hit the leverage covenant, but the operating deterioration that would justify one does. Because management has resumed buybacks rather than paying down debt, no cushion has been built — so a simultaneous Healthcare stumble and a recycling-commodity down-cycle (Risks 1, 3 and 5 compounding) would compress EBITDA against elevated debt precisely when covenant headroom, already undisclosed, is thinnest. [Rating and price target withdrawn — see the note at the top.] The combination that would be disproportionately damaging is therefore not any single event but the correlated one: Healthcare weakness plus a commodity/policy down-leg, landing on a balance sheet with no debt-reduction buffer.
2.5 ESG & Regulatory Exposure
sources WM’s ESG profile is genuinely two-sided, and both sides are specific to this filing rather than generic. On the positive/governance ledger, the assurance baseline is clean: an unqualified auditor opinion on both the financial statements and internal control, from a firm that has audited the company for more than two decades, with no going-concern or emphasis-of-matter language. Governance risk from self-dealing is effectively absent — the company is widely held with no controlling shareholder, and there are no external related-party transactions; the only “related-party” dealings are intercompany guarantees and royalties eliminated in consolidation. The business is also, at its core, an environmental-solutions company whose renewable-energy and recycling activities are ESG-aligned by nature.
The regulatory exposures that actually move numbers are environmental and policy-driven. The most concrete near-term contingency is the San Jacinto River Waste Pits Superfund matter (Harris County, Texas), where WM is a potentially responsible party through a subsidiary: the EPA approved a revised full remedial design and, as anticipated, issued a Unilateral Administrative Order in 2026, moving the matter into active implementation. The recorded liability is a large share of WM’s total environmental-remediation reserve, and management continues to warn that ultimate liability “could be materially different” as construction contracting proceeds — so cost could rise from here. It is one of many Superfund NPL sites where WM is a PRP, and a new state environmental order (a Delaware DNREC action against a subsidiary alleging landfill-cover, stormwater, prohibited-waste and permitting violations) has since surfaced under appeal — a reminder that environmental-enforcement exposure is a standing feature, not a one-off. Separately, the Stericycle acquisition imported legal-contingency risk that did not previously exist at WM, most notably an inherited DEA / Controlled Substances Act criminal and civil investigation into the now-divested ESOL controlled-substances business; management characterizes it as immaterial, but a federal criminal-and-civil matter carries unquantified monetary and reputational tail risk worth monitoring for any move from investigation to charge.
Forward-looking regulatory risk clusters around three themes disclosed in this filing. Renewable-fuel policy — the deteriorating federal RFS/RIN backdrop discussed in Risk 5 — is the most financially direct. Emerging contaminants, chiefly PFAS: federal designation of certain PFAS compounds as hazardous substances under the Superfund regime could expose landfills to increased remediation and litigation cost, and a patchwork of state standards has already raised landfill operating costs (while also creating a potential PFAS-management business opportunity). And extended producer responsibility regulation, which is explicitly two-sided — broad adoption could reshape the volume, contract terms and profitability of the recycling stream WM manages, while jurisdictions scaling programs back, and litigation over them, create planning uncertainty. Climate exposure runs both ways as well: landfills emit methane and face GHG-measurement and disclosure-cost risk, while physical climate events (Western wildfire, hurricanes) both disrupt service and, episodically, raise lower-margin special-waste volumes. None of these is boilerplate for this company — each ties to a specific asset base (landfills, the RNG fleet, the recycling segment) that Section 1 identified as central to the moat.
Section 3 — Financial Analysis & Historical Performance
Three-Statement Linkage Confirmation
- Net Income ties (Income Statement → Cash Flow Statement): Confirmed. FY2025 net income of $2,708.0M is carried directly as the opening line of the cash-flow statement, from which operating cash flow of $6,043.0M is built.
- Cash ties (Balance Sheet → Cash Flow Statement): Confirmed. The cash-flow statement rolls to a year-end cash balance of $201.0M, matching the balance-sheet cash and equivalents line for FY2025.
- Retained Earnings reconciliation (Beg RE + NI - Dividends = End RE): Confirmed and exact. Opening retained earnings of $15,858.0M plus net income of $2,708.0M less dividends of $1,334.0M reconciles to closing retained earnings of $17,232.0M, with no unexplained residual.
A note on the history window. The model carries an eleven-year frame (FY2015–FY2025), but the earliest source filing on hand is the FY2018 annual report, so FY2015 is empty and the FY2016 balance sheet is only partial. In practice this is a ten-year income-statement history (FY2016–FY2025), and several balance-sheet ratios and the ten-year CAGRs begin later than the top of the window. Where that gap affects a trend it is flagged in the commentary rather than papered over — a blank cell here is an honest absence of source data, not a computation error.
3.1A Income Statement
Source: Company SEC filings (10-K); figures per the FL model — see Appendix A.1–A.2.
CAGR Summary
| Metric | 3Y CAGR | 5Y CAGR | 10Y CAGR |
|---|---|---|---|
| Revenue | 8.6% | 10.6% | - |
| EBITDA | 9.9% | 11.8% | - |
| Net Income | 6.6% | 12.6% | - |
| Diluted EPS | 7.5% | 13.7% | - |
| FCF | 13.1% | 9.7% | - |
Source: Company SEC filings (10-K); figures per the FL model — see Appendix A.1–A.2. The ten-year CAGR column is intentionally blank: it requires an FY2015 base the earliest source filing does not supply.
3.1B Income Statement — Analysis
sources The revenue story: growth without earnings. FY2025 is the year a portfolio manager must read most carefully, because the headline and the substance point in opposite directions. Revenue grew 14.2% to a record $25,204.0M — the fastest expansion in the window and well ahead of the 10.6% five-year CAGR — yet diluted EPS fell to $6.70 from $6.81, and net income declined -1.4% to $2,708.0M. That divergence is the single most important fact in this section, and it is entirely a matter of what drove the top line. Almost all of the 14.2% increase was acquired, not organic: the first full year of the Stericycle-based Healthcare Solutions segment added a step-change in reported revenue, while management attributes the underlying organic contribution to higher Collection and Disposal yield (led by municipal-solid-waste landfill pricing) and higher landfill, renewable-energy and recycling volumes, partly offset by a deliberate shedding of lower-margin residential contracts and a decline in single-stream recycled-commodity prices. Price-and-yield-led organic growth of this kind compounds; a one-time acquisition step-up does not. [Rating and price target withdrawn — see the note at the top.]
The margin trajectory: where the revenue went. The cleanest way to see why more revenue produced less profit is to walk down the P&L. Operating (EBIT) margin compressed to 17.1% from 18.4%, a full point-plus of erosion in a single year, and every dollar of that compression is traceable to lines below the core operating cost base — because the core actually improved. Management reports that consolidated operating expense as a percentage of revenue fell, helped by efficiency gains, lower employee turnover, a younger fleet reducing parts demand, customer price increases and higher-margin special-waste volumes, with lower recycling-commodity prices also reducing cost of goods sold. Gross margin held at 40.4% (versus 39.3%). The damage was done further down: depreciation and amortization, interest, integration costs and a loss-making acquired segment. This is the critical distinction for the thesis — the margin decline is structural and acquisition-driven, not core-operational deterioration, which is exactly why Section 1 argued the FY2025 operating margin understates the franchise’s true earning power.
Major movers. Four drivers explain the revenue-up / earnings-down paradox, and each carries a different structural signature:
- Depreciation and amortization stepped up to $2,863.0M from $2,267.0M — a far steeper rise than the 13.3% increase in EBITDA, and the largest single swing factor. Two forces combined: a front-loaded surge in intangible amortization from Stericycle’s acquired customer-relationship and ERP assets (written down on short lives and a declining-balance method, so the charge is heaviest in the early years), and an increase in landfill depletion driven partly by an upward revision to landfill liability estimates during FY2025. The intangible-amortization portion is temporary in shape but multi-year in duration — it will fade, but slowly; the landfill-estimate revision is a reminder that depletion is a live estimate that can move reported D&A directly, a point developed as a risk in Section 2.
- Interest expense rose to $912.0M from $598.0M — the direct cost of funding Stericycle with debt. [Rating and price target withdrawn — see the note at the top.] Unlike amortization, this is a structural drag that persists until the balance sheet delevers, and it flows straight through to both EPS and free cash flow.
- The Healthcare Solutions segment ran an operating loss of $(88)M in FY2025 (widening from $(69)M in the stub-period FY2024), as positive underlying earnings were more than offset by intangible amortization and integration expense. This is the segment drag in its purest form — the acquired business is currently subtracting from consolidated operating income even as it adds the second-largest revenue base. The counter-signal is that this loss is narrowing, not compounding (developed under quality of earnings below).
- Impairments and unusual items weighed on operating income, led by a charge to suspend a plastic-film recycling business — which pushed the Recycling Processing and Sales segment to an operating loss of $(80)M for the year. As the segment tables below show, recycling operating income swung from +$86M in FY2024 to $(80)M in FY2025, a genuine reversal driven by both the impairment and a decline in single-stream commodity prices.
Quality of earnings. Three earnings-quality points deserve explicit weight. First, the EPS decline is not a red flag about the core business — it is the mechanical consequence of acquisition accounting and financing, and the core operating-expense ratio improved through the year. An analyst should normalize for the front-loaded intangible amortization and one-time integration costs before extrapolating the reported EPS trend, a task carried into the valuation. Second, the recycling impairment should not be treated as a one-off: the very same plastic-film business had already been impaired two years earlier, so the “sustainability-growth” capital program has a demonstrated pattern of value destruction when commodity prices turn — these “unusual items” are better modeled as a recurring feature of the Recycling and Renewable Energy wings than as isolated events. [Rating and price target withdrawn — see the note at the top.] A related presentation nuance: from the third quarter of FY2025 management grossed up Healthcare Solutions with intra-segment activity (recast into the prior year), inflating that segment’s gross revenue with no effect on net revenue or operating income — the segment figures used throughout this section are the net, recast figures, and the gross line should not be misread as growth.
⚠ Items to Watch. If the consolidated EBIT margin does not recover back toward the 18.4% it earned before the first full year of Stericycle — rather than stabilizing at the 17.1% trough — the acquisition-dilution thesis is not unwinding on schedule and the earnings-recovery case in the separate valuation weakens. [Rating and price target withdrawn — see the note at the top.]
3.1C Segment Detail (both reporting bases)
sources Waste Management has restructured its reportable segments repeatedly in a short window — the reorganization of collection and disposal into East and West geographic Tiers, the addition of Healthcare Solutions with the Stericycle acquisition, and a mid-year FY2025 intra-segment gross-up. As a result there is no clean, continuous multi-year segment series, and splicing the pre- and post-reorganization structures into one line would be false. The two tables below therefore present each basis separately, with its own year range and its structural break marked. The current five-reportable-segment structure is Collection and Disposal, Recycling Processing and Sales, Renewable Energy, Healthcare Solutions, and Corporate and Other; the East Tier, West Tier and Other Ancillary lines shown below are the constituents of the Collection and Disposal reportable segment, not separate reportable segments.
Current basis — reportable segments, FY2019–FY2025
| Segment (Revenue, $M) | FY2019 | FY2020 | FY2021 | FY2022 | FY2023 | FY2024 | FY2025 |
|---|---|---|---|---|---|---|---|
| Collection & Disposal — East Tier | 6,579 | 6,370 | 7,540 | 8,306 | 8,412 | 8,703 | 9,037 |
| Collection & Disposal — West Tier | 6,681 | 6,584 | 7,461 | 8,067 | 7,935 | 8,285 | 8,718 |
| Collection & Disposal — Other Ancillary | — | — | 1,890 | 2,218 | 2,518 | 2,728 | 2,949 |
| Recycling Processing and Sales | — | — | 1,528 | 1,516 | 1,264 | 1,603 | 1,492 |
| Renewable Energy | — | — | 276 | 312 | 273 | 318 | 478 |
| Healthcare Solutions (net) | — | — | — | — | — | 403 | 2,508 |
| Corporate and Other | — | — | 28 | 27 | 24 | 23 | 22 |
| Segment (Operating Income, $M) | |||||||
| Collection & Disposal — East Tier | 1,847 | 1,672 | 2,037 | 2,249 | 2,446 | 2,760 | 2,904 |
| Collection & Disposal — West Tier | 1,934 | 1,800 | 2,103 | 2,346 | 2,383 | 2,693 | 2,889 |
| Collection & Disposal — Other Ancillary | — | — | (18) | — | (8) | (9) | (16) |
| Recycling Processing and Sales | — | — | 217 | 128 | (44) | 86 | (80) |
| Renewable Energy | — | — | 108 | 132 | 79 | 99 | 135 |
| Healthcare Solutions | — | — | — | — | — | (69) | (88) |
| Corporate and Other | (763) | (1,023) | (1,209) | (1,256) | (1,281) | (1,497) | (1,436) |
Source: WM Form 10-K segment note, FY2019–FY2025 (see Appendix). Prior to FY2021, Recycling Processing and Sales, Renewable Energy and Other Ancillary were reported within a combined “Other” category (net operating revenues of $2,195M in FY2019 and $2,264M in FY2020); Healthcare Solutions was created with the November-2024 Stericycle close, so FY2024 reflects only a partial-year stub. FY2025 Healthcare Solutions revenue is the net figure; the gross figure is inflated by the Q3-2025 intra-segment presentation change.
Legacy basis — Solid Waste Tiers, FY2016–FY2020
| Segment (Revenue, $M) | FY2016 | FY2017 | FY2018 | FY2019 | FY2020 |
|---|---|---|---|---|---|
| Solid Waste — Tier 1 | 4,330 | 4,574 | 4,805 | 4,995 | 4,894 |
| Solid Waste — Tier 2 | 1,996 | 2,116 | 2,135 | 3,088 | 3,012 |
| Solid Waste — Tier 3 | 5,190 | 5,477 | 5,682 | 5,177 | 5,048 |
| Other | 2,093 | 2,318 | 2,292 | 2,195 | 2,264 |
| Segment (Operating Income, $M) | |||||
| Solid Waste — Tier 1 | 1,430 | 1,538 | 1,642 | 1,682 | 1,575 |
| Solid Waste — Tier 2 | 522 | 552 | 542 | 854 | 849 |
| Solid Waste — Tier 3 | 994 | 1,199 | 1,211 | 1,136 | 1,071 |
| Other | (100) | (68) | (66) | (203) | (38) |
| Corporate and Other | (550) | (585) | (540) | (763) | (1,023) |
Source: WM Form 10-K / annual report segment note, FY2016–FY2020 (see Appendix). The FY2018→FY2019 step-change in Tier 2 and Tier 3 revenue reflects a within-legacy geographic reassignment between tiers on recast, and is precisely why the legacy and current bases must not be spliced into one series.
What the segments show. Read within each basis rather than across, three things stand out. First, the Collection and Disposal engine is doing exactly what the moat predicts: East Tier revenue climbed from 6,579 in FY2019 to 9,037 in FY2025 and West Tier from 6,681 to 8,718, with segment operating income rising in near-lockstep — durable, yield-led compounding that is the real economic core of the company. Second, the volatility sits at the edges: Recycling Processing and Sales swung from +217 operating income in FY2021 to $(80)M in FY2025, and its revenue is visibly commodity-sensitive (1,528 → 1,264 → 1,603 → 1,492), confirming the recurring-impairment, commodity-exposed characterization rather than a one-off stumble. Renewable Energy is small but structurally profitable, with revenue jumping to 478 in FY2025 as new landfill-gas projects came online. Third, Healthcare Solutions is the swing factor: 2,508 of net revenue in its first full year against an $(88)M operating loss quantifies both the scale of what Stericycle added to the top line and the drag it currently imposes on operating income — the whole near-term earnings-recovery thesis turns on that loss closing.
3.2A Balance Sheet
Source: Company SEC filings (10-K); figures per the FL model — see Appendix A.1–A.2.
3.2B Balance Sheet — Analysis
sources Asset composition: capital-intensive and now acquisition-heavy. This is a balance sheet built on two large, illiquid asset classes. Net PP&E of $20,378.0M — the landfills, trucks, transfer stations and equipment — reflects the genuine capital intensity of the disposal franchise and is the productive core. Sitting alongside it is goodwill and intangibles of $13,880.0M, up from $13,438.0M, the great bulk of which arrived with Stericycle (goodwill stepped up from $9,254.0M in FY2023 to $13,438.0M in FY2024 on the acquisition). The composition shift matters: the company is now materially more goodwill-heavy than it was pre-deal, and a large concentration of that goodwill sits against the loss-making Healthcare Solutions unit — the impairment exposure that Section 2 identifies as the headline financial-reporting risk and that the auditor elevated to a critical audit matter. This is not a cash-rich balance sheet; cash of $201.0M is deliberately thin for a business whose recurring, contracted revenue lets it run minimal liquidity buffers.
Leverage trajectory: delevering on the ratio, not on the debt. Net debt stands at $22,706.0M and net debt/EBITDA at 3.2x — elevated, but improved from the 3.7x FY2024 peak that the debt-funded acquisition produced, and debt/equity likewise eased to 2.3x from 2.9x. [Rating and price target withdrawn — see the note at the top.] The most restrictive covenant is a maximum leverage ratio on the revolving facility, against which management reports compliance but discloses no numeric headroom, so the external analyst cannot size the cushion directly; with net debt/EBITDA at 3.2x the room looks adequate but not generous, and it is EBITDA — not the debt balance — that is doing the work. [Rating and price target withdrawn — see the note at the top.]
Working capital: the Stericycle friction is visible in the receivables line. WM’s model normally runs a very tight, even negative, cash conversion cycle — it collects from customers roughly as fast as it pays suppliers, a structural cash-flow advantage of a recurring-billing service business, which is also why the current ratio of 0.9x sits comfortably below one without signaling any liquidity stress. FY2025 disturbed that: receivables rose to $3,435.0M from $3,272.0M, and — as Section 2 details — Stericycle’s billing- and collection-system problems drove a rising bad-debt provision, large write-offs of acquired balances, and a significant use of operating cash from receivables. This is receivables growth outpacing the organic revenue base, a classic quality-of-cash-conversion flag, though here the cause is a specific, disclosed integration problem in one segment rather than a broad deterioration — and management reports it is actively working down days-sales-outstanding in Healthcare Solutions.
⚠ Items to Watch. If net debt/EBITDA climbs back above the 3.7x FY2024 peak — rather than continuing to fall from 3.2x — it would signal that the EBITDA-driven deleveraging has stalled and would re-open covenant-headroom concern against the undisclosed covenant limit, particularly since management has chosen to resume buybacks rather than build a debt-reduction cushion. And because receivables are the live working-capital pressure point, a further build in the receivables line without a matching rise in organic revenue would indicate the Stericycle billing problem is not normalizing.
3.3A Cash Flow Statement
| FY2021 | FY2022 | FY2023 | FY2024 | FY2025 | |
|---|---|---|---|---|---|
| Cash from Operations ($M) | $4,338.0M | $4,536.0M | $4,719.0M | $5,390.0M | $6,043.0M |
| — Depreciation & Amortization ($M) | $1,999.0M | $2,038.0M | $2,071.0M | $2,267.0M | $2,863.0M |
| Capital Expenditures ($M) | $1,904.0M | $2,587.0M | $2,895.0M | $3,231.0M | $3,227.0M |
| Free Cash Flow ($M) | $2,434.0M | $1,949.0M | $1,824.0M | $2,159.0M | $2,816.0M |
| FCF Margin | 13.6% | 9.9% | 8.9% | 9.8% | 11.2% |
| FCF / Share | $5.76 | $4.70 | $4.48 | $5.35 | $6.97 |
| FCF Conversion (FCF/NI) | 134.0% | 87.1% | 79.2% | 78.6% | 104.0% |
| CapEx / Revenue | 10.6% | 13.1% | 14.2% | 14.6% | 12.8% |
| CapEx / D&A | 1.0x | 1.3x | 1.4x | 1.4x | 1.1x |
| Dividends Paid ($M) | $970.0M | $1,077.0M | $1,136.0M | $1,210.0M | $1,334.0M |
| Share Repurchases ($M) | $1,350.0M | $1,500.0M | $1,302.0M | $262.0M | $0.0M |
Source: Company SEC filings (10-K); figures per the FL model — see Appendix A.1–A.2. Free cash flow here is defined as operating cash flow less total capital expenditures; it deliberately excludes the divestiture-proceeds add-back in WM’s headline non-GAAP free-cash-flow measure.
3.3B Cash Flow — Analysis
sources Operating cash flow is high-quality and grew despite the drags. Operating cash flow rose to $6,043.0M from $5,390.0M, driven by higher Collection and Disposal earnings, the acquisition contribution and lower cash taxes, partly offset by higher cash interest, the unfavorable Stericycle working-capital swing and higher incentive-compensation payments. The tell on earnings quality is FCF conversion: free cash flow of $2,816.0M converted at 104.0% of net income in FY2025, up sharply from 78.6% in FY2024 — and the reason is instructive. Because the FY2025 earnings decline was caused largely by non-cash charges (intangible amortization) and the D&A add-back is correspondingly large at $2,863.0M, cash generation held up far better than reported net income; the company that “earned less” actually converted more cash. One caveat, carried from Section 2: WM’s own headline free-cash-flow definition adds back proceeds from divestitures, which overstates recurring cash generation; the figure used here strips that add-back out and uses the stricter operating-cash-flow-less-total-capital-expenditures definition, so it is the more conservative measure and the one that should anchor dividend-coverage and valuation work.
CapEx: still investing, but the intensity is turning. Capital expenditure of $3,227.0M absorbed 12.8% of revenue, down from 14.6% in FY2024, and the CapEx/D&A ratio eased to 1.1x from 1.4x. That the ratio remains above parity — capex still exceeding depreciation — confirms the company is still in net growth-investment mode rather than harvest mode — spending more than it depreciates — but the direction is the important signal: management distinguishes capex “to support the business” from “sustainability-growth” capital (recycling automation and renewable-natural-gas facilities) and reports the growth portion is now declining as that portfolio moves past peak construction toward harvesting returns. The read-through for the separate valuation is that a genuine free-cash-flow inflection is being set up by falling growth capex — but it is a forward expectation, not yet a realized fact, and the sustainability-growth capital should be treated as real cash out the door, not backed out to flatter “underlying” free cash flow.
Capital-allocation waterfall. Over the five-year window the allocation of cash tells a clear, disciplined story. The dividend has been raised every year — from $970.0M in FY2021 to $1,334.0M in FY2025 — and management treats its multi-decade unbroken increase streak as a signal of consistent cash generation; at the FY2025 payout it remains well covered by the $2,816.0M of free cash flow. Share repurchases carried the adjustment burden: they ran at $1,302.0M in FY2023, were cut to $262.0M in FY2024, and were suspended entirely to $0.0M in FY2025 to prioritize deleveraging after the debt-funded acquisition. This is the correct sequencing for an investment-grade compounder — protect the balance sheet first, return the surplus once leverage normalizes — and buybacks have since resumed under a new authorization in FY2026, alongside a further dividend increase. The one qualification, developed in Section 2, is that the resumed returns are being funded without net debt actually falling, so the buyback restart is best read as an EPS support and a signal of management’s leverage comfort rather than as evidence of balance-sheet deleveraging. Given the modest organic reinvestment needs of a mature disposal business, the mix — reinvestment plus deleveraging over the last two years, pivoting back toward shareholder returns — is a sensible fit to the opportunity set.
⚠ Items to Watch. If FCF conversion falls back below the 78.6% recorded in FY2024 — rather than holding near the 104.0% of FY2025 — it would indicate the Stericycle working-capital drag is re-intensifying and cash earnings quality is slipping. And if capex/revenue fails to fall below the 12.8% of FY2025 as sustainability-growth spending rolls off, the free-cash-flow inflection the forward story depends on is not arriving on schedule.
3.4 Returns Analysis
| FY2021 | FY2022 | FY2023 | FY2024 | FY2025 | |
|---|---|---|---|---|---|
| ROIC | 11.2% | 12.3% | 12.2% | 11.9% | 10.6% |
| ROE | 24.9% | 32.0% | 33.5% | 36.2% | 29.7% |
| ROA | 6.2% | 7.4% | 7.2% | 7.1% | 6.0% |
| Interest Coverage | 8.1x | 8.9x | 7.2x | 6.8x | 4.7x |
Source: Company SEC filings (10-K); figures per the FL model — see Appendix A.1–A.2.
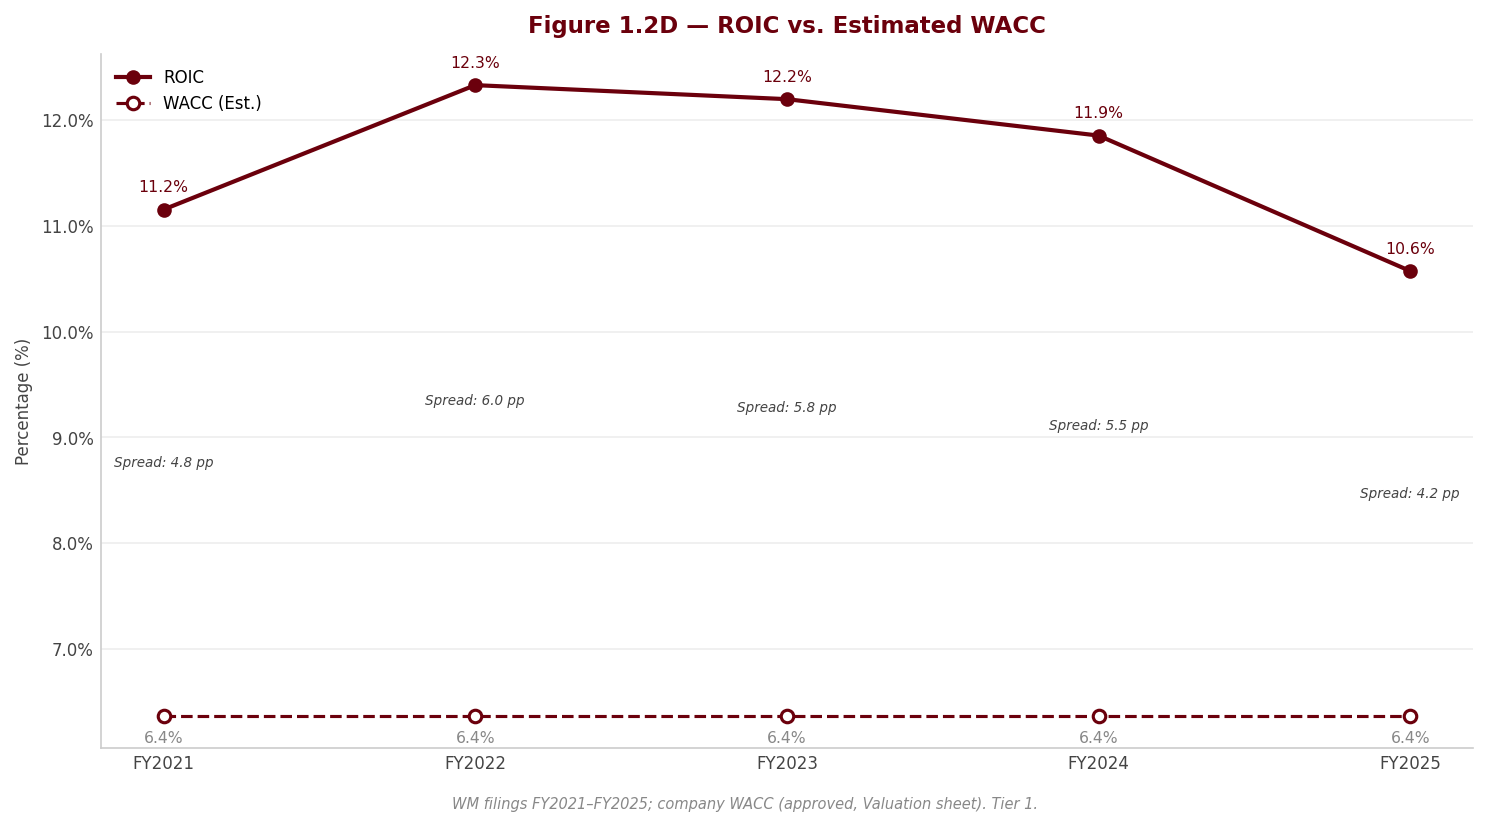
ROIC is the metric that matters, and it fell — for a knowable reason. Return on invested capital declined to 10.6% from 11.9% in FY2024. That is the acquisition writing itself into the returns line: WM paid a full price for Stericycle, added a large slug of goodwill and intangibles to the invested-capital base, and the acquired segment is not yet earning its keep — so the denominator grew while the numerator was diluted by amortization, interest and the segment’s operating loss. This is the honest cost of the deal, and it should be stated plainly: the acquisition diluted returns. The forward question is whether ROIC re-expands as Healthcare Solutions closes its loss and integration costs roll off; the pre-deal trajectory (ROIC comfortably above the 11.2% of FY2021 by FY2022–FY2023) shows the franchise’s normalized earning power is higher than the current print. Critically, even at the 10.6% trough, ROIC remains above the company’s cost of capital — the value-creation spread has narrowed but not closed, which is why this is a “returns diluted” story rather than a “returns destroyed” one.
DuPont decomposition: leverage is now propping up the ROE. Return on equity of 29.7% decomposes into a net margin of 10.7%, asset turnover of 0.56x and an equity multiplier of 4.96x. The signal in the decomposition is a deterioration in quality: ROE actually fell from 36.2% in FY2024, and it did so because the two operating components both weakened — net margin compressed (the amortization and interest drag) and asset turnover fell (the goodwill-heavy acquisition enlarged the asset base faster than sales), a combination that also shows through in ROA declining to 6.0%. The only component pushing ROE up is the equity multiplier of 4.96x — i.e. financial leverage — which is the lower-quality source of ROE and a direct consequence of the debt-funded deal. The swing factor to watch is therefore the interaction of margin recovery against that elevated leverage: a genuine, high-quality ROE recovery requires the operating components (margin and turnover) to rebuild, not the leverage multiplier to rise further. Interest coverage of 4.7x — down from 8.1x in FY2021 as acquisition interest climbed — remains comfortably in investment-grade territory and confirms the leverage, while elevated, is well-serviced.
3.5 Altman Z-Score (Most Recent FY)
| Component | FY2023 | FY2024 | FY2025 |
|---|---|---|---|
| X1 (Working Capital / Total Assets) | -0.013 | -0.033 | -0.013 |
| X2 (Retained Earnings / Total Assets) | 0.437 | 0.356 | 0.376 |
| X3 (EBIT / Total Assets) | 0.109 | 0.091 | 0.094 |
| X4 (Equity / Total Liabilities) | 0.266 | 0.227 | 0.279 |
| X5 (Revenue / Total Assets) | 0.622 | 0.495 | 0.550 |
| Z-Score | 1.43 | 1.15 | 1.27 |
| Zone | Gray | Distress | Gray |
Source: Company SEC filings (10-K); figures per the FL model — see Appendix A.1–A.2.
Interpret with care — this is a model-limitation signal, not a solvency warning. The score computed here is Altman’s Z′ private-firm variant (the book-equity form), and it must be read against that model’s own bands — safe above 2.90, distress below 1.23, gray in between — not the higher cut-offs of the original manufacturer Z-score. On that correct scale WM prints in the Gray zone in FY2023 (1.43), dips into the Distress zone at its FY2024 trough (1.15), and recovers to the Gray zone in FY2025 (1.27) — a materially less alarming picture than a naïve manufacturer-scale reading would give, and still one that should not be taken at face value. Even in its Z′ form the model systematically misclassifies capital-intensive, high-fixed-asset, deliberately-leveraged infrastructure businesses like WM: the asset-turnover term (X5) is structurally low because landfills and equipment are a huge asset base relative to sales; the working-capital term (X1) is negative by design, because WM runs a tight-to-negative cash conversion cycle as a cash-flow strength, not a weakness; and the equity term (X4) is depressed by the very leverage the company took on knowingly to fund Stericycle. [Rating and price target withdrawn — see the note at the top.] What the score does usefully capture is the direction: it fell to its weakest at 1.15 in FY2024, when the acquisition simultaneously loaded on debt (lowering X4) and goodwill (diluting the return terms), and then recovered to 1.27 in FY2025 as EBITDA-driven deleveraging began — the same improving-leverage trajectory the balance-sheet and returns analyses describe. The credit implication is unchanged from Section 2: leverage is genuinely elevated and worth monitoring, but there is no solvency question here, and the sub-safe-threshold Z′-score reflects the model’s poor fit to this business far more than any distress in it.
4. Valuation withdrawn
This section stated what the shares were worth and what to do about them. It rested on an exit multiple set by hand — across the coverage it averaged 24% below where each company actually traded — so the conclusion largely restated that assumption instead of testing it. Rather than leave it standing, it has been withdrawn while the method is rebuilt.
Nothing else in this report depends on it: the financial analysis above and below is drawn from the company's own filings, and every figure links to the page it was verified against.
Section 5 — Financial Metrics & Peer Benchmarking
sources
5.1 Peer Selection
sources The comparable set is deliberately narrow: Republic Services (RSG) and Waste Connections (WCN) — the only two publicly traded, large-cap, pure-play North American solid-waste companies whose business model genuinely mirrors WM’s collection-transfer-disposal-recycling chain. This is a two-name comp set, and that is a limitation the reader should keep in front of them: with only two peers there is no benefit of averaging away idiosyncratic noise, and a single outlier (WCN’s acquisition-led model, for instance) can swing the peer median. We accept the narrowness rather than pad the set with adjacent-but-different businesses (environmental services, hazardous-waste specialists, European utilities), which would import more comparability distortion than they resolve.
Within that constraint, the set is unusually clean. Both peers file a US GAAP 10-K, both close their books on December 31, and the comparison uses each company’s audited FY2025 full-year statements read directly from the primary filings — no aggregator data, no IFRS translation, no stub period, no reporting-currency mismatch (WCN reports in thousands of USD, mechanically converted to millions). RSG is the closest structural analogue — comparable scale relative to WM, similar route-density economics, the same integrated-disposal moat. WCN is the more differentiated of the two: smaller, more rural/exclusive-market in its footprint, and materially more acquisition-driven, which shows up later in its goodwill-and-intangible-heavy invested base and its lower ROIC. All three-way comparisons below are therefore valid; where WCN’s model specifically distorts a metric, it is flagged.
| Peer | Ticker | Exchange | Filing Type | Accounting Standard | Fiscal Year End | Comparability Note |
|---|---|---|---|---|---|---|
| Republic Services, Inc. | RSG | NYSE | 10-K | US GAAP | December | Closest structural comparable — integrated disposal model, US GAAP, aligned Dec year-end. |
| Waste Connections, Inc. | WCN | NYSE, TSX | 10-K | US GAAP | December | US-domiciled, US GAAP filer; more acquisition-led and rural — directionally comparable, model differences noted in 5.7. |
Source: Peer-company SEC filings; comparability notes in 5.7 — see Appendix A.1.
5.2 Profitability Comparison
sources Comparative: Most Recent Full Fiscal Year (FY2025)
| Metric | Waste Management, Inc. | Republic Services, Inc. | Waste Connections, Inc. |
|---|---|---|---|
| Revenue ($M) | $25,204.0M | $16,591.0M | $9,466.9M |
| EBITDA Margin | 28.5% | 30.8% | 31.1% |
| EBIT Margin | 17.1% | 19.9% | 18.1% |
| Net Margin | 10.7% | 12.9% | 11.4% |
| FCF Margin | 11.2%ᶜ | 14.5%ᶜ | 12.9%ᶜ |
Source: Peer-company SEC filings; comparability notes in 5.7 — see Appendix A.1.
Flag legend: ᵐ = market-sourced multiple (Aug-2026 price); ᶜ = analyst-computed on a consistent cross-company definition (OCF - total capex for FCF; see 5.7). Gross margin is not shown: none of the three companies prints a gross-profit line, so it is not meaningful (NM) for this service-industry income-statement structure.
The single most important fact in this section sits in this table: WM is the lowest-margin of the three companies on every operating line. Its EBIT margin trails both RSG and WCN, and its EBITDA margin sits below both. [Rating and price target withdrawn — see the note at the top.]
The analytical question is whether that gap is earned (a structural operating deficit) or induced (a temporary, explicable drag). The evidence points firmly to induced. Three comparability effects explain almost all of it. First and largest: FY2025 is WM’s first full year consolidating Stericycle, acquired in November 2024. Stericycle bolts on a regulated medical-waste and secure-information-destruction business that neither peer operates, at a structurally lower and — in FY2025 — integration-cost-depressed margin than WM’s core solid-waste franchise; it mechanically dilutes the blended margin. That same acquisition is why WM’s headline reported revenue growth dwarfs RSG’s and WCN’s far more organic growth — but that growth is bought, not earned, and must not be read as operating outperformance (see 5.7, C004). Second, landfill depletion and closure/post-closure accounting — the dominant estimate for all three — is not identical across them; WM carries the middle DD&A burden as a share of revenue, so the depreciation line is not perfectly like-for-like (C003). Third, WCN’s reported EBIT is struck after impairment charges embedded in operating income, which modestly understates its “clean” margin and flatters its year-on-year growth (C007).
Stripping those out, the residual structural gap is small. The right reading is that WM’s FY2025 margin trough is a Stericycle-integration artifact, not a permanent derating of the core network — a “show me” period rather than structural decay. As discussed in Sections 3 and 7, early FY2026 evidence supports that interpretation, with the consolidated EBITDA margin recovering and the healthcare drag narrowing toward breakeven. The investment implication is asymmetric but unproven: if the gap closes on schedule the current-year margin comparison flatters the peers unfairly; if integration stalls, the deficit starts to look structural. [Rating and price target withdrawn — see the note at the top.]
Historical: Waste Management, Inc. Own 5-Year Progression
| Metric | FY2021 | FY2022 | FY2023 | FY2024 | FY2025 |
|---|---|---|---|---|---|
| EBITDA Margin | 27.7% | 27.4% | 27.6% | 28.7% | 28.5% |
| EBIT Margin | 16.5% | 17.1% | 17.5% | 18.4% | 17.1% |
| Net Margin | 10.1% | 11.4% | 11.3% | 12.4% | 10.7% |
| FCF Margin | 13.6%ᶜ | 9.9%ᶜ | 8.9%ᶜ | 9.8%ᶜ | 11.2%ᶜ |
Source: Peer-company SEC filings; comparability notes in 5.7 — see Appendix A.1.
WM’s own five-year progression corroborates the “induced, not structural” read: the FY2025 margin sits below the level the franchise ran at before the Stericycle year, consistent with a dilution-and-integration event dropping onto an otherwise stable core rather than an erosion that was already in train. The FCF margin — shown here on the strict analyst definition of operating cash flow minus total capex, not any company’s own adjusted measure (C005) — is the lowest of the three peers in FY2025, reflecting both the margin dilution above the line and WM’s elevated growth capex below it (5.6).
5.3 Returns Comparison
sources Comparative: Most Recent Full Fiscal Year (FY2025)
| Metric | Waste Management, Inc. | Republic Services, Inc. | Waste Connections, Inc. |
|---|---|---|---|
| ROIC | 10.6%ᶜ | 10.7%ᶜ | 7.6%ᶜ |
| ROE | 29.7%ᶜ | 18.3%ᶜ | 13.4%ᶜ |
| ROA | 6.0%ᶜ | 6.4%ᶜ | 5.3%ᶜ |
| Asset Turnover | 0.55xᶜ | 0.50xᶜ | 0.46xᶜ |
Source: Peer-company SEC filings; comparability notes in 5.7 — see Appendix A.1.
On the return metric that matters most — ROIC, the return on the total capital actually deployed in the disposal network — WM and RSG are effectively tied, and both clear WM’s cost of capital of 6.36%, confirming that even in the diluted Stericycle year WM is still earning a positive economic spread on invested capital (the point). WCN sits materially below the other two on ROIC, and this is a genuine model difference rather than a comparability artifact: WCN’s aggressively acquisition-led strategy has loaded its balance sheet with goodwill and intangibles, inflating the invested-capital denominator relative to the returns it currently throws off. WM’s roughly peer-level ROIC, achieved while simultaneously absorbing a large debt-funded acquisition, is arguably the most reassuring single data point in the peer comparison — the core network is still productive.
ROE tells a very different and deliberately misleading story if taken at face value. WM’s ROE towers over both peers — but this is a capital-structure artifact, not evidence of superior operations. Two things inflate it: WM carries the highest leverage of the three (5.4), and years of aggressive buybacks have shrunk book equity, so the denominator is small. A high ROE built on financial leverage and a depleted equity base is not the same quality of return as a high ROIC, and a portfolio manager should weight the two accordingly — the ROIC comparison is the honest one, and on that measure WM is good, not exceptional. ROA and asset turnover round out the picture: WM turns its asset base slightly faster than either peer, consistent with its scale and route density, but its lower margin pulls ROA back into the middle of the pack.
Historical: Waste Management, Inc. Own 5-Year Progression
| Metric | FY2021 | FY2022 | FY2023 | FY2024 | FY2025 |
|---|---|---|---|---|---|
| ROIC | 11.2% | 12.3% | 12.2% | 11.9% | 10.6% |
| ROE | 24.9% | 32.0% | 33.5% | 36.2% | 29.7% |
| ROA | 6.2% | 7.4% | 7.2% | 7.1% | 6.0% |
Source: Peer-company SEC filings; comparability notes in 5.7 — see Appendix A.1.
WM’s own history shows ROIC dipping to a multi-year trough in FY2025 — the arithmetic of a full year of Stericycle capital in the denominator against a diluted, integration-cost-laden numerator. The spread over the 6.36% cost of capital narrowed but did not close, and the recovery of that spread as integration costs roll off is one of the concrete things the “show me” period has to deliver.
5.4 Leverage & Liquidity Comparison
sources Comparative: Most Recent Full Fiscal Year (FY2025)
| Metric | Waste Management, Inc. | Republic Services, Inc. | Waste Connections, Inc. |
|---|---|---|---|
| Net Debt / EBITDA | 3.2xᶜ | 2.6xᶜ | 3.0xᶜ |
| Total Debt / Equity | 2.3xᶜ | 1.1xᶜ | 1.1xᶜ |
| Interest Coverage | 4.7xᶜ | 5.8xᶜ | 5.1xᶜ |
| Current Ratio | 0.9xᶜ | 0.6xᶜ | 0.6xᶜ |
| FCF Margin | 11.2%ᶜ | 14.5%ᶜ | 12.9%ᶜ |
Source: Peer-company SEC filings; comparability notes in 5.7 — see Appendix A.1. Net debt is interest-bearing debt less unrestricted cash, computed identically for all three (operating leases excluded).
[Rating and price target withdrawn — see the note at the top.] The elevated debt/equity is further exaggerated by the same buyback-depleted equity base noted in 5.3 — the ratio is high partly because the denominator is small.
None of this is a solvency concern. Coverage is sound, the maturity profile is long, and the cash flows are among the most predictable in the market. But it does neutralize what was historically a WM advantage — a fortress balance sheet — and it removes the financial flexibility that a lower-levered peer retains for opportunistic M&A or accelerated buybacks. The current ratios beneath one across all three are a sector norm, not a red flag: waste companies run negative working capital by design and do not warehouse inventory. The constructive counterpoint is that deleveraging is already underway as Stericycle EBITDA consolidates for a full clean year, and management’s stated priority is to bring leverage back toward the pre-deal range — the direction of travel matters as much as the current-year snapshot, and it is another reason the leverage gap reads as a temporary “show me” rather than a permanent structural disadvantage.
5.5 Valuation Multiples Comparison
sources Comparative: Current Price (2026-08-10)
| Metric | Waste Management, Inc. | Republic Services, Inc. | Waste Connections, Inc. |
|---|---|---|---|
| EV/EBITDA | 15.8xᵐ | 15.5xᵐ | 17.2xᵐ |
| P/E | 33.8xᵐ | 31.4xᵐ | 39.9xᵐ |
| FCF Yield | 3.1%ᵐ | 3.7%ᵐ | 2.9%ᵐ |
Source: Peer-company SEC filings; comparability notes in 5.7 — see Appendix A.1.
All peer valuation multiples are market-sourced (ᵐ) on the same 2026-08-10 close. Enterprise value blends the Aug-2026 equity price with FY2025 year-end net debt from the filings (C009). Subject to change with price movements.
[Rating and price target withdrawn — see the note at the top.] Put the three sections together: WM offers the lowest margins and the highest leverage of the set, and yet it trades at essentially the same EV/EBITDA as RSG and below WCN. On the enterprise-value measure, the market is pricing WM roughly in line with the higher-quality, lower-levered RSG — which means, on this year’s fundamentals, the historical WM premium is provisionally not being earned. An investor buying WM here pays a Republic-like EV/EBITDA for a demonstrably weaker current-year margin-and-leverage profile. WCN’s higher EV/EBITDA and P/E, by contrast, are the market paying up for its cleaner organic growth and pricing power.
But “provisionally” is doing deliberate work, and the P/E line is where the nuance turns. WM’s P/E screens as expensive — but this is largely an artifact of a depressed denominator: Stericycle integration costs, the healthcare operating loss, and higher post-deal interest expense drove net income and diluted EPS down year-over-year despite the revenue surge (the earnings-decline finding flagged in Section 3). A P/E is only as meaningful as the “E” beneath it, and this year’s E is cyclically and transitionally depressed. The distinction that a portfolio manager must hold is between “expensive” and “expensive-looking”: on P/E WM looks rich, but that is a temporarily suppressed-earnings phenomenon; on the less-distortable EV/EBITDA measure WM trades roughly in the middle of its own five-year range (the historical table below), not at a stretched premium. WM is therefore expensive-looking on earnings but broadly in line with its own history on cash-flow multiples — a valuation that is full but not egregious.
[Rating and price target withdrawn — see the note at the top.]
Historical: Waste Management, Inc. EV/EBITDA (period-end price)
| FY2021 | FY2022 | FY2023 | FY2024 | FY2025 |
|---|---|---|---|---|
| 16.9x | 14.8x | 15.7x | 16.6x | 15.6x |
Source: Peer-company SEC filings; comparability notes in 5.7 — see Appendix A.1.
The five-year EV/EBITDA history confirms the point: WM’s current multiple sits inside — not above — the band it has commanded over the past half-decade. Whatever the P/E optics, the market is not currently assigning WM a stretched cash-flow multiple relative to its own trading history, which is the strongest single argument against treating the stock as outright expensive.
5.6 Efficiency Comparison
| Metric | Waste Management, Inc. | Republic Services, Inc. | Waste Connections, Inc. |
|---|---|---|---|
| Days Sales Outstanding | 49 daysᶜ | 42 daysᶜ | 40 daysᶜ |
| Days Inventory Outstanding | NM | NM | NM |
| Days Payables Outstanding | 48 daysᶜ | 52 daysᶜ | 51 daysᶜ |
| Cash Conversion Cycle | NM | NM | NM |
| CapEx / Revenue | 12.8%ᶜ | 11.4%ᶜ | 12.6%ᶜ |
Source: Peer-company SEC filings; comparability notes in 5.7 — see Appendix A.1. Days inventory and the cash-conversion cycle are NM (not meaningful): none of the three carries meaningful inventory in a waste-services model (C008).
The efficiency comparison surfaces one genuine, actionable watch item. WM’s days-sales-outstanding is the highest of the three by a clear margin — it collects noticeably more slowly than either RSG or WCN. This is not a permanent structural feature of WM’s model; it ties directly to the Stericycle billing-and-collection integration problems disclosed in the filing (the “data and system conversion” issues flagged in Section 2). Elongated DSO ties up working capital and depresses cash conversion, and it is a concrete, measurable proxy for how the integration is actually going: if WM is executing, DSO should compress back toward the peer range over the coming quarters; if it does not, it signals the integration is running behind. It belongs on the watch list precisely because it is quantifiable and near-term.
On payables, WM’s DPO is the lowest of the three, though part of that apparent gap is a classification artifact rather than a genuine efficiency difference: RSG breaks landfill accretion out as a separate income-statement line, which lowers its operating-cost base and mechanically lifts its DPO relative to WM and WCN, both of which embed accretion inside cost of operations (C001). On capital intensity, all three are heavy spenders and broadly similar; WM runs at the top of the range, reflecting not asset-base weakness but discretionary growth investment in renewable-natural-gas and recycling capacity disclosed in its MD&A (C006). Only WCN isolates a growth-capex line on the face of its cash-flow statement, so a clean maintenance-only comparison is not available from the statements alone — WM’s elevated capex should be read as partly growth-optional, not purely maintenance.
5.7 Comparability Caveats
sources This peer comparison is, by the standards of cross-company benchmarking, unusually clean — but it is not caveat-free, and the credibility of every table above depends on the reader carrying these adjustments. The material issues, in order of impact on interpretation:
Fiscal-period and accounting alignment is a genuine strength (C002, informational). All three companies have a December 31 year-end, all report FY2025 audited full-year figures under US GAAP in USD, and all figures are read from the primary 10-Ks. There is no period lag, no stub period, no stale data, and no IFRS-translation or currency issue anywhere in the set. This is a comp table the reader can trust on timing — a real strength, not a caveat, and worth stating explicitly because it is rare.
The Stericycle distortion of WM’s figures (C004, material — affects WM). WM’s FY2025 is its first full year consolidating Stericycle, and this distorts three headline comparisons. (1) WM’s double-digit reported revenue growth is overwhelmingly acquisition-driven and must not be compared to RSG’s or WCN’s far more organic growth; WM’s underlying organic growth is a low-single-digit figure buried inside the reported number. (2) Stericycle adds a regulated healthcare/secure-destruction business the peers do not operate, changing WM’s mix and diluting its solid-waste margin profile — part of why WM’s EBITDA margin screens below both peers is mix and integration cost, not pure operating underperformance. (3) The debt-funded deal is the primary reason WM is the most levered of the three. Every WM-versus-peer gap in growth, margin, and leverage should be read through this lens.
Free-cash-flow figures are analyst-computed, not company-reported (C005, material — affects all three). Each company reports its own non-GAAP free-cash-flow measure on a different definition — WM’s, for example, adds back divestiture proceeds; the peers use their own adjustments. Those reported numbers are not comparable to one another. Every FCF and FCF-yield figure in this section is instead computed identically as operating cash flow minus total capital expenditure. This is a stricter, consistent basis and will differ from each company’s own headline “free cash flow.” Do not quote the three companies’ reported FCF figures side by side.
Landfill depletion and asset-retirement accounting is company-specific (C003, material — affects all three). Landfill airspace amortization and the discount/inflation assumptions behind closure and post-closure obligations are the dominant accounting estimate for all three and are not identical across them, which makes reported depreciation and operating margins less perfectly comparable than the headline percentages suggest. Measured consistently, DD&A as a share of revenue is meaningfully different across the three — WCN carries the heaviest burden, reflecting heavy landfill depreciation plus large acquisition-related intangible amortization. EBITDA is defined consistently here as operating income plus DD&A (accretion not added back) for all three.
No gross margin; no inventory metrics (C001 and C008, material/informational — affects all three). None of the three prints a gross-profit line — all use the same service-industry structure of a single operating-cost line with DD&A and SG&A shown separately — so gross margin is reported NM and EBIT/EBITDA-margin comparisons are the clean profitability measures. One residual wrinkle: RSG breaks landfill accretion out as a separate income-statement line, whereas WM and WCN embed it in operating costs, which very slightly flatters RSG’s cost efficiency and its DPO. Separately, days-inventory-outstanding and the cash-conversion cycle are NM for all three — a waste-collection-and-disposal model carries no meaningful inventory. DSO and DPO remain meaningful and are shown.
WCN’s reported operating income carries impairment charges (C007, informational — affects WCN). WCN’s FY2025 operating income is struck after impairments and other operating charges, with a much larger equivalent charge in FY2024. Consequently WCN’s reported EBIT margin is modestly understated versus an adjusted basis, and — because the prior-year base was depressed by the larger charge — WCN’s headline year-on-year earnings growth is flattered. WCN is shown as-reported, consistent with WM and RSG.
Capex maintenance/growth split is unevenly disclosed (C006, informational — affects all three). All three are capital-heavy with similar capex/revenue ratios. Only WCN isolates a growth-capex line (undeveloped-landfill spend) on the face of its cash-flow statement; WM and RSG discuss growth investment (renewable-natural-gas and recycling at WM; fleet and landfill development at RSG) in MD&A but do not split it on the statements. A clean maintenance-only capex comparison is therefore not possible from the filings alone, and WM’s top-of-range spend partly reflects optional growth investment.
All valuation multiples are market-sourced (C009, informational — affects all three). EV/EBITDA, EV/Revenue, P/E, and FCF yield use the 2026-08-10 closing price for all three companies, taken on the same date. Enterprise value blends that August-2026 equity price with December-2025 year-end net debt from the filings — standard for a comp table, but noted. Only the hard operating figures beneath the multiples come from the primary 10-Ks; the multiples themselves move with the market and should be treated as a point-in-time snapshot.
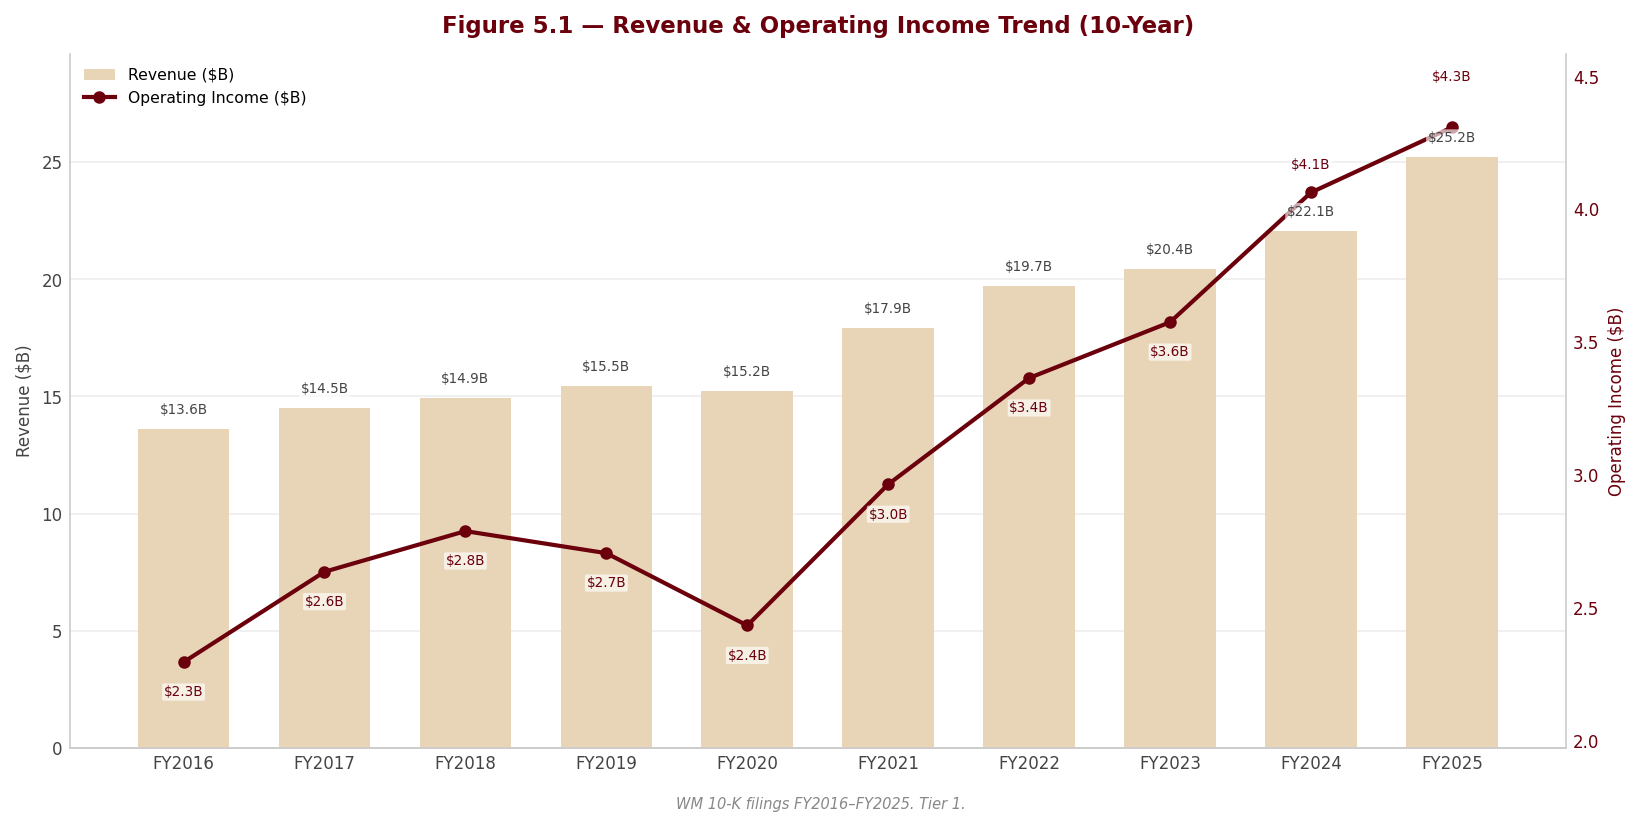
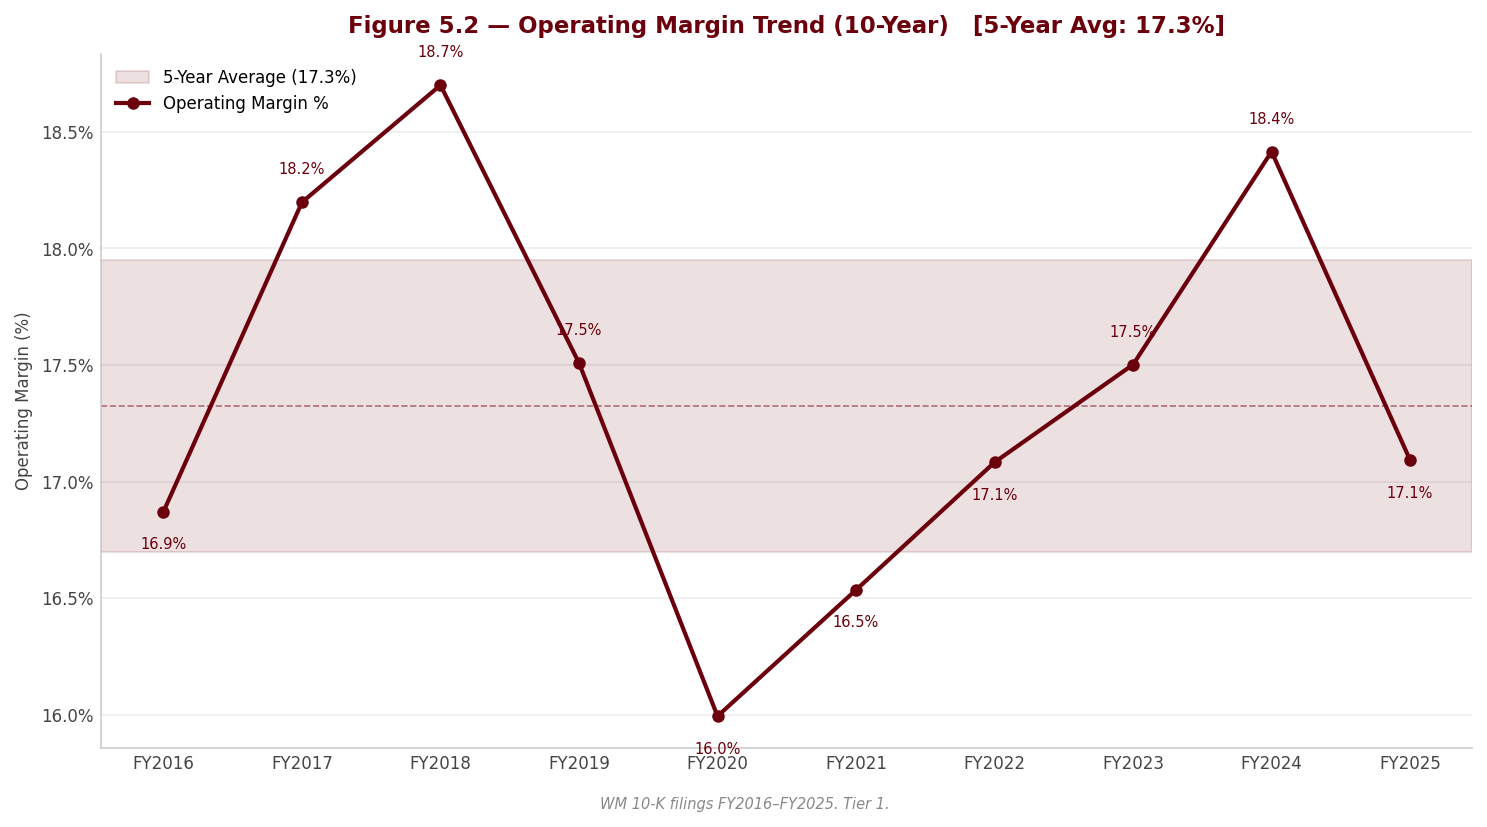
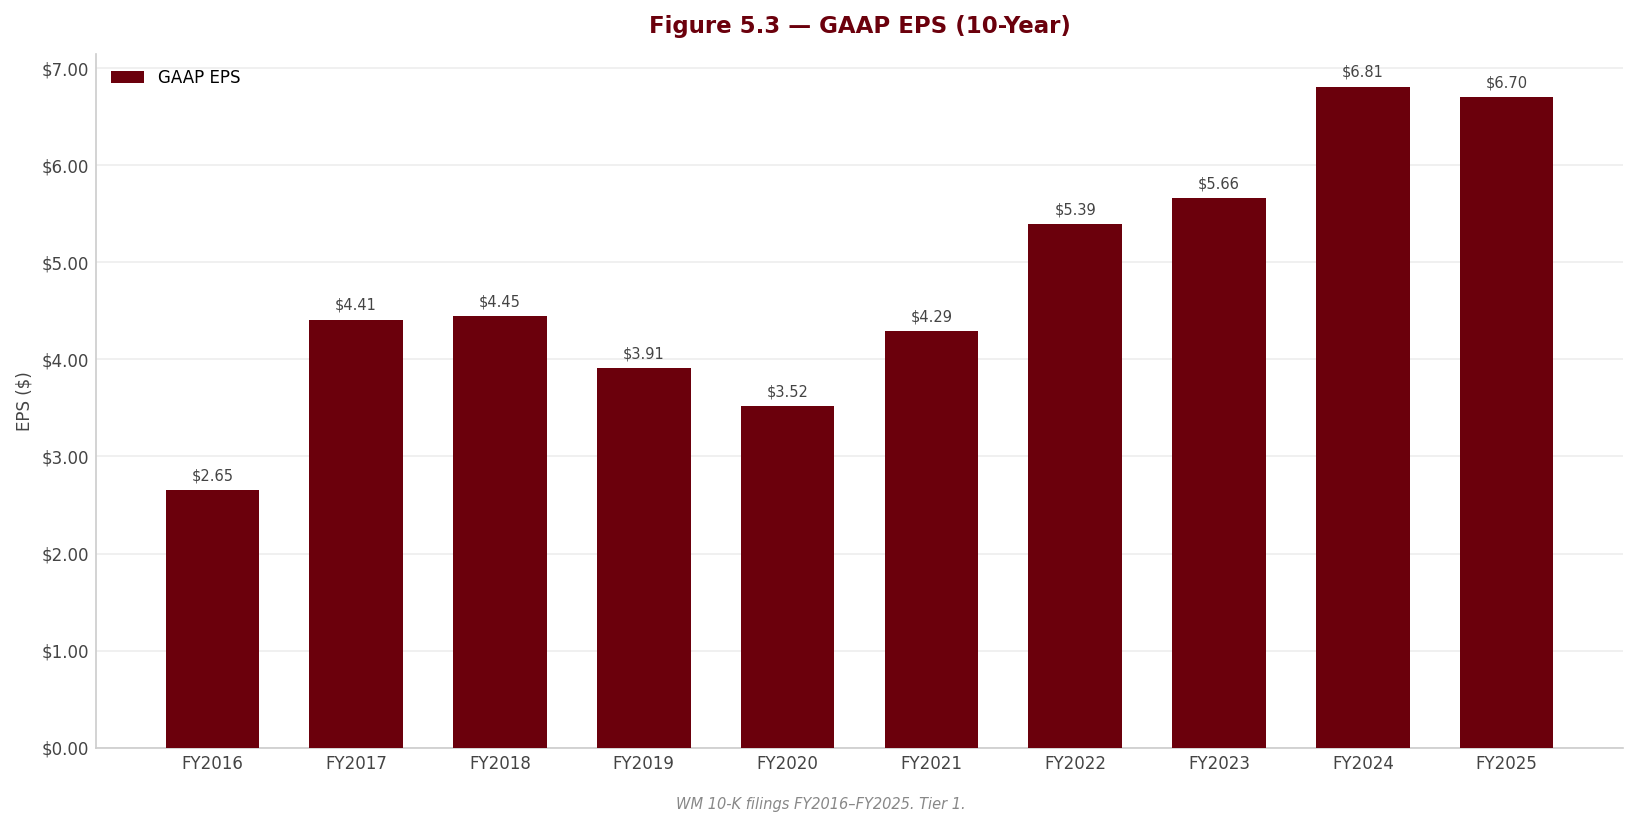
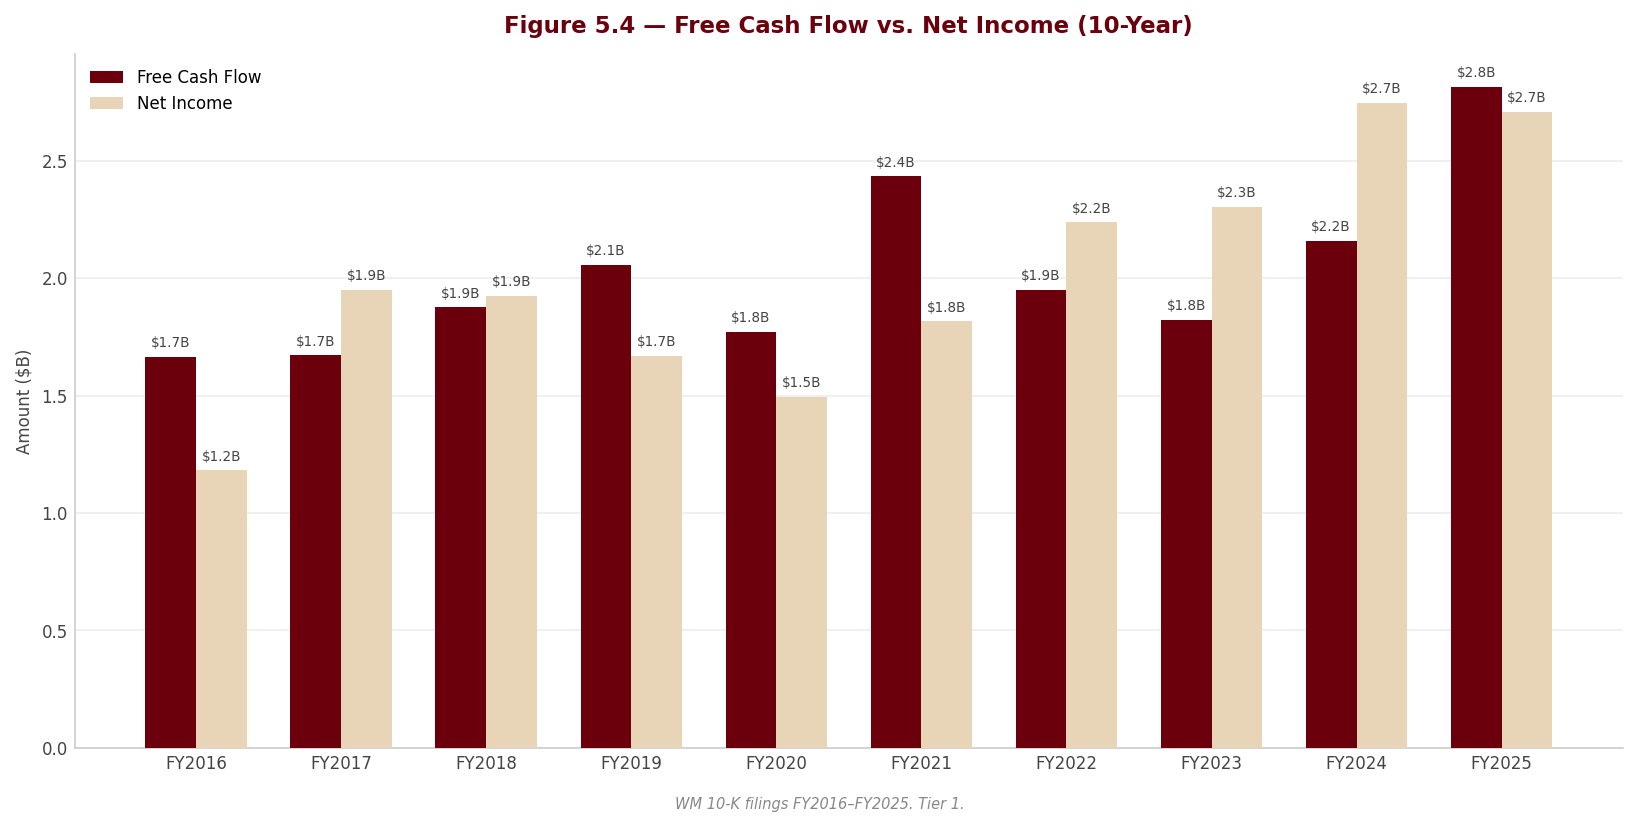
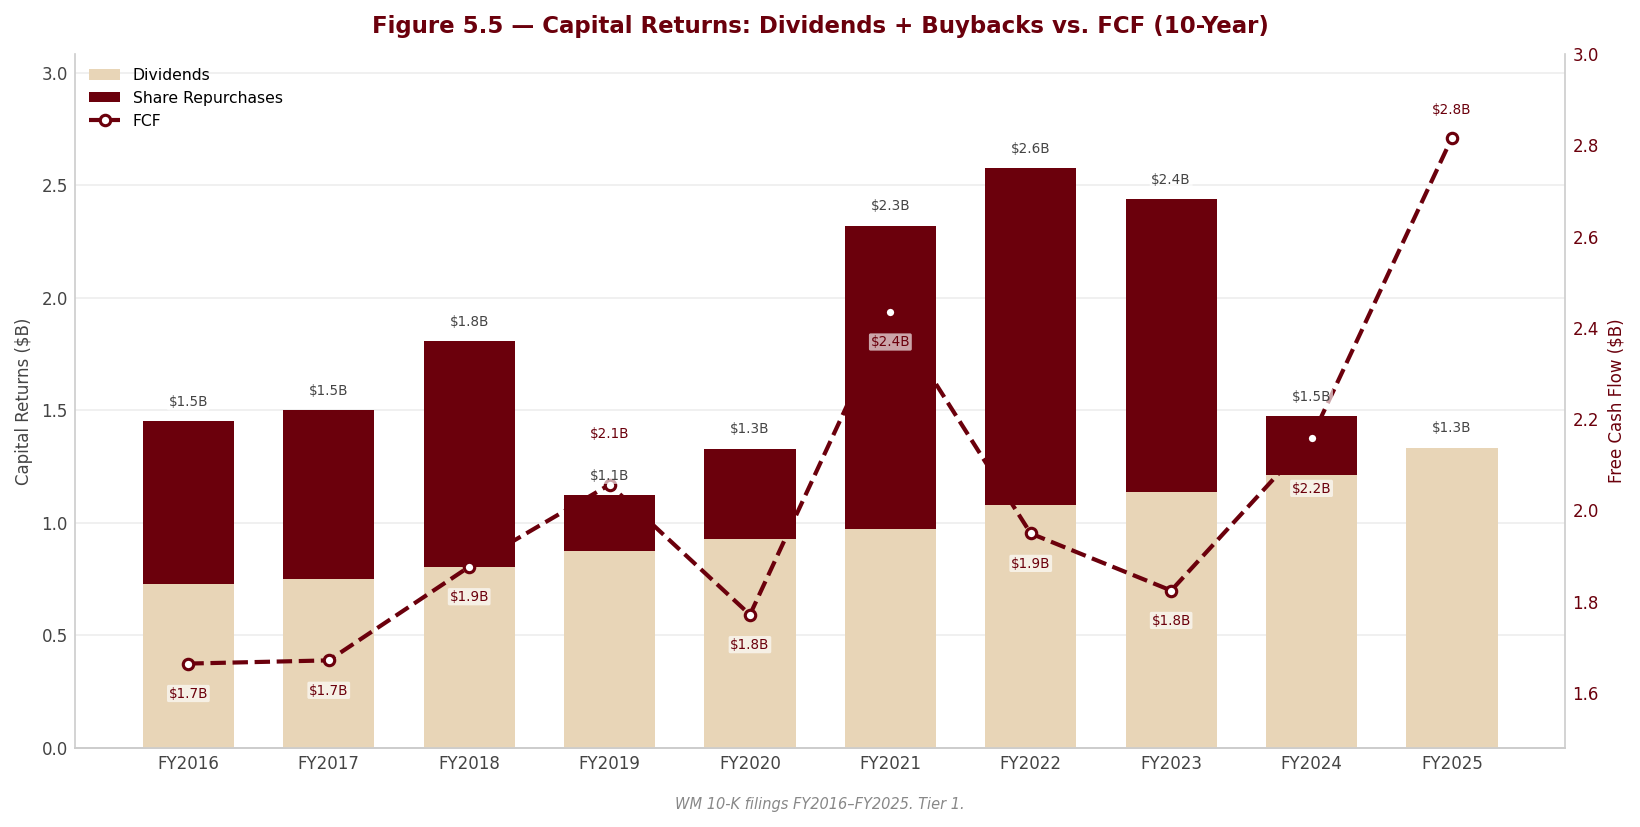
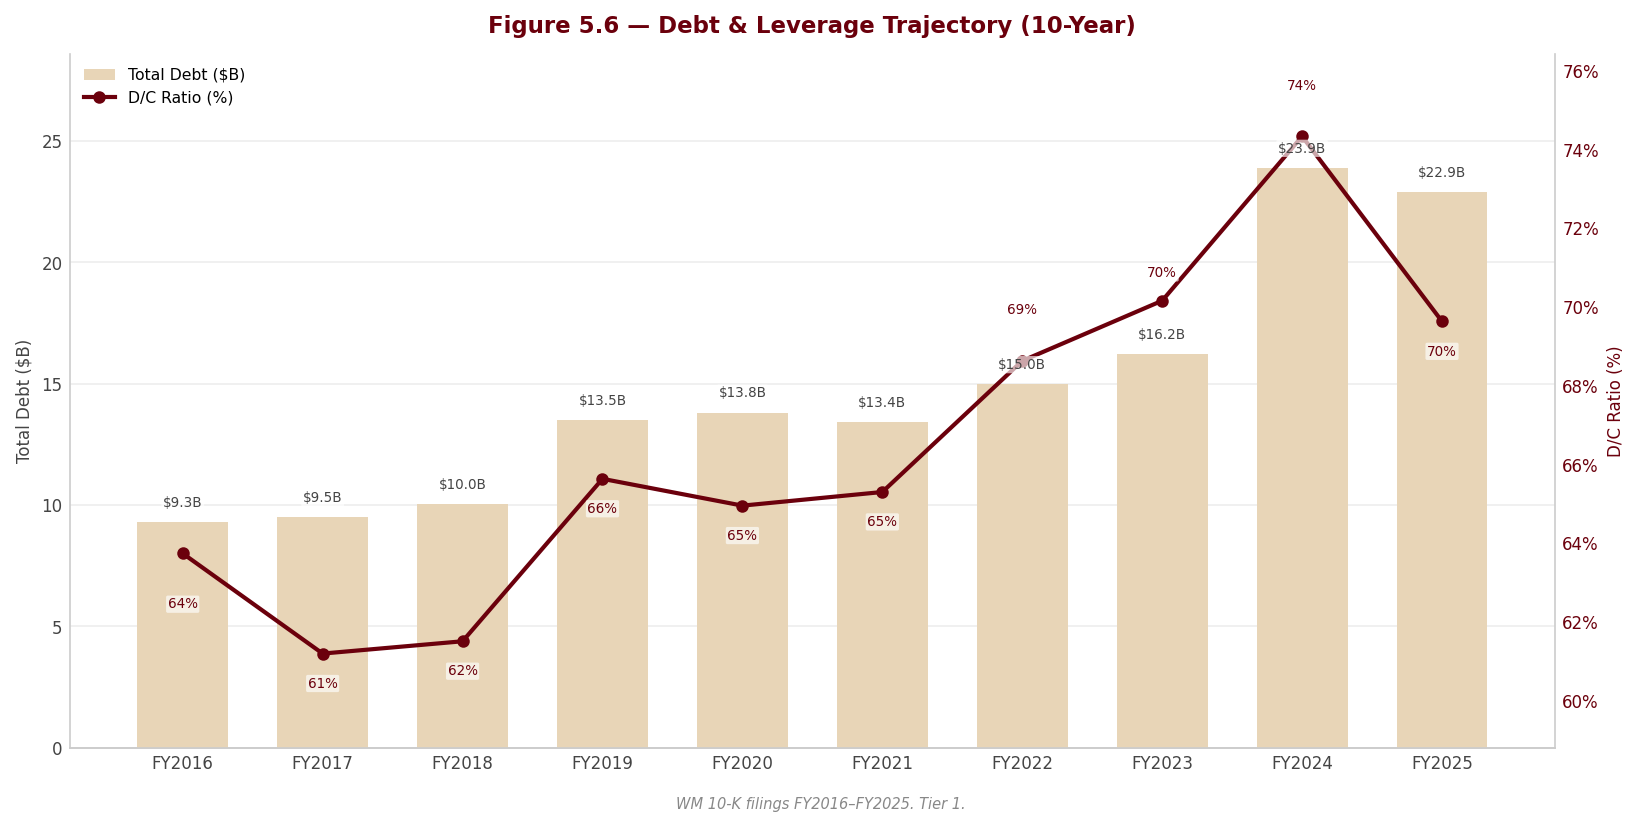
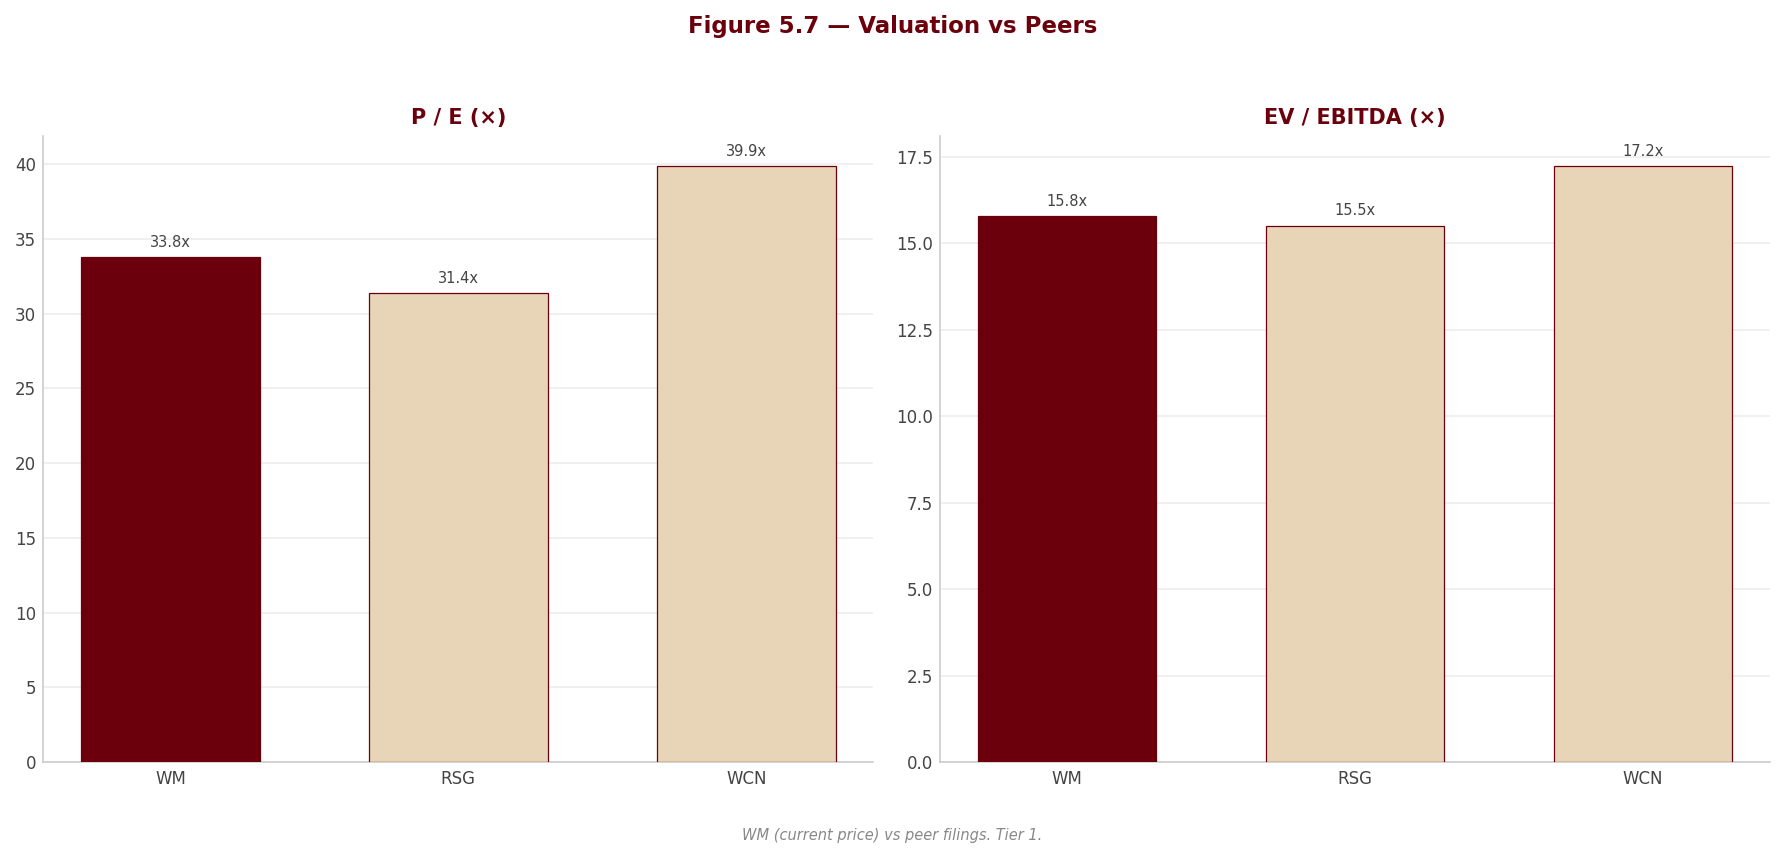
6. Valuation & Price Target withdrawn
This section stated what the shares were worth and what to do about them. It rested on an exit multiple set by hand — across the coverage it averaged 24% below where each company actually traded — so the conclusion largely restated that assumption instead of testing it. Rather than leave it standing, it has been withdrawn while the method is rebuilt.
Nothing else in this report depends on it: the financial analysis above and below is drawn from the company's own filings, and every figure links to the page it was verified against.
Section 7 — Quarterly Update: Q2 2026
Portfolio Action
[Rating and price target withdrawn — see the note at the top.]
| Assessment | |
|---|---|
| Action | [Rating and price target withdrawn — see the note at the top.] |
| Reason | EBIT margin reached 18.7% in Q2 2026 ($1,253.0M on $6,684.0M) against 17.9% in Q2 2025 — the recovery is real, but 0.60 pp of the 0.85 pp gain came from SG&A (10.2% of revenue vs 10.8%), while the operating-cost ratio was fractionally worse at 59.2% vs 59.1% (10-Q pp. 51, 53). |
| Thesis intact? | [Rating and price target withdrawn — see the note at the top.] |
| Trigger to revisit | [Rating and price target withdrawn — see the note at the top.] |
Source: FL analysis of WM 10q q2 2026.pdf (quarter ended 30 June 2026) and the FL valuation model; see Sections 2 and 6 and Appendix A.1.
7.1 Results at a Glance
| Metric | Q2 2026 | Q2 2025 | YoY Δ | Q1 2026 | QoQ Δᶜ |
|---|---|---|---|---|---|
| Revenue ($M) | $6,684.0M | $6,430.0M | +4.0% | $6,227.0M | +7.3% |
| Gross Profit ($M)ᵃ | $2,729.0M | $2,591.0M | +5.3% | $2,533.0M | +7.7% |
| Gross Marginᵃ | 40.8% | 40.3% | +0.5 ppᵇ | 40.7% | +0.2 pp |
| EBITDA ($M) | $2,030.0M | $1,859.0M | +9.2% | $1,848.0M | +9.8% |
| EBITDA Margin | 30.4% | 28.9% | +1.5 ppᵇ | 29.7% | +0.7 pp |
| EBIT ($M) | $1,253.0M | $1,151.0M | +8.9% | $1,113.0M | +12.6% |
| EBIT Margin | 18.7% | 17.9% | +0.8 pp | 17.9% | +0.9 pp |
| Net Income ($M) | $785.0M | $726.0M | +8.1% | $723.0M | +8.6% |
| Net Margin | 11.7% | 11.3% | +0.5 pp | 11.6% | +0.1 pp |
| Diluted EPS | $1.95 | $1.80 | +8.3% | $1.79 | +8.9% |
YoY change is computed as (CQ - PYSQ) / |PYSQ| × 100 — e.g. revenue (6,684 - 6,430) / 6,430 × 100 = +4.0%. QoQ change is computed as (CQ - PQ) / |PQ| × 100 — e.g. revenue (6,684 - 6,227) / 6,227 × 100 = +7.3%. Margins are computed as line / revenue × 100 — e.g. gross margin 2,729 / 6,684 × 100 = 40.8%, EBITDA margin 2,030 / 6,684 × 100 = 30.4%, EBIT margin 1,253 / 6,684 × 100 = 18.7%, net margin 785 / 6,684 × 100 = 11.7%. Margin deltas are stated in percentage points (CQ margin - comparator margin).
ᵃ WM does not report a gross profit line. Gross profit here is revenue less operating (cost-of-operations) expenses only, and gross margin is that figure over revenue; SG&A, depreciation/depletion/amortization/accretion, restructuring and divestiture items sit below it (10-Q p. 4). ᵇ Basis caution — the reported gross-margin and EBITDA-margin gains overstate the like-for-like improvement. In this filing WM reclassified interest accretion on landfill and environmental remediation liabilities out of operating expenses and into depreciation, depletion, amortization and accretion, and recast the prior year (10-Q p. 10). The Q2 2025 column above is on the pre-reclassification basis (operating $3,839M, D&A $708M); on the current presentation Q2 2025 operating expense was $3,803M and DD&A $744M (10-Q pp. 4, 55, accretion of $36M). Restated like-for-like, Q2 2025 gross margin was 40.9% — so gross margin was flat, not up 0.5 pp — and Q2 2025 EBITDA margin was 29.5%, so the EBITDA-margin gain is +0.9 pp, not +1.5 pp. EBIT margin, net margin and EPS are unaffected by the reclassification. ᶜ Q2 is seasonally the stronger half of the QoQ comparison: WM states revenues and volumes rise seasonally in the summer months reflected in second- and third-quarter results (10-Q pp. 31, 64). The QoQ column should be read with that in mind.
Source: WM 10q q2 2026.pdf, Condensed Consolidated Statements of Operations (PDF p. 4); WM_Portfolio.xlsx Data sheet quarterly columns. All page references in this section are to the PDF page of WM 10q q2 2026.pdf.
7.2 P&L Drivers
sources Revenue: The $6,684.0M top line grew $254M (+4.0%) YoY, and the 10-Q’s own bridge shows the growth was almost entirely price, not volume: total average yield contributed +$277M (+4.3%), volume was negative at -$22M (-0.3%), Healthcare Solutions cost a further -$30M (-0.5%), acquisitions added +$33M and divestitures -$5M (10-Q p. 47). Critically, $102M of that yield — 40% of the entire revenue increase — is the energy surcharge and mandated fees, driven by an approximate 50% rise in diesel prices, which is a pass-through matched on the cost side (10-Q p. 49). The durable number is Collection and Disposal average yield of +$181M, or +3.6% on the related business (commercial +4.0%, industrial +3.4%, residential +6.1%, landfill +2.5%, transfer +3.6%), with municipal solid waste landfill yield at 5.2% (10-Q p. 49); recycled-commodity and Renewable Energy yield went the other way at -$6M as single-stream prices fell about 10% YoY (10-Q pp. 47, 49).
Cost and margin: Operating cost was $3,955.0M in Q2 2026 versus $3,839.0M in Q2 2025, but on the filing’s own restated basis the comparison is $3,955M vs $3,803M — 59.2% of revenue vs 59.1%, i.e. the operating-cost ratio was 3 bps worse, with fuel up to $171M from $129M and subcontractor costs up to $689M from $631M offsetting labour discipline (labour 17.2% of revenue vs 17.6%) (10-Q p. 51). The margin gain came from elsewhere: SG&A fell to $683M (10.2% of revenue) from $696M (10.8%) as Stericycle integration consulting rolled off (professional fees $90M vs $106M), worth -0.60 pp, partly given back by a bad-debt provision that rose to $40M from $24M (10-Q p. 53); restructuring fell to $6M from $12M and the divestiture/impairment line to a $10M charge from $24M — together another -0.32 pp of pure non-repeat (10-Q p. 4). D&A was $777.0M against $708.0M, but like-for-like $777M vs $744M — 11.6% of revenue in both quarters — as higher depreciation on 2025–26 sustainability assets ($412M vs $386M) and East Tier depletion revisions ($230M vs $220M) offset lower intangible amortization ($96M vs $102M) (10-Q p. 55). This is the analytically important point for the thesis: the +0.85 pp EBIT-margin gain is roughly three-quarters overhead synergy and prior-year charges that did not repeat, and essentially none of it is field operating leverage.
[Rating and price target withdrawn — see the note at the top.] Diluted EPS of $1.95 was up $0.15, or +8.3%, YoY and $0.16, or +8.9%, QoQ — running ahead of the +8.1% net-income growth because the diluted share count fell to 402.4M from 404.3M on the resumed buyback (10-Q p. 17).
Source: WM 10q q2 2026.pdf, MD&A Results of Operations (PDF pp. 43–59) and Condensed Consolidated Statements of Operations (PDF p. 4).
7.3 Balance Sheet & Cash Flow
| Metric | Q2 2026 | Q2 2025 | YoY Δ | Q1 2026 | QoQ Δ |
|---|---|---|---|---|---|
| Cash ($M) | $557.0M | $440.0M | +26.6% | $158.0M | +252.5% |
| Net Debt ($M) | $22,799.0M | $23,580.0M | -3.3% | $22,733.0M | +0.3% |
| Net Debt / LTM EBITDA | 3.0×ᵈ | 3.5× | -0.5× | 3.1× | -0.1× |
| Total Assets ($M) | $46,441.0M | $45,722.0M | +1.6% | $45,700.0M | +1.6% |
| Equity ($M) | $9,925.0M | $9,201.0M | +7.9% | $10,021.0M | -1.0% |
| OCF ($M) | $1,726.0M | $1,545.0M | +11.7% | $1,501.0M | +15.0% |
| CapEx ($M)ᵉ | $630.0M | $732.0M | -13.9% | $650.0M | -3.1% |
| FCF ($M)ᶠ | $1,096.0M | $813.0M | +34.8% | $851.0M | +28.8% |
| Dividends Paid ($M)ᵉ | $379.0M | $333.0M | +13.8% | $385.0M | -1.6% |
YoY and QoQ percentages use the same formulas as 7.1 — e.g. FCF YoY (1,096 - 813) / 813 × 100 = +34.8%; FCF QoQ (1,096 - 851) / 851 × 100 = +28.8%.
ᵈ Net Debt / LTM EBITDA derivation. LTM EBITDA to Q2 2026 = Q3 2025 $1,718M + Q4 2025 $1,925M + Q1 2026 $1,848M + Q2 2026 $2,030M = $7,521M; leverage = $22,799M / $7,521M = 3.03×. Q1 2026 comparator: Q2 2025 $1,859M + Q3 2025 $1,718M + Q4 2025 $1,925M + Q1 2026 $1,848M = $7,350M; $22,733M / $7,350M = 3.09×. Q2 2025 comparator: Q3 2024 $1,677M + Q4 2024 $1,571M + Q1 2025 $1,669M + Q2 2025 $1,859M = $6,776M; $23,580M / $6,776M = 3.48× — a base that carries only about two months of Stericycle EBITDA, which is why the ratio was so elevated. The two FY2025 quarters in the current LTM window are on the pre-reclassification basis (footnote ᵇ); restating them would add roughly $75M to LTM EBITDA and take leverage to about 3.00×. Quarterly EBITDA inputs are from WM_Portfolio.xlsx Data sheet row 20 (quarterly columns), each derived as EBIT + D&A.
ᵉ CapEx and dividends are stored as positive magnitudes in the workbook; both are cash outflows ($630M of capital expenditures paid and $379M of dividends paid in Q2 2026).
ᶠ FCF here is OCF less CapEx (1,726 - 630 = 1,096). WM’s own non-GAAP free cash flow adds proceeds from divestitures and was $1,104M for Q2 2026 versus $818M for Q2 2025 (10-Q p. 64) — the $8M difference is divestiture proceeds, not a definitional dispute.
Source: WM 10q q2 2026.pdf, Condensed Consolidated Balance Sheets (PDF p. 3), Condensed Consolidated Statements of Cash Flows (PDF p. 5), free-cash-flow reconciliation (PDF p. 64); WM_Portfolio.xlsx Data sheet quarterly columns.
Balance sheet note: Cash rose to $557.0M from $158.0M at Q1 2026 (+252.5%) almost entirely because WM pre-funded the July 2026 Canadian redemption: in June it issued C$700M (US$493M) of 3.944% notes due 2033 while the C$500M 2.60% notes it retired ($352M) remained on the balance sheet at 30 June, temporarily inflating both cash and debt (10-Q pp. 13–14). Net debt was therefore essentially unchanged QoQ at $22,799.0M versus $22,733.0M (+0.3%), and equity fell 1.0% QoQ to $9,925.0M despite $785M of net income, because $671M of buybacks and $379M of dividends declared exceeded earnings (10-Q p. 6) — the point Section 2 makes about deleveraging coming from EBITDA growth rather than debt reduction is confirmed again this quarter: net debt is down only 3.3% YoY while the leverage ratio fell 0.5 turns.
Cash flow note: FCF conversion = FCF / Net Income = 1,096 / 785 × 100 = 139.6%, up from 112.0% in Q2 2025 — cash comfortably outran earnings. OCF of $1,726.0M grew 11.7% YoY on higher Collection and Disposal earnings, favourable working capital and lower cash taxes (10-Q p. 43), while CapEx of $630.0M fell 13.9% YoY with sustainability-growth capital more than halving to $75M from $160M as the build-out moves from construction to harvest (10-Q p. 64); capex intensity fell to 9.4% of revenue from 11.4%. The receivables line remains the one to watch: H1 receivables consumed $224M of operating cash and the bad-debt provision rose to $69M from $43M (10-Q pp. 5, 53), so the Stericycle billing friction flagged in Section 2 is improving but not closed.
7.4 Footnote Review
sources Every note in the Q2 2026 10-Q was read. Page references are to the PDF page of WM 10q q2 2026.pdf.
Note 1 — Basis of Presentation (10-Q pp. 8–12) Confirms the five reportable segments (East Tier, West Tier, Recycling Processing and Sales, Renewable Energy, Healthcare Solutions), with East Tier, West Tier and Other Ancillary together forming the Collection and Disposal business and everything else in Corporate and Other (p. 8). Two changes versus Q2 2025 matter. First, the reclassification of interest accretion on landfill and environmental remediation liabilities from operating expenses into DD&A, with prior periods recast (p. 10) — described as “not material” by WM, and it is EBIT-neutral, but as footnote ᵇ shows it moves $36M a quarter and manufactures the entire apparent gross-margin gain, so any margin series spanning the change must be rebased. Second, WM adopted ASU 2025-05 (credit losses on receivables) prospectively in Q1 2026, electing the practical expedient, with no material impact (p. 12) — noted because it changes the estimation basis for exactly the receivables line that is under stress. Deferred contract acquisition costs were $230M at 30 June 2026 versus $237M at 31 December 2025 (p. 10), a slight decline; not a thesis item.
Note 2 — Landfill and Environmental Remediation Liabilities (10-Q p. 12) Total liability $3,569M at 30 June 2026 versus $3,536M at 31 December 2025 (landfill $3,339M vs $3,305M; remediation $230M vs $231M). The H1 roll-forward shows obligations incurred and capitalized $45M, obligations settled $(66)M landfill and $(14)M remediation, interest accretion $78M, and revisions in estimates of $(20)M on landfill and +$13M on remediation. Analytically this is the Section 2 Risk 4 estimate at work: the revisions are small this half — no repeat of the material FY2025 upward revision — but the same East Tier landfill estimate revisions lifted depletion to $230M in the quarter from $220M (p. 55). Direction is neutral; the sensitivity is unchanged.
Note 3 — Debt (10-Q pp. 13–15) Total debt $23,356M versus $22,907M at 31 December 2025. [Rating and price target withdrawn — see the note at the top.] Approximately $3.8bn matures within 12 months, of which $2.7bn is classified long-term on the strength of intent and ability to refinance under the $3.5bn revolver maturing May 2029; that revolver had no outstanding borrowings, $226M of letters of credit and $2.2bn of unused capacity at 30 June 2026, plus $944M drawn on other uncommitted letter-of-credit lines (p. 14). No covenant level and no actual covenant ratio are disclosed anywhere in this 10-Q — the “no numeric headroom” gap flagged in Section 2 Risk 2 is not closed by this filing, and readers cannot verify the cushion. The refinancing itself is a modest negative on cost (2.60% out, 3.944% in) but pushes the maturity to 2033.
Note 4 — Income Taxes (10-Q p. 16) [Rating and price target withdrawn — see the note at the top.] RNG investment tax credits reduced tax expense by $29M in Q2 2026 versus $43M in Q2 2025 (H1 $53M versus $89M) — a $14M quarterly erosion. [Rating and price target withdrawn — see the note at the top.] Low-income housing: $26M of ASU 2023-02 amortization expense (versus $25M), $35M of credits (versus $35M) and $7M of associated interest expense (versus $8M) — effectively unchanged. Management expects cumulative Section 48 benefit of $400–425M, with $309M already taken in 2023–25 and the remainder in 2026–27, and up to $150M cumulative from Section 45Z through 2029 (p. 59). [Rating and price target withdrawn — see the note at the top.]
Note 5 — Earnings Per Share (10-Q p. 17) Weighted-average diluted shares 402.4M for Q2 2026 versus 404.3M for Q2 2025 (basic 401.5M versus 402.6M); dilutive effect of equity awards 0.9M versus 1.7M; anti-dilutive shares excluded 1.5M versus 0.9M. The 0.5% reduction in the diluted count is the buyback beginning to work and explains why EPS growth (+8.3%) outran net-income growth (+8.1%).
Note 6 — Commitments and Contingencies (10-Q pp. 17–25) Covered in full under Contingencies and litigation below.
Note 7 — Segment and Related Information (10-Q pp. 25–33) The quarter’s most important disclosure. Income from operations by reportable segment, Q2 2026 versus Q2 2025 (p. 57): Collection and Disposal $1,550M vs $1,461M (+6.1%) — within it East Tier $784M vs $721M (+8.7%), West Tier $761M vs $757M (+0.5%, held back by the non-repeat of prior-year wildfire clean-up work) and Other Ancillary $5M vs $(17)M, these three being the constituents of the Collection and Disposal business rather than peers of the other segments; Recycling Processing and Sales $36M vs $24M (+50.0%); Renewable Energy $47M vs $38M (+23.7%); Healthcare Solutions $2M vs $(23)M — its first positive operating quarter; and Corporate and Other $(382)M vs $(349)M, a $33M deterioration on technology, risk-management and wage costs. Segment revenue (net): Collection and Disposal $5,479M vs $5,281M, Recycling $403M vs $381M, Renewable Energy $157M vs $115M, Healthcare Solutions $638M vs $646M (-1.2%), Corporate and Other $7M vs $7M (pp. 25, 30). Segment total assets show Healthcare Solutions at $8,758M, down from $9,002M at 31 December 2025, with no impairment behind the decline (p. 29). Two prior-period presentation changes remain live: the Q3 2025 introduction of intra-segment activity inside Healthcare Solutions, recast into 2025 comparatives ($101M of intra-segment revenue and expense in Q2 2026 versus $113M in Q2 2025, p. 29), and the intercompany royalty and service arrangements described under Related-party transactions below. Analytical significance: Healthcare Solutions turned profitable on falling revenue, so the improvement is cost and synergy, not demand — good for the goodwill risk, weak as evidence of franchise value.
Note 8 — Acquisitions and Divestitures (10-Q p. 33) H1 2026 solid-waste acquisitions totalled $235M of consideration: $144M in common stock issued from treasury, $85M net cash and $6M of holdbacks, plus $13M of prior-year holdbacks paid. Allocation: $27M property and equipment, $75M intangibles (mainly customer relationships) and $138M goodwill, substantially none tax-deductible; the measurement period is open. This is materially smaller than H1 2025 ($366M of cash acquisitions) and, notably, WM paid in stock at a time it was simultaneously repurchasing stock — the shares issued (632 thousand from treasury, p. 6) are a fraction of the 4.5 million repurchased, so it is not a contradiction of the buyback, but it is worth flagging. Divestiture proceeds were $77M in H1 2026 versus $103M in H1 2025.
Note 9 — (Gain) Loss from Divestitures, Asset Impairments and Unusual Items, Net (10-Q p. 33) Q2 2026: not material (the income statement carries a $10M net charge, p. 4). H1 2026: a $34M gain on a West Tier business divestiture, offset by immaterial legal and remediation charges, netting to a $16M gain. Q2 and H1 2025: primarily a $16M goodwill impairment on an oil-recovery and sludge-processing business inside Other Ancillary. [Rating and price target withdrawn — see the note at the top.]
Note 10 — Accumulated Other Comprehensive Income (Loss) (10-Q p. 34) AOCI moved to $(71)M at 30 June 2026 from $(10)M at 31 December 2025, driven by a $(58)M foreign-currency translation loss in H1 (derivatives $(3)M, available-for-sale securities nil, post-retirement nil). Read against Q2 2025, when the quarter produced +$96M of other comprehensive income including +$100M of FX translation, this is a $123M swing in comprehensive income and is why comprehensive income of $758M this quarter is below the $822M of Q2 2025 despite higher net income. Non-cash, no thesis impact, but it explains an otherwise confusing comparison.
Note 11 — Common Stock Repurchase Program (10-Q p. 34) WM repurchased 3.0 million shares for $671M in Q2 2026 at a weighted-average $223.94, and 4.5 million shares for $1.0bn in H1 at $227.89, under the $3.0bn authorization announced in December 2025; $2.0bn of authorization remains. Versus Q2 2025 the change is absolute: there were no repurchases at all in 2025 (p. 63). The monthly detail (p. 67) shows April 0.9M at $231.02, May 0.8M at $221.12 and June 1.3M at $220.96 — management bought more as the price fell. The average price paid sits close to our $222.41 target, which is the honest frame for the buyback: it is a credible signal of management’s comfort with leverage and an EPS support, but it is not value-accretive repurchase at a discount to appraised value.
Note 12 — Fair Value Measurements (10-Q pp. 34–36) Recurring fair-value assets $1,186M versus $707M at 31 December 2025 — Level 1 cash equivalents and money-market funds $424M (from $91M) and equity securities $92M, Level 2 available-for-sale securities $670M (from $528M); the increase reflects the June debt pre-funding and captive-insurance portfolio shifts, not a change in valuation technique. [Rating and price target withdrawn — see the note at the top.] Level 2 inputs; unchanged methodology.
Note 13 — Variable Interest Entities (10-Q p. 36) Unconsolidated low-income housing investments $577M (from $624M) with associated debt $565M (from $616M); unconsolidated capping/closure/remediation trusts carried at $133M (from $127M); consolidated trusts recorded in restricted funds at $144M fair value (from $140M). All amounts declining or stable versus 31 December 2025 and consistent with Note 4’s tax-credit amortization. [Rating and price target withdrawn — see the note at the top.]
Goodwill and the Healthcare Solutions impairment watch (10-Q pp. 3, 29, 33, 64) This filing contains no goodwill footnote, no interim impairment test, no triggering-event assessment and no updated language on the Healthcare Solutions reporting unit — the FY2025 critical audit matter is not referenced anywhere in the 10-Q. That absence is itself the finding, and it cuts two ways. On the constructive side, US GAAP requires an interim goodwill assessment when events indicate a more-likely-than-not impairment; WM disclosed none, Note 9 confirms impairments were not material, and the corroborating evidence is consistent — goodwill rose to $14,001M from $13,880M at 31 December 2025 (p. 3), an increase fully explained by the $138M added on 2026 acquisitions less currency and other movements (p. 33), while Healthcare Solutions returned to operating profit of $2M in the quarter (p. 57). On the cautionary side, the $244M decline in Healthcare Solutions segment assets to $8,758M (p. 29) is amortization and depreciation rather than a write-down, the “critical accounting estimates” discussion still lists intangible-asset impairment among the most difficult and subjective estimates with no headroom quantified (p. 64), and nothing in this filing tests the reporting unit’s fair value. The 1 October 2026 annual test remains entirely ahead of us and is not de-risked by this quarter. Section 2 Risk 1 stands unchanged in probability, improved in trajectory.
Related-party transactions (10-Q pp. 6, 28–29, 36, 60, 68) WM has no controlling shareholder and no parent-affiliate transactions; there is no related-party footnote. What the filing does disclose, documented here in full: - Renewable Energy royalty — Renewable Energy pays a 15% intercompany royalty for landfill gas to the East Tier, West Tier and Corporate and Other: $24M in Q2 2026 versus $17M in Q2 2025 (H1 $48M versus $31M) (p. 28). Terms unchanged at 15%; the amount rose with RNG volumes. - Collection and Disposal services to Healthcare Solutions — intercompany operating revenue for collection and disposal services provided to Healthcare Solutions: $16M in Q2 2026 versus $12M in Q2 2025 (H1 $36M versus $20M) (p. 29). Terms unchanged (intended to reflect market value of service); the increase reflects the fuller integration of Stericycle into WM’s own disposal network. - Healthcare Solutions intra-segment activity — $101M in Q2 2026 versus $113M in Q2 2025 (H1 $202M versus $207M), introduced in Q3 2025 and recast into the 2025 comparatives (p. 29). This grosses up Healthcare Solutions revenue and expense equally and must not be read as growth. - Total intercompany operating revenues eliminated in consolidation: $1,503M in Q2 2026 versus $1,458M in Q2 2025 (p. 25). - Guarantor/affiliate balances — WMI and WM Holdings cross-guarantee each other’s senior debt; combined advances due to affiliates were $19,757M at 30 June 2026 versus $18,160M at 31 December 2025, with a combined six-month net loss of $(327)M at the guarantor level (pp. 60, 62). Structure unchanged. - Equity-method / VIE interests — investments in unconsolidated entities $738M at 30 June 2026 versus $779M at 31 December 2025 (p. 3); low-income housing partnerships $577M versus $624M (p. 36). Noncontrolling interests are immaterial at $1M in both periods (p. 3). - Officer transaction — on 19 May 2026 Christopher DeSantis, SVP Operations, adopted a Rule 10b5-1 plan covering 5,211 options, commencing 19 August 2026 (p. 68). Immaterial in size; disclosed for completeness. All terms above are stated by WM to be intended to reflect market value and none changed versus Q2 2025.
Contingencies and litigation (10-Q pp. 17–25) - San Jacinto River Waste Pits Superfund Site — recorded liability approximately $100M at both 30 June 2026 and 31 December 2025, unchanged. The EPA issued a Unilateral Administrative Order for site cleanup in April 2026; MIMC and International Paper have communicated their intention to comply. WM warns ultimate liability “could be materially different from current estimates, including potential increases… as construction contracting and planning proceed” (p. 21). Procedurally advanced this quarter; financially unchanged; the upside-risk tail is explicitly retained. - Superfund / PRP exposure generally — WM is a PRP at 75 NPL sites (14 owned, 61 not owned) (p. 19). The recorded environmental remediation liability is $230M; if the high end of every estimable range were used, aggregate potential liability would be about $16M higher (p. 19). That is a small, quantified tail. - Delaware DNREC order (NEW this quarter) — on 26 April 2026 the Delaware Department of Natural Resources and Environmental Control issued an order against Delaware Recyclable Products, Inc., a wholly-owned subsidiary, alleging violations relating to landfill cover and erosion control, stormwater management, management of prohibited waste and permitting. The order seeks compliance with a modified permit, remedial actions and an administrative penalty; WM’s appeal is pending (p. 21). Disclosed because it exceeds WM’s $1M Item 103 threshold — this is the first such Item 103 matter and did not exist at Q2 2025. Penalty amount not quantified; WM does not expect a material adverse effect. - Stericycle DEA/DOJ matter — RESOLVED — the criminal and civil investigations into Stericycle’s now-divested ESOL Retail Controlled Substances Business (2015–2020) were settled in May 2026, including a one-year deferred prosecution agreement; penalty and settlement payments have been made and continuing compliance, reporting and cooperation obligations apply through the term (p. 23). The settlement amount is not disclosed. A genuine reduction in acquired-litigation uncertainty versus Q2 2025, when the matter was still open. - IRS 2017 tax-year dispute — WM received a $14M partial refund plus interest in Q2 2026; the deposit with the IRS fell to $89M at 30 June 2026 from $103M at 31 December 2025 and is carried in other long-term assets. WM expects to litigate any denial of the remaining refund claim (p. 25). Small but favourable movement; no separate unrecognized-tax-benefit balance is quantified in this 10-Q. - Guarantees, insurance, multiemployer pension plans — WM guarantees homeowner property values adjacent to 18 landfills and indemnifies purchasers of divested operations (p. 19); it self-insures general liability, auto liability, workers’ compensation and health through a wholly-owned captive (p. 17); about 15% of the workforce is under collective-bargaining agreements with multiemployer pension participation, where WM concedes a withdrawal “could have a material adverse effect on our results of operations or cash flows for a particular reporting period” (p. 23). All read this quarter and confirmed unchanged in substance versus Q2 2025; risk-management operating cost did rise to $97M from $90M on higher claims (p. 51). - Risk factors — Item 1A states there have been no material changes to the risk factors in the FY2025 10-K (p. 67), and Item 4 reports disclosure controls effective with no changes to internal control over financial reporting during the quarter (p. 66) — relevant because Section 2 Risk 3 flags the Stericycle ERP integration as an internal-control-adjacent risk; no control deficiency emerged this quarter.
Subsequent events (10-Q pp. 1, 13, 60, 68, 70) The filing contains no subsequent-events footnote. Four post-quarter facts are nonetheless disclosed elsewhere: (i) the C$500M 2.60% Canadian senior notes ($352M) were redeemed in July 2026, using proceeds from the June C$700M issuance (pp. 13, 60); (ii) shares of common stock outstanding were 399,715,184 as of 24 July 2026 (p. 1) — below the 400.0M at quarter-end, so buybacks continued into Q3; (iii) the DeSantis Rule 10b5-1 plan commences 19 August 2026 (p. 68); and (iv) the report was signed and filed on 29 July 2026 (p. 70). Nothing here is thesis-relevant, and — importantly — there is no subsequent-event disclosure of any goodwill impairment indicator.
7.5 What Changed This Quarter
sources - Healthcare Solutions turned operating-profit-positive for the first time: +$2M in Q2 2026 against $(23)M in Q2 2025, and $(12)M for H1 against $(44)M (10-Q p. 57). This is the single event the near-term thesis turns on (Section 2, Catalyst 1). But segment revenue fell 1.2% to $638M from $646M, so the swing is synergy and the roll-off of integration cost, not demand recovery — one quarter above zero, achieved on a shrinking base, is necessary but not yet sufficient evidence. - The goodwill watch item was not addressed at all. No interim impairment test, no triggering-event language, no reference to the FY2025 critical audit matter anywhere in the 10-Q; consolidated goodwill instead rose to $14,001M from $13,880M on $138M of tuck-in acquisitions (10-Q pp. 3, 33). The absence of a trigger at 30 June 2026 is genuinely reassuring, but the 1 October 2026 annual test is untouched by this filing and remains the binding date. - The margin recovery is narrower than the headline. EBIT margin of 18.7% versus 17.9% breaks down as SG&A -0.60 pp, lower restructuring and the non-repeat of last year’s $16M goodwill charge -0.32 pp, DD&A +0.06 pp and the operating-cost ratio +0.03 pp (worse) at 59.2% of revenue versus 59.1% (10-Q pp. 4, 51, 53). [Rating and price target withdrawn — see the note at the top.] - Revenue growth is price, and 40% of it is fuel pass-through. Of the $254M increase, average yield contributed $277M and volume was negative at $(22)M, with $102M of the yield coming from the energy surcharge on roughly 50% higher diesel prices (10-Q pp. 47, 49). Underlying Collection and Disposal yield of +3.6% is the durable number and it is holding; the surcharge will reverse when diesel does. - Capital return resumed decisively and leverage fell without debt reduction. $671M of buybacks (3.0M shares at $223.94) plus $379M of dividends in the quarter — versus zero repurchases in all of 2025 — with $2.0bn of authorization remaining (10-Q pp. 34, 63, 67). Net Debt/LTM EBITDA fell to 3.0× from 3.5× a year earlier while net debt itself declined only 3.3% to $22,799.0M: deleveraging is entirely EBITDA-driven, exactly as Section 2 Risk 2 predicted, so the cushion against an operating shock has not been rebuilt. - Free cash flow inflected hard. FCF of $1,096.0M was up 34.8% YoY on 11.7% OCF growth and a 13.9% CapEx reduction, with sustainability-growth capex more than halving to $75M from $160M (10-Q p. 64); capex intensity fell to 9.4% of revenue from 11.4% and FCF conversion reached 139.6%. This is the Catalyst 2 inflection arriving on schedule. [Rating and price target withdrawn — see the note at the top.] Section 2 Risk 5’s tax normalisation is underway a year before the Section 48 credits expire. - Two legal positions improved, one is new. The Stericycle DEA/DOJ investigations settled in May 2026 under a one-year deferred prosecution agreement (amount undisclosed), and the IRS returned $14M of the 2017-year deposit; against that, a new Delaware DNREC environmental order dated 26 April 2026 is under appeal — WM’s first Item 103 matter (10-Q pp. 21, 23, 25).
7.6 Portfolio Decision
sources [Rating and price target withdrawn — see the note at the top.] [Rating and price target withdrawn — see the note at the top.] EBIT of $1,253.0M on $6,684.0M lifted the margin to 18.7% from 17.9%, EPS reached $1.95 and free cash flow of $1,096.0M converted at 139.6% of net income — on those headline numbers this is the best quarter in the post-Stericycle era. Decompose it, though, and 0.60 pp of the 0.85 pp margin gain is SG&A falling to 10.2% of revenue from 10.8% on integration consulting rolling off, another 0.32 pp is last year’s restructuring and $16M goodwill charge not repeating, and the operating-cost ratio actually deteriorated 3 bps to 59.2% — while 40% of the revenue growth is a diesel-linked surcharge that will reverse. The footnote review reinforces the same reading: Healthcare Solutions crossed into profit at +$2M on falling revenue (10-Q p. 57), the accretion reclassification (10-Q p. 10) manufactures a gross-margin improvement that did not happen, and leverage improved to 3.0× from 3.5× purely through EBITDA growth while net debt fell only 3.3%. [Rating and price target withdrawn — see the note at the top.] That combination — thesis confirmed at the headline, only partially confirmed underneath, and the largest single risk untouched and dated — is the definition of a position to hold rather than add to. The point is sharpened by management’s own behaviour: it repurchased 3.0 million shares at a weighted-average $223.94, essentially at our $222.41 target and above where the stock traded by June, which supports EPS but creates no value cushion for a new buyer at $226.44.
What would change this view: - Upgrade condition: Healthcare Solutions segment income from operations holds above $0 in Q3 2026 (a second consecutive positive quarter after this quarter’s +$2M) and the 1 October 2026 annual goodwill test clears with management disclosing headroom — or, independently, the consolidated operating-cost ratio falls below 58.5% of revenue for two consecutive quarters, proving the margin gain has moved from overhead into field operations. [Rating and price target withdrawn — see the note at the top.] - Downgrade condition: Any Healthcare Solutions goodwill write-down at or before the 1 October 2026 test; or the operating-cost ratio rising above 60% of revenue for two consecutive quarters (from 59.2% this quarter) as the diesel surcharge reverses without matching cost relief; or Net Debt/LTM EBITDA moving back above 3.5× — the Q2 2025 level — while buybacks continue against the remaining $2.0bn authorization. [Rating and price target withdrawn — see the note at the top.]
Report Versions
Every published version of this report, newest first — each one kept so a reader can see what changed and when.
| Version date | Files |
|---|---|
| 2026-08-19 Current | Model (Excel) |
| 2026-08-11 | Model (Excel) |