
Costco Wholesale
Section 1 — Business Overview, Operations & Competitive Positioning
1.1 The Business
sources Costco Wholesale Corporation (COST) is best understood not as a retailer but as a subscription business wrapped around one. Members pay a recurring annual fee for the right to buy a deliberately narrow range of goods at markups far below conventional retail, and it is that fee — a high-margin, high-renewal annuity — rather than the merchandise gross margin that carries the profit. The warehouse operation exists to make membership worth renewing; the membership exists to make the warehouse operation viable at prices no unsubsidized retailer could sustain. The scale of that annuity is now visible in the figures rather than only in adjectives: membership fee revenue has roughly doubled over the decade, from $2,646.0M in FY2016 to $5,323.0M in FY2025, and at $5,323.0M set against operating income of $10,383.0M it is worth close to half of all operating profit. That single relationship is the clearest statement of what Costco actually is — the merchandise operation is run at a deliberately thin margin, and the membership fee is the profit.
[Rating and price target withdrawn — see the note at the top.] We want to be unambiguous about what that call is and is not. It is not a judgment on business quality. Costco is a genuinely exceptional franchise — one of the highest-quality compounders in global consumer staples — and this section will make the affirmative case for the moat in detail. [Rating and price target withdrawn — see the note at the top.]
One point of transparency belongs here rather than only in the valuation sections. [Rating and price target withdrawn — see the note at the top.] We are not implying the target falls out of the DCF; it does not. The principal risk to the call is precisely this timing gap: premium multiples on exceptional compounders can persist for years, and street consensus sits materially above our fair value. Being right on value and wrong on timing is the real exposure, and we flag it at the outset.
The economic engine is straightforward and durable. Costco offers low prices on a deliberately limited assortment of national-brand and Kirkland Signature private-label products, driving very high sales volumes and rapid inventory turnover. Combined with volume purchasing, cross-dock distribution, minimal merchandise handling, and no-frills self-service warehouses, this lets the company operate profitably at gross margins management describes as significantly below most other retailers — because the merchandise is close to a break-even conduit and the membership fee is the margin. The company frequently sells inventory before it must pay suppliers, converting a low-margin operation into a strongly cash-generative one. Costco reports on a retail fiscal year ending the Sunday nearest the end of August, and the common stock trades on NASDAQ under COST. Its workforce is concentrated in warehouses and distribution, is only lightly unionized, and is managed on an explicit above-industry-pay philosophy — compensation and benefits are the largest expense after merchandise cost — with management targeting at least half the base as full-time and reporting high retention among tenured staff. That labor posture is a deliberate cost, chosen to lower turnover and lift productivity, and it is central to how the warehouses run. §
Key Information
| Item | Value |
|---|---|
| Ticker | COST |
| Sector / Industry | Consumer Staples |
| Report Date | 2026-08-12 |
| Most Recent FY Revenue | $275,235.0M |
| EBIT Margin (Most Recent FY) | 3.8% |
| Diluted Weighted-Average Shares | 445M |
| Current Price | $944.32 |
Source: Company SEC filings (10-K); see Appendix A.1.
1.2 Operating Segments
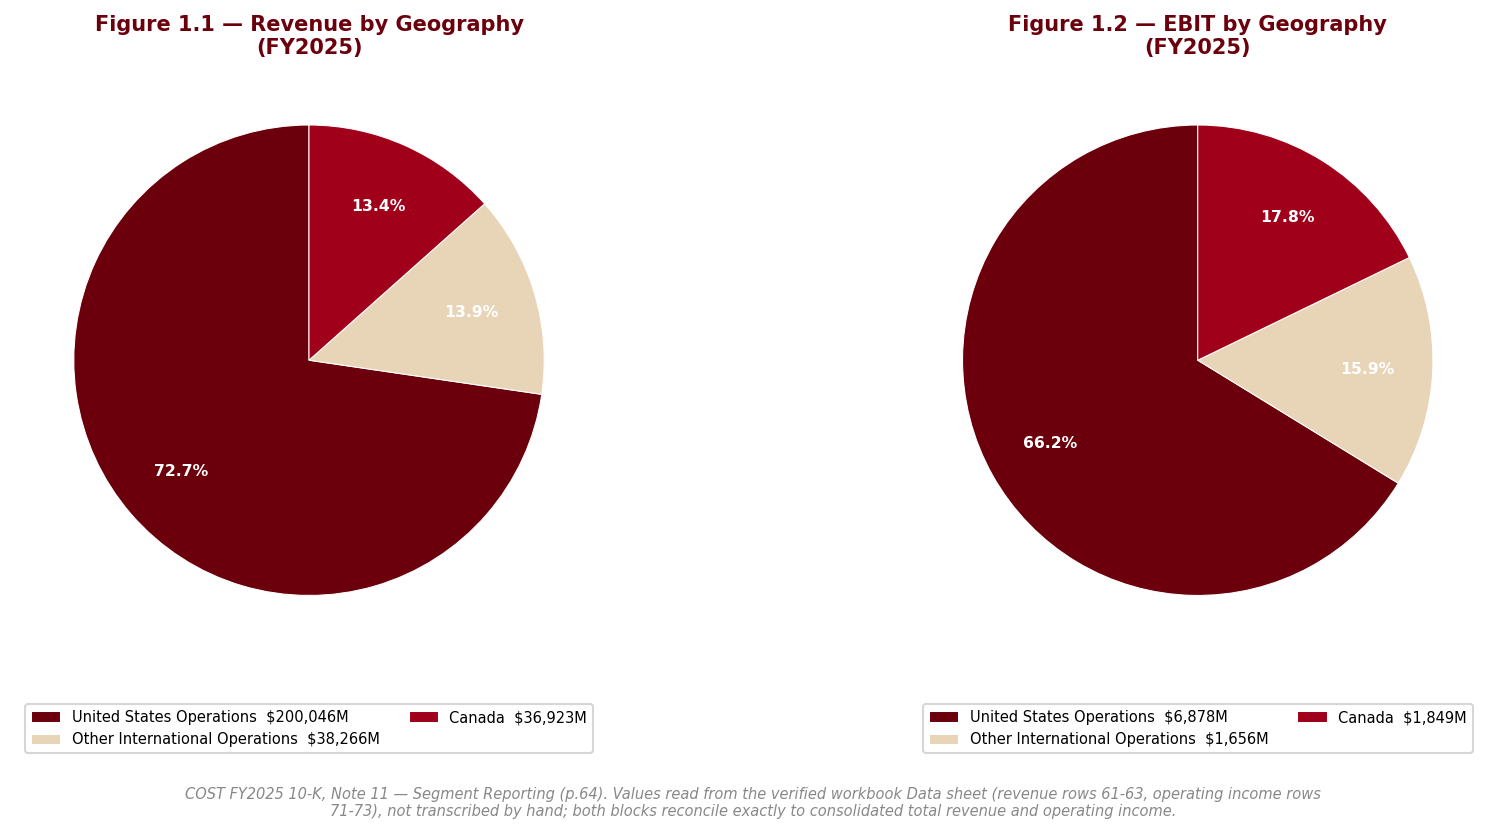
sources Costco reports three operating segments defined geographically — United States, Canada, and Other International — that share substantially the same operating model. Segment-level revenue and operating-income detail; the point here is the shape of the system. The United States is the overwhelming majority of net sales and operating income and is therefore the segment that sets the trajectory of the whole; Canada is a mature, high-productivity second market; and Other International is the growth engine, carrying higher square-footage growth off a smaller base, generally lower wage-and-benefit costs as a share of sales, and in several markets little or no direct warehouse-club competition. The single economic variable that drives every segment is the same: comparable sales, itself a function of shopping frequency and average ticket, layered on top of the recurring membership fee.
Cutting across the geographic segments is a merchandising architecture that is worth understanding because it explains the margin structure. Sales fall into three groups: core merchandise categories (foods and sundries; non-foods; and fresh foods — meat, produce, deli and bakery); warehouse ancillary businesses (gasoline, pharmacy, optical, food court, hearing aids, tire installation); and other businesses (e-commerce, business centers, travel). The ancillary businesses are deliberately sited within or beside the warehouses to raise shopping frequency, and their economics differ sharply from the core. Gasoline in particular is a meaningful traffic driver but a low-gross-margin, low-SG&A business, so a heavier gasoline mix optically depresses the consolidated gross margin percentage while simultaneously reducing SG&A as a share of sales — a mechanical distortion that must be stripped out before any margin comparison is meaningful. E-commerce broadens selection and convenience but carries a lower gross-margin percentage than the warehouses. §
The flywheel is the interlock between these pieces. Low prices on a tight, fast-turning assortment drive volume; volume drives purchasing scale and supplier leverage; scale funds still-lower prices; low prices and the ancillary draw (gasoline, pharmacy, food court) drive traffic and renewals; and renewals convert into the fee annuity that lets the merchandise operation run at break-even margins competitors cannot match. The fragility in the system is that it is a low-margin machine — management itself notes that, because the business runs on very thin merchandise margins, modest changes in merchandise cost or SG&A can move net income substantially. The system is powerful but it is not slack; it depends on volume and cost discipline holding together simultaneously.
1.3 Geographic Exposure
sources Costco operates membership warehouses and e-commerce sites in the United States and Puerto Rico, Canada, Mexico, Japan, the United Kingdom, Korea, Australia, Taiwan, China, Spain, France, Sweden, Iceland, and New Zealand. Revenue and warehouse floor space are heavily concentrated in the United States, with meaningful footprints in Canada and a widening Other International base. Within the United States, California carries a disproportionate share of higher-volume warehouses, so the company’s single largest geographic concentration is finer-grained than “domestic” — it is coastal, and it is California-weighted. [Rating and price target withdrawn — see the note at the top.] Management continues to direct new-warehouse growth disproportionately toward international markets, where the smaller base supports higher square-footage growth. The geography therefore cuts both ways: the U.S./California concentration is the earnings anchor and the largest single point of dependence, while the international tilt is the primary source of unit growth and of translation risk. The concentration and currency exposures are quantified as risks in Section 2. §
1.4 Management Team
sources The management assessment is favorable but not without watch items. The distinguishing feature of the executive bench is tenure: most executive officers have long careers inside the company, and the culture — low prices, pricing authority, take-care-of-employees — is institutional rather than personality-dependent, which reduces key-person risk relative to most large-cap consumer names. The chief executive rose through the operating ranks in the Costco tradition of promoting from within, and the code-of-ethics framing that ties “take care of our members” to “take care of our employees” is not decoration; it maps directly onto the above-industry wage posture that underpins the low-turnover, high-productivity warehouse model.
The offsetting consideration is succession and transition load. The FY2025 filing discloses several planned senior-leadership transitions taking effect in the coming year, including the retirement of a senior U.S. operations executive and a set of appointments and elevations within warehouse and divisional operations. For a company this dependent on U.S. operating execution, an orderly, telegraphed transition is the right way to manage it, but the concentration of changes in a single year is a genuine watch item rather than a non-event. Succession depth, and a separate senior-security-leadership vacancy, are treated as governance risks in Section 2; here the conclusion is simply that leadership is deep, culturally aligned, and internally grown, with the near-term test being the execution of a heavier-than-usual slate of transitions.
1.5 Capital Allocation Track Record
| Year | Dividends Paid ($M) | Share Repurchases ($M) | CapEx ($M) |
|---|---|---|---|
| FY2021 | $5,748.0M | $496.0M | $3,588.0M |
| FY2022 | $1,498.0M | $439.0M | $3,891.0M |
| FY2023 | $1,251.0M | $676.0M | $4,323.0M |
| FY2024 | $9,041.0M | $700.0M | $4,710.0M |
| FY2025 | $2,183.0M | $903.0M | $5,498.0M |
Source: Company SEC filings (10-K); see Appendix A.1.
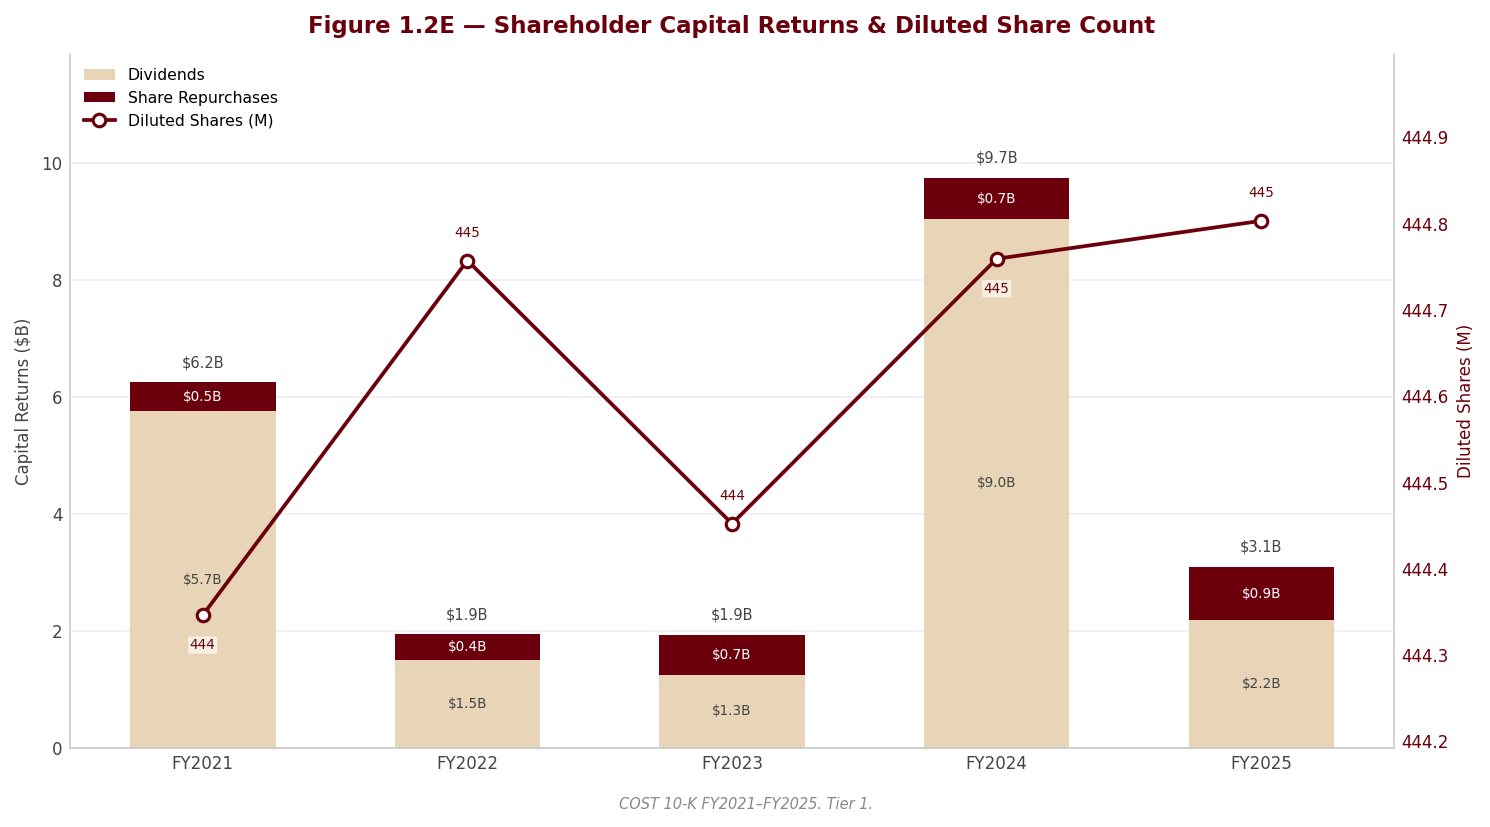
Costco’s capital-allocation posture is deliberately conservative and reveals a clear hierarchy. The first claim on capital is the business itself: capital expenditure goes primarily into land, buildings and equipment for new and remodeled warehouses, plus distribution, manufacturing and information systems, and it is funded from operating cash flow rather than debt. Because Costco owns the majority of its warehouse land and buildings — and where it leases, a large share are land-only leases on which it owns the building — this CapEx is as much a real-estate franchise investment as a maintenance line, and reading it against depreciation and amortization is the right way to see how much of the spend is growth versus replacement (the relationship is quantified in Sections 3 and 5). The second claim is a growing, well-covered regular dividend, which the Board raised during the year, alongside a modest ongoing share repurchase program under a standing authorization, with repurchased shares retired.
Two comparability points must frame any read of the table. First, FY2024 dividends were inflated by a large special dividend that did not recur; treating the FY2024-to-FY2025 decline in dividends paid as a retrenchment in capital-return policy would be a misreading — it was debt-neutral, funded from cash, and is a periodic feature of Costco’s approach, not a change in it. Second, buybacks are consistently small relative to the company’s cash generation and market capitalization: management does not use repurchase to manufacture EPS, which is visible in a diluted share count that has been remarkably flat, moving only from 444M in FY2021 to 445M in FY2025. The signal from the mix is a management team confident enough in reinvestment economics to keep funding warehouse growth, disciplined enough not to lever up for financial engineering, and willing to return genuinely surplus cash through periodic specials rather than an aggressive buyback. [Rating and price target withdrawn — see the note at the top.]
1.6 Competitive Positioning & Moat
sources §1.6.1 Industry structure. Warehouse-club and broadline retail is a scale-and-cost industry that competes on price, quality, selection, location, convenience and service, with thin margins the norm and returns accruing to the lowest-cost operator. Costco competes worldwide with global, national and regional retailers — it names Walmart, Target, Kroger and Amazon among general-merchandise competitors and Sam’s Club and BJ’s among warehouse clubs — and many metropolitan areas already contain multiple competing clubs. In a business where a few points of cost decide who can offer the lowest price and still earn a return, structural cost advantage is not a nice-to-have; it is the whole game.
§1.6.2 Competitive advantages. Costco’s moat is a reinforcing stack, and each layer is supported by a specific mechanism rather than asserted. [Rating and price target withdrawn — see the note at the top.] Two points of honest framing belong with those figures. [Rating and price target withdrawn — see the note at the top.] Second, at the end of FY2020 Costco standardized its global membership-count methodology, adding a modest one-time increment to that year’s paid-member and cardholder counts with no restatement of FY2019, so the member-count series carries a small basis step at FY2020 that flatters the FY2019-to-FY2020 growth. Neither qualification changes the conclusion: because the fee is a recurring, deferred, high-margin annuity recognized ratably over the year, it produces earnings quality and a switching cost that a transactional retailer cannot replicate — a member who has paid the fee is economically incented to consolidate spend at Costco to justify it. The base those renewals sit on has scaled relentlessly: paid members have grown from 47.6 million in FY2016 to 81.0 million in FY2025, total cardholders from 86.7 million to 145.2 million, and the warehouse network from 715 locations to 914. On top of that sits scale purchasing against a deliberately limited SKU count: by carrying far fewer active stock-keeping units per warehouse than broadline peers and concentrating volume on fast-selling items, Costco extracts supplier terms and inventory turnover that few can match — the disciplined assortment is what converts scale into genuine per-item cost advantage. Kirkland Signature adds a private-label lever that is priced below national brands yet earns higher margin and deepens loyalty, and management intends to keep raising its penetration. The owned real-estate base lowers occupancy cost and confers control over the highest-productivity sites. The no-frills warehouse format, tight entrance/exit control and membership gating hold shrinkage well below typical retail. And the above-industry labor model, counterintuitively, is a cost advantage: lower turnover and higher productivity offset the higher wage. Underpinning all of it is “pricing authority” — a cultivated member perception that Costco consistently offers the most competitive value, which management protects even at the expense of near-term gross margin. Each of these is a source of durable low-cost supply, and together they are difficult to assemble piecemeal.
The membership engine and the physical footprint that houses it are laid out below on a decade span.
| Metric | FY2016 | FY2018 | FY2020 | FY2022 | FY2024 | FY2025 |
|---|---|---|---|---|---|---|
| Warehouses in operation | 715 | 762 | 795 | 838 | 890 | 914 |
| Paid members (millions) | 47.6 | 51.6 | 58.1 | 65.8 | 76.2 | 81.0 |
| Total cardholders (millions) | 86.7 | 94.3 | 105.5 | 118.9 | 136.8 | 145.2 |
| [Rating and price target withdrawn — see the note at the top.] | — | 90.0% | 91.0% | 93.0% | 92.9% | 92.3% |
| [Rating and price target withdrawn — see the note at the top.] | — | 88.0% | 88.0% | 90.0% | 90.5% | 89.8% |
| Membership fee revenue | $2,646.0M | $3,142.0M | $3,541.0M | $4,224.0M | $4,828.0M | $5,323.0M |
Source: Company SEC filings (10-K), Item 1 and MD&A; see Appendix A.1. Renewal rates are disclosed only from FY2018; paid-member and cardholder counts reflect a one-time FY2020 methodology standardization with no restatement of FY2019.
[Rating and price target withdrawn — see the note at the top.] That is what durability looks like when it is measured rather than asserted.
§1.6.3 Competitive vulnerabilities. The moat is wide but not immune. The heaviest dependence is on U.S. — and within it, California — operations, so a regional shock or a sustained comparable-sales slowdown there would hit disproportionately. As the domestic base matures, desirable new sites become scarcer and new warehouses both open at lower initial profitability and can cannibalize nearby existing units, making square-footage growth a progressively smaller contributor. E-commerce and the rise of comparison shopping erode one historical friction, and some competitors — Amazon in particular — carry greater technology resources and faster adoption of new capabilities. Input-cost inflation, tariffs and trade actions raise merchandise cost, and management’s own philosophy of holding or cutting price to protect pricing authority means cost pressure is partly absorbed into margin by design rather than fully passed through. Currency translation weighs on the growing international mix. None of these is thesis-breaking, but each is a real edge on the moat.
§1.6.4 Verdict. Costco’s competitive position is among the most durable in consumer staples: a membership annuity with near-record renewal, a genuine structural cost advantage built on scale, limited assortment, private label and owned real estate, and a culture that is institutional rather than personality-bound. That combination supports high confidence in long-run margin durability — the merchandise operation can stay near break-even indefinitely precisely because the fee carries the profit, and the fee is the stickiest part of the model. The competitive conclusion, therefore, reinforces the framing of Section 1.1: the quality is not in question. What is in question, and what the separate valuation address, is the price being asked for it.
Section 2 — Key Risks & Catalysts
2.1 Downside Risks
sources The risk that dominates a Costco investment today is not operational, financial, or governance-related — it is valuation. This is a rare case where the forensic read of the filing and the risk assessment point in opposite directions: the FY2025 10-K is one of the cleanest we have reviewed in consumer staples, so the material downside does not sit inside the accounts. It sits in the price. KPMG (auditor since 2002) issued an unqualified opinion on both the financial statements and internal control over financial reporting, with no restatement, no going-concern or emphasis-of-matter language, and a single long-standing critical audit matter — the sufficiency of audit evidence over the highly automated, IT-dependent U.S. and Canada revenue process — that is a feature of Costco’s transaction scale, not a red flag on earnings quality. Our own deterministic screens corroborate the picture: operating cash flow comfortably exceeds net income, the Sloan accrual ratio is negative (a positive quality signal, meaning earnings are backed by cash rather than accruals), the Beneish manipulation index sits well inside the clean range, and the Piotroski fundamental score is solidly positive. In short, there is nothing in the numbers to distrust. The risks below are therefore about what could go wrong in the business and the multiple, not about the integrity of what has been reported — and the six yellow watch items flagged in our footnote review are comparability and estimation matters, not accounting-quality problems, addressed in their proper place below.
Risk 1 — Valuation and demanding embedded expectations
[Rating and price target withdrawn — see the note at the top.] That is an unusually candid acknowledgement from the company that the shares are priced for perfection. Because Costco is a genuinely exceptional franchise, the market has capitalized its quality into a premium earnings multiple and a compressed free-cash-flow yield that, on our work in the separate valuation, leave little room for the ordinary disappointments that even great businesses periodically deliver. [Rating and price target withdrawn — see the note at the top.] The offsetting reality — which we flagged at the outset of Section 1 — is that premium multiples on high-quality compounders can persist for years, so the exposure here is as much about timing as about direction.
[Rating and price target withdrawn — see the note at the top.]
Risk 2 — Concentration in U.S. and California operations
sources Costco is highly dependent on its U.S. and Canadian operations, which generate the large majority of net sales and operating income, and within the U.S. it is disproportionately exposed to California, which houses a concentration of higher-volume warehouses and, separately, the company’s centralized operating systems and administrative personnel. This single dependence links several otherwise-independent hazards: a sustained comparable-sales slowdown in the core market, rising labor, healthcare or energy costs, a missed warehouse-opening cadence, cannibalization from new units in mature markets, or a natural-disaster/seismic event in California or Washington would all land on the same earnings base. Because the business runs on very thin merchandise margins, management notes that modest changes in merchandise cost or SG&A produce outsized swings in net income — so a regional shock is amplified, not diluted, by the operating model.
Probability: Low (of an acute shock) / Medium (of gradual core-market deceleration) | Timeframe: Ongoing, with acute-event tail risk | Impact: Material — the core geography sets the trajectory of the whole company; a sustained U.S. comp slowdown would be the single most damaging fundamental development.
Risk 3 — Merchandise-cost inflation and tariff exposure
sources Management repeatedly frames tariffs and trade actions as a cost headwind and states plainly that higher tariffs are more likely to hurt than help results. This risk became visible in the FY2025 accounts through the LIFO watch item: U.S. merchandise inventories are carried on LIFO, and after an immaterial benefit in the prior year the company recorded a LIFO charge in FY2025 to lift the cumulative valuation on higher merchandise costs — a directional reversal that signals renewed U.S. merchandise-cost inflation. We are deliberate about what this is and is not. The charge is non-cash, reverses if input costs deflate, and shaved only a handful of basis points off the reported gross margin, which still improved; it is a cost-inflation signal, not a margin-quality deterioration (the underlying core-merchandise margin, ex-LIFO and ex-gasoline, rose). The genuine risk is forward: Costco’s own pricing-authority philosophy means it will often choose to absorb cost increases into margin rather than fully pass them to members, so persistent tariff-driven inflation would pressure FY2026 gross margin by design. This risk connects directly to Risk 1 — on a low-margin model priced for perfection, even a few basis points of unexpected margin give-back can move the multiple.
Probability: Medium | Timeframe: Immediate to 1–2 years | Impact: Gross-margin basis points; contained per event but recurring while tariff and input-cost pressure persists.
Risk 4 — Self-insurance reserve build and actuarial estimation
sources The company self-insures a broad set of exposures — employee healthcare, workers’ compensation, general liability, property, directors-and-officers, vehicle liability and inventory loss — predominantly through a wholly-owned captive (NW Re Limited) that participates in a third-party reinsurance program, and it identifies these insurance liabilities as one of its own critical accounting estimates. The retained liabilities are undiscounted actuarial estimates, and in FY2025 the aggregate reserve grew faster than net sales, a build that suggests rising claims frequency or severity working through the system. The financial channel is direct: because the captive nets premiums against SG&A and the reserves flow through operating expense, an adverse actuarial development would hit operating income immediately rather than being smoothed. A further residual feature is that within the reinsurance program the company retains its primary obligation to other participants for prior-period activity even if it were to exit — a modest, disclosed, off-balance-sheet-style commitment. History suggests adjustments have been immaterial, which caps the near-term probability, but the faster-than-sales reserve build makes this a monitorable SG&A cost pressure rather than a settled item.
Probability: Low | Timeframe: 1–2 years | Impact: Operating-income drag on adverse development; the company’s own-identified critical estimate, hence a legitimate watch item despite a benign history.
Risk 5 — Legal, regulatory and cybersecurity tail
sources Costco’s contingencies note discloses several matters that carry only an immaterial accrual or no accrual at all, because management assesses the loss as not reasonably estimable. Two are procedurally advanced enough to warrant specific attention. The first is a U.S. Attorney (Western District of Washington) False Claims Act investigation into whether Costco caused false claims for prescription medications to be presented to the federal government, initiated by a Civil Investigative Demand — the pharmacy exposure common to large retail pharmacies, and the kind of matter that has produced material settlements elsewhere in the sector. The second is the consolidated pixel-tracker privacy class action, where the court denied the motion to dismiss in substantial part, meaning the case survived its first major test and now proceeds, alongside related state attorney-general inquiries. Both remain unquantified and unaccrued; management states that none of its legal matters, alone or in aggregate, will be material, while acknowledging that an unfavorable outcome could be material to an individual quarter or year. This is a tail risk, not a base-case charge — but it is the one area of the filing where a material, unestimated liability could crystallize. A related, minor governance overlay sits alongside it: the former Chief Information Security Officer departed during FY2025, with the deputy managing on an interim basis while a permanent replacement is sourced. A senior-security-leadership vacancy at a high-transaction-volume retailer with live privacy litigation is a governance watch item worth monitoring, though no control deficiency or material incident is disclosed and internal control over financial reporting was concluded effective.
Probability: Low (base-case immaterial) | Timeframe: Uncertain; multi-year litigation cadence | Impact: Not estimable — no loss estimate is disclosed; the risk is tail, with a plausible (company-assessed-remote) path to a charge material to a single period.
Accounting Quality & Comparability — Watch Items (not standalone risks)
sources Three further items surfaced in our review belong here rather than in the risk list, because they affect how the numbers should be read rather than posing a fundamental threat. [Rating and price target withdrawn — see the note at the top.] This is a structural inefficiency — foreign taxes paid that will never offset U.S. tax — not a signal of deteriorating profitability (unlike an allowance against operating loss carryforwards), and it should be reflected as a modest ongoing drag in the tax assumption rather than treated as a risk event. Second, and most important for comparability, the prior fiscal year included a large per-share special dividend that did not recur; it was funded from cash and operations rather than new debt, and it generated non-recurring discrete tax benefits. [Rating and price target withdrawn — see the note at the top.] Third, a genuine but benign data point from our deterministic screens: receivables grew faster than revenue for two consecutive years, lifting receivables as a share of sales. In most companies that pattern warrants scrutiny for aggressive revenue recognition or channel-stuffing; here it does not. Costco is a cash-and-carry warehouse club that extends no consumer trade credit and collects in roughly four days, so its receivables are vendor and rebate, tax, and third-party balances, not customer invoices that could be pulled forward — we flag the trend for completeness and dismiss the alarm on the mechanics of the model. Taken together with the clean audit opinion and the corroborating quality screens, these watch items reinforce rather than undermine our confidence in the reported figures; the disclosure that no material related-party transactions appear in the 10-K (with the detailed related-person disclosures residing in the not-yet-filed 2026 proxy, outside this review) adds to that comfort.
2.2 Upside Catalysts
sources We are deliberately honest about asymmetry here. [Rating and price target withdrawn — see the note at the top.] In other words, the bull case for the stock is the bear case for our thesis: the operational engine is strong enough that it can keep the multiple elevated for longer than a valuation-based investor would like. We present the genuine catalysts on their merits.
Catalyst 1 — Membership-fee compounding and fee-increase flow-through
Membership fees are the highest-quality, highest-margin earnings stream in the company and the true engine of profitability. [Rating and price target withdrawn — see the note at the top.] Because fees are deferred and recognized ratably over the one-year membership period, that price increase was still flowing into recognized revenue through the year and continues to benefit early FY2026 — a mechanical, high-certainty tailwind. [Rating and price target withdrawn — see the note at the top.] Absolute retention nonetheless remains very high, and the fee annuity is the stickiest part of the model.
[Rating and price target withdrawn — see the note at the top.]
Catalyst 2 — International unit growth and white space
sources International operations account for a rising share of the warehouse base, and management intends to keep directing new-warehouse growth disproportionately abroad, where a smaller base supports higher square-footage growth, wage-and-benefit costs run lower as a share of sales, and several markets carry little or no direct warehouse-club competition. This is the clearest multi-year source of unit growth as the domestic base matures and desirable U.S. sites become scarcer. The offsetting realities are that new warehouses open at lower initial profitability, can cannibalize nearby units in established markets, and expose the company to currency translation that weighs on reported results even when local performance is sound. §
Probability: Medium–High | Timeframe: 3–5 years | Monitoring trigger: Warehouse-opening cadence versus plan, international comparable sales ex-currency, and the international share of the total warehouse count.
Catalyst 3 — Capital return, including a potential special dividend
Costco has a demonstrated pattern of periodic, debt-neutral special dividends funded from cash, layered on top of a steadily growing regular dividend and a modest, disciplined buyback. The regular dividend was raised during FY2025, and the prior-year special did not recur — which, given the company’s history and its accumulating cash, leaves a plausible path to another special dividend as a discrete catalyst event. [Rating and price target withdrawn — see the note at the top.]
Probability: Medium | Timeframe: 1–2 years | Monitoring trigger: Board dividend declarations, cash and short-term investment build, and remaining repurchase authorization.
Catalyst 4 — Comparable-sales momentum from pricing authority, Kirkland and Executive penetration
sources The operational levers that drive comparable sales — cultivated pricing authority that protects member value, rising Kirkland Signature private-label penetration (higher margin, deeper loyalty), and growing Executive-membership penetration — remain intact and could sustain the frequency-and-ticket momentum that management identifies as the single most important profitability driver. Because higher comparable sales (ex-currency, ex-gasoline) let the company better leverage SG&A on its thin margins, sustained comp strength flows to operating income with leverage. This is the softest of the catalysts to time, but it is the one that most directly underpins the premium the market pays.
Probability: Medium | Timeframe: Ongoing | Monitoring trigger: Comparable sales excluding gasoline and currency, Kirkland penetration, and Executive-membership share of sales.
2.3 Risk & Catalyst Summary
| # | Item | Type | Probability | Timeframe | Status | Monitoring Trigger |
|---|---|---|---|---|---|---|
| 1 | Valuation / demanding embedded expectations | Risk | High–Medium | 1–2 years | Active | Multiple, FCF yield vs history; any comp or renewal shortfall |
| 2 | U.S. / California concentration | Risk | Low–Medium | Ongoing | Latent | U.S. comparable sales; California event risk |
| 3 | Merchandise-cost inflation & tariffs (LIFO signal) | Risk | Medium | Immediate–1–2 yrs | Active | LIFO disclosure; gross margin ex-gasoline; tariff actions |
| 4 | Self-insurance reserve build | Risk | Low | 1–2 years | Monitoring | Aggregate insurance liabilities vs sales; SG&A trend |
| 5 | Legal / regulatory / cyber tail (DOJ FCA, pixel-tracker) | Risk | Low | Uncertain | Monitoring | Contingencies note; motion/settlement developments; permanent CISO hire |
| 6 | Membership-fee compounding & fee-increase flow-through | Catalyst | High | Immediate | Active | [Rating and price target withdrawn — see the note at the top.] |
| 7 | International unit growth | Catalyst | Medium–High | 3–5 years | Active | Warehouse openings vs plan; international comps ex-FX |
| 8 | Capital return / potential special dividend | Catalyst | Medium | 1–2 years | Monitoring | Dividend declarations; cash build; buyback authorization |
Source: Company SEC filings (10-K) and forensic footnote review; see Appendix A.1.
2.4 Risk Interdependencies
sources The risks above are not independent draws; they share a common amplifier and a common transmission line. The amplifier is the thin-margin operating model: because management notes that small movements in merchandise cost or SG&A produce outsized swings in net income, any of the operational risks — tariff-driven merchandise-cost inflation (Risk 3), an adverse self-insurance development (Risk 4), or a core-market comparable-sales slowdown (Risk 2) — is magnified on the way to the bottom line rather than absorbed. The transmission line is Risk 1. Costco’s premium multiple is the mechanism that converts a modest operational disappointment into a disproportionate equity-value loss: the combination that would be most damaging is not any single risk in isolation but a soft U.S. comparable-sales print (Risk 2) arriving at the same time as a fresh tariff/LIFO margin give-back (Risk 3), because together they would puncture precisely the growth-and-margin narrative that the valuation (Risk 1) capitalizes. In that scenario the multiple and the earnings estimate move against the investor simultaneously — the classic double hit on a stock priced for perfection. The concentration risk sharpens this further: because the earnings base is anchored in the U.S. and California, there is little geographic diversification to cushion a domestic shock, so the operational risks correlate through a single market rather than netting against one another. The legal tail (Risk 5) is largely orthogonal to the operating risks — it would crystallize on its own procedural timetable regardless of the sales cycle — but it is not orthogonal to Risk 1: an unexpected material charge would land on the same premium multiple and could act as the catalyst that reprices the narrative. The practical implication is that the individual risk probabilities understate the tail, because the scenarios that matter most are the ones in which two of them arrive together.
2.5 ESG & Regulatory Exposure
sources Costco’s ESG and regulatory profile is best read through the specific disclosures in this filing rather than through generic sector framing. On the environmental side, the most concrete exposures are operational and physical: the business runs refrigeration systems and treats and disposes of wastewater, stormwater and food-processing wastes, so failure to meet environmental, health and safety standards carries fines, remediation and closure risk, and the company discloses environmental remediation proceedings commenced by governmental authorities among its legal matters. Two forward regulatory vectors are named explicitly — greenhouse-gas and fuel-economy rules and zero-emission-vehicle policies that could raise compliance, operating and merchandise costs and require capital, and extended-producer-responsibility and packaging laws that are already increasing compliance expense. Gasoline is a distinctive double exposure here: it is a meaningful traffic driver whose demand could be dampened over time by climate regulation and shifting consumer preferences, so the same category that supports frequency today is a regulatory and secular watch item. The company has also set public sustainability targets, and management flags candidly that a failure or perceived failure to meet them — or shifting stakeholder expectations, with achievement partly dependent on factors outside its control such as affordable clean energy and policy stability — could cause reputational harm, and that its ESG approach may be challenged by parties from differing viewpoints. §
On the social and governance side, the standout regulatory exposure is data privacy and information security. Costco is subject to a growing global body of privacy and data-protection regulation and evolving rules on artificial intelligence, and it acknowledges that some cyberattack attempts have been successful — a live exposure given the pixel-tracker privacy class action that survived its motion to dismiss and the related attorney-general inquiries discussed under Risk 5, and given the interim CISO arrangement. Payment-card network and data-security compliance adds a further regulated cost layer, with breach consequences ranging from re-issuance costs and fines to loss of card-acceptance ability. [Rating and price target withdrawn — see the note at the top.] Product and food safety regulation is inherent to selling goods for human consumption, drugs and children’s products, with recall, litigation and reputational consequences. Finally, trade and tariff policy is both an economic and a regulatory exposure — already affecting the cost of some merchandise, as discussed under Risk 3 — and the company’s growing international footprint adds foreign trade actions, sanctions, adverse tax consequences and transfer-pricing disputes to the regulatory surface area. On governance structure, the picture is reassuring: there is no controlling shareholder and no noncontrolling interests, the chair and chief executive are independent of any control block, and the 10-K discloses no material related-party transactions, with the detailed related-person disclosures residing in the 2026 proxy statement that falls outside the scope of this review.
Section 3 — Financial Analysis & Historical Performance
Three-Statement Linkage Confirmation: - Net Income ties (Income Statement → Cash Flow Statement): Confirmed. Net income as reported on the income statement reconciles to the opening line of the cash-flow-from-operations bridge across FY2015–FY2025 with no unexplained residual. - Cash ties (Balance Sheet → Cash Flow Statement): Confirmed. The change in cash and equivalents on the balance sheet reconciles to the net change in cash on the statement of cash flows in each year. - Retained Earnings reconciliation (Beg RE + NI - Dividends = End RE): Confirmed, subject to the periodic special dividends. The retained-earnings roll-forward ties once the FY2021 and FY2024 special distributions are included; the FY2024 draw-down is the mechanical footprint of the FY2024 special dividend rather than any earnings deterioration.
3.1A Income Statement
Source: Costco Wholesale Corporation Form 10-K filings (FY2021–FY2025); figures per the FL model — see Appendix A.1–A.2.
CAGR Summary
| Metric | 3Y CAGR | 5Y CAGR | 10Y CAGR |
|---|---|---|---|
| Revenue | 6.6% | 10.5% | — |
| EBITDA | 9.7% | 12.6% | — |
| Net Income | 11.5% | 15.1% | — |
| Diluted EPS | 11.5% | 15.1% | — |
| FCF | 30.8% | 5.3% | — |
Source: Company SEC filings (10-K); figures per the FL model — see Appendix A.1–A.2.
3.1B Income Statement — Analysis
sources The revenue story. Costco’s top line is one of the most reliable compounders in large-cap retail: revenue grew at a 10.5% five-year CAGR and a still-healthy 6.6% three-year CAGR, the deceleration between the two windows reflecting the fading of pandemic-era and inflationary tailwinds rather than any structural break. The growth is overwhelmingly volume- and unit-driven — new-warehouse openings plus mid-single-digit comparable traffic — layered on top of a membership base that renews at roughly nine-in-ten. This is the analytically important point: unlike a commodity-linked or price-driven retailer, Costco’s growth is built on physical footprint and member count, both of which compound rather than reverse with a cycle. One comparability caveat governs the series: FY2023 was a 53-week fiscal year (ended 3 September 2023), so the 6.8% reported growth that year — and any multi-year CAGR whose window spans it — is flattered by an extra selling week. [Rating and price target withdrawn — see the note at the top.] Subsection 3.1C now decomposes that single top-line into the two independent engines a retailer should be read on — unit growth (the warehouse count rose from 715 to 914 over the decade) and comparable-sales growth (more sales through the existing base) — which separates durable footprint compounding from the cyclically noisy price effects that flatter the reported figure in some years.
The margin trajectory — thin by design, and slowly widening. Costco’s EBIT margin of 3.8% sits below 4%, and that is the model working exactly as intended, not a sign of weakness. The company deliberately caps merchandise mark-ups and passes scale savings back to members; the profit is earned on turnover and on the membership annuity, not on gross spread. What matters for the investment case is the direction: EBIT margin has climbed from 3.1% in FY2016 to 3.8% in FY2025 — a genuine, if gradual, expansion driven by operating leverage over a broadly fixed SG&A base and by the high-margin membership stream growing faster than merchandise sales. Because the base is so thin, small absolute moves are large in relative terms: the roughly seventy-basis-point rise since FY2016 has lifted EBITDA and net income materially faster than revenue, which is why EBITDA compounded at 12.6% and net income at 15.1% over five years against a 10.5% revenue CAGR. This operating leverage is the single most important dynamic in the P&L, and it is the reason the valuation is so sensitive to even minor margin assumptions.
A note on the gross-margin basis. Costco’s cost-of-sales line is labelled “Merchandise costs” and excludes membership fee revenue, so the reported gross margin of 12.8% is not comparable to a conventional retailer’s gross margin, which would net a very different cost base. The figure should be read only against Costco’s own history and against warehouse-club peers on the same basis. Membership fees flow almost entirely to operating income below the merchandise-margin line, which is precisely why the thin gross margin coexists with strong and rising returns.
Major movers.
-
Membership fee income — the quality engine. The highest-margin, highest-certainty line in the P&L is the annual membership fee, which is deferred and recognised ratably over the one-year term and drops with very little associated cost straight to operating income. Management raised U.S./Canada annual fees effective September 2024, and a substantial portion of the resulting FY2025 fee growth was that price step, with the remainder new sign-ups (F005). [Rating and price target withdrawn — see the note at the top.] Absolute retention remains exceptionally high — this is a slow-moving quality signal to monitor, not a present concern.
-
LIFO cost-inflation swing (YELLOW flag). In FY2025 Costco recorded a charge to increase its cumulative LIFO valuation on U.S. merchandise inventory, reversing the immaterial benefit booked in FY2024; management attributes a small, single-digit-basis-point drag on the gross-margin change to this LIFO charge (F001). The correct reading is that the reported FY2025 gross-margin improvement was struck after absorbing that drag, so underlying core-merchandise margin was better than the headline. The swing from benefit to charge is a direct signal that U.S. merchandise-cost inflation re-accelerated after a benign FY2024, and it carries tariff sensitivity. Because the charge is non-cash and reverses if input costs deflate, it should not be treated as a permanent margin impairment — but persistent inflation would pressure FY2026 gross margin through further LIFO charges.
-
Operating leverage on SG&A. The consistent excess of EBITDA growth over revenue growth is the mechanical result of a largely fixed cost base being spread across a rising sales denominator. This is the structural driver of the margin expansion above and is durable so long as unit growth and traffic hold.
-
[Rating and price target withdrawn — see the note at the top.] Normalised for those discretes, the year-over-year ETR increase is smaller than the printed comparison implies and does not signal a deteriorating tax posture. A separate, slower drag comes from a steadily rising valuation allowance against foreign-tax-credit carryforwards, building for successive years (F003) — a modest structural inefficiency (foreign taxes that will likely never offset U.S. tax) rather than a profitability warning, worth watching as those credit expirations approach later this decade.
Quality of earnings. Earnings quality is high and the disclosures are clean. There are no restructurings, no serial “adjusted” add-backs, and no accounting-policy changes distorting the trend. The one presentational change — adoption of ASU 2023-07, which newly disaggregates merchandise costs and SG&A by reportable segment — is a disclosure enhancement only; it improves the ability to compute segment-level margins and does not affect the comparability of reported totals (F008). The reversal of the FY2024 LIFO benefit to an FY2025 charge (F001) and the FY2024 tax discretes (F004) are the only two items requiring normalisation, and both are fully disclosed.
⚠ Items to Watch. If EBIT margin were to fall back below 3.3%, it would erase roughly two years of operating-leverage gains and would force a re-examination of the margin-expansion assumption underpinning the valuation. A sustained run of LIFO charges (F001) or a continued reserve build in self-insured liabilities feeding SG&A (F002) would be the most likely mechanisms for such a reversal, and either would warrant a downgrade of the operating-leverage thesis.
3.1C Operating Drivers — Unit Economics & the Membership Annuity
sources The revenue and margin analysis above treats the top line as a single line. [Rating and price target withdrawn — see the note at the top.] This is the correct way to underwrite a retailer, and the figures now support it.
Units × productivity — the two engines of the top line. Revenue growth is the product of two independent things: how many warehouses the company operates and how much each existing warehouse sells. On the unit leg, the network grew steadily from 715 clubs at the end of FY2016 to 914 in FY2025 — a self-funded build of new warehouses at a low-single-digit annual pace that compounds and, unlike price, does not reverse with a cycle. On the productivity leg, comparable sales — sales from warehouses open at least thirteen months — added mid-single-digit growth on top, reaching 8.0% on the clean (ex-gas, ex-FX) basis in FY2025. The distinction is what makes the growth durable: unit growth is capital the company controls and reinvests at the elite ROIC documented in 3.4, while comparable-sales growth is the market’s continuing verdict on whether existing clubs keep taking share. Both were positive in every year of the period — the signature of a franchise still working an open runway rather than a mature retailer defending a fixed base.
Signal versus noise in comparable sales. Costco reports comparable sales two ways, and the gap between them is where the analysis lives. The as-reported figure (6.0% in FY2025) carries the direct pass-through of gasoline pump prices and foreign-currency translation; the adjusted figure (8.0% in FY2025) strips both out. In quiet years the two nearly coincide, but they diverge materially — and in opposite directions — precisely when gasoline is volatile, and neither swing tells you anything about traffic or share. In FY2020, collapsing pump prices dragged the reported comp (8.0%) below the underlying business (9.0%); a year later the rebound flipped the sign, and FY2021’s reported comp (16.0%) printed well above the adjusted (13.0%) reading. The adjusted series is the one that carries information about the business; the reported series is the one that moves the tape. We anchor to the adjusted figure throughout this report.
The member base — what the annuity is levered to. Paid memberships grew from 47.6 million in FY2016 to 81.0 million in FY2025, and total cardholders from 86.7 million to 145.2 million — the base to which both the fee annuity and the comparable-sales engine are geared. One discontinuity must be flagged so the trend is not misread: at the end of FY2020 Costco standardised its global membership-counting methodology, mechanically adding a step-change of paid members and cardholders to the FY2020 base with no corresponding restatement of FY2019. Reported FY2020 member growth therefore overstates the organic gain, and any FY2019-to-FY2020 comparison should be read as part methodology change, part genuine sign-ups. From FY2021 onward — the window shown in the table below — the series is again on a consistent basis and needs no such adjustment.
The membership annuity — roughly half the profit engine. Membership fee revenue has approximately doubled over the decade, from $2,646.0M in FY2016 to $5,323.0M in FY2025. Set that against FY2025 operating income of $10,383.0M and the relationship is decisive: the fee stream is worth on the order of half of all operating profit, and because it is deferred and recognised ratably against almost no incremental cost, it is the highest-quality profit in the business. This reframes the thin merchandise margin analysed in 3.1B. The sub-4% EBIT margin and the deliberately capped merchandise mark-ups are not a weakness to be fixed but a design choice: Costco gives merchandise margin back to members in order to sell — and keep — the membership, then earns its economics on the fee annuity and on turnover. The non-standard gross-margin basis noted in 3.1B is the same point seen from the cost side — because membership fees are recognised below the merchandise-margin line, the reported gross margin structurally understates how the company actually makes money.
[Rating and price target withdrawn — see the note at the top.] An honest reading notes two things. [Rating and price target withdrawn — see the note at the top.] Even at the lower, worldwide end, retention this high is precisely what makes the fee stream an annuity rather than a subscription that must be re-won each year.
| Operating KPI | FY2021 | FY2022 | FY2023 | FY2024 | FY2025 |
|---|---|---|---|---|---|
| Warehouses (year-end) | 815 | 838 | 861 | 890 | 914 |
| Paid Members (M) | 61.7 | 65.8 | 71.0 | 76.2 | 81.0 |
| Total Cardholders (M) | 111.6 | 118.9 | 127.9 | 136.8 | 145.2 |
| [Rating and price target withdrawn — see the note at the top.] | 91.0% | 93.0% | 92.7% | 92.9% | 92.3% |
| [Rating and price target withdrawn — see the note at the top.] | 89.0% | 90.0% | 90.4% | 90.5% | 89.8% |
| Comparable Sales — Total (as reported) | 16.0% | 14.0% | 3.0% | 5.0% | 6.0% |
| Comparable Sales — ex-Gasoline & FX | 13.0% | 11.0% | 5.0% | 6.0% | 8.0% |
| Membership Fee Revenue | $3,877.0M | $4,224.0M | $4,580.0M | $4,828.0M | $5,323.0M |
Source: Costco Wholesale Corporation Form 10-K filings (FY2021–FY2025), MD&A operating metrics (warehouse count, membership and renewal statistics, comparable sales) and Consolidated Statements of Income (membership fees); figures per the FL model — see Appendix A.1–A.2. Renewal rates are disclosed by each 10-K for its own fiscal year only and are available from FY2018 onward. Comparable sales exclude the impact of changes in gasoline prices and foreign exchange only in the ex-Gasoline & FX row.
3.2A Balance Sheet
Source: Costco Wholesale Corporation Form 10-K filings (FY2021–FY2025); figures per the FL model — see Appendix A.1–A.2.
3.2B Balance Sheet — Analysis
sources Asset composition. The balance sheet is a hybrid of a capital-intensive real-estate operator and a cash-rich, negative-working-capital retailer. On the asset side it is dominated by owned warehouse property — net PP&E of $31,909.0M in FY2025 — and by a large cash balance of $14,161.0M, while inventory of $18,116.0M turns so quickly that it is a small fraction of total assets relative to a conventional retailer. Goodwill is deliberately immaterial: it first appears in FY2020 following the Innovel logistics acquisition, standing at $994.0M in FY2025, and it is reported inside “Other long-term assets” rather than on the face of the balance sheet — this is an owner-operator that builds rather than buys, so there is essentially no acquisition-driven intangible risk to the book.
Leverage trajectory — a net cash balance sheet. Costco does not run financial leverage in any meaningful sense: net debt is negative in every year of the period, meaning cash and short-term investments exceed total debt, and net debt/EBITDA sits at -0.7x in FY2025 — a net cash position, not leverage. Describing this company as carrying leverage would be a mischaracterisation; the more accurate statement is that the balance sheet holds a substantial cash cushion that funds the warehouse-expansion pipeline and the periodic special dividends internally. Debt is modest and covenant-light: the forensic review found no borrowing-base, cross-default or covenant constraints of note, ample liquidity, and only immaterial short-term facility usage (F010). Management’s stated capital posture — a growing regular dividend plus a modest buyback, punctuated by debt-neutral special dividends — is fully consistent with, and enabled by, this net-cash position. One structural change is worth flagging so it does not read as an error: minority interest fell effectively to zero from FY2023 after Costco bought out the noncontrolling interest in its Taiwan joint venture in FY2022; the step-down is a deliberate ownership consolidation, not a data break.
Working capital — the structural advantage. The single most distinctive feature of the balance sheet is that Costco’s suppliers finance its inventory. By our calculation the cash conversion cycle runs at roughly 2 days in FY2025: inventory turns in under a month at 28 days, receivables are collected in about 4 days (Costco extends no consumer credit), and payables stretch to 30 days — so days payable slightly exceeds days inventory, and the merchandise is effectively sold and cash collected before the supplier is paid. This near-zero, structurally negative operating cycle is a genuine competitive advantage: it means growth is self-funding and that working capital is a source of cash, not a use, as the business expands. The one minor watch item is that receivables grew faster than revenue in FY2024 and FY2025 — receivables turnover eased from 101.7x to 92.9x — but at only a few days of sales and with no consumer-credit exposure, this is immaterial to the cash cycle and warrants monitoring only.
⚠ Items to Watch. Given the net-cash starting point, conventional leverage thresholds are not the relevant risk. The metric to watch is the working-capital signature itself: if the cash conversion cycle turned durably positive — payables no longer covering inventory — it would signal either supplier-term compression or an inventory-management slippage and would remove a structural funding advantage. Separately, a continued build in self-insured liabilities (F002), which rose faster than sales, would pressure SG&A if claims severity keeps rising.
3.3A Cash Flow Statement
| FY2021 | FY2022 | FY2023 | FY2024 | FY2025 | |
|---|---|---|---|---|---|
| Cash from Operations ($M) | $8,958.0M | $7,392.0M | $11,068.0M | $11,339.0M | $13,335.0M |
| — Depreciation & Amortization ($M) | $1,781.0M | $1,900.0M | $2,077.0M | $2,237.0M | $2,426.0M |
| Capital Expenditures ($M) | $3,588.0M | $3,891.0M | $4,323.0M | $4,710.0M | $5,498.0M |
| Free Cash Flow ($M) | $5,370.0M | $3,501.0M | $6,745.0M | $6,629.0M | $7,837.0M |
| FCF Margin | 2.7% | 1.5% | 2.8% | 2.6% | 2.8% |
| FCF / Share | $12.09 | $7.87 | $15.18 | $14.90 | $17.62 |
| FCF Conversion (FCF/NI) | 107.2% | 59.9% | 107.2% | 90.0% | 96.8% |
| CapEx / Revenue | 1.8% | 1.7% | 1.8% | 1.9% | 2.0% |
| CapEx / D&A | 2.0x | 2.0x | 2.1x | 2.1x | 2.3x |
| Dividends Paid ($M) | $5,748.0M | $1,498.0M | $1,251.0M | $9,041.0M | $2,183.0M |
| Share Repurchases ($M) | $496.0M | $439.0M | $676.0M | $700.0M | $903.0M |
Source: Costco Wholesale Corporation Form 10-K filings (FY2021–FY2025); figures per the FL model — see Appendix A.1–A.2.
3.3B Cash Flow — Analysis
sources Quality of operating cash flow. Cash generation is strong, high-quality and improving. Operating cash flow reached $13,335.0M in FY2025 and FCF conversion — free cash flow as a percentage of net income — ran at 96.8% in FY2025, close to one-for-one. That is exactly what the working-capital signature predicts: because the operating cycle is negative and inventory is supplier-financed, reported earnings convert into cash with very little leakage, and in expansion years working capital actually releases cash. There is no gap between accounting profit and cash profit to explain away here — the earnings are cash earnings.
CapEx analysis. Investment intensity is rising, and this is growth capital, not maintenance. Capital expenditure has climbed from $3,588.0M in FY2021 to $5,498.0M in FY2025, and capex runs at 2.3x depreciation in FY2025 — well above the 1.0x line that separates harvest mode from growth investment. A CapEx/D&A ratio comfortably above two tells you the warehouse base is being expanded, not merely maintained: the company is spending roughly twice its depreciation to add new clubs, distribution and e-commerce capacity. The disclosed pipeline of signed-but-not-yet-commenced leases (F010) confirms this forward commitment — it will land on the balance sheet as new right-of-use assets on commencement and is the visible leading edge of the expansion programme. Rising capex compresses near-term free cash flow but is the correct use of capital given the still-open runway for unit growth described in Section 1.
Capital allocation. The allocation hierarchy is clear and disciplined: reinvest first in owned warehouse expansion, return a steadily growing regular dividend second, buy back a modest amount of stock third (largely to offset dilution — repurchases were $903.0M in FY2025), and periodically distribute excess cash through debt-neutral special dividends. That last element is the one that most often misleads a casual reading of the financing statement, and it must be normalised. The dividend series is lumpy by design, not erratic: the FY2024 dividends-paid figure of $9,041.0M was inflated by a large special dividend, exactly as FY2021’s $5,748.0M carried a prior special and FY2017 did before it. Against that, FY2025 dividends paid of $2,183.0M reflect only the regular payout (recently raised). Any payout-ratio, dividend-growth or financing-cash-flow comparison that treats the FY2024-to-FY2025 decline as a policy retrenchment is simply mis-reading the special-dividend cadence (F004). Normalised for the specials, capital return is on a steady upward path funded entirely from internal cash.
⚠ Items to Watch. If capex/D&A were to fall toward 1.0x without a corresponding step-up in comparable-sales productivity, it would signal that the unit-growth runway is closing and would remove the reinvestment leg of the return algorithm — a material change to the compounding thesis. Conversely, a sustained slide in FCF conversion below the level shown here, absent a deliberate working-capital investment, would be the first place a deterioration in earnings quality would surface.
3.4 Returns Analysis
| FY2021 | FY2022 | FY2023 | FY2024 | FY2025 | |
|---|---|---|---|---|---|
| ROIC | 37.2% | 38.2% | 34.6% | 37.5% | 38.5% |
| ROE | 27.9% | 30.6% | 27.5% | 30.3% | 30.7% |
| ROA | 8.7% | 9.5% | 9.5% | 10.6% | 11.0% |
| Interest Coverage | 39.2x | 49.3x | 50.7x | 54.9x | 67.4x |
Source: Company SEC filings (10-K); figures per the FL model — see Appendix A.1–A.2.
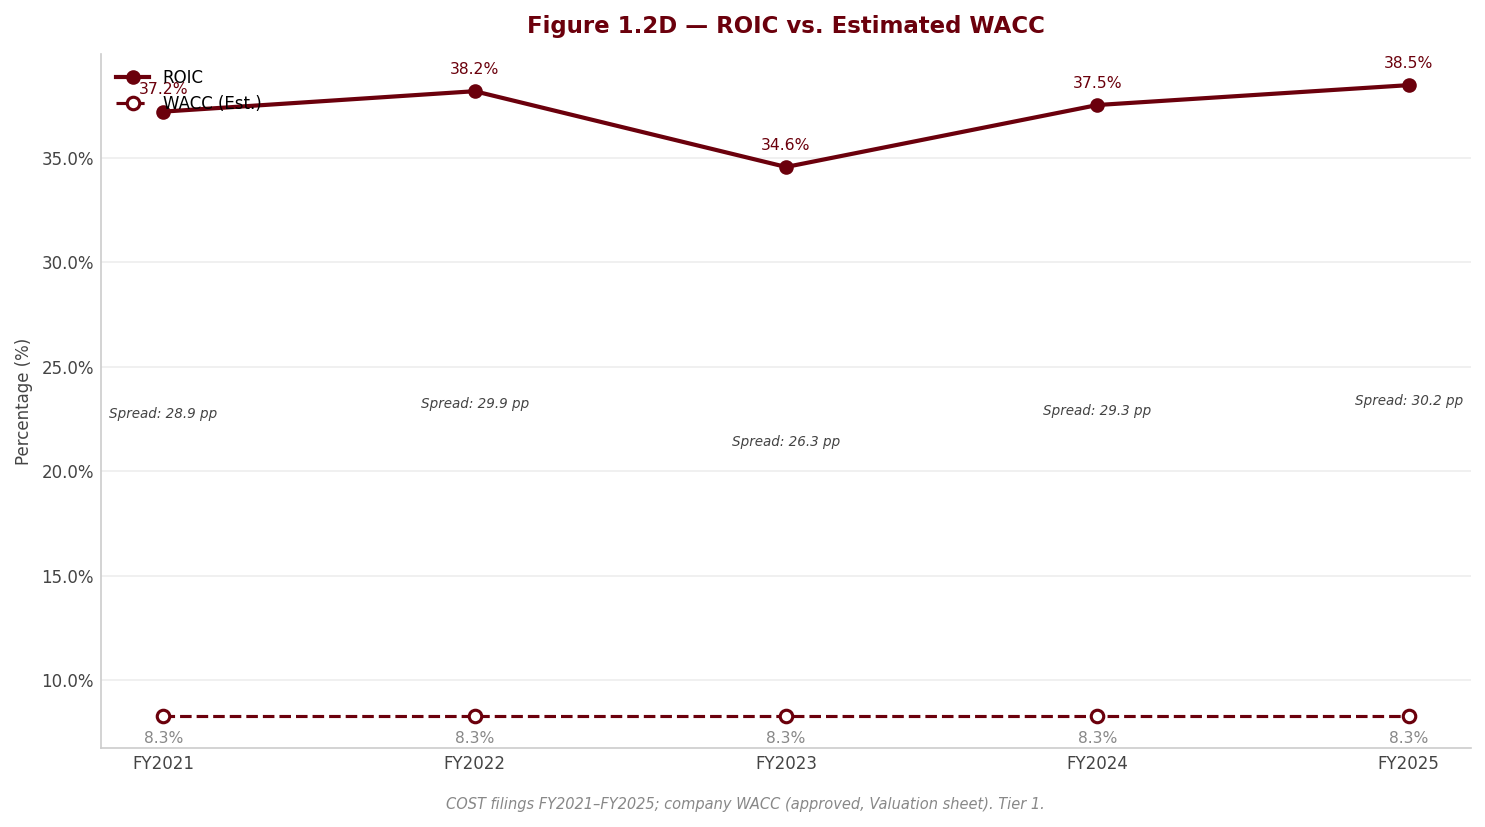
ROIC — the single most important metric. Costco earns exceptional returns on capital: ROIC reached 38.5% in FY2025, up from 18.9% in FY2016, and has held in a high-thirties-percent band throughout the period. This is the number that reconciles the thin margin with the quality of the franchise — a sub-4% EBIT margin turned over at very high asset velocity, on a largely owned asset base, produces returns on invested capital that sit far above the company’s cost of capital (the WACC; ROIC exceeds any reasonable estimate of it by a wide, multiple-of margin). A spread of that magnitude means every incremental dollar Costco reinvests in a new warehouse creates value, which is the analytical justification for the reinvestment-first capital-allocation policy and for the growth-capex intensity documented above. The spread is stable-to-widening, not eroding — the strongest possible evidence that the moat is intact and that the returns are not being competed away.
DuPont decomposition. Pulling FY2025 ROE apart into its three drivers is highly instructive. Net margin is just 2.9%, asset turnover is a very high 3.75x, and the equity multiplier is a modest 2.78x. The picture is unambiguous: asset turnover, not margin or leverage, is what drives the return. Costco manufactures its ROE of 30.7% by selling an enormous volume of goods through a comparatively lean asset base, not by taking price and not by gearing the balance sheet — the equity multiplier is low precisely because the company runs net cash. The swing factor to watch over time is therefore asset turnover: as long as sales velocity per dollar of assets holds, the thin margin is more than sufficient to sustain elite returns. This is a fundamentally different — and more durable — return profile than a leveraged or high-margin retailer, because it depends on operational execution rather than on financial engineering or pricing power that could be competed away.
3.5 Altman Z-Score (Most Recent FY)
| Component | FY2023 | FY2024 | FY2025 |
|---|---|---|---|
| X1 (Working Capital / Total Assets) | 0.033 | -0.017 | 0.016 |
| X2 (Retained Earnings / Total Assets) | 0.283 | 0.252 | 0.294 |
| X3 (EBIT / Total Assets) | 0.118 | 0.133 | 0.135 |
| X4 (Equity / Total Liabilities) | 0.570 | 0.511 | 0.608 |
| X5 (Revenue / Total Assets) | 3.512 | 3.644 | 3.570 |
| Z-Score | 4.37 | 4.47 | 4.50 |
| Zone | Safe | Safe | Safe |
Source: Company SEC filings (10-K); figures per the FL model — see Appendix A.1–A.2.
Interpretation. The Altman score of 4.50 in FY2025 is the Z′ (private-firm) variant, which substitutes book equity for market equity in the X4 term and carries its own, slightly lower, zone thresholds; on that variant’s boundaries it places Costco firmly in the Safe zone, comfortably clear of the safe-zone cut-off, and the score is driven principally by the very high sales-to-assets ratio (X5) that also drives the DuPont return — the same asset-velocity engine shows up in the solvency screen. Credit risk is negligible: interest coverage of 67.4x in FY2025 means operating income covers interest expense many dozens of times over, and the company’s net-cash position removes refinancing risk entirely. This is not a score to over-interpret in the other direction either — it simply confirms what the balance sheet and cash flow already establish, that Costco is one of the most financially secure issuers in the consumer-staples universe and that bankruptcy-risk models have essentially nothing to flag.
4. Valuation withdrawn
This section stated what the shares were worth and what to do about them. It rested on an exit multiple set by hand — across the coverage it averaged 24% below where each company actually traded — so the conclusion largely restated that assumption instead of testing it. Rather than leave it standing, it has been withdrawn while the method is rebuilt.
Nothing else in this report depends on it: the financial analysis above and below is drawn from the company's own filings, and every figure links to the page it was verified against.
Section 5 — Financial Metrics & Peer Benchmarking
sources The central finding of this section can be stated in one sentence, and both halves of it are true: Costco earns the highest returns and the most durable economics of any company in this peer set, and it is also, by a wide margin, the most expensive stock in it. Neither half cancels the other. The benchmarking below establishes the quality case on operating margin, returns on capital and balance-sheet strength; it then shows that on every earnings- and cash-flow-based multiple Costco trades at a large premium to every peer, including BJ’s Wholesale — the one genuine like-for-like comparison in the group. That premium is the entire investment question, and the separate valuation resolves it. This section documents both sides without softening either.
5.1 Peer Selection
sources The peer set is built to triangulate Costco from three directions rather than to flatter it. BJ’s Wholesale Club is the anchor: it is the only other pure membership warehouse-club operator of scale in the United States, runs the same thin-merchandise-margin-plus-membership-fee model, and is therefore the single cleanest read on Costco’s economics in the entire comparable universe — the two companies post near-identical operating margins despite Costco operating at roughly thirteen times the revenue scale. Walmart and Target are the large-format general-merchandise incumbents whose big-box footprint competes directly with Costco for the household basket; Walmart’s Sam’s Club division makes it a partial warehouse-club competitor as well. Kroger anchors the food-retail end of the basket, the category where Costco’s grocery volumes are largest. Amazon is included as the structural disruptor to physical retail, but with an explicit and heavy caveat: it is not a like-for-like comparable, and its figures are directional context only.
The set’s limitations are material and are not hidden. Amazon’s profitability and valuation are dominated by AWS (cloud) and advertising — high-margin businesses that describe a different economic animal than a warehouse club — and its most recent net income is further inflated by large one-time non-operating gains, so its net margin and P/E overstate retail economics; every Amazon comparison in the tables below is flagged and should be read as directional only. Gross margin is not comparable anywhere in this set, for reasons set out in 5.7, which is why operating margin is used as the headline profitability line. And no peer shares Costco’s late-August fiscal year-end: every one of the five sits outside a three-month alignment window, so each peer’s actual reporting period is stated explicitly. All figures are drawn from primary SEC filings; only the market capitalisations used to strike valuation multiples are market-sourced, as of the 2026-08-11 close.
| Peer | Ticker | Exchange | Filing Type | Accounting Standard | Fiscal Year End | Comparability Note |
|---|---|---|---|---|---|---|
| Amazon.com, Inc. | AMZN | NASDAQ | 10-K | US GAAP | December | Not like-for-like — AWS/advertising drive margins and multiples; net income carries one-time non-operating gains. Directional only. |
| Walmart Inc. | WMT | NYSE | 10-K | US GAAP | January | Closest large-cap general-merchandise competitor (incl. Sam’s Club); year-end ~7 months before Costco’s. |
| BJ’s Wholesale Club Holdings, Inc. | BJ | NYSE | 10-K | US GAAP | January/February | The only true warehouse-club comparable; same fee model, ~1/13th the revenue scale. |
| Target Corporation | TGT | NYSE | 10-K | US GAAP | January/February | General-merchandise incumbent; ROE/leverage flattered by buyback-shrunk equity (see 5.7). |
| The Kroger Co. | KR | NYSE | 10-K | US GAAP | January/February | Food-retail benchmark; ROE/leverage flattered by buyback-shrunk equity (see 5.7). |
Source: Peer-company SEC filings; comparability notes in 5.7 — see Appendix A.1.
5.2 Profitability Comparison
sources Comparative: Most Recent Full Fiscal Year
| Metric | Costco Wholesale Corporation | Amazon.com, Inc. | Walmart Inc. | BJ’s Wholesale Club Holdings, Inc. | Target Corporation | The Kroger Co. |
|---|---|---|---|---|---|---|
| Revenue ($M) | $275,235.0M | $716,924.0M | $680,985.0M | $20,501.8M | $106,566.0M | $147,123.0M |
| Gross Margin | 12.8%ⁿ | 50.3%ⁿ | 24.9%ⁿ | 18.4%ⁿ | 28.2%ⁿ | 22.7%ⁿ |
| EBITDA Margin | 4.7% | 20.3%ⁿ | 6.2% | 5.0% | 8.0% | 4.8% |
| EBIT (Operating) Margin | 3.8% | 11.2%ⁿ | 4.3% | 3.8% | 5.2% | 2.6% |
| Net Margin | 2.9% | 10.8%ⁿ | 2.9% | 2.6% | 3.8% | 1.8% |
| FCF Margin | 2.8% | 1.1% | 1.9% | 1.5% | 4.2% | 1.2% |
Source: Peer-company SEC filings; comparability notes in 5.7 — see Appendix A.1.
Flag legend: ⁿ = not comparable on this line (see 5.7); ᵐ = market-sourced (price date 2026-08-11); ᶜ = analyst-computed from filing components. Peer periods: Amazon.com, Inc. FY2025 (Dec-25); Walmart Inc. FY2025 (Jan-25); BJ’s Wholesale Club Holdings, Inc. FY2024 (Feb-25); Target Corporation FY2024 (Feb-25); The Kroger Co. FY2024 (Feb-25).
Operating margin is the headline — and it must be, because gross margin is not comparable across this set. Costco and BJ’s book their high-margin membership fee straight to operating income and exclude it from merchandise cost, so their reported gross margins understate true economics; Walmart, Target and Kroger have no comparable fee stream; and Amazon’s cost of sales excludes fulfilment and technology entirely, defining its ~50% “gross margin” on a different cost base altogether. The gross-margin row is therefore flagged not-comparable in every cell and no cross-peer inference should be drawn from it — it is retained only for completeness. At the operating line, which captures the membership fee, the comparison becomes clean, and it delivers the section’s first key finding: Costco’s operating margin of 3.8% is essentially identical to BJ’s 3.8%, the two warehouse clubs converging on the same thin-margin-plus-fee economics, while Target (5.2%) sits higher on a conventional general-merchandise mark-up and Kroger (2.6%) lower on grocery economics. The apparently large margin gap to Amazon (11.2%) is not a Costco weakness at all; it is the AWS-and-advertising mix showing through, and drawing a margin conclusion from it would be a category error.
The point that matters analytically is that Costco’s thin operating margin is a design choice, not a competitive shortfall. The model deliberately caps merchandise mark-ups and earns its profit on turnover and on the membership annuity — which is precisely why the thin margin coexists with the best returns in the group, as 5.3 shows. Net margin tells the same story in miniature: at 2.9% Costco is in line with Walmart (2.9%) and ahead of BJ’s (2.6%) and Kroger (1.8%); Amazon’s 10.8% is flagged because it is inflated both by the services mix and by large one-time non-operating gains, and is not a retail read. On free-cash-flow margin — the least game-able profitability line — Costco’s 2.8% leads Amazon, Walmart, BJ’s and Kroger, trailing only Target, whose lower capital intensity in a no-growth year lifts the ratio.
Historical: Costco Wholesale Corporation Own 5-Year Progression
| Metric | FY2021 | FY2022 | FY2023 | FY2024 | FY2025 |
|---|---|---|---|---|---|
| Gross Margin | 12.9% | 12.1% | 12.3% | 12.6% | 12.8% |
| EBITDA Margin | 4.3% | 4.3% | 4.2% | 4.5% | 4.7% |
| EBIT (Operating) Margin | 3.4% | 3.4% | 3.3% | 3.6% | 3.8% |
| Net Margin | 2.6% | 2.6% | 2.6% | 2.9% | 2.9% |
| FCF Margin | 2.7% | 1.5% | 2.8% | 2.6% | 2.8% |
Source: Peer-company SEC filings; comparability notes in 5.7 — see Appendix A.1.
The five-year progression confirms that Costco’s edge is structural and slowly widening, not cyclical. Operating margin has climbed from 3.4% in FY2021 to 3.8% in FY2025 — a genuine expansion driven by operating leverage over a broadly fixed cost base and by the high-margin membership stream growing faster than merchandise sales, exactly the dynamic documented in Section 3. This is the opposite of the peer-group pattern, where general-merchandise and grocery margins have been squeezed by promotional intensity and cost inflation. Because Costco’s margin base is so thin, the roughly one-point rise since FY2021 is a large relative move, and it is what has lifted EBITDA and net income materially faster than revenue.
5.3 Returns Comparison
sources Comparative: Most Recent Full Fiscal Year
| Metric | Costco Wholesale Corporation | Amazon.com, Inc. | Walmart Inc. | BJ’s Wholesale Club Holdings, Inc. | Target Corporation | The Kroger Co. |
|---|---|---|---|---|---|---|
| ROIC | 38.5% | 13.5%ᶜ | 16.4%ᶜ | 23.6%ᶜ | 14.1%ᶜ | 11.8%ᶜ |
| ROE | 30.7% | 18.9%ᶜ | 21.4%ᶜ | 28.9%ᶜ | 27.9%ᶜ | 32.2%ᶜ |
| ROA | 11.0% | 9.5%ᶜ | 7.5%ᶜ | 7.6%ᶜ | 7.1%ᶜ | 5.1%ᶜ |
| Asset Turnover | 3.57x | 0.88xᶜ | 2.61xᶜ | 2.90xᶜ | 1.84xᶜ | 2.80xᶜ |
Source: Peer-company SEC filings; comparability notes in 5.7 — see Appendix A.1. PEER ROE is computed on ending parent equity; the SUBJECT’s ROE is computed on average equity, consistent with the DuPont decomposition in Section 3.4. The two are therefore not on an identical basis — on a like-for-like ending-equity basis Costco’s ROE would be lower and would sit mid-group rather than near the top. For Kroger and Target the ending-equity convention additionally inflates the ratio — see 5.7. ROIC, which is unaffected by this basis difference, is the return metric on which the comparison is drawn.
This is where Costco separates from the field. Return on invested capital of 38.5% is the highest in the set by a wide margin — well ahead of the next-best warehouse club, BJ’s at 23.6%, and far above Walmart (16.4%), Target (14.1%), Kroger (11.8%) and Amazon (13.5%). ROIC is the number that reconciles Costco’s thin margin with the quality of the franchise: a sub-4% operating margin turned over at very high asset velocity, on a largely owned asset base, produces returns on capital that sit far above any reasonable estimate of the company’s cost of capital (the WACC and ROIC exceeds it by a multiple). A spread of that magnitude, stable-to-widening across the cycle, is the strongest available evidence that the moat is intact and that returns are not being competed away. It is also the analytical justification for the reinvestment-first capital-allocation policy: every incremental dollar Costco puts into a new warehouse earns a return few competitors can match.
The driver of that return is visible in the asset-turnover line. Costco turns 3.57x of sales through its asset base — the highest in the group, ahead of BJ’s, Kroger and Walmart, and multiples of Amazon’s (0.88x), whose capital-heavy AWS infrastructure depresses velocity. This is the same velocity argument the DuPont decomposition makes in Section 3.4, though note the two sections state it on different bases: the figure here is computed on ENDING total assets, for consistency with the peer column, while Section 3.4 uses AVERAGE assets and therefore prints a slightly higher number. Either way the point is identical — Costco manufactures elite returns through velocity, not through pricing power and not through leverage. That distinction matters most on the ROE line, where the reader must be careful — and where we would caution against reading the table as a ranking at all. Costco’s ROE of 30.7% is computed on average equity, consistent with the DuPont decomposition in Section 3.4, while the peer figures are computed on ending parent equity. Put Costco on the peers’ ending-equity basis and its ROE falls to the middle of the group rather than the top, so the apparent ordering here is partly an artefact of the convention. The more important point survives the basis question: Kroger’s 32.2% and Target’s 27.9% are not evidence of superior operating performance, because both are flattered by aggressive buybacks that have shrunk book equity and mechanically inflate the ratio (Kroger’s is roughly six points lower on an average-equity basis). Costco earns its return on a net-cash balance sheet with a low equity multiplier rather than through financial engineering — which is why we rest the quality case on ROIC, where Costco is genuinely and unambiguously the highest in the group and where no equity-basis convention is involved.
Historical: Costco Wholesale Corporation Own 5-Year Progression
| Metric | FY2021 | FY2022 | FY2023 | FY2024 | FY2025 |
|---|---|---|---|---|---|
| ROIC | 37.2% | 38.2% | 34.6% | 37.5% | 38.5% |
| ROE | 27.9% | 30.6% | 27.5% | 30.3% | 30.7% |
| ROA | 8.7% | 9.5% | 9.5% | 10.6% | 11.0% |
Source: Peer-company SEC filings; comparability notes in 5.7 — see Appendix A.1.
Costco’s own history shows the return profile is not a one-year artefact: ROIC has held in a high-thirties band and ROA has risen steadily from 8.7% in FY2021 to 11.0% in FY2025 as asset productivity improved. These are not returns that revert — they are the compounding signature of a business whose competitive position strengthens with scale.
5.4 Leverage & Liquidity Comparison
sources Comparative: Most Recent Full Fiscal Year
| Metric | Costco Wholesale Corporation | Amazon.com, Inc. | Walmart Inc. | BJ’s Wholesale Club Holdings, Inc. | Target Corporation | The Kroger Co. |
|---|---|---|---|---|---|---|
| Net Debt / EBITDA | -0.7x | -0.4xᶜ | 0.9xᶜ | 0.5xᶜ | 1.3xᶜ | 2.0xᶜ |
| Total Debt / Equity | 0.2x | 0.2xᶜ | 0.5xᶜ | 0.3xᶜ | 1.1xᶜ | 2.2xᶜ |
| Interest Coverage | 67.4x | 35.2xᶜ | 13.1xᶜ | 15.0xᶜ | 13.5xᶜ | 8.6xᶜ |
| Current Ratio | 1.0x | 1.1xᶜ | 0.8xᶜ | 0.7xᶜ | 0.9xᶜ | 1.0xᶜ |
| FCF Margin | 2.8% | 1.1% | 1.9% | 1.5% | 4.2% | 1.2% |
Source: Peer-company SEC filings; comparability notes in 5.7 — see Appendix A.1. Net debt = interest-bearing debt incl. finance leases, excl. operating leases, less cash and short-term investments — a consistent basis across all six companies (see 5.7).
Costco has the strongest balance sheet in the group, and it is not close. Net debt/EBITDA of -0.7x is a net-cash position — cash and short-term investments exceed total debt — which the peer table throws into sharp relief: only Amazon (-0.4x) shares that net-cash luxury, while BJ’s (0.5x), Walmart (0.9x), Target (1.3x) and Kroger (2.0x) all carry real, if manageable, net debt. The contrast with BJ’s is the most instructive single comparison in this table: the two warehouse clubs run nearly identical operating margins and return profiles, but Costco funds its expansion from a cash surplus while BJ’s runs modest net leverage — a direct reflection of the scale and cash-generation gap between them. Kroger’s and Target’s higher debt/equity ratios (2.2x and 1.1x) are partly the same buyback-driven equity shrinkage flagged in 5.3, so they overstate true leverage; the net-debt/EBITDA line is the cleaner read, and even on that basis both sit well above Costco.
Interest coverage of 67.4x confirms that debt service is a non-issue — operating income covers interest dozens of times over, far ahead of every peer and a direct consequence of the net-cash posture. The current ratio of 1.0x looks unremarkable, but it understates liquidity rather than signalling a constraint: like BJ’s and Walmart, Costco runs a deliberately lean current position because its negative cash-conversion cycle means suppliers finance the inventory, so a current ratio near 1.0x sits alongside genuine financial flexibility, not tightness. The clear read across this table is that Costco is under-levered relative to its cash-generation capacity — a conservatism entirely consistent with a management team that funds growth internally and returns surplus cash through periodic special dividends rather than gearing the balance sheet.
5.5 Valuation Multiples Comparison
sources Comparative: Current Price
| Metric | Costco Wholesale Corporation | Amazon.com, Inc. | Walmart Inc. | BJ’s Wholesale Club Holdings, Inc. | Target Corporation | The Kroger Co. |
|---|---|---|---|---|---|---|
| EV/EBITDA | 32.0xᵐ | 19.8xᵐⁿ | 22.2xᵐ | 12.1xᵐ | 9.4xᵐ | 6.8xᵐ |
| P/E | 51.9xᵐ | 37.9xᵐⁿ | 46.4xᵐ | 22.5xᵐ | 16.9xᵐ | 12.9xᵐ |
| FCF Yield | 1.9%ᵐ | 0.3%ᵐ | 1.4%ᵐ | 2.6%ᵐ | 6.5%ᵐ | 5.2%ᵐ |
Source: Peer-company SEC filings; comparability notes in 5.7 — see Appendix A.1.
All valuation multiples are market-sourced (ᵐ): market capitalisations as of the 2026-08-11 close, every denominator (EBITDA, net income, FCF) from the primary filing. Subject to change with price movements. Amazon multiples (ᵐⁿ) are additionally distorted — see 5.7.
This is the other half of the finding, and it is unambiguous: Costco is the most expensive stock in the group on every earnings- and cash-flow multiple. EV/EBITDA of 32.0x is the highest in the set, well above Walmart (22.2x) and Amazon (19.8x), and roughly two-and-a-half times BJ’s (12.1x) — the crucial comparison, because BJ’s is the one true like-for-like peer, running the same margins and return structure at smaller scale. On P/E the premium is starker still: 51.9x against BJ’s 22.5x, Target’s 16.9x and Kroger’s 12.9x. Even Amazon’s 37.9x P/E — itself flattened by the one-time gains that inflated its denominator — sits below Costco’s. The free-cash-flow yield closes the circle from the buyer’s side: at 1.9% Costco offers the thinnest cash yield of any operationally comparable name in the table, below Target and Kroger by a wide margin.
The premium is a fact, and this section presents it as one; it does not argue the peers are “cheap on a like basis,” because the comparability caveats in 5.7 caution against reading the lagged, buyback-distorted peer multiples too literally. What the table establishes is narrower and more important: the market is paying far more for a dollar of Costco’s earnings and cash flow than for the same dollar at any peer, including the identical-economics warehouse club next door. A premium of that size can be justified only by superior and more durable quality — which 5.2 through 5.4 document is genuinely present — or it cannot be justified at the current price at all. That is precisely the question the separate valuation adjudicates through the intrinsic valuation. This section’s job is to size the premium honestly, and the premium is large.
Historical: Costco Wholesale Corporation EV/EBITDA (period-end price)
| FY2021 | FY2022 | FY2023 | FY2024 | FY2025 |
|---|---|---|---|---|
| 23.5x | 23.6x | 23.2x | 34.1x | 32.1x |
Source: Peer-company SEC filings; comparability notes in 5.7 — see Appendix A.1.
Costco is expensive not only against peers but against its own history. [Rating and price target withdrawn — see the note at the top.] A meaningful share of the total shareholder return over this window is therefore multiple expansion rather than fundamental compounding, which is the classic setup for a high-quality business whose price has outrun even a rising intrinsic value. [Rating and price target withdrawn — see the note at the top.]
5.6 Efficiency Comparison
| Metric | Costco Wholesale Corporation | Amazon.com, Inc. | Walmart Inc. | BJ’s Wholesale Club Holdings, Inc. | Target Corporation | The Kroger Co. |
|---|---|---|---|---|---|---|
| Days Sales Outstanding | 4 days | —ᶜ | —ᶜ | —ᶜ | —ᶜ | —ᶜ |
| Days Inventory Outstanding | 28 days | —ᶜ | —ᶜ | —ᶜ | —ᶜ | —ᶜ |
| Days Payables Outstanding | 30 days | —ᶜ | —ᶜ | —ᶜ | —ᶜ | —ᶜ |
| Cash Conversion Cycle | 2 days | —ᶜ | —ᶜ | —ᶜ | —ᶜ | —ᶜ |
| CapEx / Revenue | 2.0% | 18.4%ᶜ | 3.5%ᶜ | 2.9%ᶜ | 2.7%ᶜ | 2.7%ᶜ |
Source: Peer-company SEC filings; comparability notes in 5.7 — see Appendix A.1.
The efficiency table is where Costco’s operational advantage becomes tangible. Inventory turns in 28 days — the fastest merchandise cycle in the group — and because payables stretch to 30 days, the cash conversion cycle runs at just 2 days, effectively at zero. In plain terms, Costco sells the goods and collects the cash before it has to pay the supplier, so its suppliers finance its inventory. This near-zero operating cycle is a structural funding advantage that compounds with growth: expansion releases working capital rather than consuming it, which is why the business self-funds its new-warehouse programme without leaning on the balance sheet. BJ’s, running the same club model, achieves a similarly tight cycle, confirming this is a warehouse-club characteristic rather than a Costco-specific quirk — but Costco executes it at the largest scale in the set. Days sales outstanding of 4 days is negligible across the merchant peers, as expected for cash-and-card retail that extends no consumer credit; Amazon’s higher receivables reflect its third-party-seller and AWS billing, another reminder of its different business mix.
The CapEx/Revenue line rewards careful reading. Costco’s 2.0% looks low, and relative to the warehouse footprint it owns it is genuinely capital-efficient — but this is unmistakably growth capital, running well above depreciation as Section 3 documented, not a harvested asset base. The contrast with Amazon (18.4%) is the sharpest in the table: Amazon reinvests at a multiple of Costco’s intensity to build out cloud and logistics infrastructure, which is why its free-cash-flow margin is thin despite high reported profitability. Against the physical-retail peers — Walmart (3.5%), BJ’s (2.9%), Target (2.7%) and Kroger (2.7%) — Costco’s capital intensity is broadly comparable, but it converts that spend into far higher returns on capital, which is the whole point: the same reinvestment dollar simply works harder here.
5.7 Comparability Caveats
sources The credibility of the benchmarking above depends on these caveats being read alongside the tables, not after them. Every material issue below is respected in the figures themselves through the flag superscripts.
Amazon is not a like-for-like comparable (MATERIAL — affects AMZN margins, returns and all multiples). Amazon’s profitability and valuation are dominated by AWS (cloud) and advertising, which carry structurally higher margins than any warehouse-club or general-merchandise retailer; its operating, EBITDA and net margins describe a cloud-and-advertising business, not merchandise retail, and are flagged not-comparable (ⁿ) throughout 5.2. Compounding this, Amazon’s most recent net income is inflated by large one-time non-operating gains, so its net margin and P/E overstate underlying retail economics — the P/E and EV/EBITDA in 5.5 carry the additional ⁿ flag for that reason. Amazon’s ending-equity ROE is separately depressed by a large swing in accumulated other comprehensive income. No margin-gap or valuation conclusion between Costco and Amazon should be drawn; Amazon is directional context only.
Gross margin is not comparable anywhere in this set (MATERIAL — affects all six companies). Costco and BJ’s earn a high-margin membership fee that flows almost entirely to operating income, and their merchandise-cost line excludes that fee, so a merchandise gross margin understates their true economics. Walmart, Target and Kroger have no comparable separately-reported fee stream. Amazon’s cost of sales excludes fulfilment, technology and content, defining its ~50% gross margin on an entirely different cost base. Every gross-margin cell in 5.2 is therefore flagged not-comparable (ⁿ), and the analysis uses operating margin — which captures the membership fee — as the comparable profitability line. No cross-peer gross-margin inference is drawn anywhere in this section.
Fiscal periods do not align (MATERIAL — affects all five peers). Costco’s FY2025 ended 31 August 2025. No peer shares that year-end: Amazon reports to December (about four months after Costco), Walmart to January (about seven months before), and BJ’s, Target and Kroger to the Saturday nearest end-January/February (fiscal 2024, about six months before). The four January/February-end retailers are placed on the same calendar period so they are internally consistent, but all five peers fall outside a three-month alignment window with Costco, and the January-end peers’ data is roughly six-to-seven months older than Costco’s. This adds a second timing layer to the valuation multiples in 5.5: each peer’s lagged fiscal-year fundamentals are paired with a current market price, so a peer whose earnings have grown since its year-end — Walmart most notably — will show an optically elevated P/E. Each company’s actual period is stated in the 5.1 table and the 5.2 flag line.
BJ’s is the closest true comparable (INFORMATIONAL — anchors the warehouse-club read). Costco and BJ’s are the only pure warehouse-club operators in the set, both running thin merchandise margins offset by membership fees. Their operating margins are nearly identical (3.8% versus 3.8%), which makes BJ’s the cleanest single benchmark for Costco’s economics. The two diverge on scale and balance sheet: Costco operates at roughly thirteen times BJ’s revenue and from a net-cash position, against BJ’s modest net debt. This is the comparison that most sharply frames the valuation premium in 5.5 — the same business model, priced at more than double the multiple.
Kroger’s and Target’s ROE and leverage are flattered by buyback-shrunk equity (INFORMATIONAL — affects KR/TGT ROE, net debt/EBITDA, debt/equity). PEER ROE figures in this section are computed on ending parent equity for consistency across the peer set; the SUBJECT’s ROE is computed on average equity, matching the DuPont decomposition in Section 3.4, so the subject and the peers are not on an identical basis and the ROE column should not be read as a strict ranking (see the note under the 5.3 table). For Kroger and Target, aggressive buybacks have shrunk book equity, mechanically inflating both ROE and debt/equity; on an average-equity basis Kroger’s ROE is roughly six points lower than the 32.2% shown. Kroger’s high ROE should not be read as superior operating performance, and its and Target’s debt/equity overstate true leverage — the net-debt/EBITDA line, computed on a consistent interest-bearing-debt basis (including finance leases, excluding operating leases), is the cleaner leverage read.
All valuation multiples are market-sourced (INFORMATIONAL — affects EV/EBITDA, P/E, FCF yield). The market capitalisations used to strike every multiple in 5.5 are taken from a public aggregator as of the 2026-08-11 close, purely to value the equity; every denominator — EBITDA, net income, revenue, free cash flow — is the primary-filing figure. No hard financial figure in this section comes from an aggregator. Multiples move with price and are current as of that date. Read against these caveats, the conclusion of 5.5 stands undiminished: Costco trades at a large, real premium to every peer, and whether that premium is warranted is the subject of the separate valuation.
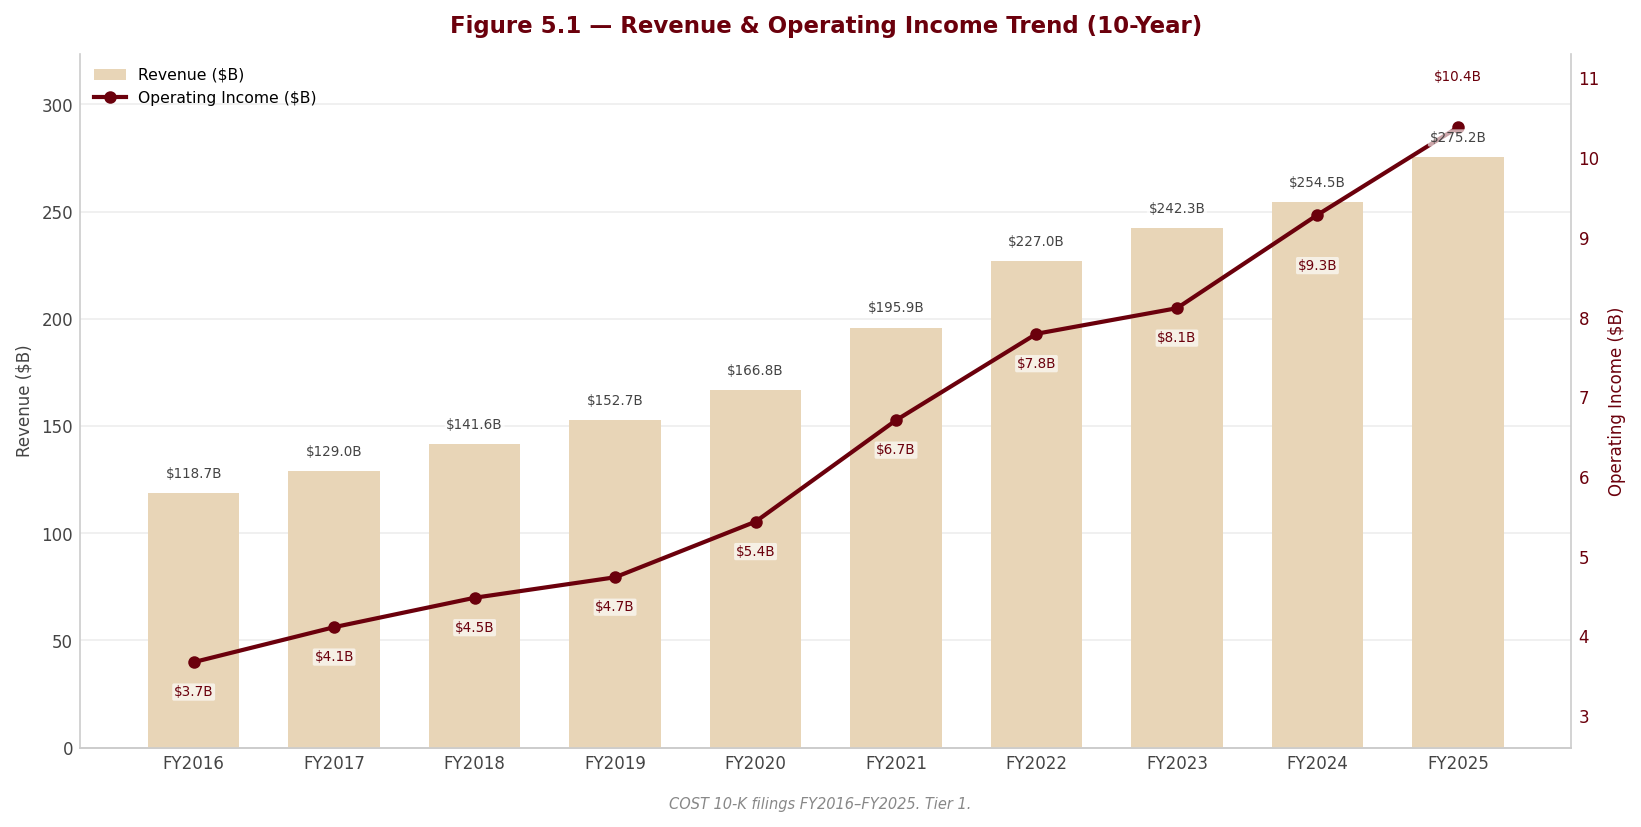
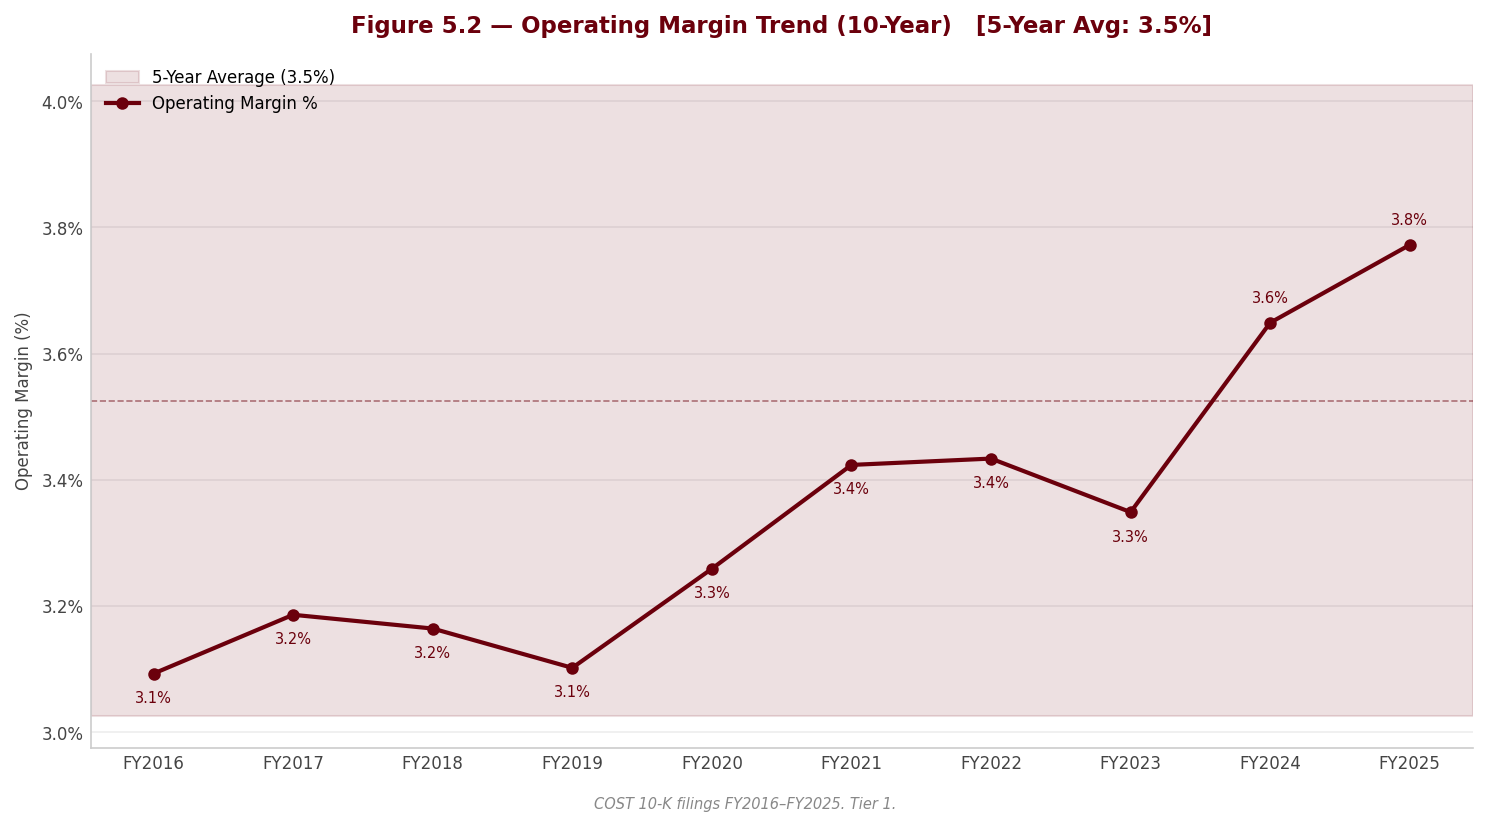
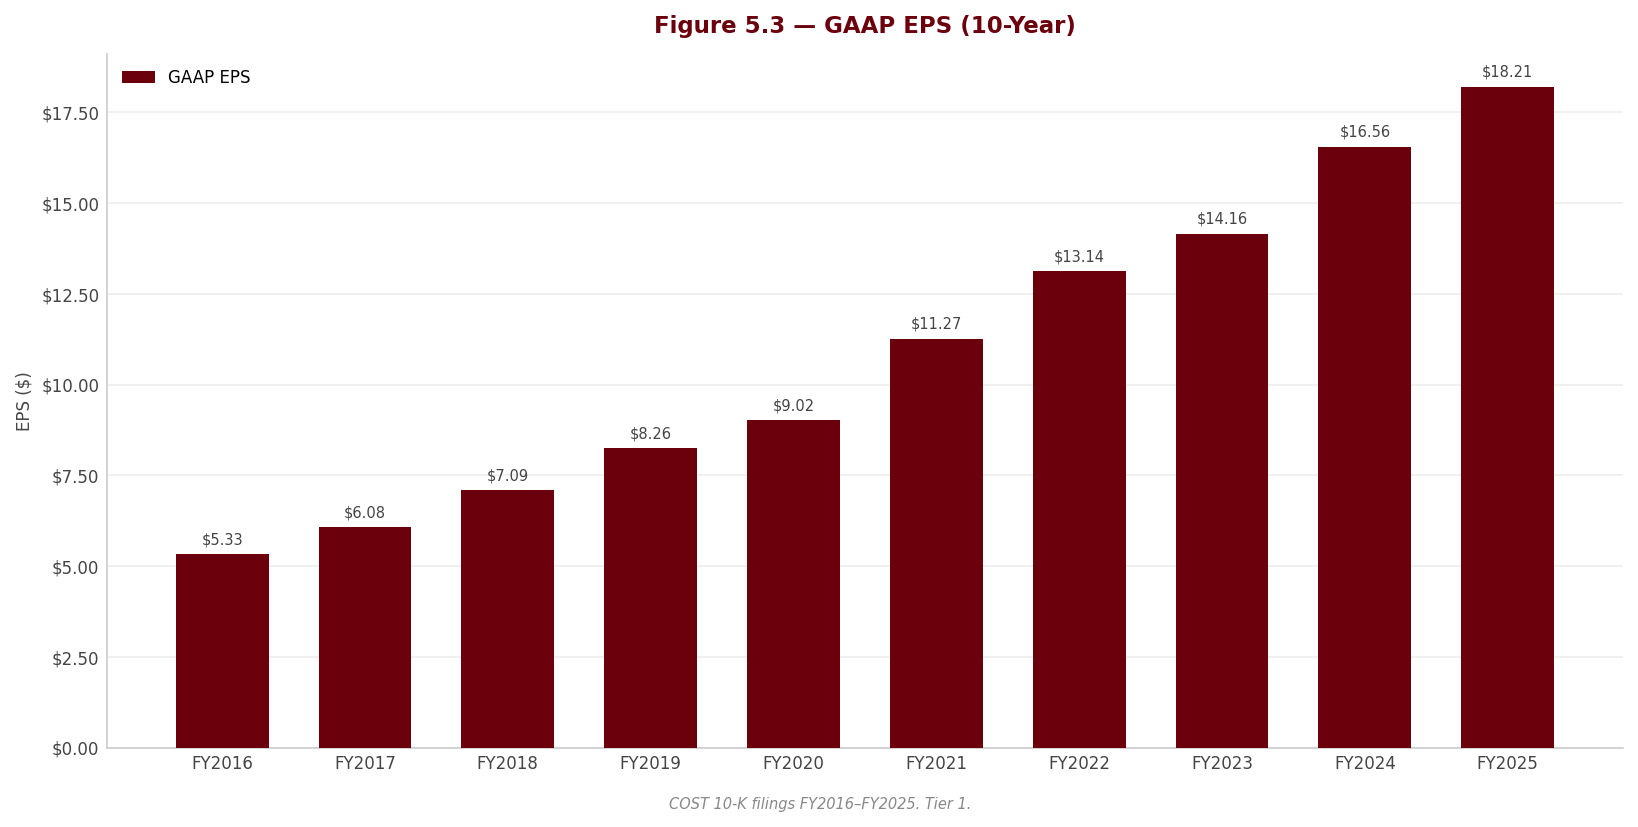
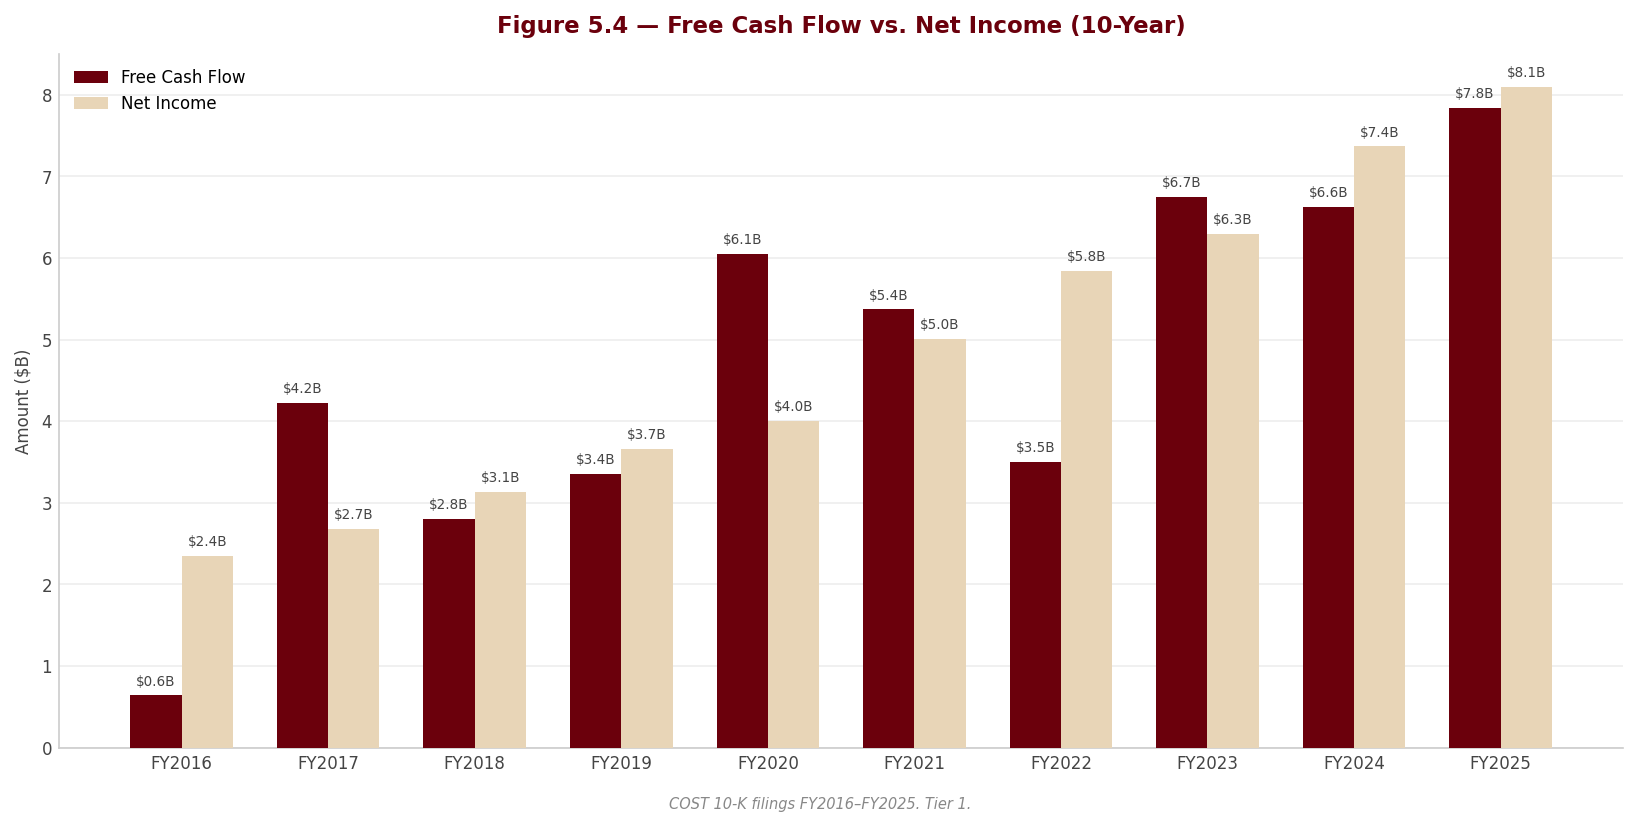
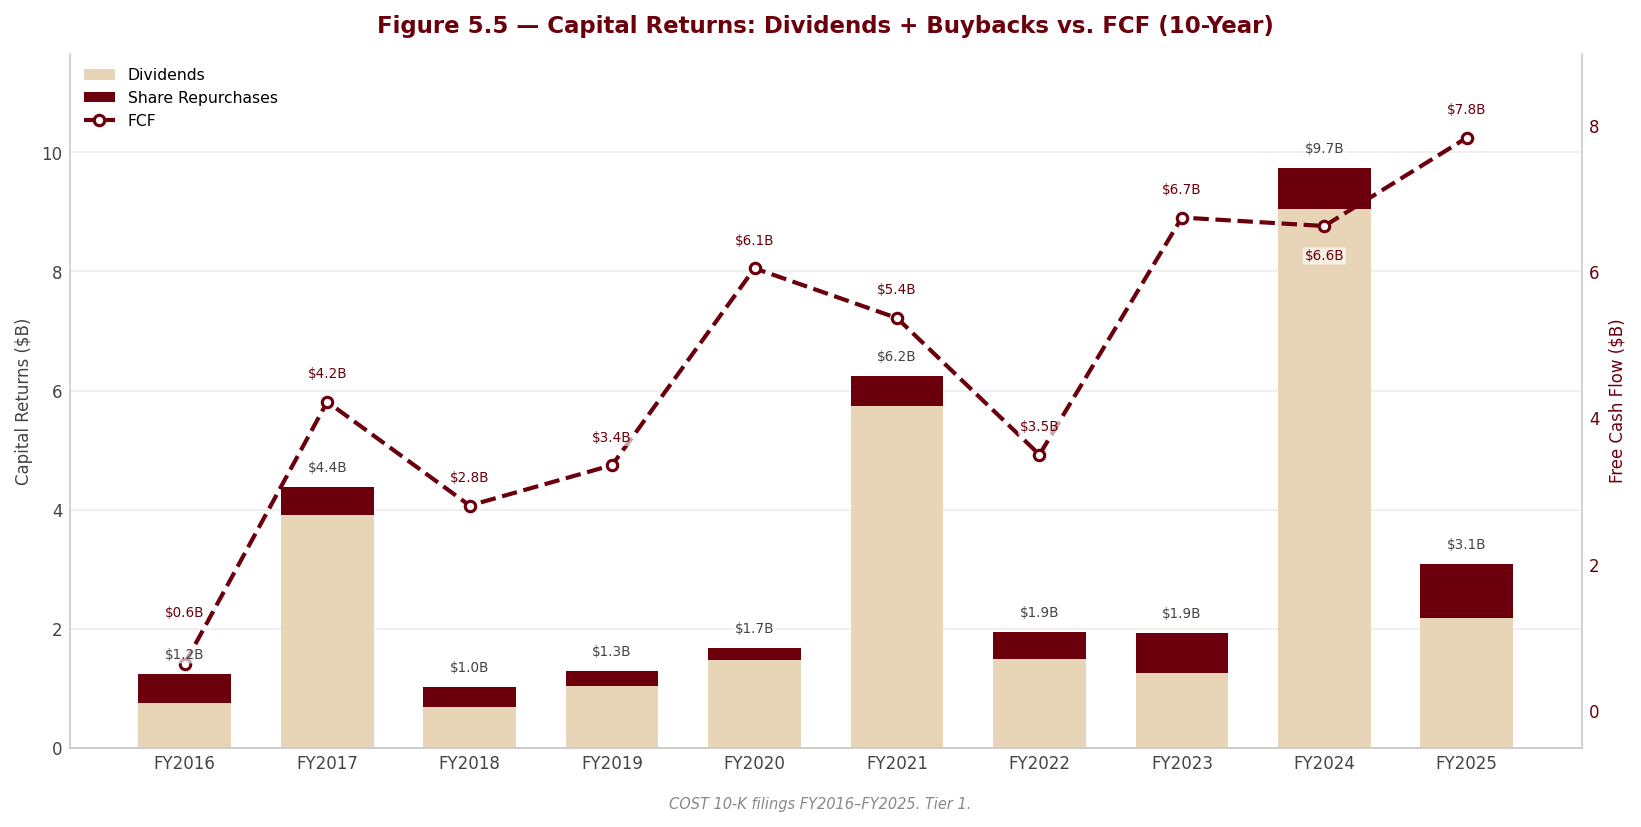
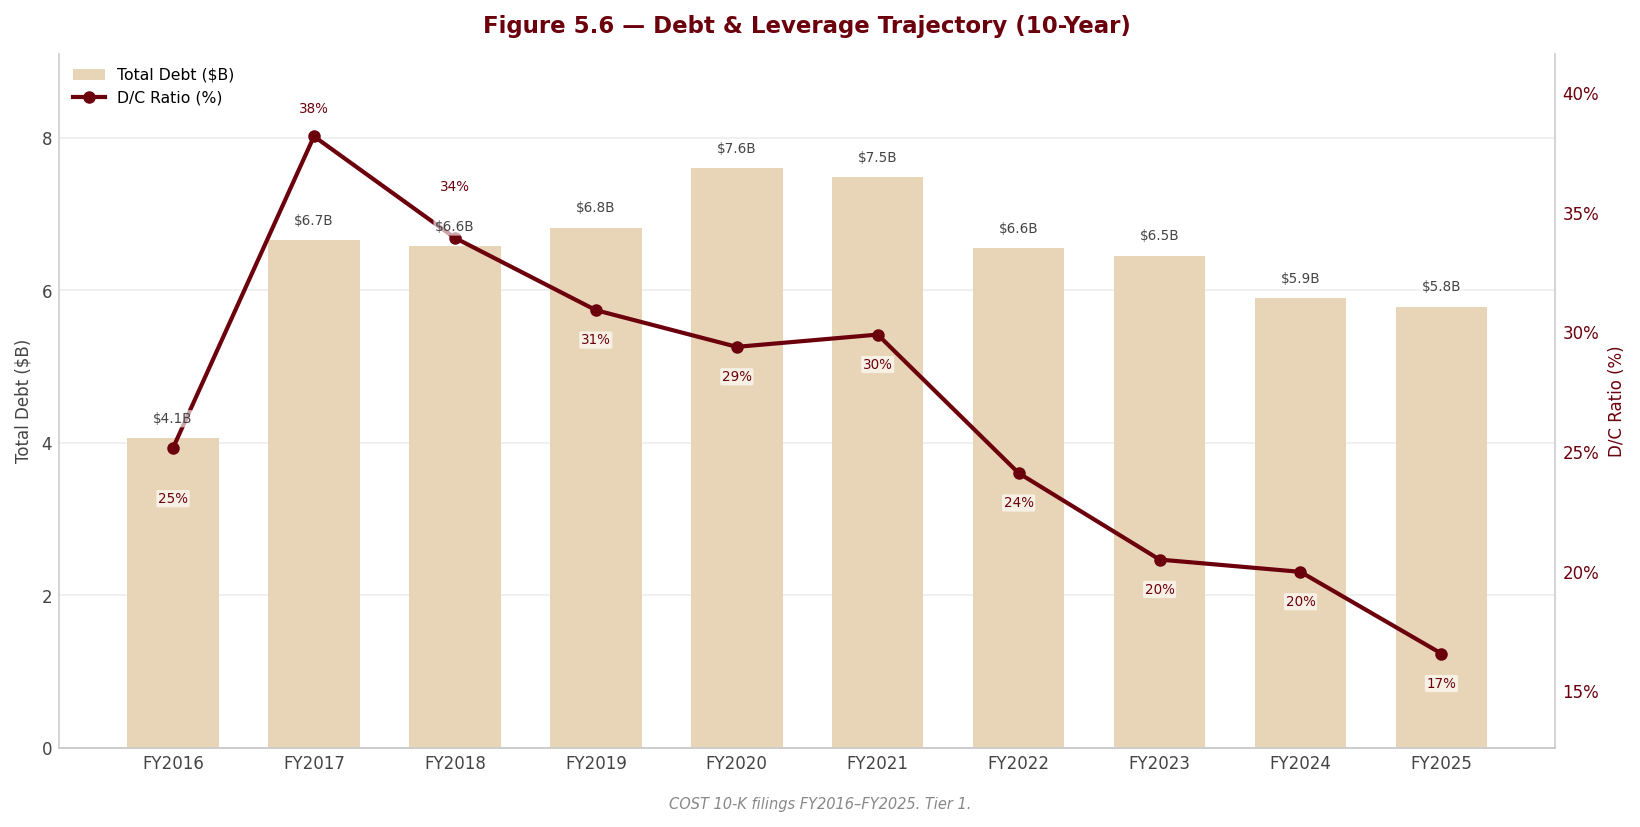
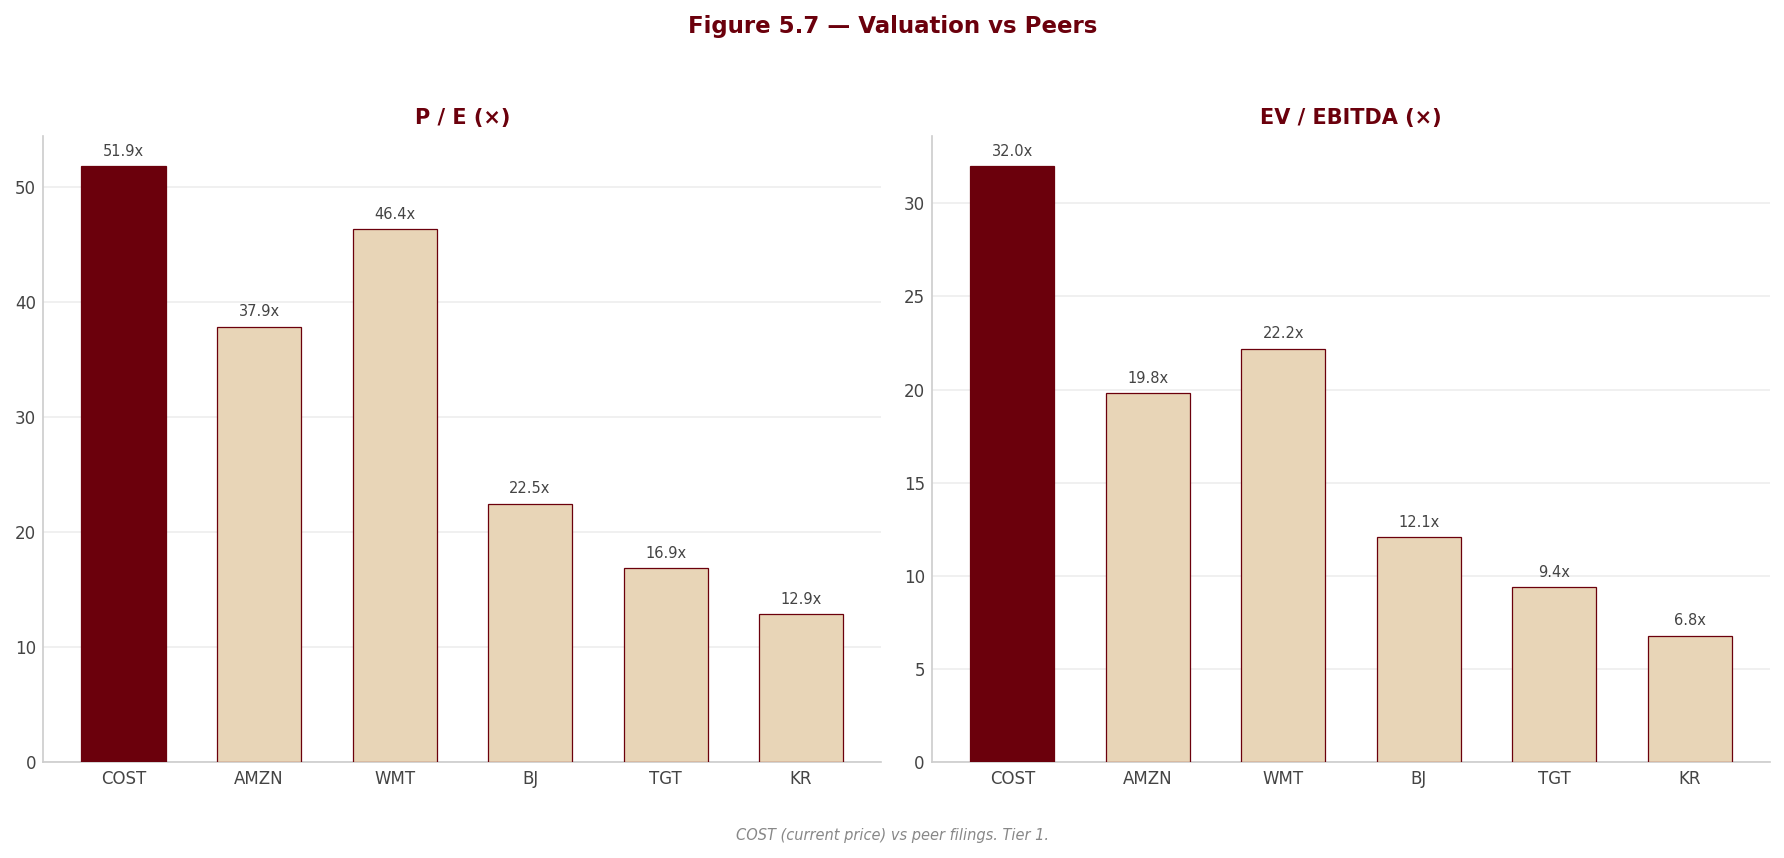
6. Valuation & Price Target withdrawn
This section stated what the shares were worth and what to do about them. It rested on an exit multiple set by hand — across the coverage it averaged 24% below where each company actually traded — so the conclusion largely restated that assumption instead of testing it. Rather than leave it standing, it has been withdrawn while the method is rebuilt.
Nothing else in this report depends on it: the financial analysis above and below is drawn from the company's own filings, and every figure links to the page it was verified against.
Section 7 — Quarterly Update: Q3 2026
Portfolio Action
[Rating and price target withdrawn — see the note at the top.]
| Assessment | |
|---|---|
| Action | [Rating and price target withdrawn — see the note at the top.] |
| Reason | [Rating and price target withdrawn — see the note at the top.] |
| Thesis intact? | YES — and uncomfortably so. The thesis is a valuation call, not an operating call (Section 2): the risk is multiple compression, not an earnings miss. [Rating and price target withdrawn — see the note at the top.] |
| Trigger to revisit | [Rating and price target withdrawn — see the note at the top.] Upward: a multiple reset that takes the price to the $820.00 target. |
7.1 Results at a Glance
| Metric | Q3 2026 | Q3 2025 | YoY Δ | Q2 2026 | QoQ Δ |
|---|---|---|---|---|---|
| Revenue ($M) | $70,527.0M | $63,205.0M | +11.6% | $69,597.0M | +1.3% |
| Gross Profit ($M) ᵃ | $9,008.0M | $8,209.0M | +9.7% | $8,878.0M | +1.5% |
| Gross Margin | 12.77% | 12.99% | -0.22 pp | 12.76% | +0.02 pp |
| EBITDA ($M) | $3,412.0M | $3,082.0M | +10.7% | $3,203.0M | +6.5% |
| EBITDA Margin | 4.84% | 4.88% | -0.04 pp | 4.60% | +0.24 pp |
| EBIT ($M) | $2,815.0M | $2,530.0M | +11.3% | $2,606.0M | +8.0% |
| EBIT Margin | 3.99% | 4.00% | -0.01 pp | 3.74% | +0.25 pp |
| Net Income ($M) | $2,192.0M | $1,903.0M | +15.2% | $2,035.0M | +7.7% |
| Net Margin | 3.11% | 3.01% | +0.10 pp | 2.92% | +0.18 pp |
| Diluted EPS | $4.93 | $4.28 | +15.2% | $4.58 | +7.6% |
YoY Δ is computed as (CQ - PYSQ) / |PYSQ| × 100; for revenue, (70,527 - 63,205) / |63,205| × 100 = +11.6%. QoQ Δ is computed as (CQ - PQ) / |PQ| × 100; for revenue, (70,527 - 69,597) / |69,597| × 100 = +1.3%. Margins are computed on total revenue; gross margin Q3 2026 = 9,008 / 70,527 × 100 = 12.77%, and the margin delta is expressed in percentage points, 12.77% - 12.99% = -0.22 pp.
ᵃ Definitional note. This report defines gross profit as total revenue (including membership fees) less merchandise costs. Costco’s own MD&A defines “gross margin” as net sales less merchandise costs and reports it as $7,635M, or 11.04% of net sales, versus $6,969M and 11.25% a year ago — a 21 bp decline (10-Q p. 22). Both measures fall by a similar amount for the same reason (see 7.2). Neither is a like-for-like comparability problem; the figures are reconcilable through membership fee revenue of $1,373M in Q3 2026 and $1,240M in Q3 2025 (10-Q p. 3).
Source: Costco Wholesale Corporation Form 10-Q for the quarterly period ended May 10, 2026 — Condensed Consolidated Statements of Income (p. 3); segment depreciation and amortization (p. 17); MD&A Gross Margin (p. 22).
7.2 P&L Drivers
sources Revenue: Net sales rose $7,189M, or 12%, to $69,154M, with comparable sales up 10% and 23 net new warehouses opened since the end of Q3 2025 contributing the balance (10-Q p. 21). The composition is healthy on both axes — average ticket +7% and shopping frequency +2% — but the headline is materially inflated by two items management quantifies: higher gasoline prices added $1,367M, or 221 basis points, and currency added approximately $643M, or 104 basis points, so comparable sales excluding gasoline and currency were 7%, not 10% (10-Q pp. 20–22). Growth was broad: U.S. revenue $51,434M (+11.0%), Canada $9,410M (+13.1%) and Other International $9,683M (+13.0%), with segment operating income up 9.3%, 12.4% and 18.8% respectively (10-Q p. 16). [Rating and price target withdrawn — see the note at the top.]
[Rating and price target withdrawn — see the note at the top.] The reported gross margin decline is an optics effect, not a deterioration: excluding gasoline price inflation, gross margin percentage was 11.26%, up one basis point (10-Q p. 22), because a higher gasoline sales base inflates the denominator at a structurally lower margin. Underlying margin was therefore stable. The quality of that stability is the issue: within it, a smaller LIFO charge added 14 basis points (≈$97M on $69,154M of net sales) and the absence of last year’s one-time increased-employee-vacation charge added 2 basis points to gross margin and 5 basis points to SG&A (≈$48M combined), while core merchandise categories cost 29 basis points, primarily foods and sundries and fresh foods (10-Q pp. 22–23). SG&A leverage was real but thin — 8.96% of net sales versus 9.16%, and excluding gasoline price inflation 9.14%, an improvement of only two basis points (10-Q p. 23) — with SG&A of $6,193.0M versus $5,679.0M.
Below the line: Interest expense fell to $32.0M from $35.0M, while interest income and other, net rose to $155M from $85M — of which interest income was $130M versus $95M on higher cash balances and a $34M swing in foreign-currency transaction gains (+$17M versus -$17M) (10-Q p. 24) — so $70M, or 19.6%, of the $358M increase in pre-tax income came from below the operating line. [Rating and price target withdrawn — see the note at the top.] Diluted shares were essentially unchanged at 444,430 thousand versus 444,762 thousand (10-Q p. 13), so EPS growth is earnings-driven, not buyback-driven.
7.3 Balance Sheet & Cash Flow
| Metric | Q3 2026 | Q3 2025 | YoY Δ | Q2 2026 | QoQ Δ |
|---|---|---|---|---|---|
| Cash ($M) | $18,946.0M | $13,836.0M | +36.9% | $17,383.0M | +9.0% |
| Net Debt ($M) ᵇ | -$13,276.0M | -$8,119.0M | -63.5% | -$11,695.0M | -13.5% |
| Net Debt / LTM EBITDA ᵃ | -0.96× | — | — | — | — |
| Total Assets ($M) | $86,430.0M | $75,482.0M | +14.5% | $83,639.0M | +3.3% |
| Equity ($M) | $33,509.0M | $27,125.0M | +23.5% | $32,087.0M | +4.4% |
| OCF ($M) ᶜ | $3,449.0M | $3,460.0M | -0.3% | $2,996.0M | +15.1% |
| CapEx ($M) ᵈ | $1,413.0M | $1,131.0M | +24.9% | $1,289.0M | +9.6% |
| FCF ($M) ᶜ | $2,036.0M | $2,329.0M | -12.6% | $1,707.0M | +19.3% |
| Dividends Paid ($M) ᵉ | $0.0M | $515.0M | -100.0% | $577.0M | -100.0% |
YoY Δ is computed as (CQ - PYSQ) / |PYSQ| × 100; for cash, (18,946 - 13,836) / |13,836| × 100 = +36.9%. QoQ Δ is computed as (CQ - PQ) / |PQ| × 100; for cash, (18,946 - 17,383) / |17,383| × 100 = +9.0%. Net debt is negative because the company holds net cash, so the YoY and QoQ percentages shown are the growth of the net cash position, not an increase in leverage.
ᵃ Net Debt / LTM EBITDA: LTM EBITDA = Q4 2025 $4,115M + Q1 2026 $3,060M + Q2 2026 $3,203M + Q3 2026 $3,412M = $13,790M (Q4 2025 is a 16-week quarter and the other three are 12-week quarters, so the four sum to a full 52-week year). Net Debt Q3 2026 / LTM EBITDA = -13,276 / 13,790 = -0.96×. The comparative columns are shown as em dashes because a single-point leverage ratio is the only meaningful presentation of this row.
ᵇ Net debt is long-term debt of $5,670M less cash and cash equivalents of $18,946M (10-Q pp. 5, 11). Costco presents no current portion of long-term debt on the face of the condensed balance sheet at May 10, 2026 (the current portion was $75M at August 31, 2025 and is $0 now; 10-Q p. 11); short-term borrowings under bank credit facilities of $96M sit inside other current liabilities and are not separately presented (10-Q p. 26). Short-term investments of $1,050M are excluded from this definition; including them, cash and short-term investments were $19,996M versus $15,284M at fiscal year-end (10-Q p. 25).
ᶜ Standalone-quarter operating cash flow and free cash flow are not presented directly: the 10-Q’s cash flow statement is year-to-date (36 weeks). Q3 2026 OCF is derived as the 36-week figure of $11,133M (10-Q p. 8) less the 24-week figure of $7,684M reported in the Q2 2026 Form 10-Q; Q3 2025 OCF as $9,468M less $6,008M on the same basis. FCF = OCF - CapEx.
ᵈ CapEx is disclosed directly for the 12-week quarter in the segment note as additions to property and equipment (10-Q p. 17) and is shown as a positive outflow figure per the workbook’s storage convention.
ᵉ Dividends paid in Q3 2026 were $0M — this is a payment-timing fact, not a suspension. The $1.47 per share quarterly dividend was declared on April 15, 2026 and paid on May 15, 2026, five days after the May 10, 2026 quarter end; the 10-Q discloses $652M of dividends declared but not yet paid at the balance sheet date (10-Q pp. 8, 12). The comparable Q3 2025 quarter did carry a $515M payment because the fiscal 2025 calendar fell differently. The dividend was raised 13.1%, from $1.30 to $1.47 per share (10-Q p. 12). §
Source: Costco Wholesale Corporation Form 10-Q for the quarterly period ended May 10, 2026 — Condensed Consolidated Balance Sheets (p. 5), Condensed Consolidated Statements of Cash Flows (p. 8), Note 4 Debt (p. 11), Note 5 Equity (p. 12), segment capital expenditure (p. 17), MD&A Liquidity (pp. 25–26); Q2 2026 Form 10-Q Condensed Consolidated Statements of Cash Flows (p. 8) for the 24-week comparatives used in the standalone-quarter derivation.
Balance sheet note: The balance sheet strengthened materially and in a low-risk way: cash rose to $18,946.0M from $14,161M at the August 31, 2025 fiscal year-end and from $17,383.0M sequentially, while long-term debt was essentially static at $5,670M versus $5,713M within total assets of $86,430.0M, the only movement being a $69M repayment of Guaranteed Senior Notes by the Japan subsidiary in March 2026 (10-Q pp. 5, 11). The working capital movement is seasonal and benign — accounts payable rose to $22,363M from $19,783M at fiscal year-end against inventories of $19,418M from $18,116M, meaning payables funded the inventory build twice over, consistent with management’s description of faster inventory turns and improved supplier payment terms (10-Q pp. 5, 25).
Cash flow note: FCF conversion = FCF / Net Income = 2,036 / 2,192 × 100 = 92.9%, down from 122.4% in Q3 2025, and operating cash flow was flat (-$11M, -0.3%) despite net income rising $289M. The divergence is entirely working capital and is visible in the derived standalone quarter: merchandise inventories were a $457M use of cash this quarter versus a $337M source a year ago (a $794M swing) and other operating assets and liabilities a $811M use versus $635M, only partly offset by a larger accounts-payable build of $1,767M versus $1,062M (derived from 10-Q p. 8 against the Q2 2026 Form 10-Q p. 8). This is a timing effect on inventory positioning, not an earnings-quality break — year-to-date OCF of $11,133M versus $9,468M is up 17.6% against year-to-date net income growth of 13.5%, so cash still leads earnings over the nine months.
7.4 Footnote Review
sources Note 1 — Summary of Significant Accounting Policies (10-Q p. 9–10) Describes the business (928 warehouses worldwide at May 10, 2026, of which 637 in the U.S., 115 in Canada and 176 elsewhere), the 52/53-week fiscal year (fiscal 2026 is a 52-week year ending August 30, 2026), the basis of interim presentation and use of estimates. The note directs the reader to the FY2025 Form 10-K for the full policy set and discloses no change in accounting policy; the only forward-looking items are ASU 2023-09 (income-tax disclosures, effective for annual periods beginning after December 15, 2024) and ASU 2024-03 (disaggregated expense disclosures, effective for fiscal years beginning after December 15, 2026), both still under evaluation and both disclosure-only — neither changes reported earnings. Versus Q3 2025 the substance is unchanged apart from the warehouse count, which rose by the 23 net new warehouses opened over the year (10-Q p. 21). No thesis implication.
Note 2 — Investments (10-Q p. 10) Total short-term investments of $1,050M at May 10, 2026 versus $1,123M at August 31, 2025 — available-for-sale government and agency securities of $818M (from $786M) and held-to-maturity certificates of deposit of $232M (from $337M). The net unrealised position flipped from a $3M gain to a $3M loss, which the note states is immaterial, with no securities in a material continuous unrealised-loss position and no sales of AFS securities in either 36-week period. Maturities are laddered: $133M cost basis due within one year, $441M in one-to-five years, $247M beyond five years. Immaterial against $18,946.0M of cash; no thesis implication. Note that the note’s comparative is the fiscal year-end, not Q3 2025, so a direct prior-year-quarter comparison is not available from this filing.
Note 3 — Fair Value Measurement (10-Q p. 11) All recurring fair-value items are Level 2: government and agency securities of $818M (from $786M), forward foreign-exchange contracts in an asset position of $1M (from $6M) and in a liability position of $(10)M (from $(14)M), netting to $809M versus $778M at fiscal year-end. No Level 1 or Level 3 recurring assets or liabilities, no transfers between levels, and no non-recurring fair-value adjustments in either 36-week period. There is essentially no valuation-judgement risk in the balance sheet — a genuine positive for an accounting-quality assessment, and unchanged in character from the prior year.
Note 4 — Debt (10-Q p. 11) Total long-term debt of $5,684M versus $5,805M at fiscal year-end: 3.000% Senior Notes due May 2027 ($1,000M), 1.375% Senior Notes due June 2027 ($1,250M), 1.600% Senior Notes due April 2030 ($1,750M), 1.750% Senior Notes due April 2032 ($1,000M), and other long-term debt of $684M versus $805M (Japan subsidiary Guaranteed Senior Notes), reduced by the $69M repayment in March 2026. The current portion is $0, down from $75M at fiscal year-end. [Rating and price target withdrawn — see the note at the top.] $2,250M matures in calendar 2027, against cash of $18,946.0M, so the refinancing question is optional rather than forced. No financial covenants, covenant levels or actual covenant ratios are disclosed in this 10-Q — the note contains no covenant discussion at all, so no covenant headroom can be computed from this filing. One basis note, so the two long-term-debt figures in this section reconcile rather than appear to conflict. The filing presents its debt table under the heading “carrying value” and then makes two deductions from it: the $5,684M above is the total of the note series before those deductions, and $5,670M is what remains after subtracting unamortised debt discounts and issuance costs of $14M and a current portion that is nil this quarter — the “Long-term debt, excluding current portion” line that appears on the balance sheet. It is $5,670M that §7.3 and the net-debt bridge use, and it is the basis that ties to the annual series in Section 3. At fiscal year-end the same two deductions are larger — $17M of issuance costs and a $75M current portion — which is the whole of the $5,805M-to-$5,713M difference there. The fair-value comparison above is drawn against $5,670M because the filing states fair value including the current portion, and that portion is zero at this date.
Note 5 — Equity (10-Q p. 12) A quarterly cash dividend of $1.47 per share was declared on April 15, 2026 and paid on May 15, 2026, versus $1.30 per share in Q3 2025 — a 13.1% increase, and the reason Q3 2026 shows $0M of dividends paid in the cash flow statement (see footnote ᵉ above). Repurchases in Q3 2026 were 184,000 shares at an average $997.47, totalling $183M, versus 215,000 shares at $976.71, totalling $210M in Q3 2025; year-to-date 638,000 shares at $945.46 for $603M versus 658,000 at $946.64 for $623M. The $4,000M authorisation expires in January 2027 with $1,359M remaining. Analytically this matters for the valuation thesis: total capital returned this quarter — $652M declared dividend plus $183M repurchase — is $835M, or 38.1% of net income, so cash continues to accumulate on the balance sheet rather than reduce the share count, and the buyback is retiring only 0.04% of shares per quarter at a $997 average price against our $820.00 target.
Note 6 — Stock-Based Compensation (10-Q p. 12–13) Stock-based compensation expense was $119M versus $106M (+12.3%), or $92M versus $83M net of recognised tax benefits of $27M and $23M; year-to-date $771M versus $720M. [Rating and price target withdrawn — see the note at the top.] Unrecognised cost is $1,092M over a weighted-average 1.6 years. One judgement item to note: the company recognised expense in Q3 2026 on 67,000 performance-based RSUs whose fiscal 2026 targets are only “currently deemed probable” and are determined by the Compensation Committee after fiscal year-end — a discretionary accrual, though immaterial in size. At 5.4% of net income (versus 5.6% in Q3 2025), SBC is not distorting earnings.
Note 7 — Net Income per Common and Common Equivalent Share (10-Q p. 13) Net income of $2,192.0M over weighted-average basic shares of 443,923 thousand, with RSU dilution of 507 thousand versus 804 thousand a year ago, giving diluted shares of 444,430 thousand versus 444,762 thousand — a 0.07% reduction. Confirmed unchanged in method versus Q3 2025 (treasury stock method). The analytical point is simple and important: all 15.2% of diluted EPS growth came from earnings, none from share-count reduction, which is a cleaner outcome than most large-cap peers deliver.
Note 8 — Commitments and Contingencies (10-Q p. 13–15) See the dedicated contingencies entry below — this note is treated in full there rather than summarised twice.
Note 9 — Segment Reporting (10-Q p. 16–17) Three reportable segments on a geographic basis, with the CEO as chief operating decision maker. Q3 2026 versus Q3 2025: U.S. revenue $51,434M (from $46,318M) and operating income $1,873M (from $1,713M, +9.3%); Canada $9,410M (from $8,321M) and $506M (from $450M, +12.4%); Other International $9,683M (from $8,566M) and $436M (from $367M, +18.8%). Segment D&A of $597M and additions to property and equipment of $1,413M are disclosed here for the 12-week quarter — the only quarterly source for both. Disaggregated net sales show the gasoline effect plainly: Warehouse Ancillary and Other Businesses rose 29.0% to $15,419M while the three core merchandise categories rose 7.4% in aggregate (Foods and Sundries +5.5%, Non-Foods +9.0%, Fresh Foods +10.1%). Thesis implication: the growth mix is more gasoline-and-ancillary weighted than the headline implies, and Other International is compounding operating income fastest off the smallest base.
Related-party transactions (10-Q p. 2, p. 5, pp. 9–17) Costco discloses no related-party transactions in this filing, and none exist to document. This is a positive confirmation, not an omission: the notes index (p. 2) lists Notes 1 through 9 only, with no related-party note, and none of Notes 1–9 (pp. 9–17) discloses a transaction with a controlling shareholder, affiliate, director or officer. The company has no controlling shareholder; the condensed consolidated balance sheet (p. 5) shows total equity of $33,509.0M with no minority-interest or non-controlling-interest line, and Note 1 states that the financial statements comprise Costco and its wholly-owned subsidiaries, with all material inter-company transactions eliminated (p. 9) — so there are no equity-method investees or partially-owned entities to disclose either. The one commercial arrangement referenced in the results discussion, the Citibank co-branded credit card programme (10-Q p. 22, cited as a positive contributor to core merchandise gross margin this quarter and a negative one year-to-date), is an arm’s-length third-party contract, not a related-party transaction, and the 10-Q discloses no dollar amount for it. Nothing changed versus Q3 2025 on this point: there were no related-party transactions then and none now.
Contingencies and litigation (10-Q pp. 13–15) The company records an accrual only where a loss is probable and reasonably estimable; it states it has recorded an “immaterial accrual” with respect to some of the matters below plus other immaterial accruals, and discloses no dollar amount for the accrual or for any possible loss or range of loss, on the stated grounds that remedies sought are indeterminate and legal theories undeveloped (p. 13). Open matters:
- California wage-and-hour — Martin Reyes v. Costco (class action filed November 2023) and the related PAGA representative action (January 2024, amended May 2024). A second amended complaint was filed and Costco has moved to dismiss; the PAGA action was stayed on December 18, 2024. No amount stated. Unchanged this quarter.
- California PAGA — Nader v. Costco (August 2024). Motion to strike granted in part on May 13, 2025; motion to stay granted November 13, 2025. No amount stated. Unchanged this quarter.
- Washington wage-and-hour — Madera v. Costco (class action filed January 2026, King County) and Howell v. Costco (second class action filed March 2026, King County). Both allege failure to provide meal periods and rest breaks; Madera also alleges wage theft and inaccurate wage statements and seeks compensatory and exemplary damages, interest and fees. Costco has denied the material allegations. Howell is new this quarter; no amount stated.
- Opioid MDL — In re National Prescription Opiate Litigation (MDL 2804), consolidated since December 2017. Substantially narrowed: cases by counties and cities in Michigan, New Jersey, Oregon, Virginia and South Carolina, a Texas hospital, and third-party-payor class and individual actions in 43 states and American Samoa have been resolved or dismissed, as have state-court claims in New Jersey, Oklahoma, Utah and Arizona and federal claims in Georgia and Florida. Remaining: an Ohio third-party-payor claim, NAS-infant actions in 40 states, one Georgia county in federal court, New York city/county claims, and Pennsylvania district-attorney claims. No amount stated. Net direction is favourable versus prior periods.
- Pixel-tracker privacy class actions (five suits filed September–October 2023, consolidated as Castillo, W.D. Wash.). Seeks damages, equitable relief and fees under the Washington Consumer Protection Act, Washington Privacy Act, Washington Uniform Health Care Information Act, ECPA, CIPA and CMIA plus common-law claims; the motion to dismiss was denied in substantial part in November 2024, so this matter is proceeding on the merits. Related civil investigative demands from the Washington Attorney General (January 2 and August 22, 2024) and a pre-litigation letter from the Los Angeles County Counsel (January 3, 2024) remain outstanding. New this quarter: Birdwell was dismissed with prejudice in March 2026. No amount stated. This is the most advanced of the open matters and the one to monitor.
- Kirkland Signature tequila labelling — Glazer and Salisbury, filed October/November 2025, alleging the “100% de Agave” label is false. Plaintiffs seek damages, statutory penalties, punitive and treble damages, and disgorgement. Glazer was dismissed without prejudice; an amended Salisbury complaint adding Glazer was filed March 9, 2026 and Costco moved to dismiss in April 2026 — both developments this quarter. No amount stated. Reputationally relevant because Kirkland Signature private label is central to the margin story.
- IEEPA tariff-refund class actions — four suits filed in March 2026: Stockov (N.D. Ill.), Gower (King County), Ortiz (D.P.R.) and Briggs (W.D. Wash.), seeking refunds of tariffs paid under the International Emergency Economic Powers Act that were passed on to members through higher prices, under state consumer-protection laws and equitable doctrines. Costco has moved to dismiss Stockov and Gower. All four are new this quarter and constitute the single most notable litigation development in the filing. No amount stated.
Management’s overall assessment is unchanged from prior periods: no pending matter, alone or in aggregate, is expected to have a material adverse effect, though an unfavourable outcome “however unlikely” could be material to an individual quarter or year (p. 15). One honest caveat on completeness: this note is an interim update and does not restate every matter disclosed in the FY2025 Form 10-K — the PFAS baby-wipes matter, the DOJ False Claims Act investigation and the EPA FIFRA settlement described in that filing are not addressed in this 10-Q, so their status cannot be assessed from this document.
Subsequent events (10-Q p. 1, p. 12, p. 25, p. 30) The 10-Q contains no subsequent-events note — the notes index (p. 2) runs from Note 1 to Note 9 and there is no such note. Three post-quarter-end facts are nonetheless disclosed elsewhere in the filing and should be recorded: (1) the $1.47 per share quarterly dividend was paid on May 15, 2026, five days after the May 10, 2026 quarter end, releasing the $652M declared-but-unpaid liability carried at the balance sheet date (pp. 8, 12, 25); (2) 443,478,804 shares were outstanding as of May 27, 2026, versus 443,514,000 at May 10, 2026 — a further 35,196 share reduction, indicating repurchases continued at a modest pace after quarter end (p. 1); and (3) the filing was signed on June 3, 2026 by the CEO and CFO, with disclosure controls concluded effective as of May 10, 2026 and no change in internal control over financial reporting during the quarter (pp. 27, 30). Risk factors are unchanged from the FY2025 Form 10-K (p. 27), and there have been no material changes to critical accounting estimates (p. 27) or to market-risk exposures (p. 27).
7.5 What Changed This Quarter
sources - Roughly half the operating-income growth is not repeatable. Operating income rose $285M (+11.3%), but a smaller LIFO charge contributed 14 basis points of gross margin (≈$97M) and the absence of last year’s one-time increased-employee-vacation charge contributed 7 basis points across gross margin and SG&A (≈$48M) — together ~$145M, or 50.9% of the increase (10-Q pp. 22–23). Underlying operating leverage is real but roughly half the headline. This is the single most important adjustment to make when extrapolating the quarter into the forward estimates that support the valuation. - Underlying comparable sales are 7%, not 10%. Gasoline prices added 221 basis points and currency 104 basis points to net sales growth (10-Q pp. 20–22). The 7% ex-gasoline, ex-currency comparable — with average ticket +7% and frequency +2% — is a genuinely good number and confirms the demand side of the thesis; it is not the double-digit figure the headline suggests, and it is below the 8% the company printed on the same basis a year ago (10-Q p. 21). - The membership annuity is still being flattered by a price step. Membership fee revenue of $1,373M (+10.7%) includes approximately 25% of its growth from the September 2024 U.S./Canada fee increase, recognised ratably (10-Q p. 22) — down from 35% year-to-date, so the tailwind is fading on schedule and will substantially anniversary during fiscal 2027. [Rating and price target withdrawn — see the note at the top.] - The balance sheet moved further into net cash, which weakens the valuation support rather than strengthening it. Net cash of -$13,276.0M (-0.96× LTM EBITDA of $13,790M) is up 63.5% year-on-year, while capital returned this quarter was $835M, or 38.1% of net income (10-Q pp. 5, 12). A larger idle cash balance earning $130M of interest income per quarter (10-Q p. 24) is a low-return use of shareholder capital at a premium multiple, and the $4,000M buyback authorisation expires in January 2027 with $1,359M remaining (10-Q p. 12) — the capital-allocation question is becoming more pressing, not less. - Four new tariff-refund class actions, and management has flagged tariffs as a forward cost headwind. The March 2026 IEEPA suits (Stockov, Gower, Ortiz, Briggs) seek refunds of tariffs passed through to members (10-Q p. 15); no amount is disclosed and management does not expect a material effect, so this is a watch item, not a thesis item. Separately and more consequentially, MD&A states that “higher tariffs are more likely to adversely impact rather than improve our results” (10-Q p. 19) — a rare explicit directional warning in a filing that otherwise offers no guidance. [Rating and price target withdrawn — see the note at the top.] The only driver the 10-Q discloses is discrete stock-compensation benefits, and those are disclosed only for the 36-week periods and were smaller this year ($72M versus $100M). [Rating and price target withdrawn — see the note at the top.]
7.6 Portfolio Decision
sources [Rating and price target withdrawn — see the note at the top.] [Rating and price target withdrawn — see the note at the top.] The footnote review adds nothing that impairs the thesis: no related-party transactions, no Level 3 assets, no covenant issues, no accounting-policy change, a fair-value discount on debt that is a legacy asset rather than a risk, and litigation — including the four new March 2026 tariff-refund class actions and the advancing Castillo privacy matter — that remains unquantified and, on management’s assessment and ours, immaterial to the thesis. [Rating and price target withdrawn — see the note at the top.]
What would change this view: [Rating and price target withdrawn — see the note at the top.] [Rating and price target withdrawn — see the note at the top.]
Source: Costco Wholesale Corporation Form 10-Q for the quarterly period ended May 10, 2026, as cited by page throughout; rating, target price and current share price from the Valuation sheet of the accompanying workbook.
Report Versions
Every published version of this report, newest first — each one kept so a reader can see what changed and when.
| Version date | Files |
|---|---|
| 2026-08-12 Current | Model (Excel) |