
Amazon.com, Inc.
Section 1 — Business Overview, Operations & Competitive Positioning
sources
1.1 The Business
sources Amazon.com, Inc. is best understood not as one company but as two very different economic engines carried on a single balance sheet: a vast, thin-margin retail-and-logistics operation that produces the bulk of revenue, and a high-margin cloud-computing and advertising franchise that produces the overwhelming majority of the profit. The investment case turns almost entirely on the second engine — and, increasingly, on whether the capital being poured into it converts into cash.
The company’s own framing is customer-centric and long-term: management describes a philosophy built on customer obsession over competitor focus, a bias toward invention, operational excellence, and long-term thinking, and it serves several distinct constituencies at once — consumers, sellers, developers, enterprises, content creators, and advertisers. Economically, Amazon earns money in two structurally different ways. It recognizes gross revenue on goods it sells from its own inventory (product sales), and only its net commission on goods sold by third-party sellers who use its marketplace and fulfillment (service sales). Layered on top are Amazon Web Services (AWS) cloud fees, a fast-growing high-margin advertising business, and Prime and other subscriptions. In disaggregated form the revenue base spans Online stores, Physical stores, Third-party seller services, Advertising services, Subscription services, AWS, and Other. Most-recent full-year revenue was $716,924.0M, generated across North America, an internationally-focused store network, and a global cloud footprint, and supported by one of the largest workforces of any private employer — a workforce for which management flags intense and rising competition for technical talent, particularly software engineers and specialists in artificial intelligence and machine learning. The shares are listed on the Nasdaq under the ticker AMZN.
[Rating and price target withdrawn — see the note at the top.]
Key Information
| Item | Value |
|---|---|
| Ticker | AMZN |
| Sector / Industry | Consumer Discretionary |
| Report Date | 2026-08-20 |
| Most Recent FY Revenue | $716,924.0M |
| EBIT Margin (Most Recent FY) | 11.2% |
| Diluted Shares Outstanding | 10,827M |
| Current Price | $260.14 |
Source: Company SEC filings (10-K); see Appendix A.1.
1.2 Operating Segments
sources Amazon reports three segments — North America, International, and AWS — and management states these reflect the way it actually evaluates performance and manages the business, with no internal revenue transactions between them and operating costs allocated to segments by usage. The distinction that matters for an investor is not the three-way split itself but the profit geography inside it: the two retail segments carry the revenue, AWS carries the margin. §
North America consists chiefly of retail sales of consumer products (including from third-party sellers) plus advertising and subscription revenue through North America-focused online and physical stores, and includes export sales from those stores. Its economics are volume-driven: the single variable that moves it is unit throughput, which management ties to its standing focus on price, selection, and convenience, including fast shipping. It is a large, competitively hard-won, structurally thin-margin business.
International is the same retail-plus-advertising-and-subscription model run through internationally-focused stores, and it is the segment most exposed to currency: management explicitly notes that foreign-exchange movements meaningfully affect its reported results. It has historically been the lowest-margin of the three and the one where Amazon has, on its own account, relatively little operating experience in certain markets and no guarantee of sustained profitability — a point developed in Section 2.
AWS is the profit engine and the segment on which the thesis rests. It sells compute, storage, database, analytics, and — increasingly — AI and machine-learning services to start-ups, enterprises, governments, and academic institutions worldwide, with revenue growth driven primarily by rising customer usage, partially offset by contractual price step-downs. [Rating and price target withdrawn — see the note at the top.] Two caveats belong here and are quantified in Section 3. First, AWS’s costs sit largely within Technology and infrastructure — a shared cost base allocated to AWS by usage — so its reported margin is sensitive to how that infrastructure build is depreciated. Second, AWS operating margin compressed year-over-year even as revenue grew rapidly, because the segment is absorbing the depreciation weight of the AI-capacity build-out; reading AWS on revenue growth alone overstates its near-term profit trajectory.
Advertising, though not a reportable segment, is the quiet third profit pillar: a fast-growing, high-margin service built on first-party retail data and threaded through both retail segments. Together the segments form a flywheel — Prime and low prices drive retail traffic and unit volume; that volume supports the third-party marketplace and the advertising inventory that monetizes it; the scale of the whole funds the fulfillment network and the AWS infrastructure; and AWS’s profit, in turn, underwrites continued reinvestment in the retail flywheel. The fragility in the system is that the profit is concentrated in one segment (AWS) whose growth quality and margin are now entangled with a single large investee-and-customer relationship (Anthropic), a dependency examined in Sections 2 and 3.
1.3 Geographic Exposure
sources Revenue is reported along the same geographic fault line as the segments: a North America-focused store network, an internationally-focused store network (whose export sales reach customers including in the U.S., Mexico, and Canada), and AWS sold globally. The U.S. dollar is the reporting currency, and management is explicit that foreign-exchange movements significantly affect reported results and consolidated trends — it holds cash and marketable securities in British Pounds, Canadian Dollars, Euros, and Japanese Yen, and frames its growing international footprint as a long-term diversification benefit even as it increases translation exposure.
Two geographic concentrations create risk that is operational rather than merely translational, and both are carried forward to Section 2. First, China: management discloses that China-based sellers account for significant portions of third-party seller and advertising revenue, and China-based suppliers provide significant portions of components and finished goods — so tariff shifts, trade restrictions, and geopolitical events centered on China feed directly into both the top line and the cost base. Second, regulatory structure: in both China and India, foreign-ownership and licensing limits force Amazon to operate through contractual arrangements with local license-holders and, in India, through an indirect minority interest in a marketplace seller — arrangements whose enforceability and interpretation are themselves a tail risk. §
1.4 Management Team
sources The leadership bench is deep, technically credible, and unusually continuous for a company of this scale — but it concentrates decision-making in a small number of people the company does not insure. Andrew Jassy, President and CEO since July 2021, is the anchor: he built and ran AWS before taking the top job, which places the person most responsible for the group’s profit engine directly in command during the AI investment cycle that will define the next five years. Founder Jeff Bezos remains Executive Chair and Chair of the Board, preserving founder influence over long-term capital-allocation posture. AWS itself is now run by Matt Garman, CEO of the segment only since June 2024 — a relatively new appointment stewarding the single most important asset through its most capital-intensive and competitively contested period, which we regard as a genuine, if not alarming, execution watch item. Doug Herrington leads Worldwide Amazon Stores, Brian Olsavsky is CFO, and David Zapolsky serves as Chief Global Affairs & Legal Officer — a role whose prominence has grown with the antitrust and regulatory caseload described in Section 2.
The Board pairs the founder-and-CEO insiders with a slate of independent directors drawn from technology, finance, academia, and public policy — including figures such as Andrew Ng and Indra Nooyi — and routes cybersecurity oversight through a dedicated Security Committee of independent directors, with a chief security officer reporting directly to the CEO. The principal governance risk is straightforward and disclosed by the company itself: it maintains no key-person life insurance on senior management, so the loss of Jassy or Bezos would be felt without financial backstop. Insider selling is ongoing but pre-scheduled through Rule 10b5-1 plans (including a large founder plan adopted in late 2025); we treat it as routine context for the ownership discussion rather than a signal, and revisit it in Section 2.
1.5 Capital Allocation Track Record
sources Amazon’s capital-allocation record is the clearest single statement of management’s priorities: essentially all internally generated cash is being reinvested in the business, none is returned to shareholders, and the reinvestment has recently accelerated into an AI-and-data-center capital-expenditure supercycle.
| Year | Dividends Paid ($M) | Share Repurchases ($M) | CapEx ($M) |
|---|---|---|---|
| FY2021 | — | $0.0M | $61,053.0M |
| FY2022 | — | $6,000.0M | $63,645.0M |
| FY2023 | — | — | $52,729.0M |
| FY2024 | — | — | $82,999.0M |
| FY2025 | — | — | $131,819.0M |
Source: Company SEC filings (10-K); see Appendix A.1.
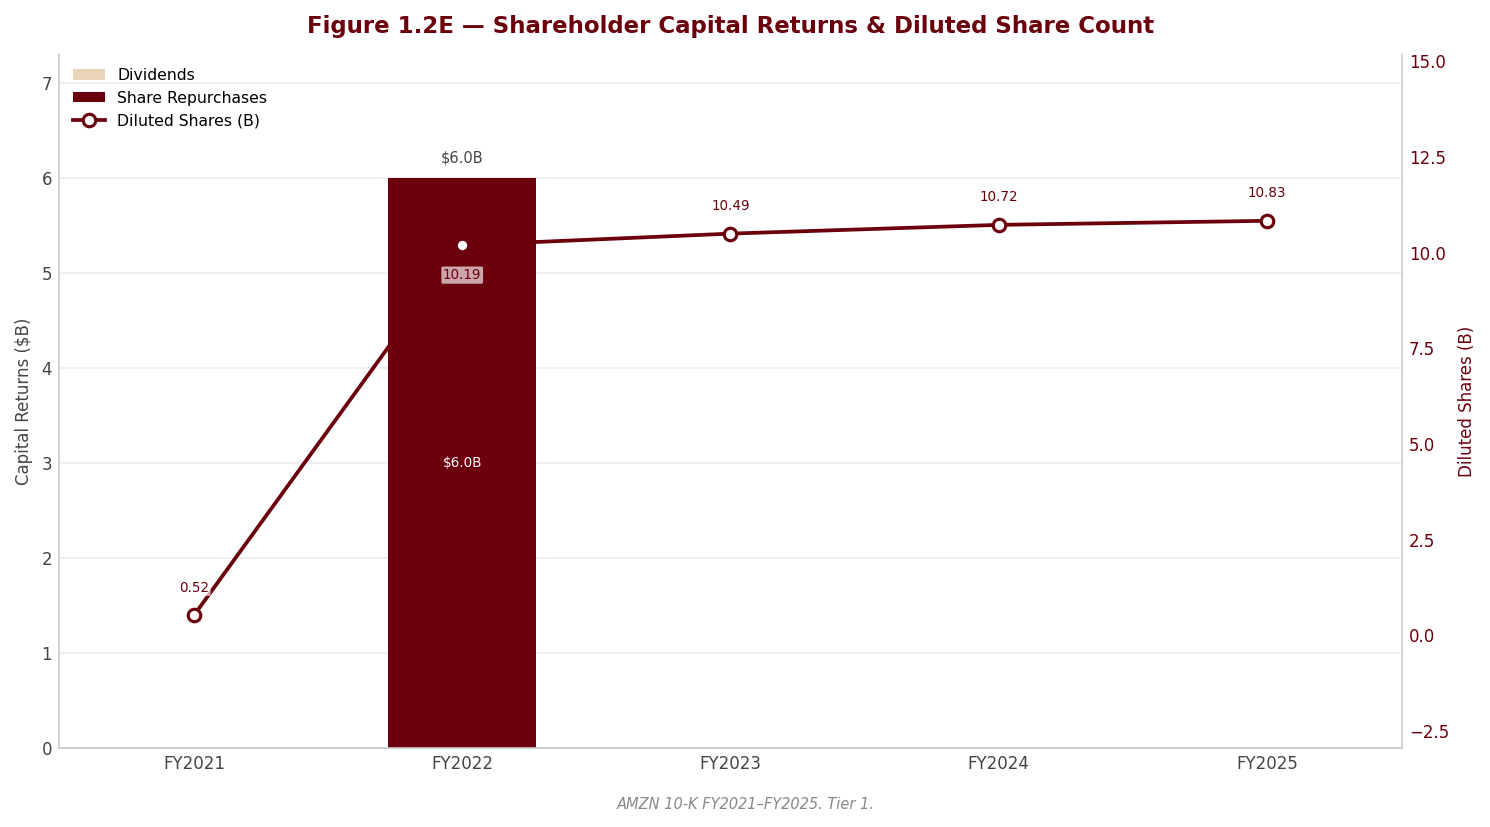
Amazon pays no dividend — its FY2025 payout ratio is nil — and a total shareholder yield of 0.0% confirms that cash distributions play no part in the capital plan. Buybacks have been negligible too: a single modest repurchase in FY2022 and none since, despite a standing authorization — a point that matters because, with stock-based compensation running through the share count and no buyback to offset it, dilution flows straight through to shareholders (developed in Section 3). Restricted stock units are management’s primary equity-compensation vehicle, chosen, it says, to align employee and shareholder horizons; it explicitly retains the flexibility to issue equity or debt, and to repurchase stock or pay dividends, for strategic reasons — flexibility it has, to date, used almost entirely to fund reinvestment rather than distribution.
The capital-expenditure line is where the story is. CapEx has grown from $61,053.0M in FY2021 to $131,819.0M in FY2025, with the most recent step-up concentrated in technology infrastructure that management states is majority-driven by AWS growth, plus fulfillment-network capacity — and it explicitly guides both higher again in the following year. Running well above depreciation and amortization, this is unambiguously growth investment rather than mere asset replacement, and it is the reason free cash flow was temporarily compressed in FY2025 even as reported earnings rose. In our reading this is a deliberate, cash-hungry bet on AI capacity, not a signal of weak underlying economics — but it is precisely the bet whose payoff the current share price already assumes will succeed, and its scale (including a large pipeline of signed-but-not-yet-commenced leases) is the pivot of both the Section 3 cash-flow analysis and the valuation.
1.6 Competitive Positioning & Moat
sources §1.6.1 Industry structure. Amazon competes, on its own characterization, in a worldwide marketplace that is evolving rapidly and intensely competitive, against a broad array of rivals spanning physical, e-commerce, and omnichannel retail; media publishers and distributors; search engines, comparison-shopping sites, social networks, and virtual assistants; e-commerce, fulfillment, and logistics providers; on-premises and cloud IT and AI-tool providers; consumer-electronics makers; grocers; advertising-services providers; and healthcare. Returns in these industries accrue to whoever controls scale-driven cost advantage and the customer relationship — in retail, through selection, price, and fast, reliable fulfillment; in cloud and enterprise services, through the quality, speed, and reliability of the platform and the switching cost of moving off it.
§1.6.2 Competitive advantages. Amazon’s moat is genuinely multi-layered. First, scale economics: a cost philosophy of driving down variable cost per unit while leveraging a fixed fulfillment and infrastructure base — reinforced by direct sourcing, supplier discounts, and a fast inventory-to-payables working-capital cycle in which it collects from card-paying consumers before it pays vendors. Second, the Prime flywheel and switching costs: a subscription that bundles fast free shipping with media and other benefits, which management treats as a worldwide marketing tool it intends to offer indefinitely, and which raises the cost of shopping elsewhere. Third, AWS scale and contractual lock-in: long-term customer contracts and a large multi-year backlog of committed-but-unrecognized revenue give the cloud franchise both scale advantage and revenue visibility (quantified in Section 3). Fourth, a high-margin advertising business built on proprietary first-party retail data that competitors cannot easily replicate. Fifth, intellectual property — trademarks, patents, and proprietary technologies the company treats as critical and actively protects.
§1.6.3 Competitive vulnerabilities. The moat is wide but contested, and management is candid about the erosion vectors. It acknowledges that the internet and, pointedly, artificial intelligence lower barriers to entry and comparison shopping — helping newer, lesser-known rivals compete against it — and that some competitors have greater resources, longer histories, or greater control over critical inputs. Four vulnerabilities carry directly into Section 2: (i) AWS faces well-capitalized cloud competitors and its own margin is now pressured by the depreciation cost of the AI build; (ii) the capital intensity of that build has temporarily consumed the segment’s cash generation; (iii) an intensifying antitrust and regulatory caseload targets the very mechanisms of the flywheel — Prime, Featured Offers, seller-data use, advertising, and aspects of AWS; and (iv) the Anthropic relationship concentrates a meaningful slice of AWS’s growth and of reported earnings quality in a single investee that Amazon simultaneously finances and sells to — a circularity that lowers the quality of headline AWS growth and is examined in Sections 2 and 3.
§1.6.4 Verdict. Amazon possesses one of the widest and most durable competitive moats in the market — scale, a subscription flywheel, a lock-in cloud platform, and a data-advantaged ad business that few peers can match. Our reservation is not about the moat’s width but about margin durability at the current price: near-term consolidated and AWS margins are being pressured by the AI-capex depreciation cycle and by regulatory overhang, while the long-run mix shift toward high-margin AWS and advertising is the genuine structural tailwind. [Rating and price target withdrawn — see the note at the top.]
Section 2 — Key Risks & Catalysts
2.1 Downside Risks
sources Amazon’s risk profile is dominated not by the operational or competitive hazards that define most retailers, but by a single strategic wager and the way that wager is being financed and reported. The company is committing an enormous and still-rising share of its capital to artificial-intelligence infrastructure, largely to serve AWS demand, and the most consequential customer and beneficiary of that build-out — Anthropic — is an entity Amazon itself funds and then marks to market through its own income statement. The result is a cluster of interlocking financial-quality and governance risks that sit above the conventional regulatory, international, and labor exposures. Two of these rise to the level of red-flag disclosures.
Risk 1 — Circular Anthropic relationship: Amazon both finances Anthropic and books AWS revenue from it
sources This is the single most important interpretive risk in the filing and a red-flag disclosure. Amazon carries a very large investment in Anthropic — convertible notes plus nonvoting preferred stock — and, disclosed in the same footnote, holds a commercial arrangement under which Anthropic is also an AWS customer, purchasing cloud services and the use of AWS chips. Amazon is therefore simultaneously the financier of Anthropic and a vendor recognizing revenue from it. This matters to the financials because a portion of AWS’s headline growth — the segment growing fastest and driving the very valuation marks discussed in Risk 2 — may be revenue from a customer Amazon itself capitalizes, a vendor-financing dynamic that lowers the quality of that growth. The filing does not quantify how much AWS revenue is attributable to Anthropic, does not detail the terms, and defers related-party disclosure (Item 13) to the proxy, so the arrangement cannot be independently verified as presented and must not be assumed to be arm’s-length. Materialization would take the form of a slowdown or restructuring of the commercial relationship, a re-characterization of the revenue, or disclosure that revealed the dependency to be larger than the market assumes.
Probability: Medium (the disclosure risk is present now; the crystallization event is uncertain) | Timeframe: 1–2 years | Quantified potential impact: Not quantifiable from the filing — the 10-K provides no attribution of AWS revenue to Anthropic and no independent verification of terms; the impact is on the quality, not yet the level, of reported AWS growth.
Risk 2 — Earnings quality: net income is inflated by non-cash mark-to-market gains that can reverse
sources Also a red-flag disclosure. Reported net income and diluted EPS growth substantially overstate underlying operating momentum. Non-operating “other income” swung from a prior-year net loss (chiefly the Rivian equity mark) to a very large current-year gain driven overwhelmingly by Anthropic — an upward adjustment for observable price changes on the nonvoting preferred stock plus reclassification gains as convertible notes converted to preferred. These are non-cash, Level-3, valuation-driven items on a private company, and the non-operating gain far exceeds the increase in operating income, so pre-tax income and EPS are flattered relative to the business. Critically, this is not a one-time distortion that has now cleared: management has pre-announced a further large upward adjustment to hit Q1 2026, and a substantial unrealized gain still sits in accumulated other comprehensive income awaiting recycling — meaning the line will remain volatile and could reverse if Anthropic’s valuation marks decline. Any multiple built on GAAP EPS is therefore built on a number that is partly a valuation opinion about a private investee. The clean base is operating income, or income before non-operating items.
Probability: High that the distortion persists and swings again (management has said so); Medium that it reverses adversely | Timeframe: Immediate (Q1 2026 mark already flagged) | Quantified potential impact: The swing between the two years’ non-operating results is itself larger than several segments’ operating income; specific figures are addressed in Section 3, where earnings are normalized to strip the marks.
Risk 3 — The AI-capex supercycle and the collapse in free cash flow
sources Capital intensity is the defining financial risk of the current cycle. Cash capital expenditure has stepped up sharply — the majority directed at technology infrastructure to support AWS — and management guides it higher again in the following year; the consequence is that free cash flow fell steeply even as GAAP earnings rose, because earnings growth is not converting into distributable cash. The true capital commitment is larger than the cash-capex line alone conveys: a rising balance of property and equipment acquired but not yet paid sits in payables, and finance-lease and build-to-suit additions come on top, while a very large block of signed-but-not-yet-commenced leases will convert into on-balance-sheet lease liabilities and depreciation over coming years. The core hazard is timing mismatch: the capacity is being built ahead of proven, durable AI demand, and a demand air-pocket would strand expensive, short-lived assets. Compounding this, Amazon shortened the useful life of a subset of servers and networking equipment back to five years effective January 2025 — partially reversing the six-year extension it had made only a year earlier and citing the pace of AI hardware obsolescence — which raises depreciation and pressures AWS margins. That the same estimate has moved reported income in opposite directions in two consecutive years demonstrates how sensitive AWS profitability is to a single assumption, and the larger remaining fleet still carried on a longer life is a further latent headwind if it too is shortened.
Probability: High (the capex trajectory and FCF pressure are disclosed facts; the demand-shortfall tail is Medium) | Timeframe: Immediate and ongoing (1–3 years) | Quantified potential impact: Material to free cash flow and to FCF-based valuation; the capex and FCF figures are developed in Section 3.
Risk 4 — Regulatory, antitrust, and cross-border tax exposure
sources Amazon faces an unusually broad and escalating regulatory front, and the number and scale of proceedings have risen as governments move to regulate it pre-emptively as an online “gatekeeper.” Antitrust and consumer-protection actions brought by the FTC, state Attorneys General, and private litigants across the U.S., Canada, and the U.K. allege price-fixing, monopolization, and abuse of dominance, seek very large damages and structural relief, and — while most U.S. motions to dismiss were granted in part — at least some claims survived in every case. The FTC matter settled during the year at a discrete cost recorded in operating expense, and European actions (the Italian Competition Authority decision, the Luxembourg GDPR fine) remain under appeal. Running alongside is the tax dimension: uncertain tax positions are the auditor’s sole Critical Audit Matter, and live cross-border disputes — the Indian tax authority’s assertion that tax applies to U.S. cloud-services fees (“payments could be significant in the aggregate,” and Amazon must remit pending resolution) and Luxembourg’s challenge to the tax basis of intangibles distributed to the U.S. in 2021 — are unquantified tail risks that could produce cash outflows and additional expense beyond the accrual. [Rating and price target withdrawn — see the note at the top.]
Probability: High that proceedings continue; Medium that any single matter proves financially material | Timeframe: 1–5 years (litigation and tax disputes resolve slowly) | Quantified potential impact: Not reliably quantifiable — the filing states that for many matters a loss estimate is not possible and that losses in excess of amounts recorded are possible; the accrued tax-contingency balance is addressed in the data-supported sections.
Risk 5 — International structural and labor exposure
sources To operate within foreign-ownership limits, Amazon relies on structured arrangements that carry governance and regulatory tail risk. Its financials consolidate variable-interest entities — including certain entities in India — and it provides technology services in China through contractual relationships with third parties holding PRC licenses, and holds an indirect minority interest in a third-party seller on its Indian marketplace. If PRC contractual enforceability weakens or Indian foreign-ownership interpretations change, the associated businesses could be forced to restructure or shut down, and consolidation conclusions could be challenged. This is not currently a financial-statement distortion, but it is a structural dependency a rational analyst must weigh — particularly given that China-based sellers and suppliers account for significant portions of third-party seller/advertising revenue and of components and finished goods, making the company additionally exposed to tariff and trade-policy shifts. Separately, Amazon is subject to periodic union-organizing efforts; success would reduce operational flexibility in a labor-intensive fulfillment network already facing constrained labor markets and rising payroll costs. §
Probability: Low-to-Medium (structural risk is latent; labor/trade friction is Medium and ongoing) | Timeframe: 3–5 years for the structural VIE risk; immediate for labor and trade-policy friction | Quantified potential impact: Not quantifiable from the filing; the exposure is to business continuity in specific geographies rather than to a discrete, estimable charge.
2.2 Upside Catalysts
sources The catalyst picture is genuinely asymmetric, and honesty requires stating so: the most powerful upside drivers are the favorable resolution of the very capex wager that constitutes the largest downside risk. Amazon’s bull case and bear case are drawn from the same well — the AI/AWS build-out. If demand materializes as management is betting, the spending that is currently depressing free cash flow becomes the foundation of a re-accelerating, high-margin franchise; if it does not, the capacity strands. The catalysts below are operational and cyclical rather than binary events, and they share this common root.
Catalyst 1 — AWS re-acceleration and AI monetization
sources [Rating and price target withdrawn — see the note at the top.] AWS is the profit engine, and the entire capex program is aimed at capturing AI-driven cloud demand. If the infrastructure being built converts into sustained usage growth — the AWS backlog of remaining performance obligations is a large, if timing-dependent, demand signal — AWS revenue growth would translate into operating-income growth once the current depreciation and infrastructure-cost drag normalizes. This is the outcome that would retrospectively justify the capex and the Anthropic investment. It matters most because AWS carries the group’s margin mix; a re-acceleration flows disproportionately to consolidated operating income.
Probability: Medium-to-High | Timeframe: 1–2 years | Monitoring trigger: Sequential AWS revenue-growth re-acceleration alongside a stabilizing or expanding AWS operating margin — margin is the tell that capacity is being monetized rather than merely built; secondarily, growth in the AWS RPO backlog.
Catalyst 2 — Advertising growth
sources Advertising is a structurally high-margin, capital-light revenue stream layered onto traffic Amazon already owns, and management cites third-party advertising as a driver of both revenue and rising sales-and-marketing cost. Because advertising revenue largely drops through to operating income, continued double-digit growth is a disproportionate contributor to margin expansion and a partial offset to the capex-driven cash drain elsewhere.
Probability: High | Timeframe: Immediate and ongoing | Monitoring trigger: Continued outsized growth in the “Advertising services” revenue grouping relative to total net sales, and evidence it is expanding retail-segment operating margins.
Catalyst 3 — Retail and international margin expansion
sources North America and International have been on a multi-year cost-efficiency and fulfillment-optimization path, and management continues to emphasize reducing variable cost per unit while leveraging fixed costs. Sustained unit-volume growth combined with fulfillment-network efficiencies and a favorable foreign-exchange contribution to the International segment could lift retail-segment profitability, with International in particular carrying operating leverage as it matures toward sustained profitability.
Probability: Medium | Timeframe: 1–2 years | Monitoring trigger: Continued year-over-year improvement in North America and International segment operating margin, and International sustaining profitability net of the guided investments in quick commerce and sharper international pricing.
Catalyst 4 — Capex normalization unlocking free cash flow
The mirror image of Risk 3. Amazon’s stated financial focus is long-term free-cash-flow growth. Once the current AI/data-center build-out matures and cash capex normalizes as a share of operating cash flow, the mechanical FCF drag reverses and the earnings-to-cash conversion that has broken down this year would be restored — potentially sharply, given the operating-cash-flow base. This is a “when, not if” catalyst conditional on demand validating the spend, which is precisely why it is inseparable from the central risk.
Probability: Medium (contingent on demand) | Timeframe: 2–5 years | Monitoring trigger: The first year in which capex growth decelerates below operating-cash-flow growth, and a rebound in reported free cash flow toward historical conversion levels.
2.3 Risk & Catalyst Summary
| # | Item | Type | Probability | Timeframe | Status | Monitoring Trigger |
|---|---|---|---|---|---|---|
| 1 | Circular Anthropic relationship (finances investee, books AWS revenue from it) | Risk | M | 1–2 yrs | Active | Any quantification of Anthropic-related AWS revenue; proxy disclosure of arrangement terms |
| 2 | Earnings quality — non-cash Anthropic/Rivian mark-to-market gains inflate EPS | Risk | H (swings); M (adverse reversal) | Immediate | Active | Q1 2026 pre-announced mark; any period producing marks down; AOCI recycling |
| 3 | AI-capex supercycle and free-cash-flow collapse (incl. shortened server life) | Risk | H | Immediate / 1–3 yrs | Active | Capex vs OCF trajectory; conversion of not-yet-commenced leases; further useful-life shortening |
| 4 | Regulatory/antitrust and cross-border tax disputes (FTC, EU, India, Luxembourg) | Risk | H (ongoing); M (single-matter materiality) | 1–5 yrs | Active | Adverse ruling or settlement; India cloud-fee or Luxembourg intangible-basis resolution |
| 5 | International structural (VIE) and labor exposure (China/India, unionization) | Risk | L–M | 3–5 yrs / Immediate | Latent (structural); Monitoring (labor) | PRC/India ownership-rule changes; union-election outcomes; tariff/trade shifts |
| 6 | AWS re-acceleration and AI monetization | Catalyst | M–H | 1–2 yrs | Monitoring | AWS revenue re-acceleration with stable/expanding AWS margin; RPO growth |
| 7 | Advertising growth | Catalyst | H | Immediate | Active | Advertising revenue outgrowing total net sales; retail-margin lift |
| 8 | Retail and international margin expansion | Catalyst | M | 1–2 yrs | Monitoring | Rising NA/International segment operating margin; International sustained profitability |
| 9 | Capex normalization unlocking free cash flow | Catalyst | M | 2–5 yrs | Latent | Capex growth decelerating below OCF growth; FCF rebound toward historical conversion |
Source: Company SEC filings (10-K) and forensic footnote review; see Appendix A.1.
2.4 Risk Interdependencies
sources The defining feature of Amazon’s risk profile is that its three most material risks are not independent — they are one system with a common node, Anthropic, and they reinforce one another in a way no single risk conveys. Amazon’s cash funds Anthropic; Anthropic uses that funding to buy AWS capacity; the AWS revenue helps drive the segment growth the market prizes; and Anthropic’s rising private valuation is then marked up through Amazon’s income statement as non-operating gain. The circular-revenue risk (Risk 1) and the earnings-quality risk (Risk 2) are thus the same coin viewed from two sides — the investee that inflates the P&L through valuation marks is also the customer whose purchases inflate AWS’s growth quality. A deterioration in Anthropic’s prospects would strike both simultaneously: the marks would reverse (hitting reported EPS) at the same moment the AWS revenue tied to that customer softened (hitting the growth narrative). Layered onto this is the capex risk (Risk 3): the capacity being built at great expense is substantially the capacity meant to serve exactly this AI demand. The genuinely damaging scenario is therefore a coincident one — an AI-demand air-pocket that simultaneously strands newly built, fast-depreciating capacity, softens AWS growth, deflates Anthropic’s valuation (forcing mark reversals), and leaves free cash flow depressed by capex already committed through the not-yet-commenced lease pipeline. Each of those individually is survivable for a company of Amazon’s balance-sheet strength; arriving together, they would convert a flattering earnings picture into a disappointing one across revenue quality, reported earnings, and cash flow at once. The regulatory and tax risks (Risk 4) are largely orthogonal to this cluster but would compound it in timing terms — an adverse antitrust or tax outcome landing in the same window would remove degrees of financial freedom precisely when the AI wager most needed them.
2.5 ESG & Regulatory Exposure
sources Environmental. Amazon’s environmental exposure is inseparable from its AI build-out: data centers are energy- and water-intensive, and the filing flags rising operating costs from more frequent extreme weather, water scarcity, and the transition to a low-carbon economy, alongside compliance costs from more extensive climate regulation and reputational risk from perceptions of its environmental footprint. The company has also contracted large, long-dated energy supply arrangements to power this infrastructure — a commitment that is both an environmental strategy and, per the forensic review, a latent source of non-cash valuation volatility.
Social. Human capital is a first-order issue for a business operating one of the world’s largest fulfillment and data-center labor forces. The filing emphasizes intense competition for technical talent (particularly AI/ML engineers), constrained labor markets raising payroll costs across the fulfillment network, and recurring union-organizing efforts that, if successful, would reduce operational flexibility. Product-safety and third-party-seller-conduct exposures (counterfeit, unlawful, or unsafe goods sold by marketplace sellers, backed by the A-to-z Guarantee) are social/consumer-protection risks that scale with third-party volume. Data privacy sits here too: live proceedings include Illinois biometric-privacy (BIPA) litigation touching Alexa, Amazon Photos, and Just Walk Out technology, and a Luxembourg GDPR enforcement decision under appeal.
Governance. Three governance-specific items warrant attention. First, the related-party opacity already discussed — the Anthropic financing-and-revenue arrangement is not detailed in the 10-K and is deferred to the proxy, and the analyst should not treat it as arm’s-length absent that verification. Second, capital-return and alignment signals are mixed: the founder and Executive Chair adopted a large 10b5-1 selling plan late in the year (alongside plans by the CEO, CFO, and other officers and directors), while the company conducted no share repurchases despite an available authorization, so insider selling is occurring against a backdrop of un-offset dilution from equity compensation. This is routine, pre-scheduled selling rather than a red flag, but it is relevant context for the ownership-alignment picture. Third, the mitigants are real and should be weighed against the above: Ernst & Young — auditor since 1996 — issued an unqualified opinion on both the financial statements and internal control over financial reporting, with no restatement or error correction and a single Critical Audit Matter (uncertain tax positions). In other words, the interpretive flags raised in this section concern how to read the reported numbers, not whether they are fairly stated.
Regulatory. Amazon is among the most heavily scrutinized companies in the world, and the filing describes an intensifying, multi-front regulatory environment: antitrust and consumer-protection actions from the FTC, state Attorneys General, and international regulators (with the FTC matter settled during the year and Italian and Luxembourg matters under appeal); a growing wave of jurisdictions adopting revenue-based digital, marketplace, and advertising taxes plus global-minimum-tax regimes; sector-specific licensing and foreign-ownership regimes in China and India; and government-contract procurement rules carrying penalties up to debarment. Regulators’ increasing focus on online “gatekeepers” raises structural compliance cost and could, in an adverse resolution, force changes to Prime, Featured Offer selection, use of seller data, advertising practices, or the promotion of Amazon’s own products — remedies that would bear directly on the economics of the retail and advertising franchises.
Section 3 — Financial Analysis & Historical Performance
sources
Three-Statement Linkage Confirmation: - Net Income ties (Income Statement → Cash Flow Statement): Confirmed. Reported net income of $77,670.0M is the opening line of the FY2025 Consolidated Statement of Cash Flows, from which non-cash items and working-capital movements are reconciled to operating cash flow. - Cash ties (Balance Sheet → Cash Flow Statement): Confirmed. The FY2025 cash-flow statement rolls to a period-end cash and cash-equivalents balance of $86,810.0M, matching the balance-sheet caption. - Retained Earnings reconciliation (Beg RE + NI - Dividends = End RE): Confirmed and exact. Opening retained earnings of $172,866.0M plus net income of $77,670.0M, with no dividends paid, reconciles precisely to closing retained earnings of $250,536.0M. The same identity holds in every prior year of the window, including FY2022, where the net loss of -$2,722.0M correctly reduced retained earnings from $85,915.0M to $83,193.0M.
3.1A Income Statement
Source: Amazon.com, Inc. FY2025 Form 10-K, Consolidated Statements of Operations; figures per the FL model — see Appendix A.1–A.2. Per-share figures are split-adjusted for the 20-for-1 stock split effective June 2022.
CAGR Summary
| Metric | 3Y CAGR | 5Y CAGR | 10Y CAGR |
|---|---|---|---|
| Revenue | 11.7% | 13.2% | - |
| EBITDA | 39.1% | 24.8% | - |
| Net Income | - | 29.5% | - |
| Diluted EPS | - | 27.9% | - |
| FCF | - | -21.6% | - |
Source: Company SEC filings (10-K); figures per the FL model — see Appendix A.1–A.2.
3.1B Income Statement — Analysis
sources A note on how to read Amazon’s income statement. Before interpreting the trend, the reader must understand a structural quirk: Amazon does not report a gross-profit subtotal, and it does not present canonical COGS/SG&A/R&D lines. “Cost of sales” is one component of operating expenses, sitting alongside Fulfillment, Technology and infrastructure, Sales and marketing, and General and administrative — none of which map to standard cost buckets. The “Gross Profit” and “Gross Margin” rows above are therefore an analyst construction (revenue less cost of sales) rather than a reported figure, and management itself states it views operating income as more meaningful than gross margin given the diversity of its categories. Accordingly, the analytical spine of this section is EBIT (operating income) — it is the cleanest reported measure of the business’s earning power and, critically, it sits above the non-operating equity marks that distort net income in FY2025 (see Quality of Earnings below).
[Rating and price target withdrawn — see the note at the top.] The trajectory is not linear: growth decelerated hard to 9.4% in FY2022 as the pandemic-era retail surge normalized and foreign-exchange headwinds compounded, then re-accelerated and stabilized in a 11.8%–12.4% band. Management attributes the growth almost entirely to volume — increased unit sales, including by third-party sellers — layered with the faster-growing, higher-margin services: advertising, subscriptions, and above all AWS. This mix is the single most important fact about the top line: the incremental dollar of revenue is progressively less first-party retail (thin-margin, inventory-carrying) and more services and cloud (high-margin, capital- or advertising-driven). That is why the constructed gross margin climbs steadily from 42.0% to 50.3% — it is a mix signal, not a pricing-power signal on any single product.
Margin trajectory — the operating-leverage story. The defining feature of the period is the recovery and expansion of operating margin. EBIT margin collapsed to a trough of 2.4% in FY2022, then expanded in each subsequent year to 6.4%, 10.8%, and 11.2%. In absolute terms, operating income more than sextupled from the $12,248.0M trough to $79,975.0M. This is structural, not cyclical: FY2022 was distorted by a post-COVID retail-capacity overhang (Amazon had roughly doubled its fulfillment network into demand that then softened), and the subsequent expansion reflects (i) the fixed-cost leverage of that network as volumes grew into it, (ii) the rising weight of AWS and advertising in the mix, and (iii) a deliberate cost-discipline program management describes as lowering variable cost per unit while leveraging fixed costs. EBITDA — computed here on the broad cash-flow definition of D&A, which includes content and operating-lease amortization and is therefore wider than property-only depreciation — tells the same story, with margin rising from 12.6% to 20.3%.
Major Movers.
-
AWS as the profit engine. AWS is the disproportionate driver of consolidated operating income even though it is a minority of revenue; retail (North America and International) is structurally thin-margin. [Rating and price target withdrawn — see the note at the top.] Structural — but see the FY2025 caveat below, where AWS’s own margin compressed under the weight of AI-build depreciation.
-
The FY2022 loss was non-operating, not operating. Reported net income swung to a loss of -$2,722.0M in FY2022 — a -108.2% move — yet operating income remained clearly positive at $12,248.0M. The loss was driven by a mark-down on the Rivian equity investment recorded below the operating line, not by a deterioration in the business. This is the first, and cleanest, illustration of why net income is the wrong lens for Amazon: the same below-the-line volatility that sank FY2022 inflates FY2025. Temporary/non-operating.
-
Operating leverage on the fulfillment network. Cost of sales rose primarily on higher product and shipping costs, and fulfillment cost rose on volume and network investment — both partially offset by efficiencies — while general and administrative cost was broadly flat. The result was that revenue growth of 11.0% in FY2024 and 12.4% in FY2025 dropped through to far faster EBIT growth, evidencing genuine operating leverage. Structural. §
-
[Rating and price target withdrawn — see the note at the top.] Temporary.
Quality of earnings — RED flag: net income is inflated by non-cash equity marks. This is the central earnings-quality issue in FY2025 and must be read before any multiple is applied to reported net income. Reported net income of $77,670.0M grew 31.1% year-over-year, but a substantial portion of that growth originated below operating income, in “Other income (expense), net.” That line swung from a prior-year net loss to a very large net gain, driven principally by (a) reclassification adjustments as Amazon’s Anthropic convertible notes converted to nonvoting preferred stock, and (b) an upward valuation adjustment on that Anthropic preferred reflecting observable price changes — both non-cash, Level-3 (unobservable-input) valuation items — plus a marketable-equity gain primarily on Rivian. The gap between pre-tax income of $97,311.0M and operating income of $79,975.0M is the visible footprint of this non-operating gain. Because non-operating income far exceeds the increase in operating income, reported net-income and diluted-EPS growth overstate the underlying operating momentum. The cleaner read is operating income (EBIT up to $79,975.0M, margin 11.2%) or EBITDA (up 20.1%), both of which are unaffected by the marks. Two compounding disclosures raise the weight of this flag: management has pre-announced a further multi-billion Anthropic upward adjustment in Q1 2026, and a large unrealized Anthropic gain still sits in accumulated other comprehensive income awaiting recycling — so this line will remain volatile and could reverse if Anthropic’s valuation marks decline. A related concern is that Amazon both finances Anthropic and books AWS revenue from it, so a portion of AWS’s headline growth may be revenue from an investee whose own rising valuation Amazon then marks through its P&L; the 10-K does not quantify the AWS revenue attributable to Anthropic, so it cannot be independently verified.
A counterweight — earnings are also depressed by un-added-back charges. Cutting the other way, and to Amazon’s credit, operating income in FY2025 absorbs, without any add-back, several genuinely one-time charges: an FTC litigation settlement, a large severance charge tied to planned role eliminations, an Italy tax/lawsuit resolution, and physical-store impairments. Amazon presents only two non-GAAP measures (free cash flow and the FX effect) and does not manufacture an “adjusted operating income” or “adjusted EPS” that strips these out, nor does it add back stock-based compensation. This is a conservative, high-quality presentation relative to large-cap peers: reported operating income is understated versus a normalized figure, so underlying operating-income growth is somewhat stronger than the reported line. The net analytical instruction is to adjust in both directions — strip the Anthropic/Rivian marks out of net income, and read operating income as modestly better than reported.
⚠ Items to Watch. - If EBIT margin were to fall back below the 6.4% level, it would signal that the post-2022 operating-leverage expansion had stalled and would force a re-evaluation of the AWS-mix and fulfillment-efficiency assumptions underpinning the thesis. - Any quarter in which reported EPS growth is driven by “Other income (expense), net” rather than by operating income should be discounted entirely — the pre-announced Q1 2026 Anthropic mark is the near-term test case. - A reversal of the Anthropic marks (a down-round or valuation reset) would flow through this same line as a loss and could turn reported net income sharply lower without any change in the operating business — a recurrence of the FY2022 dynamic.
3.2A Balance Sheet
Source: Amazon.com, Inc. FY2025 Form 10-K, Consolidated Balance Sheets; figures per the FL model — see Appendix A.1–A.2.
3.2B Balance Sheet — Analysis
sources Asset composition — this is now, first and foremost, an infrastructure balance sheet. Total assets nearly doubled over the window, from $420,549.0M to $818,042.0M, and the driver is unambiguous: net property and equipment more than doubled, from $160,281.0M to $357,025.0M, and now comprises the single largest asset category. This is the AI/data-center and fulfillment build-out crystallizing on the balance sheet — the majority of it, per management, supporting AWS. By contrast, goodwill is trivial in relation to the enterprise, rising only from $15,371.0M to $23,273.0M against equity of $411,065.0M; Amazon’s growth is overwhelmingly organic and capex-funded, not acquisition-driven, and the April 2025 annual impairment test produced no impairments with all reporting units’ fair value substantially exceeding carrying value. The balance sheet is therefore PP&E-heavy and self-funded, not goodwill-heavy — a materially higher-quality asset base than an acquisition roll-up of comparable size.
Leverage trajectory — deleveraging into a net-cash position even as capex peaks. Despite the largest capital-investment cycle in the company’s history, leverage fell. Debt/equity declined from 0.4x to 0.2x as retained earnings compounded equity from $138,245.0M to $411,065.0M. More striking, Amazon moved into a net-cash position: on a cash-and-equivalents basis, net debt swung from $14,015.0M in FY2021 to -$18,414.0M in FY2025 (net cash), and net-debt/EBITDA is now negative at -0.1x — and the cushion is larger still once the marketable-securities portfolio is included, as the valuation bridge in the separate valuation reflects. [Rating and price target withdrawn — see the note at the top.] This is fully consistent with management’s stated flexibility-first capital posture, and it means balance-sheet leverage is not a constraint on the capex program — the build is being funded from operating cash flow, the net-cash cushion, and covenant-free debt capacity.
Working capital — the negative-cash-conversion model, with one item to monitor. Amazon runs a structurally favorable working-capital model: it turns inventory quickly and collects from consumers (who pay by card) before payments to vendors and third-party sellers come due, which is why the current ratio can sit around 1.1x — thin by textbook standards but appropriate for a business financed in part by its own payables float. Inventory discipline is evident: inventory grew only from $32,640.0M to $38,325.0M, far slower than revenue, reflecting the ongoing shift toward third-party (non-inventoried) sales. The one line that warrants monitoring is receivables, which rose from $32,891.0M to $67,729.0M — outpacing revenue growth over the period. This is not the classic channel-stuffing signal it would be for a pure retailer: the build reflects the rising weight of AWS enterprise billing and advertising, which carry genuine trade receivables and longer collection cycles than card-settled retail. It is a mix consequence, not an aggressive revenue-recognition flag — but receivables growing persistently faster than revenue is the kind of trend that changes character if the business slows, so it stays on the watch list.
⚠ Items to Watch. - If net-debt/EBITDA were to cross back above 0.3x — i.e. Amazon returned to a net-borrower position — while capex remained at peak intensity, it would mark a shift from self-funded to debt-funded growth and would warrant closer scrutiny of the financing mix, even given the covenant-light structure. - Very large off-balance-sheet commitments (data-center and fulfillment leases signed but not yet commenced, plus multi-decade unconditional energy and equipment purchase obligations) sit outside the recognized liabilities above and will progressively convert into on-balance-sheet lease liabilities and depreciation — a future draw on both the balance sheet and FCF. - Receivables growth persistently exceeding revenue growth by a widening margin would move this item from “mix” to “concern.”
3.3A Cash Flow Statement
| FY2021 | FY2022 | FY2023 | FY2024 | FY2025 | |
|---|---|---|---|---|---|
| Cash from Operations ($M) | $46,327.0M | $46,752.0M | $84,946.0M | $115,877.0M | $139,514.0M |
| — Depreciation & Amortization ($M) | $34,296.0M | $41,921.0M | $48,663.0M | $52,795.0M | $65,756.0M |
| Capital Expenditures ($M) | $61,053.0M | $63,645.0M | $52,729.0M | $82,999.0M | $131,819.0M |
| Free Cash Flow ($M) | -$14,726.0M | -$16,893.0M | $32,217.0M | $32,878.0M | $7,695.0M |
| FCF Margin | -3.1% | -3.3% | 5.6% | 5.2% | 1.1% |
| FCF / Share | -$1.43 | -$1.66 | $3.07 | $3.07 | $0.71 |
| FCF Conversion (FCF/NI) | -44.1% | 620.6% | 105.9% | 55.5% | 9.9% |
| CapEx / Revenue | 13.0% | 12.4% | 9.2% | 13.0% | 18.4% |
| CapEx / D&A | 1.8x | 1.5x | 1.1x | 1.6x | 2.0x |
| Dividends Paid ($M) | — | — | — | — | — |
| Share Repurchases ($M) | $0.0M | $6,000.0M | — | — | — |
Source: Amazon.com, Inc. FY2025 Form 10-K, Consolidated Statements of Cash Flows; figures per the FL model — see Appendix A.1–A.2.
3.3B Cash Flow — Analysis
sources Quality of operating cash flow is high — but FCF is the story, RED flag. Operating cash flow is robust and compounding: it roughly tripled across the window, from $46,327.0M to $139,514.0M, and now comfortably exceeds net income, which is the correct signature of a business generating large non-cash depreciation ($65,756.0M in FY2025) on top of genuine earnings. The problem sits one line below. Free cash flow, after capex, collapsed — from $32,878.0M in FY2024 to just $7,695.0M in FY2025, a decline of more than three-quarters, cutting FCF margin from 5.2% to 1.1% and FCF conversion (FCF/NI) from 55.5% to a mere 9.9%. The divergence between rising GAAP earnings and collapsing cash is the central financial-quality fact of FY2025, and it is entirely explained by capital expenditure. This is not earnings that failed to convert into operating cash — OCF is excellent — it is operating cash being redeployed, in full and then some, into the AI/data-center build.
A critical caveat on FCF conversion. The headline 9.9% conversion figure is measured against reported net income of $77,670.0M — which, per Section 3.1B, is itself inflated by the non-cash Anthropic/Rivian marks. Cash conversion measured against a normalized, operating-based earnings number would be even weaker than the 9.9% shown. The two RED flags compound: reported earnings are flattered by non-cash gains at the same time as cash generation is being consumed by capex.
CapEx analysis — a deliberate supercycle, and reported capex understates it. Capital expenditure jumped from $82,999.0M to $131,819.0M, lifting capex/revenue to 18.4% — the highest in the period — and pushing capex/D&A to 2.0x. [Rating and price target withdrawn — see the note at the top.] Management is explicit that the majority of cash capex supports AWS infrastructure and that it expects capex to increase again in 2026. Two points frame this correctly for valuation. First, reported cash capex understates true capital intensity: on top of the cash line sit finance-lease additions, build-to-suit arrangements, and a large increase in property acquired-but-not-yet-paid (sitting in payables), so total additions to PP&E exceed the cash-capex figure — and that growing unpaid balance modestly flatters reported FCF relative to capital actually put in service. Second, this spend is backed by demand: a very large, multi-year AWS contracted backlog (remaining performance obligations) sits off the balance sheet as forward revenue the capacity is being built to serve. The correct interpretation is not weak cash economics but front-loaded reinvestment at a historically high return on capital (see Section 3.4) — the returns lag the spend.
Capital allocation waterfall. The allocation logic across the five years is stark and internally consistent: essentially all internally generated cash, supplemented by covenant-light debt, has gone to reinvestment. Amazon paid no dividends in any year of the window, and share repurchases were negligible — a single $6,000.0M buyback in FY2022 and nothing since, despite an authorization remaining open. With zero buybacks, the modest share-count creep from stock-based compensation (diluted shares rose from 10,300 to 10,827) flows straight through to dilution unoffset. For a business with AWS/AI reinvestment opportunities generating the ROICs shown in the next subsection, retaining and reinvesting every dollar is the value-maximizing choice — the mix fits the opportunity set. The item for shareholders to hold in view is that the reported declining SBC expense understates the true economic cost of equity compensation (grant-date accounting sits below vest-date value after the shares appreciate), and with no repurchase program that transfer is not being neutralized.
⚠ Items to Watch. - FCF conversion has now fallen for two consecutive years, to 9.9%. A DCF or FCF-yield framework will value Amazon far more cautiously than an earnings multiple until capex intensity plateaus; the FY2025 five-year FCF CAGR of -21.6% quantifies how the capex cycle has eroded trailing cash generation. - Capex/D&A sustained above 2.0x into 2026, as guided, keeps near-term FCF suppressed — the risk to the thesis is not that Amazon is spending, but that the AWS/AI returns fail to materialize on the timeline the spend assumes. - The absence of any buyback against ongoing SBC dilution is acceptable while reinvestment ROICs are high; it would become a governance concern if ROIC fell toward the cost of capital while cash continued to accumulate undeployed.
3.4 Returns Analysis
| FY2021 | FY2022 | FY2023 | FY2024 | FY2025 | |
|---|---|---|---|---|---|
| ROIC | 18.4% | 3.6% | 16.7% | 25.8% | 19.6% |
| ROE | 28.8% | -1.9% | 17.5% | 24.3% | 22.3% |
| ROA | 9.0% | -0.6% | 6.1% | 10.3% | 10.8% |
| Interest Coverage | 13.8x | 5.2x | 11.6x | 28.5x | 35.2x |
Source: Company SEC filings (10-K); figures per the FL model — see Appendix A.1–A.2.
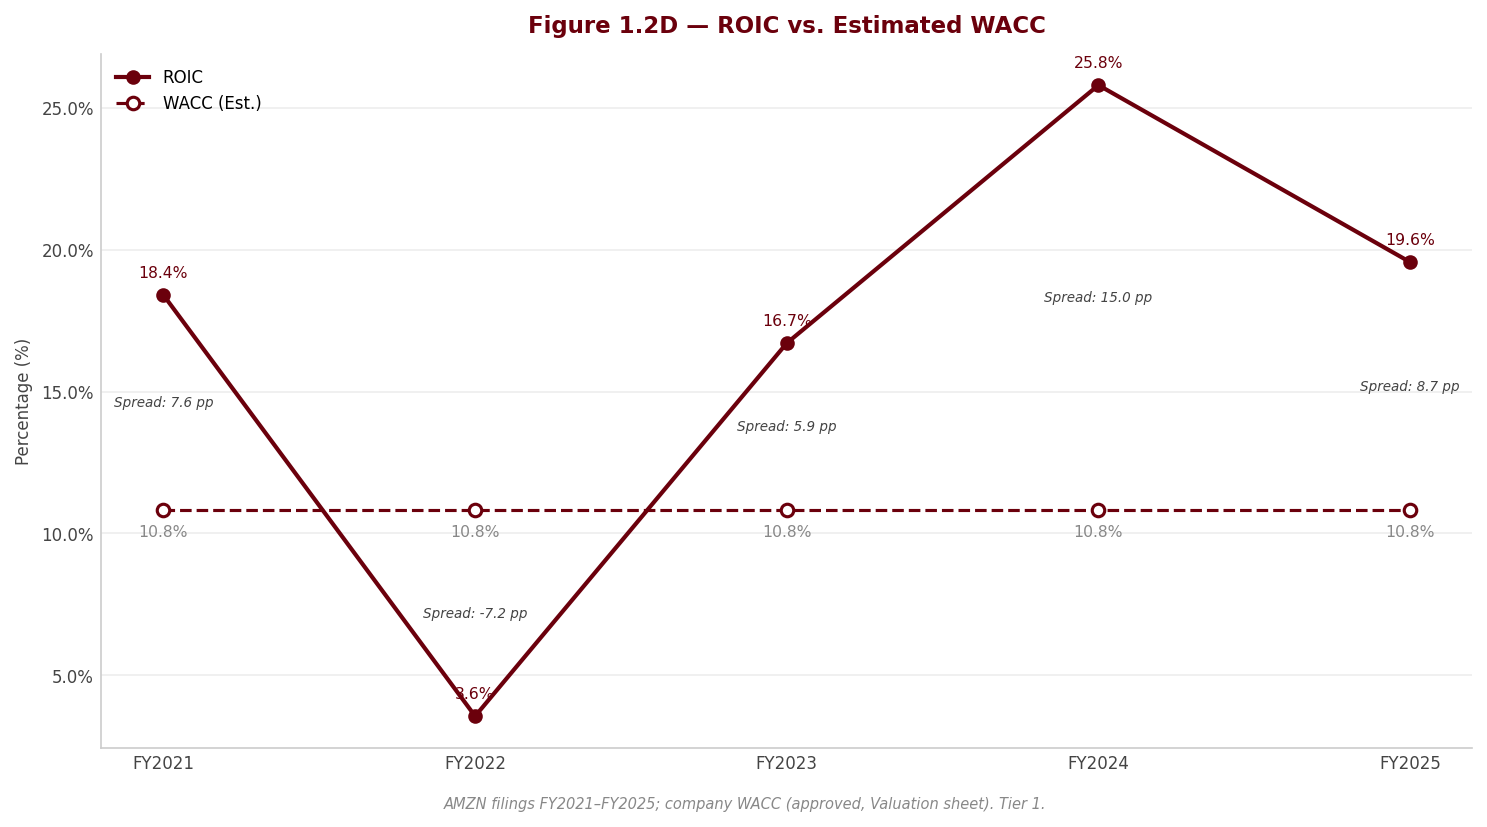
ROIC — the metric that matters, and it clears the bar comfortably. Return on invested capital is the single most important long-term signal for a capital-intensive compounder, and Amazon’s is strong. ROIC recovered from the 3.6% trough of FY2022 — depressed purely by the operating-income collapse that year — to 25.8% in FY2024, before easing to 19.6% in FY2025. That FY2025 step-down deserves interpretation rather than alarm: it is the mechanical signature of a J-curve. Invested capital is ballooning now (PP&E up to $357,025.0M) as the AI/data-center build lands on the balance sheet, while the NOPAT those assets will generate arrives later, as capacity fills against the AWS backlog. Even after the dip, ROIC of 19.6% sits well above any reasonable estimate of Amazon’s cost of capital — the WACC is derived formally in the separate valuation, but a mid-single-digit-to-high-single-digit WACC against a ~19.6% return implies a wide, value-creating spread. The investment case rests on that spread being sustained as the newly deployed capital matures; the risk is that a sufficiently large or ill-timed capex wave temporarily compresses ROIC toward the cost of capital before the returns show up.
DuPont decomposition — margin drives the level, and it is the swing factor. Decomposing FY2025 ROE of 22.3% into its three levers is instructive: net margin of 10.8%, asset turnover of 0.99x, and an equity multiplier of 2.07x. The equity multiplier is low and falling (a function of the deleveraging and equity build documented in 3.2B), so leverage is not manufacturing the return — this is a genuinely un-levered ROE, which is high quality. Asset turnover of 0.99x is drifting down as the asset base builds ahead of the revenue it will produce (the same J-curve as ROIC). That leaves net margin as both the driver of the ROE level and, historically, the swing factor: it is what collapsed in FY2022 and what has recovered since. The essential caveat carries over from 3.1B — FY2025 net margin of 10.8% is itself inflated by the non-operating Anthropic/Rivian marks, so a portion of the reported ROE is non-operating in origin. On an operating basis the ROE would be lower but of higher quality. Interest coverage — 35.2x in FY2025, up from 5.2x in the trough year — confirms the debt load is trivial relative to earnings; solvency is a non-issue.
3.5 Altman Z-Score (Most Recent FY)
| Component | FY2023 | FY2024 | FY2025 |
|---|---|---|---|
| X1 (Working Capital / Total Assets) | 0.014 | 0.018 | 0.014 |
| X2 (Retained Earnings / Total Assets) | 0.215 | 0.277 | 0.306 |
| X3 (EBIT / Total Assets) | 0.070 | 0.110 | 0.098 |
| X4 (Equity / Total Liabilities) | 0.619 | 0.844 | 1.010 |
| X5 (Revenue / Total Assets) | 1.089 | 1.021 | 0.876 |
| Z-Score | 1.76 | 1.96 | 1.87 |
| Zone | Gray | Gray | Gray |
Source: Company SEC filings (10-K); figures per the FL model — see Appendix A.1–A.2.
Interpretation — a gray-zone score that materially understates Amazon’s true credit strength. The Z-Score reads 1.76 in FY2023, 1.96 in FY2024, and 1.87 in FY2025 — the whole span sits in the model’s “gray” zone (1.23–2.90), technically below the >2.90 “safe” threshold. Taken at face value that looks cautionary, and per analytical discipline it should not be softened: the score is in the gray band, and it edged down slightly in FY2025. But it must be read with an understanding of why. The drag is almost entirely the X5 component (revenue/total assets), which fell from 1.089 to 0.876 as the asset base ballooned with the capex supercycle — the identical J-curve that pressured ROIC and asset turnover. The Altman model was calibrated on asset-light manufacturers and structurally penalizes a company that is deliberately front-loading a very large, low-current-turnover asset build; it reads that build as distress-like when it is in fact discretionary growth investment. The other components point the opposite way and are strengthening: X4 (equity/total liabilities) rose sharply to 1.010 on the equity build and deleveraging, and X2 (retained earnings/total assets) improved to 0.306. Reconciled against the hard credit facts — a net-cash position of -$18,414.0M, interest coverage of 35.2x, covenant-light long-dated debt with no maturity wall, and no goodwill-impairment risk — the genuine probability of financial distress is very low. The gray-zone Z-Score here is a model artifact of asset-heavy growth, not a real solvency signal; the trend to watch is X5, which will only recover once revenue grows into the newly built capacity.
4. Valuation withdrawn
This section stated what the shares were worth and what to do about them. It rested on an exit multiple set by hand — across the coverage it averaged 24% below where each company actually traded — so the conclusion largely restated that assumption instead of testing it. Rather than leave it standing, it has been withdrawn while the method is rebuilt.
Nothing else in this report depends on it: the financial analysis above and below is drawn from the company's own filings, and every figure links to the page it was verified against.
Section 5 — Financial Metrics & Peer Benchmarking
5.1 Peer Selection
sources The central difficulty in benchmarking Amazon.com, Inc. is that no publicly traded company mirrors it. Amazon is a conglomerate whose consolidated results blend three structurally different businesses: a vast, thin-margin first- and third-party retail operation; Amazon Web Services, the highest-margin hyperscale cloud franchise; and a fast-growing, very high-margin advertising business. A single-peer comparison is therefore not available at the consolidated level — it can only be approximated by triangulating across companies that each capture one facet of the model. We select three primary-sourced peers on that basis: Walmart as the reference for retail scale and physical/e-commerce logistics; Microsoft as the reference for cloud and AI economics (Azure against AWS); and Alphabet as the combined cloud-plus-advertising reference (Google Cloud against AWS, Google advertising against Amazon Ads). The only genuinely clean comparison is segment-level — AWS versus Azure and Google Cloud — and this section deliberately flags where a consolidated figure conflates businesses that should be read apart.
Two structural cautions apply before any number is read. First, the peer fiscal calendars are not aligned: Walmart’s fiscal 2025 closed on 31 January 2025 and is roughly eleven months stale relative to Amazon’s December-2025 period, while Microsoft’s fiscal 2026 closed on 30 June 2026 and leads Amazon by six months; only Alphabet’s December year-end aligns. Second, the businesses are not like-for-like even where the calendars overlap — Amazon’s blended profitability sits structurally between the thin-margin retailer and the software peers precisely because it is a blend. Both points are developed in the tables and formalised in 5.7.
| Peer | Ticker | Exchange | Filing Type | Accounting Standard | Fiscal Year End | Comparability Note |
|---|---|---|---|---|---|---|
| Walmart Inc. | WMT | NYSE | 10-K (Annual Report FY2025) | US GAAP | January | Retail-scale proxy; FY ended Jan-2025, ~11 months behind Amazon — directional only |
| Microsoft Corporation | MSFT | NASDAQ | 10-K | US GAAP | June | Cloud/AI-margin proxy (Azure vs AWS); FY ended Jun-2026, leads Amazon by 6 months |
| Alphabet Inc. | GOOG | NASDAQ | 10-K | US GAAP | December | Cloud + advertising proxy; calendar-aligned, but bottom line distorted by equity-securities marks |
Source: Peer-company SEC filings; comparability notes in 5.7 — see Appendix A.1.
5.2 Profitability Comparison
sources Comparative: Most Recent Full Fiscal Year
| Metric | Amazon.com, Inc. | Walmart Inc. | Microsoft Corporation | Alphabet Inc. |
|---|---|---|---|---|
| Revenue ($M) | $716,924.0M | $680,985.0M | $331,839.0M | $402,836.0M |
| Gross Margin | 50.3% | 24.9% | 67.9% | 59.7% |
| EBITDA Margin | 20.3% | 6.2% | 58.4% | 37.3% |
| EBIT Margin | 11.2% | 4.3% | 46.8% | 32.0% |
| Net Margin | 10.8% | 2.9% | 40.3% | 32.8% |
| FCF Margin | 1.1% | 1.9% | 20.2% | 18.2% |
Source: Peer-company SEC filings; comparability notes in 5.7 — see Appendix A.1.
Period alignment — Walmart: FY2025 ended Jan-2025 (~11 months behind Amazon); Microsoft: FY2026 ended Jun-2026 (6-month lead); Alphabet: FY2025 ended Dec-2025 (aligned). Gross margin is not comparable across this set (see 5.7); Alphabet’s net margin is inflated by non-operating equity-securities gains (see 5.7). All peer figures are computed from the primary filing; valuation-linked figures are addressed in 5.5.
The gross-margin row is shown for completeness but should not be ranked — it is the least comparable line in this section. Amazon’s cost of sales excludes fulfilment, shipping, and technology/content, all of which sit in separate operating-expense lines, so its 50.3% “gross margin” is not a retailer gross margin and overstates true product economics. Walmart’s cost of sales, by contrast, absorbs distribution and logistics; Microsoft reports a genuine software gross margin; and Alphabet’s cost of revenues carries traffic-acquisition and data-centre costs. Four different definitions produce four numbers that measure different things. The reader should anchor instead on EBIT and EBITDA margin, which are constructed on a far more consistent basis.
On that comparable basis, Amazon’s 11.2% operating margin and 20.3% EBITDA margin sit exactly where the business mix implies: well above Walmart’s retail-only 4.3% EBIT margin, and well below the software economics of Microsoft (46.8%) and Alphabet (32.0%). This is not a sign of operational inferiority to the cloud peers — it is arithmetic. Amazon’s consolidated margin is a weighted average of a large low-margin retail base and a smaller, rapidly expanding high-margin AWS-plus-advertising core, and the blend necessarily lands between the retailer and the pure-software names. The more meaningful signal is the trajectory: as the higher-margin segments compound faster than retail, the consolidated margin has been migrating upward, and the clean read on whether AWS is competitive with Azure and Google Cloud is segment-level, not the consolidated line above. Net margin carries the same caveat plus one more — Alphabet’s 32.8% is lifted by non-operating equity marks (see 5.7), so the bottom-line gap to Amazon’s 10.8% is overstated. FCF margin is discussed with capex intensity in 5.4 and 5.6, where its true drivers are visible.
Historical: Amazon.com, Inc. Own 5-Year Progression
| Metric | FY2021 | FY2022 | FY2023 | FY2024 | FY2025 |
|---|---|---|---|---|---|
| Gross Margin | 42.0% | 43.8% | 47.0% | 48.9% | 50.3% |
| EBITDA Margin | 12.6% | 10.5% | 14.9% | 19.0% | 20.3% |
| EBIT Margin | 5.3% | 2.4% | 6.4% | 10.8% | 11.2% |
| Net Margin | 7.1% | -0.5% | 5.3% | 9.3% | 10.8% |
| FCF Margin | -3.1% | -3.3% | 5.6% | 5.2% | 1.1% |
Source: Peer-company SEC filings; comparability notes in 5.7 — see Appendix A.1.
Amazon’s own five-year progression is the more informative story than any single-year peer snapshot. EBIT margin troughed at 2.4% in FY2022 — the over-build-and-inflation year — before recovering to 10.8% and 11.2%, roughly a doubling in two years, as the company grew into its logistics footprint and AWS margins normalised. EBITDA margin has expanded steadily to 20.3%, and net margin has swung from a slightly negative -0.5% in FY2022 (itself distorted by equity-investment marks) to 10.8%. This internal margin inflection is the structural advantage that a cross-sectional peer table cannot capture: it reflects mix shift toward AWS and advertising, not a cyclical rebound.
5.3 Returns Comparison
sources Comparative: Most Recent Full Fiscal Year
| Metric | Amazon.com, Inc. | Walmart Inc. | Microsoft Corporation | Alphabet Inc. |
|---|---|---|---|---|
| ROIC | 19.6% | 17.6% | 30.8% | 32.1% |
| ROE | 22.3% | 22.2% | 34.0% | 35.7% |
| ROA | 10.8% | 7.6% | 19.4% | 25.3% |
| Asset Turnover (avg. assets) | 0.99x | 2.65x | 0.48x | 0.77x |
Source: Peer-company SEC filings; comparability notes in 5.7 — see Appendix A.1.
ROIC is analyst-computed (underlined) on a consistent NOPAT/invested-capital basis across the set. Alphabet’s ROE and ROA are inflated by a large non-operating equity-securities gain (see 5.7); ROIC strips this item and is the clean cross-company return measure.
The critical point in this table is which return metric to trust. ROE and ROA are contaminated on the Alphabet side by a large, non-operating, largely unrealised equity-securities gain that lifts its reported ROE to 35.7% and ROA to 25.3% — the same class of mark-to-market distortion under current fair-value accounting that has periodically flattered and depressed Amazon’s own bottom line. Ranking Amazon’s 22.3% ROE against Alphabet’s headline figure would therefore mislead. ROIC, which excludes the equity marks and normalises for capital structure, is the disciplined comparison. On that basis Amazon earns 19.6%, comfortably above its cost of capital of 10.81% — the test of durable value creation — and broadly comparable to Walmart’s 17.6%, while sitting below the capital-light software returns of Microsoft (30.8%) and Alphabet (32.1%). That gap is structural, not a management failing: Amazon’s invested-capital base carries a global fulfilment network and the industry’s largest AI/data-centre build, an asset intensity the software peers simply do not bear. Asset turnover makes the same point from the balance-sheet side — Amazon’s 0.99x turns its asset base far faster than the software peers but far slower than Walmart’s asset-light-relative-to-revenue 2.65x retail model, again reflecting the blend.
Historical: Amazon.com, Inc. Own 5-Year Progression
| Metric | FY2021 | FY2022 | FY2023 | FY2024 | FY2025 |
|---|---|---|---|---|---|
| ROIC | 18.4% | 3.6% | 16.7% | 25.8% | 19.6% |
| ROE | 28.8% | -1.9% | 17.5% | 24.3% | 22.3% |
| ROA | 9.0% | -0.6% | 6.1% | 10.3% | 10.8% |
Source: Peer-company SEC filings; comparability notes in 5.7 — see Appendix A.1.
Amazon’s return history underscores that FY2022 was the anomaly, not the trend. ROIC collapsed to 3.6% that year as the company absorbed a doubled fulfilment network and equity-investment losses, then recovered to 25.8% and 19.6% as capacity utilisation improved. The important read for a forward investor is that returns have been rebuilt to comfortably above cost of capital even as the company simultaneously funds the heaviest capital-expenditure cycle in its history — evidence that incremental capital is being deployed at attractive marginal returns rather than diluting them.
5.4 Leverage & Liquidity Comparison
sources Comparative: Most Recent Full Fiscal Year
| Metric | Amazon.com, Inc. | Walmart Inc. | Microsoft Corporation | Alphabet Inc. |
|---|---|---|---|---|
| Net Debt / EBITDA | -0.1x | 0.7x | -0.2x | -0.5x |
| Total Debt / Equity | 0.2x | 0.4x | 0.1x | 0.1x |
| Interest Coverage | 35.2x | 10.8x | 50.9x | — |
| Current Ratio | 1.1x | 0.8x | 1.2x | 2.0x |
| FCF Margin | 1.1% | 1.9% | 20.2% | 18.2% |
Source: Peer-company SEC filings; comparability notes in 5.7 — see Appendix A.1.
Leverage figures exclude operating and finance lease liabilities for cross-peer comparability (see 5.7). Microsoft’s and Alphabet’s cash includes marketable securities per each filing’s own “total cash” subtotal, whereas Amazon’s figure uses cash and equivalents only and excludes its separately reported marketable securities — so Amazon’s true net-cash position is understated here. Alphabet does not present interest expense on the face of its income statement, so its interest coverage is not disclosed (shown as “—”).
The set is uniformly conservatively financed. Amazon runs a net-cash balance sheet — net debt/EBITDA of -0.1x — alongside Microsoft (-0.2x) and Alphabet (-0.5x), while only Walmart carries modest net debt at 0.7x. Two adjustments deepen this picture. First, all four debt figures deliberately exclude lease liabilities for comparability; that matters most for Walmart and for Amazon, both of which carry large lease obligations that a full-balance-sheet view would add back. Second, and more consequential for Amazon specifically, its net-cash position is understated in this table because the cash input captures only cash and equivalents and omits the company’s sizeable marketable-securities holdings — whereas the Microsoft and Alphabet figures already fold marketable securities into their cash concept. On a like-for-like basis Amazon’s net-cash cushion is larger than the -0.1x shown. Debt/equity of 0.2x and interest coverage of 35.2x confirm ample headroom; the current ratio of 1.1x is thinner than Alphabet’s 2.0x but is a feature, not a stress, of Amazon’s negative cash-conversion-cycle model (5.6), where supplier financing funds working capital. The single most important caveat sits in the FCF-margin row: at 1.1%, Amazon appears far below Microsoft and Alphabet, but this is a capex-cycle artifact, developed in 5.6 — not a signal of weak cash economics or balance-sheet strain, which the leverage metrics show to be minimal.
5.5 Valuation Multiples Comparison
sources Comparative: Current Price
| Metric | Amazon.com, Inc. | Walmart Inc. | Microsoft Corporation | Alphabet Inc. |
|---|---|---|---|---|
| EV/EBITDA | 19.1x | 22.4x | 18.5x | 30.0x |
| P/E | 36.3x | 46.9x | 27.1x | 34.6x |
| FCF Yield | 0.3% | 1.4% | 1.8% | 1.6% |
Source: Peer-company SEC filings; comparability notes in 5.7 — see Appendix A.1.
All peer valuation multiples are market-sourced (Tier-2, single-source) and subject to change with price movements; equity prices as of 3–4 August 2026. EBITDA/EPS/FCF denominators are each company’s latest fiscal year (not strict trailing-twelve-month), so Walmart’s multiples pair a current price with ~18-month-old Jan-2025 earnings and overstate its valuation (see 5.7); Alphabet’s P/E is depressed by the equity-mark-inflated earnings denominator (see 5.7).
Read with those caveats, Amazon does not look expensive within its cohort. Its EV/EBITDA of 19.1x sits below Alphabet’s 30.0x and roughly in line with the group, on an EBITDA that — unlike the software peers — is struck after absorbing a far heavier depreciation load from the fulfilment and data-centre build. The headline P/E comparison is the trap in this table: Amazon’s 36.3x looks high on an absolute basis, but Walmart’s 46.9x is mechanically inflated by a stale earnings denominator, and Alphabet’s 34.6x is flattered by equity-mark gains that lift its earnings base. The FCF-yield row again reflects capex timing, not cash quality — Amazon’s 0.3% yield is depressed by the same build cycle that suppresses its FCF margin. The cleaner valuation read is EV/EBITDA against the segment mix, and on that measure Amazon’s multiple embeds a more conservative depreciation base than the pure-software comparators.
Historical: Amazon.com, Inc. EV/EBITDA (period-end price)
| FY2021 | FY2022 | FY2023 | FY2024 | FY2025 |
|---|---|---|---|---|
| 29.3x | 16.1x | 18.6x | 19.2x | 17.0x |
Source: Peer-company SEC filings; comparability notes in 5.7 — see Appendix A.1.
[Rating and price target withdrawn — see the note at the top.] In other words, the multiple has compressed while the underlying economics improved, the opposite of the multiple-expansion-on-deteriorating-fundamentals pattern that warrants caution. A premium to the peer average would require justification; a multiple below the company’s own recent history, set against improving margins and above-cost-of-capital returns, does not.
5.6 Efficiency Comparison
| Metric | Amazon.com, Inc. | Walmart Inc. | Microsoft Corporation | Alphabet Inc. |
|---|---|---|---|---|
| Days Sales Outstanding | 31 days | 5 days | 89 days | 57 days |
| Days Inventory Outstanding | 37 days | 40 days | 5 days | NA |
| Days Payables Outstanding | 111 days | 42 days | 146 days | 27 days |
| Cash Conversion Cycle | -42 days | 4 days | -52 days | 30 days |
| CapEx / Revenue | 18.4% | 3.5% | 34.9% | 22.7% |
Source: Peer-company SEC filings; comparability notes in 5.7 — see Appendix A.1.
Alphabet carries no meaningful merchandise inventory, so its days-inventory and cash-conversion-cycle figures are not comparable to the inventory-carrying names (see 5.7). Microsoft’s working-capital days reflect an enterprise-software collections and payables profile, not a retail one.
Two findings dominate the efficiency comparison. First, Amazon’s working-capital model is a genuine structural advantage among the inventory-carrying businesses: it converts inventory in 37 days, collects in 31 days, and stretches payables to 111 days, producing a negative cash-conversion cycle of -42 days. A negative cycle means suppliers effectively finance Amazon’s growth — customers pay before Amazon pays its vendors — which is why the thin current ratio noted in 5.4 is a design choice rather than a liquidity concern. Walmart, the truest retail comparator, runs a positive cycle of 4 days; Amazon’s is structurally superior. Alphabet is excluded from this ranking because it holds no inventory.
Second, the capex row is the single most important line for interpreting everything else in this section. At 18.4% of revenue, Amazon is in a heavy investment cycle alongside the other two hyperscalers — Microsoft at 34.9% and Alphabet at 22.7% — versus Walmart’s steady-state retail capex of just 3.5%. This wide capex/revenue gap across the three cloud/AI builders, against Walmart’s low-single-digit intensity, is the direct cause of the depressed free-cash-flow margins and yields shown earlier. Amazon’s low-single-digit FCF margin is not a cash-economics weakness; it is the mechanical consequence of funding the largest combined AI, cloud, and logistics build in the group out of current cash flow. As this capex intensity normalises against a growing revenue base, the gap between Amazon’s high EBITDA margin and its low FCF margin should narrow — the central reason FCF margin must not be read as a profitability signal in this cohort.
5.7 Comparability Caveats
sources This section is a like-for-consolidated comparison, and every material limitation must be stated plainly rather than buried. The following caveats apply to the tables above.
Fiscal-period misalignment (Walmart, Microsoft). Walmart’s fiscal 2025 closed on 31 January 2025 and overlaps Amazon’s December-2025 period by roughly one month; its growth, leverage, and valuation figures are approximately eleven months stale and must be treated as directional, not contemporaneous. A more recent Walmart fiscal year exists but was not in the primary-source folder, and per this pipeline’s sourcing rules it was not substituted with an aggregator. Microsoft’s fiscal 2026 closed on 30 June 2026 and instead leads Amazon by six months, capturing two additional AI-heavy quarters; its margins and returns sit half a year ahead of Amazon’s and Alphabet’s. Only Alphabet’s December year-end aligns with Amazon.
Gross margin is not comparable (all four). As detailed in 5.2, each company defines cost of revenue differently — Amazon excludes fulfilment, shipping, and technology/content; Walmart includes distribution and logistics; Microsoft and Alphabet report software/services cost bases. The four gross-margin figures measure different things and are not ranked. EBIT and EBITDA margin are the appropriate profitability comparison.
Alphabet’s bottom line is distorted by equity marks (Alphabet). Alphabet’s FY2025 net income is inflated by a large net gain on debt and equity securities within “other income,” largely unrealised mark-to-market on its equity portfolio. This non-operating, volatile item lifts Alphabet’s net margin, ROE, and ROA and compresses its trailing P/E. Amazon’s own results carry the same class of equity-investment marks in some years, so bottom-line comparisons across the whole set are contaminated by fair-value accounting. Operating margin (EBIT/EBITDA) and ROIC exclude the marks and are the clean read.
Capex-cycle distortion of FCF and capital intensity (Amazon, Microsoft, Alphabet). The three cloud/AI builders are in a heavy data-centre build cycle — capex/revenue in the high-teens to mid-thirties percent range — against Walmart’s low-single-digit intensity. This crushes reported free-cash-flow margins despite high EBITDA margins. Amazon’s low-single-digit FCF margin is a timing artifact of the build, not weak cash generation, and FCF-based metrics should be read in that light.
Business mix — no single peer captures Amazon (all four). Amazon’s consolidated margins are a weighted blend of low-margin retail, high-margin AWS, and high-margin advertising. Walmart proxies retail scale, Microsoft proxies cloud/AI margins (Azure vs AWS), and Alphabet proxies cloud plus advertising, but none mirrors the whole. The only genuinely clean comparison is segment-level — AWS against Azure and Google Cloud — and every table in this section is consolidated, not segment-level.
Cash concept and lease exclusion (all four). For net debt, Microsoft’s and Alphabet’s cash figures include short-term/marketable securities per each filing’s own “total cash” subtotal, whereas Amazon’s figure uses cash and equivalents only and excludes its separately reported marketable securities — understating Amazon’s true net-cash position relative to the software peers. All four debt figures exclude operating and finance lease liabilities for comparability, which understates leverage most for the lease-heavy names (Walmart, Amazon). All are lightly levered or net-cash regardless.
Alphabet inventory and interest disclosure (Alphabet). Alphabet holds no material inventory, so its days-inventory and cash-conversion-cycle figures are not comparable to the retailers and are excluded from those rankings. Alphabet’s interest expense is netted within “other income” and not presented on the face of its income statement, so its interest coverage is not disclosed (shown as “—” rather than estimated); its leverage is trivial in any case.
Valuation multiples are market-sourced and approximate (all four). All EV/EBITDA, P/E, EV/revenue, and FCF-yield figures are single-source, market-sourced, and change with price; equity prices are as of 3–4 August 2026. The earnings and cash-flow denominators are each company’s latest fiscal year rather than a strict trailing-twelve-month figure, so Walmart’s multiples pair a current price with roughly eighteen-month-old Jan-2025 earnings and overstate its valuation, and Alphabet’s P/E is distorted by its equity-mark-inflated earnings base. Multiples should be read as directional, not precise.
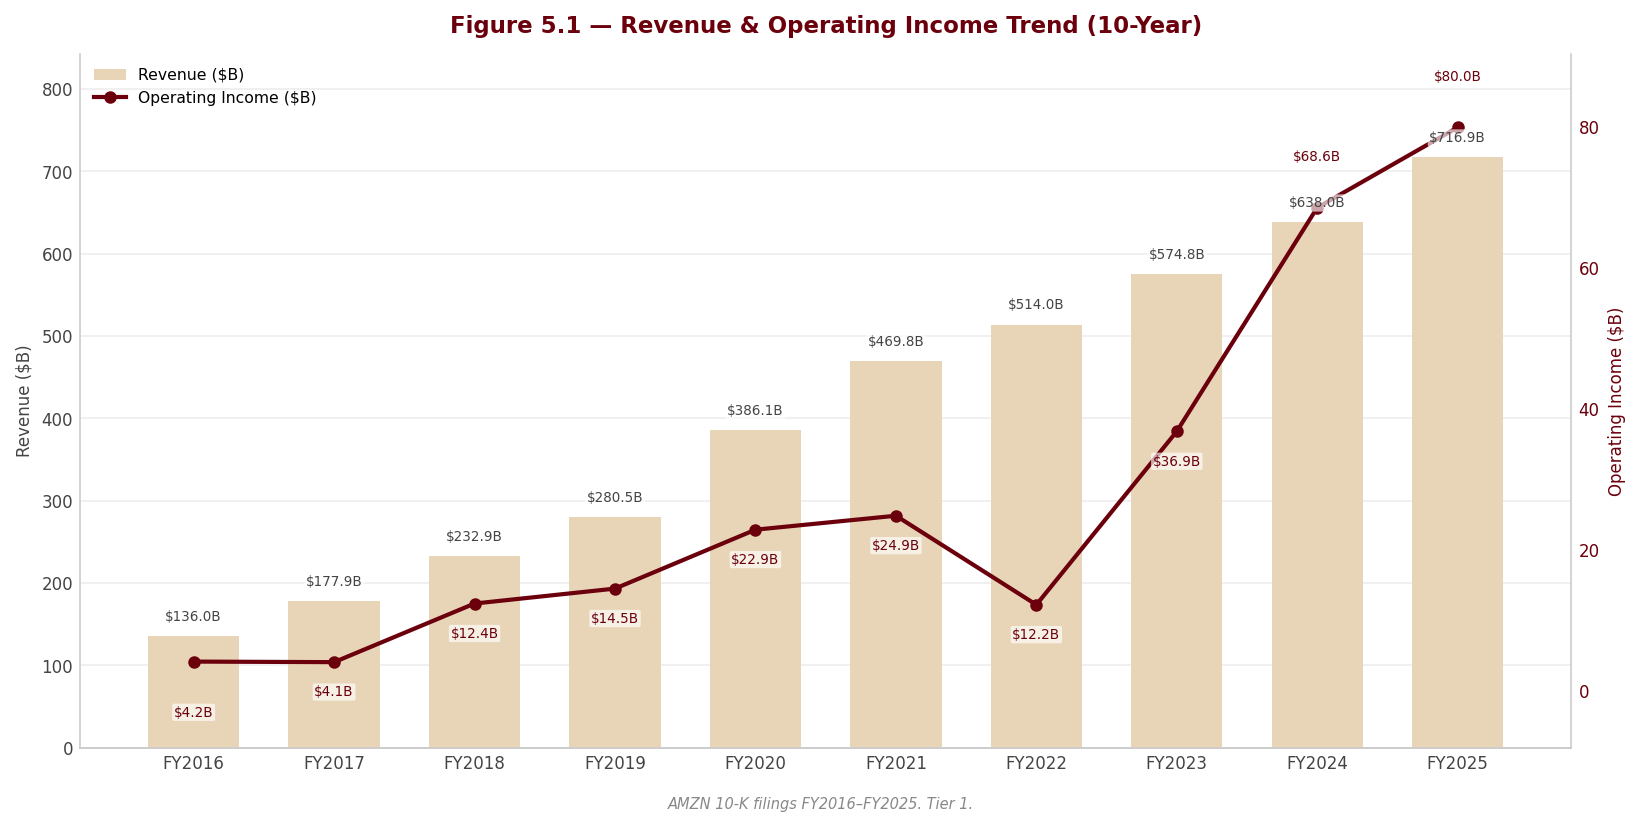
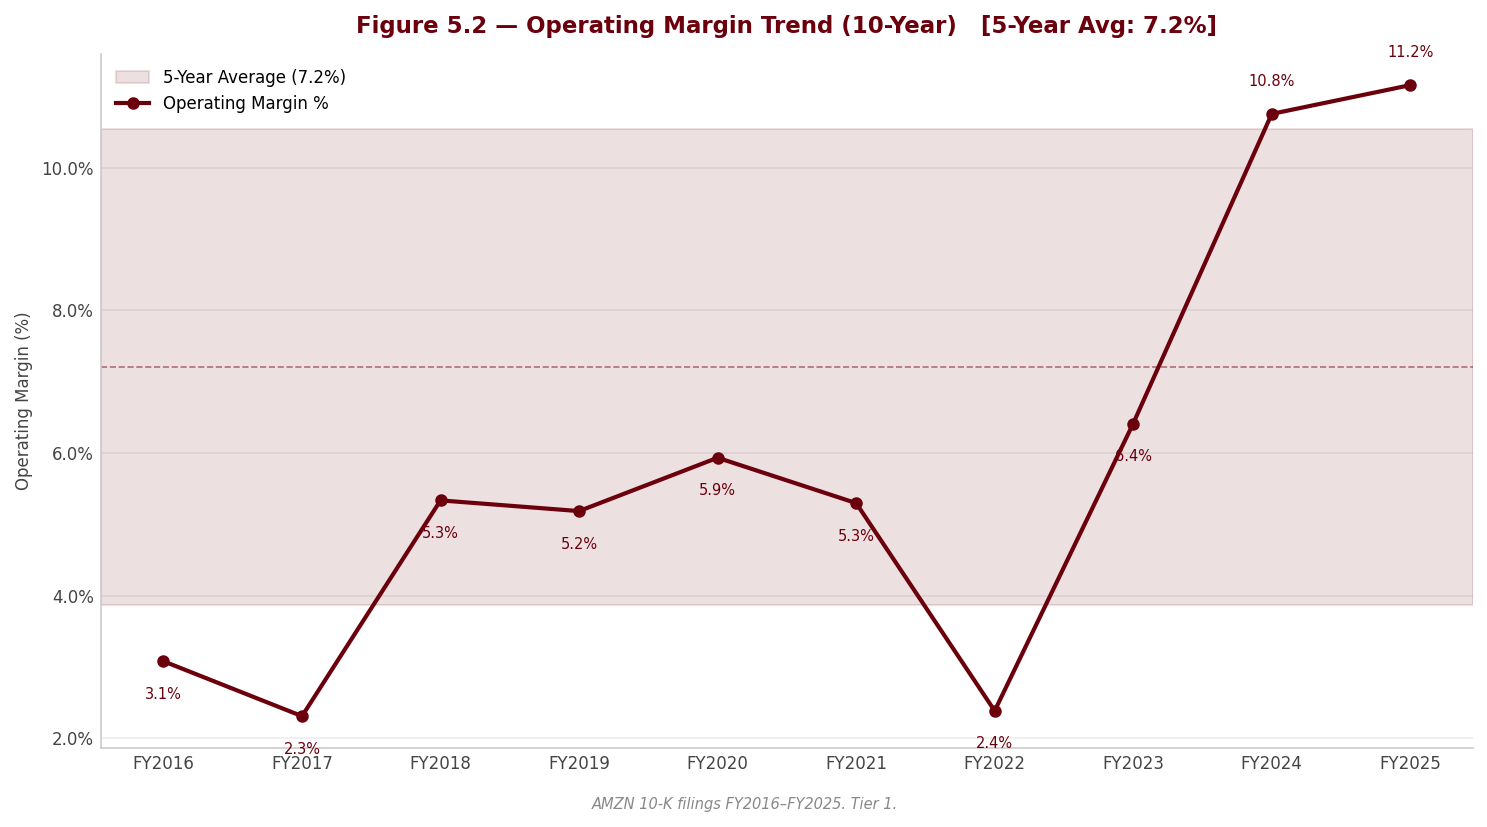
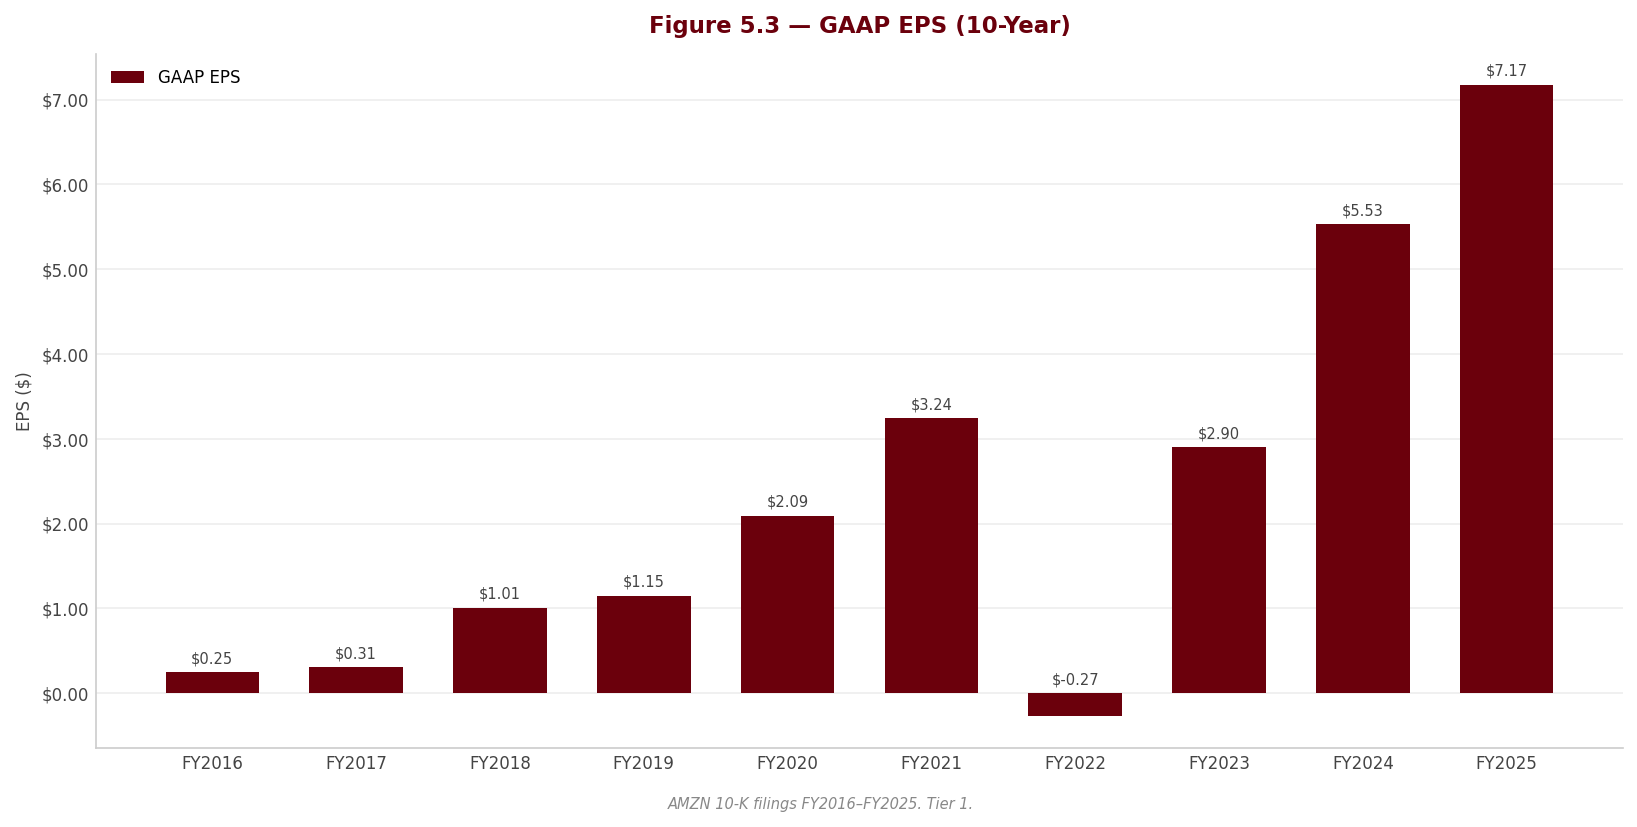
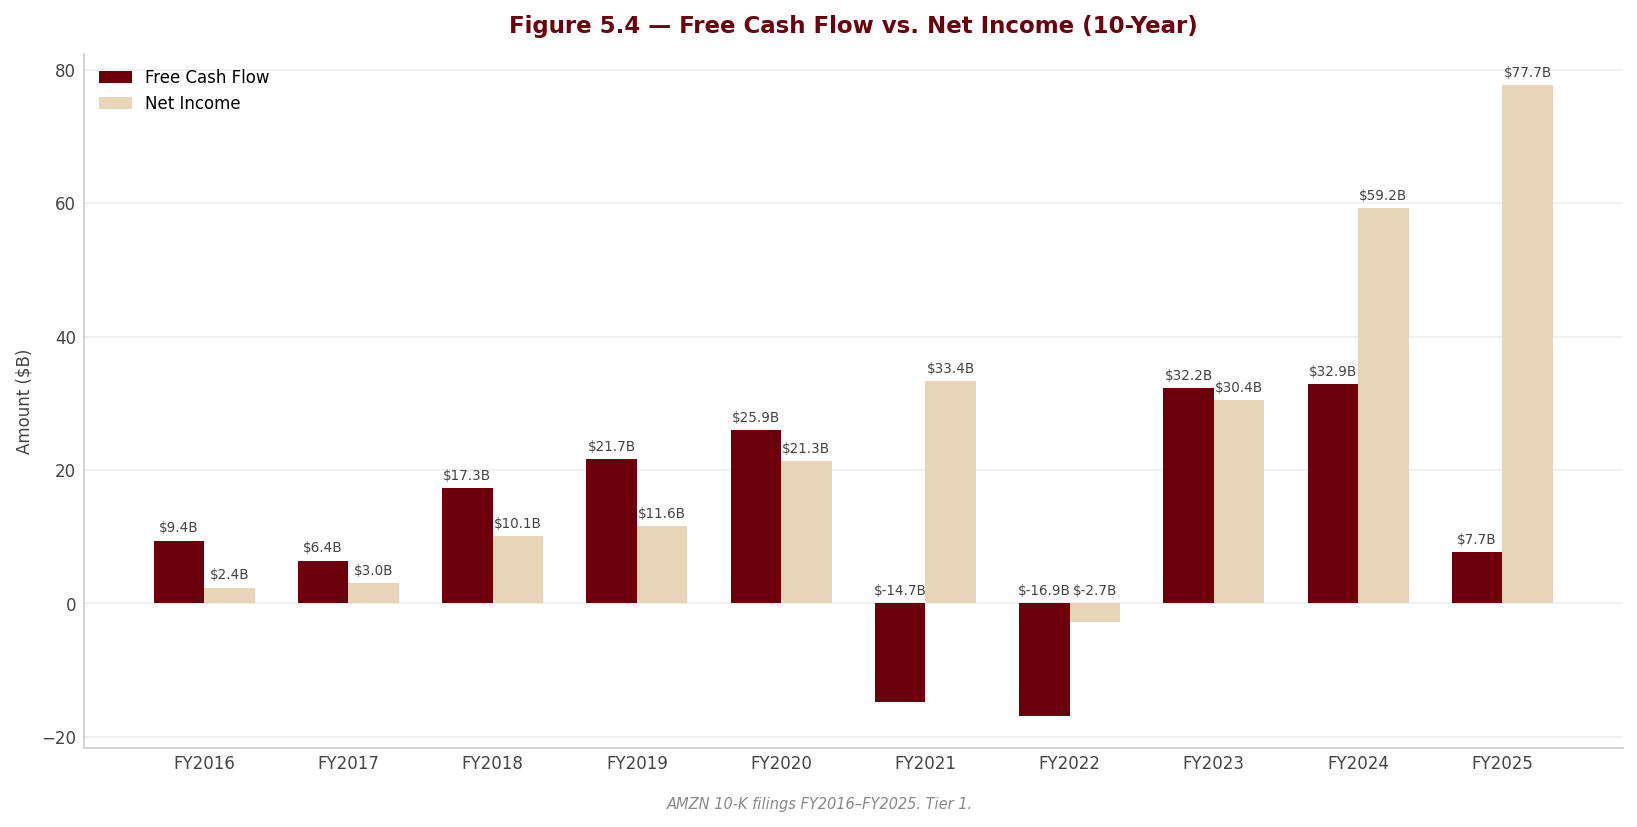
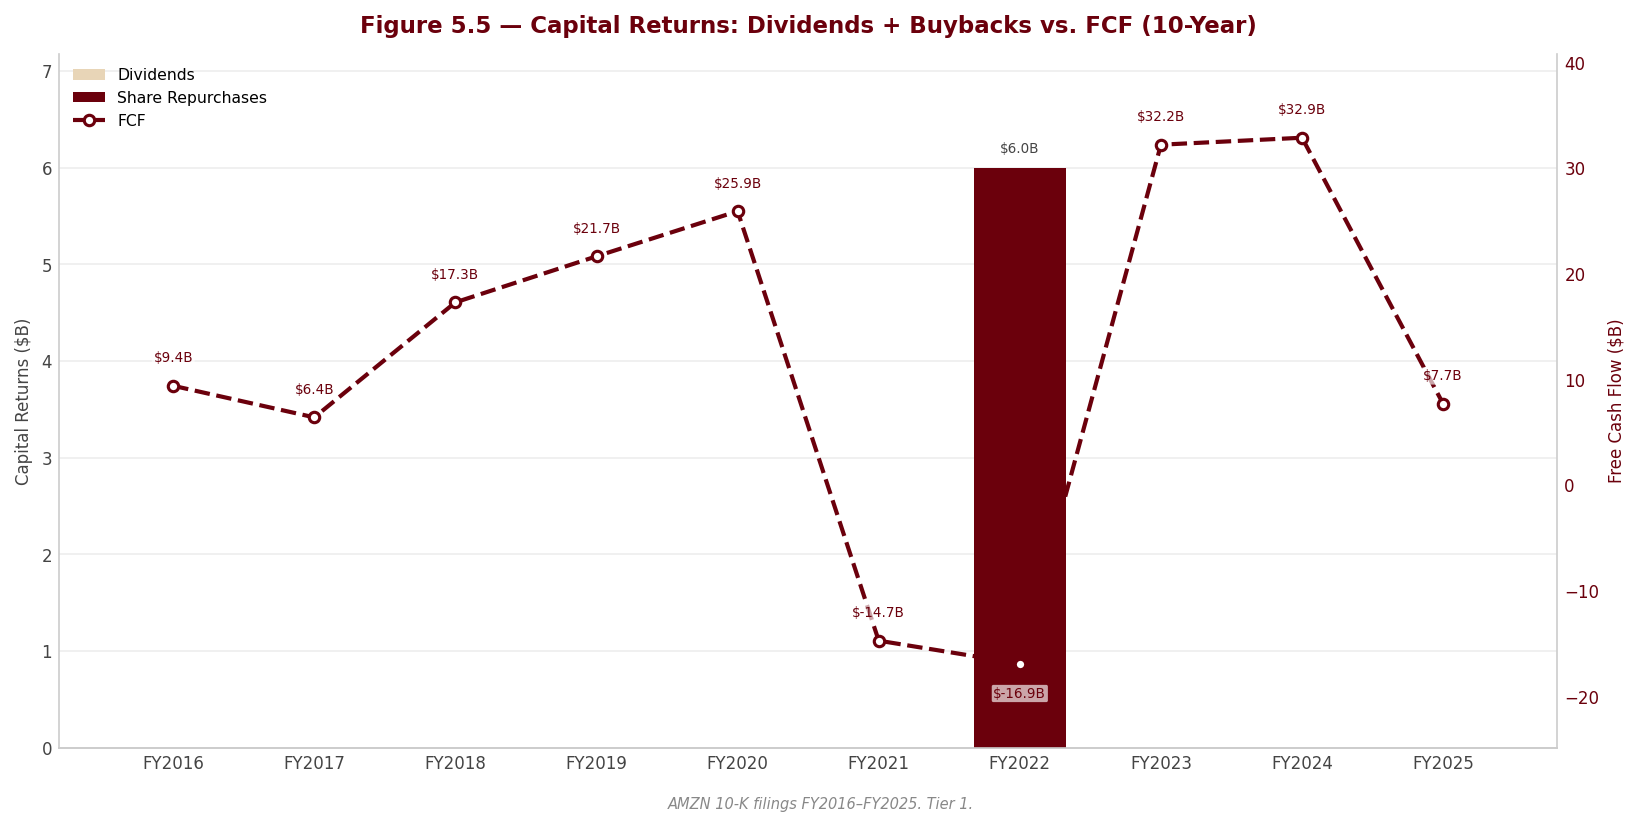
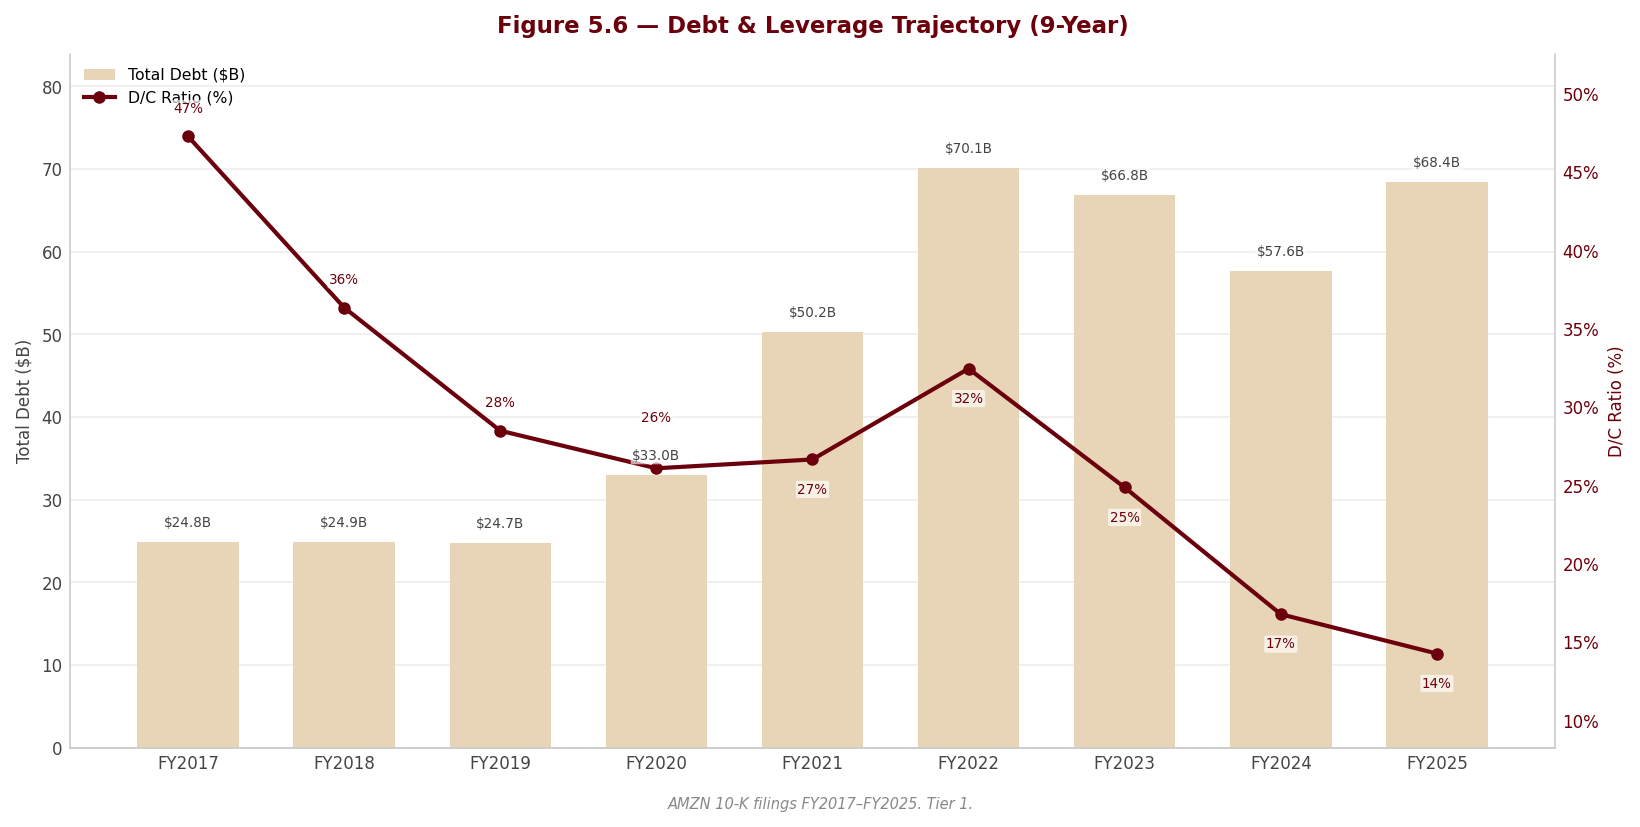
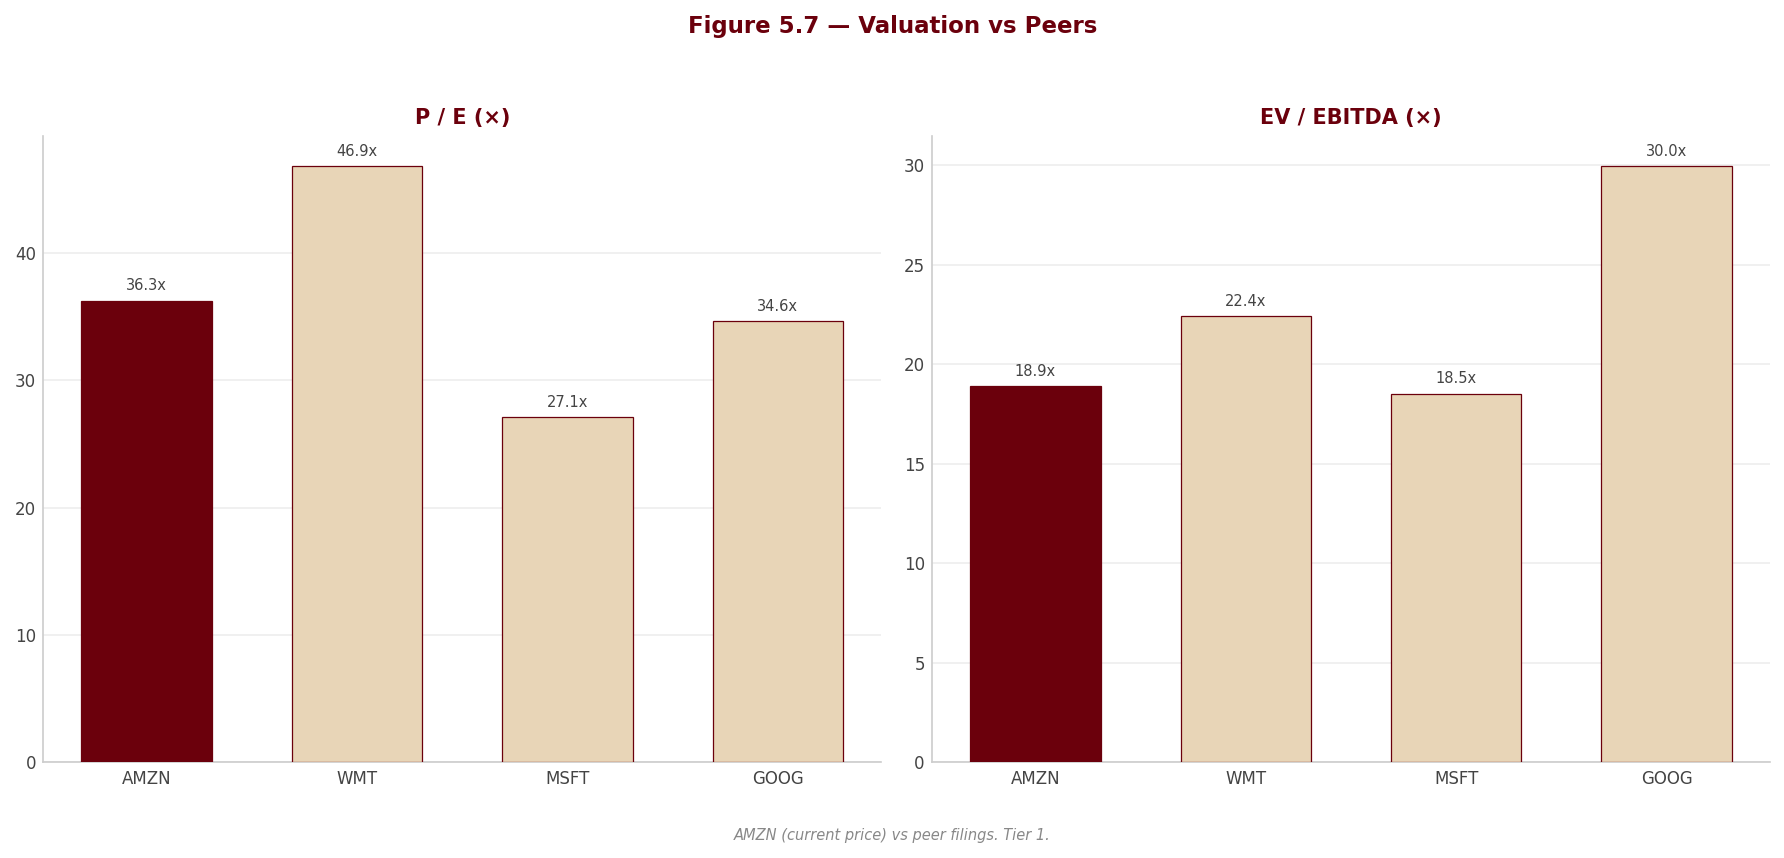
6. Valuation & Price Target withdrawn
This section stated what the shares were worth and what to do about them. It rested on an exit multiple set by hand — across the coverage it averaged 24% below where each company actually traded — so the conclusion largely restated that assumption instead of testing it. Rather than leave it standing, it has been withdrawn while the method is rebuilt.
Nothing else in this report depends on it: the financial analysis above and below is drawn from the company's own filings, and every figure links to the page it was verified against.
Section 7 — Quarterly Update: Q2 2026
Portfolio Action
[Rating and price target withdrawn — see the note at the top.]
| Assessment | |
|---|---|
| Action | [Rating and price target withdrawn — see the note at the top.] |
| Reason | A genuinely strong operating quarter does not close the valuation gap. AWS operating income rose +63.6% YoY to $16,621M with segment margin expanding to 39.4% (+6.4 pp), but free cash flow swung to -$8,821.0M on record $54,208.0M of capex, and part of the AWS reacceleration is tied to Anthropic/OpenAI, entities Amazon itself funds. [Rating and price target withdrawn — see the note at the top.] |
| Thesis intact? | [Rating and price target withdrawn — see the note at the top.] Headline net income of $62,647.0M and EPS of $5.75 are dominated by a non-cash Anthropic mark (~96% of the quarter non-operating gain, and the large majority of net income), while negative FCF and circular AI demand reinforce the valuation caveats rather than resolve them. |
| Trigger to revisit | [Rating and price target withdrawn — see the note at the top.] |
7.1 Results at a Glance
| Metric | Q2 2026 | Q2 2025 | YoY Δ | Q1 2026 | QoQ Δ |
|---|---|---|---|---|---|
| Revenue ($M) | $200,606.0M | $167,702.0M | +19.6% | $181,519.0M | +10.5% |
| Gross Profit ($M) | $104,828.0M | $86,893.0M | +20.6% | $94,056.0M | +11.5% |
| Gross Margin | 52.3% | 51.8% | +0.4 pp | 51.8% | +0.4 pp |
| EBITDA ($M) | $47,449.0M | $34,398.0M | +37.9% | $42,797.0M | +10.9% |
| EBITDA Margin | 23.7% | 20.5% | +3.1 pp | 23.6% | +0.1 pp |
| EBIT ($M) | $27,461.0M | $19,171.0M | +43.2% | $23,852.0M | +15.1% |
| EBIT Margin | 13.7% | 11.4% | +2.3 pp | 13.1% | +0.5 pp |
| Net Income ($M) | $62,647.0M | $18,164.0M | +244.9% | $30,255.0M | +107.1% |
| Net Margin | 31.2% | 10.8% | +20.4 pp | 16.7% | +14.6 pp |
| Diluted EPS | $5.75 | $1.68 | +242.3% | $2.78 | +106.8% |
YoY Δ = (CQ - PYSQ) / |PYSQ| × 100; QoQ Δ = (CQ - PQ) / |PQ| × 100. Margins: line ÷ Revenue × 100; margin Δ in percentage points (pp).
Source: Amazon.com, Inc. Form 10-Q for the quarterly period ended June 30, 2026, Consolidated Statements of Operations (p. 4).
Read the quarter off operating income, not net income. Operating income of $27,461.0M (+43.2% YoY) is the real result. Reported net income of $62,647.0M and diluted EPS of $5.75 are dominated by a $50,486M non-cash, Level-3 upward mark on Amazon’s Anthropic nonvoting preferred stock, booked in “Other income (expense), net” (10-Q p. 8). “Other income (expense), net” of $53,415M in the quarter is 1.95× operating income — the headline earnings surge is an accounting mark, not operating strength, and it can reverse.
7.2 P&L Drivers
sources Revenue: Net sales grew +19.6% YoY to $200,606.0M (+20% as reported, FX-neutral, with FX immaterial in the quarter), led by AWS, which reaccelerated to +37% YoY (segment sales of $42,232M) on increased customer usage, up from +17% a year earlier; North America grew +16% to $116,177M and International +15% to $42,197M, both on higher unit volumes, advertising, and subscriptions (10-Q pp. 22, 29–30). Advertising services (+26% to $19,809M) and third-party seller services (+16% to $46,780M) again outgrew first-party online stores (+15% to $70,432M), continuing the mix shift toward higher-margin services (10-Q p. 23). Sequentially, revenue rose +10.5% vs. $181,519.0M in Q1 2026.
Cost and margin: COGS rose to $95,778.0M from $80,809.0M (+18.5% YoY), slightly below revenue growth — helped by ~$640M of IEEPA tariff refunds recorded mostly as a reduction to cost of sales in North America (10-Q p. 7) — so gross margin edged up to 52.3% (+0.4 pp YoY). The larger story is operating leverage: EBIT margin expanded +2.3 pp YoY to 13.7% as fulfillment fell to 14.8% of sales (from 15.5%) and G&A to 1.4% (from 1.8%), even as technology-and-infrastructure spend rose to 16.5% of sales on AI/data-center depreciation (10-Q p. 30). D&A (the model’s cash-flow-based measure) was $19,988.0M vs. $15,227.0M a year ago (+31.3%), reflecting the stepped-up AWS asset base; this margin gain is structural (mix + scale) rather than a one-off.
Below the line: Interest expense rose to $1,314.0M, up from $516M in Q2 2025, as Amazon added tens of billions of new senior notes during 2026 (10-Q pp. 4, 32); interest income of $1,295M nearly offset it. The single item that breaks net-income comparability is the $50,486M Anthropic upward fair-value mark; excluding it (and related items), underlying results are captured by operating income, not EPS. Diluted EPS of $5.75 rose +$4.07 (+242.3%) YoY and +$2.97 (+106.8%) QoQ — almost entirely the mark, not the business.
7.3 Balance Sheet & Cash Flow
| Metric | Q2 2026 | Q2 2025 | YoY Δ | Q1 2026 | QoQ Δ |
|---|---|---|---|---|---|
| Cash ($M) | $78,213.0M | $57,741.0M | +35.5% | $101,816.0M | -23.2% |
| Net Debt ($M) | $50,681.0M | -$1,845.0M | +2,846.9% | $17,258.0M | +193.7% |
| Net Debt / LTM EBITDA | —ᵃ | — | — | — | — |
| Total Assets ($M) | $1,095,689.0M | $682,170.0M | +60.6% | $916,630.0M | +19.5% |
| Equity ($M) | $551,620.0M | $333,775.0M | +65.3% | $441,914.0M | +24.8% |
| OCF ($M) | $45,387.0M | $32,515.0M | +39.6% | $26,032.0M | +74.4% |
| CapEx ($M) | $54,208.0M | $32,183.0M | +68.4% | $44,203.0M | +22.6% |
| FCF ($M) | -$8,821.0M | $332.0M | -2,756.9% | -$18,171.0M | +51.5% |
| Dividends Paid ($M) | $0.0M | $0.0M | 0.0% | $0.0M | 0.0% |
YoY Δ = (CQ - PYSQ) / |PYSQ| × 100; QoQ Δ = (CQ - PQ) / |PQ| × 100. CapEx shown as a positive outflow magnitude; FCF = OCF - CapEx (net of sale proceeds), stored negative when cash was consumed.
ᵃ Net Debt / LTM EBITDA is not computable from the authorized sources without estimation: the Section-7 data pack exposes standalone EBITDA for only three quarters (Q2 2026, Q1 2026, Q2 2025), not the four consecutive trailing quarters an LTM figure requires, and the Q2 2026 10-Q does not disclose standalone Q3 2025 or Q4 2025 EBITDA. As a leverage proxy, net debt of $50,681.0M is roughly 0.3× the $161,403M of operating cash flow Amazon generated in the twelve months ended June 30, 2026 (10-Q p. 3) — leverage remains negligible even amid the capex surge.
Source: Amazon.com, Inc. Form 10-Q for the quarterly period ended June 30, 2026, Consolidated Balance Sheets (p. 6) and Consolidated Statements of Cash Flows (p. 3).
Balance sheet note: The balance sheet inflated dramatically QoQ: total assets rose +19.5% to $1,095,689.0M and equity +24.8% to $551,620.0M, driven by (i) “Other assets” more than doubling to $284,132M as the Anthropic nonvoting-preferred carrying value jumped to $92.5B and OpenAI preferred to $28.7B, and (ii) PP&E rising to $446,046M on the AI build (10-Q pp. 6, 12). Net debt swung to +$50,681.0M from +$17,258.0M in Q1 — a $33.4B QoQ deterioration — as cash fell -23.2% QoQ to $78,213.0M and long-term debt roughly doubled to $128,894M on $66,998M of new long-term-debt proceeds in 1H 2026 (10-Q pp. 3, 6, 17); the debt carries no financial covenants (10-Q p. 17).
Cash flow note: Cash did not track earnings this quarter. FCF conversion = FCF / Net Income = -$8,821.0M / $62,647.0M = -14.1%, but that ratio is distorted on both ends: net income is inflated by the non-cash Anthropic mark, and FCF is negative because capex hit a record $54,208.0M (+68.4% YoY) against OCF of $45,387.0M (+39.6% YoY). FCF was -$8,821.0M versus a positive $332.0M a year ago; on a trailing-twelve-month basis Amazon’s own reconciliation shows FCF of -$7,604M, down from +$18,184M a year earlier (10-Q p. 33). The divergence is deliberate AI/data-center investment — AWS net PP&E additions alone were $48,604M in the quarter (10-Q p. 25) — not a working-capital problem.
7.4 Footnote Review
sources Note 1 — Accounting Policies and Supplemental Disclosures (10-Q pp. 7–10) Confirms unaudited interim basis and consolidation of VIEs “including certain entities in India” and healthcare/video entities — consolidation policy unchanged vs. the 2025 10-K (p. 7). New this quarter: ~$640M of IEEPA tariff refunds recorded mainly against cost of sales, primarily North America, described as “the significant majority of refunds we expect to receive” — a modest, largely non-recurring cost tailwind (p. 7). The “Other income (expense), net” table (pp. 7–8) is the analytically decisive disclosure: a $50,486M upward adjustment on Anthropic nonvoting preferred, plus $1,319M marketable-equity gains and $1,449M equity-warrant gains — the source of the net-income distortion. Supplemental cash-flow data show “property and equipment acquired but not yet paid” rose $10,700M in the quarter (p. 7), meaning true capital intensity exceeds even the record cash capex. Materially changed vs. prior quarters by the size of the Anthropic mark.
Note 1 (cont.) — Energy derivatives, inventory, receivables, RPO (10-Q pp. 9–10) Level-3 long-dated energy contracts (≈270 million MWh, ~15-year weighted duration) produced net unrealized gains of $551M in Q2 2026, recorded in “Technology and infrastructure” and primarily impacting AWS — immaterial in the prior-year quarter, so this is a new (small) operating-income volatility source management flags as potentially material later (p. 9). Inventory valuation allowance was $3.0B (vs. $3.3B at year-end), unchanged in policy (p. 9). AWS-heavy remaining performance obligations (RPO) with original terms over one year were ~$496B at June 30, 2026, weighted-average life 6.4 years (p. 10) — up sharply from ~$244B disclosed in the 2025 10-K, a strong forward-demand signal but a backlog, not booked revenue. Amazon also announced a $100B OpenAI commitment expansion and a $100B+ Anthropic expansion this quarter, both “including contractual obligations related to the performance of AWS chips” (p. 10).
Note 2 — Financial Instruments / Non-Marketable Investments (10-Q pp. 10–13) The core related-party/quality note. Amazon’s Anthropic nonvoting-preferred carrying value rose to $92.5B (from $14.8B at year-end) and the convertible-notes fair value to $97.9B (from $45.8B), with a $92.0B unrealized gain now sitting in AOCI (from $39.5B) awaiting future recycling (p. 12). In Q2 2026 Amazon invested a further $10.0B in Anthropic ($5.0B Series G + $5.0B Series H) and set up a facility of up to $20.0B, reduced to $15.0B after the Series H draw (pp. 11–12). Total private-company equity investments (chiefly Anthropic and OpenAI) reached a $122.3B carrying value, up from $16.2B (p. 12). Materially changed and central to the thesis: this is the asset whose mark drove the P&L and whose reversal is the key downside risk.
Note 3 — Leases (10-Q pp. 13–14) Total lease cost was $5,636M in the quarter (vs. $4,984M) with operating-lease present value of $96,320M and finance-lease PV of $13,451M (pp. 13–14). [Rating and price target withdrawn — see the note at the top.] Changed only modestly; consistent with the data-center build continuing to land on balance sheet.
Note 4 — Commitments and Contingencies (10-Q pp. 15–16) Principal contractual commitments total $650.0B, including $137.2B of “Leases not yet commenced” and $130.1B of “Unconditional purchase obligations” (energy, content, equipment, software) — both grew with the AI build and represent large off-balance-sheet forward obligations (p. 15). New this quarter: the April 13, 2026 definitive agreement to acquire Globalstar for ~$10.9B (cash/stock), expected to close in 2027, with related service and equity-redemption agreements involving Apple (p. 15). Legal proceedings (see below) are incorporated here. Changed vs. prior quarter by the Globalstar agreement and the growth in committed capacity.
Note 5 — Debt (10-Q pp. 17–18) Unsecured senior notes reached $132.1B, following a very heavy 2026 issuance program — $37.0B (March), €14.5B, CHF2.8B, and C$14.0B — with a combined weighted-average remaining life of 14.2 years, estimated fair value $123.8B, and, importantly, “We are not subject to any financial covenants under the Notes” (pp. 17). No borrowings were outstanding under the $30.0B commercial-paper programs, the $20.0B revolvers, or the new $17.5B delayed-draw term loan; standby letters of credit totaled $13.4B (p. 18). Materially changed — debt roughly doubled to fund capex — but covenant-light and well-laddered, so not a near-term solvency constraint.
Note 6 — Stockholders’ Equity (10-Q pp. 18–20) Stock-based compensation was $6,038M in the quarter, down from $6,534M a year earlier, while $24.8B of unrecognized comp remains (pp. 18–19). Critically, there were no share repurchases in 1H 2026 (or 1H 2025), with $6.1B still authorized (p. 18), so ongoing net issuance (diluted shares 10,903M vs. 10,806M) dilutes holders without offset. Confirmed consistent with the prior year in posture (declining SBC, zero buybacks); the analytical point — economic dilution unoffset — is unchanged.
Note 7 — Income Taxes (10-Q pp. 21–22) The 1H 2026 tax provision was $27.8B, including $15.9B of net discrete tax expense “primarily attributable to the upward adjustments to our investments in Anthropic,” and deferred taxes swung to a $17,691M expense in the quarter (pp. 21, 3) — i.e., the Anthropic mark carries a large embedded future tax cost not visible in headline net income. Meanwhile IRS Notice 2026-7 (R&D) cut cash taxes: cash tax paid fell to $2.7B in Q2 2026 from $4.8B (p. 21). Income tax contingencies rose to $7.1B (from $6.6B) (p. 21). The India cloud-services assertion (“payments could be significant in the aggregate”) and the Luxembourg intangible-basis dispute remain live and unquantified (p. 21). Changed vs. prior quarter chiefly by the Anthropic-driven discrete tax expense.
Note 8 — Segment Information (10-Q pp. 22–25) The profit-engine disclosure. AWS operating income rose to $16,621M from $10,160M (+63.6%) on sales of $42,232M — a 39.4% segment margin, up 6.4 pp YoY, reversing the FY2025 compression trend flagged in prior work (p. 22). North America operating income was $9,123M (7.9% margin) and International $1,717M (4.1% margin) (p. 22). AWS carried the capital load: AWS net PP&E additions were $48,604M in the quarter (vs. $16,043M) and AWS D&A rose to $8,076M (from $4,844M) (p. 25). Segment definitions unchanged (three segments, usage-based allocation), so the AWS margin expansion is a real operating result, not a reclassification.
MD&A, Controls, and Guidance (10-Q pp. 26–37) Cash capex was $53.1B in the quarter and $96.3B for 1H, “both of which we expect to increase in 2026” (p. 27). Disclosure controls were concluded effective with no change in ICFR during the quarter (p. 37). Q3 2026 guidance (issued July 30, 2026): net sales $197.0–202.0B and operating income $22.5–26.5B (vs. $17.4B in Q3 2025), assuming no energy-derivative remeasurement impact (p. 35) — implying continued operating-income growth.
Related-party transactions (10-Q pp. 11–13) Amazon has no controlling shareholder; the material related-party matter is the circular Anthropic/OpenAI relationship. Amazon both finances these investees and books AWS revenue from them: it holds $92.5B of Anthropic nonvoting preferred and $97.9B of Anthropic convertible notes (up from $14.8B and $45.8B at year-end), invested a further $10.0B in Anthropic and $13.7B in OpenAI (of a $28.7B total) in the quarter, and committed a further $15.0B facility to Anthropic (pp. 11–12). In the same period it announced a $100B+ Anthropic AWS-commitment expansion and a $100B OpenAI expansion, both explicitly “including contractual obligations related to the performance of AWS chips” (p. 10). The filing does not quantify how much AWS revenue is attributable to these investees, and both are VIEs Amazon does not consolidate (p. 13). Terms were expanded (not reduced) this quarter versus the 2025 10-K. This is the principal quality caveat on the AWS reacceleration and cannot be independently verified as arm’s-length from the 10-Q.
Contingencies and litigation (10-Q pp. 15–16) Open matters, unchanged in character from the 2025 10-K and Q1 2026 10-Q except as supplemented: (i) Illinois BIPA biometric-privacy class actions (Wilcosky, Hogan) seeking unspecified damages across Alexa, AWS, Photos, and Just Walk Out; (ii) antitrust/consumer-protection cases by the FTC, state AGs, and private litigants (originating with Frame-Wilson) “seek billions of dollars of alleged damages,” treble/punitive damages, and structural relief, with one U.S. class certified and others pending; (iii) new Xockets patent suits over the AWS Nitro System and GB200 UltraServers, with an ITC investigation instituted in June 2026 (p. 16). Amazon disputes all and estimates most losses as not reasonably estimable; $7.1B of income tax contingencies is separately excluded from commitments (p. 15). No new accrual was quantified this quarter.
Subsequent events (10-Q pp. 12, 17, 27, 35) Three disclosed after June 30, 2026: (i) Amazon invested the remaining $21.3B OpenAI Series C commitment (p. 12); (ii) issued $25.0B of USD senior notes, maturities 2029–2066, at 4.60%–6.25% (p. 17); and (iii) provided the Q3 2026 guidance above on July 30, 2026 (p. 35). All three extend the quarter’s themes — more AI investment, more debt, continued growth guidance.
7.5 What Changed This Quarter
sources - AWS reaccelerated and its margin expanded — segment sales +37% YoY to $42,232M and operating income +63.6% to $16,621M, lifting AWS margin to 39.4% (+6.4 pp) (10-Q p. 22). This reverses the FY2025 AWS-margin-compression concern and is the single most thesis-positive datapoint in the quarter; the profit engine is running harder, not softer. - Headline EPS is an accounting illusion — $5.75 diluted EPS (+242.3% YoY) is overwhelmingly driven by a $50,486M non-cash, Level-3 Anthropic mark in non-operating income (~96% of the quarter’s non-operating gain, and the large majority of net income); operating income of $27,461.0M (+43.2%) is the number that matters (10-Q pp. 4, 8). Any valuation on GAAP EPS is overstated. - Free cash flow turned negative — FCF of -$8,821.0M (vs. +$332.0M a year ago) and TTM FCF of -$7,604M, as cash capex hit a record $54,208.0M (+68.4% YoY) and is guided higher in 2026 (10-Q pp. 27, 33). The AI build is now consuming cash faster than the business generates it. - The Anthropic/OpenAI exposure — and circularity — stepped up sharply — private-company investments reached a $122.3B carrying value (from $16.2B), Amazon committed a further $15.0B facility to Anthropic, and it announced $100B+ (Anthropic) and $100B (OpenAI) AWS-commitment expansions in the same quarter it books AWS revenue from both (10-Q pp. 10–12). Part of the AWS acceleration is demand from counterparties Amazon capitalizes. - Leverage and the balance sheet ballooned — long-term debt roughly doubled to $128,894M, net debt swung to +$50,681.0M from near-zero a year ago, and RPO backlog grew to ~$496B (from ~$244B) (10-Q pp. 6, 10). Debt is covenant-free, but the funding mix has clearly shifted toward debt-financed capacity.
7.6 Portfolio Decision
sources [Rating and price target withdrawn — see the note at the top.] The operating quarter was genuinely strong and thesis-confirming: consolidated operating income rose +43.2% YoY to $27,461.0M with EBIT margin up +2.3 pp, and AWS — the entire bull case — reaccelerated to +37% revenue growth while expanding margin 6.4 pp to 39.4%, driving AWS operating income +63.6% to $16,621M (10-Q p. 22). That reverses the AWS-margin-compression worry from the FY2025 review and reinforces the core thesis. [Rating and price target withdrawn — see the note at the top.] First, the headline — net income of $62,647.0M and EPS of $5.75 — is dominated by a non-cash Anthropic fair-value mark (~96% of the quarter’s non-operating gain, and the large majority of net income) that can reverse; the $92.0B unrealized gain now in AOCI is a two-way risk (10-Q pp. 8, 12). Second, free cash flow went negative (-$8,821.0M; TTM -$7,604M) on record $54,208.0M of capex guided higher still — investors are paying up front for AI capacity whose returns are not yet in the cash flows (10-Q pp. 27, 33). Third, the AWS reacceleration is partly circular: Amazon expanded $100B+/$100B AWS commitments with Anthropic and OpenAI in the very quarter it added $23.7B of fresh investment in them (10-Q pp. 10–12), which lowers the quality of the top-line signal. The footnote review adds no accounting red flag — controls effective, debt covenant-free, non-GAAP discipline intact — but it does confirm the earnings optics and circular-demand concerns are real, not cosmetic. Net: the thesis is intact and strengthening operationally, but the entry math (illusory EPS, negative FCF, circular growth) argues for reducing, not holding: at a price where, on the work, every valuation method implies downside and the reverse-DCF does not converge, the operating strength is already more than fully paid for.
What would change this view: [Rating and price target withdrawn — see the note at the top.] [Rating and price target withdrawn — see the note at the top.]
Report Versions
Every published version of this report, newest first — each one kept so a reader can see what changed and when.
| Version date | Files |
|---|---|
| 2026-08-20 Current | Model (Excel) |
| 2026-08-04 | Model (Excel) |