
Technip Energies N.V.
Section 1 — Business Overview, Operations & Competitive Positioning
1.1 The Business
sources Technip Energies N.V. designs, engineers and builds the large processing plants that turn hydrocarbons and low-carbon feedstocks into liquefied natural gas, ethylene, hydrogen, sustainable fuels and captured carbon — earning fees across multi-year execution contracts and, increasingly, higher-margin income from licensing its own process technologies and selling engineering, products and services around them.
The economic engine is a hybrid of two connected businesses. Long-cycle Project Delivery undertakes the engineering, procurement and construction of energy megaprojects, recognising revenue as the work is performed and converting a multi-year backlog into a de-risked baseload of activity and cash flow. Shorter-cycle Technology, Products & Services monetises proprietary process technologies, proprietary equipment, early engineering and consulting, and lifecycle services — activities the company describes as structurally more accretive and capital-light, and as a pull-through into the larger projects. The group is headquartered in France, incorporated in the Netherlands as a public company, and its ordinary shares trade on Euronext Paris; it reports under IFRS in euros and carries a workforce of many thousands of engineers and project professionals spread across a large number of countries. Created through a spin-off from TechnipFMC, it presents itself as a technology and engineering company built around the energy transition, with most recent full-year revenue of €7,203.8M. One feature of the model belongs in the opening frame: management markets a net-cash balance sheet, but that position is substantially funded by customer advances taken in ahead of project spend rather than by shareholders’ own cash — a distinction and 5 (forensic F002).
Key Information
| Item | Value |
|---|---|
| Ticker | TEN |
| Sector / Industry | Energy — Engineering & Technology |
| Report Date | 2026-08-20 |
| Most Recent FY Revenue | €7,203.8M |
| EBIT Margin (Most Recent FY) | 6.0% |
| Diluted Weighted-Average Shares | 179M |
| Current Price | €30.10 |
Source: Company Annual Report 2025 (IFRS as adopted by the EU); see Appendix A.1.
1.2 Operating Segments
sources Project Delivery is the long-cycle engineering, procurement and construction business. Its revenue model is percentage-of-completion accounting on large, multi-year lump-sum, reimbursable and hybrid contracts, and the single variable that governs it is award intake feeding the backlog: nothing is executed that was not first won. Management frames the segment as an extremely robust baseload with several years of workload visibility, and defends its margin through a stated selectivity discipline — it will not bid a major project unless it performed the front-end engineering, understands the technology intimately, and works with known customers in known geographies, with every project required to be cash-positive from award. That discipline is the segment’s principal defence against the structural weakness of the model, which is that fixed-price and lump-sum work loses money when execution costs run ahead of estimates.
Technology, Products & Services groups proprietary process technologies, proprietary equipment and products, early engineering, and consulting and lifecycle services. The economic driver here is technology adoption and services volume rather than construction throughput: the segment is shorter-cycle, capital-light and carries structurally higher margins, and management identifies it — Technologies and Products in particular — as the priority for capital deployment, both organic and acquired. The services lines are a deliberate route to early, lower-risk client access: independent techno-economic advisory, largely reimbursable project-management consulting, and operations-and-maintenance support all position the company inside a client’s plans before a project reaches final investment decision.
The two segments are intended to offset one another across the energy cycle. Project Delivery supplies visibility and cash-generative scale; Technology, Products & Services lifts the blended margin and earnings quality and cross-fertilises the projects with proprietary technology, the two connected through a shared global delivery platform that pools engineering talent across both. The synergy is real — the same technologies that are licensed also differentiate the EPC bids. The fragility is equally real: the baseload is fixed-price megaproject execution concentrated in a narrow set of customers and countries (§1.3), and reported margins depend on estimate-driven cost-to-complete and provisioning judgements that can flatter a given year — a margin-quality point carried into Section 5 (forensic F006).
1.3 Geographic Exposure
sources Operations are global, but revenue is not: the majority of it originates in Africa and the Middle East, and within that, two Qatari liquefied-natural-gas megaprojects for the same national energy customer each rank among the company’s largest individual revenue contributors — so a single client and a single country drive a disproportionate share of the top line. The company reports in euros under IFRS, which frames its presentation currency, but the more consequential geographic reality is concentration risk rather than translation risk. That concentration is compounded by a live external event: a post-period military escalation across the Middle East, disclosed as a subsequent event and still ongoing at the reporting date, sits directly on top of the region that is the source of most of the company’s revenue and backlog (forensic F001, the report’s headline risk). This is flagged here and analysed in full in Section 2; for the business overview the essential point is that the revenue base cannot be read as that of a diversified global contractor.
1.4 Management Team
sources The anchor is the chief executive, who frames the reporting year as one dedicated to execution following two years of strong order intake and who repeats a discipline of selectivity to the point of stating that there is no must-win project at the company — a useful cultural signal for a business whose principal way to destroy value is to chase a fixed-price megaproject it cannot execute. The tone from the Chair and CEO is confident and execution-focused, oriented around affordability of the energy transition, replication across similar projects, and capital discipline.
Two structural features temper an otherwise clean read of control. First, the company remains bound by separation arrangements from its TechnipFMC spin-off — a Separation and Distribution Agreement and ancillary tax and employee agreements under which the two companies indemnify each other for defined legacy liabilities — so it both relies on and owes obligations to its former parent. Second, ownership is concentrated: two strategic shareholders hold significant stakes, one of them carrying rights over board nominations, and management itself acknowledges that their interests may diverge from those of other shareholders and that their combined influence could shape or block a change of control. Governance reflects the company’s dual identity as a Netherlands-incorporated, Paris-listed group operating a one-tier board under the Dutch governance code; the detail of the ownership and governance structure is developed in Section 5.
1.5 Capital Allocation Track Record
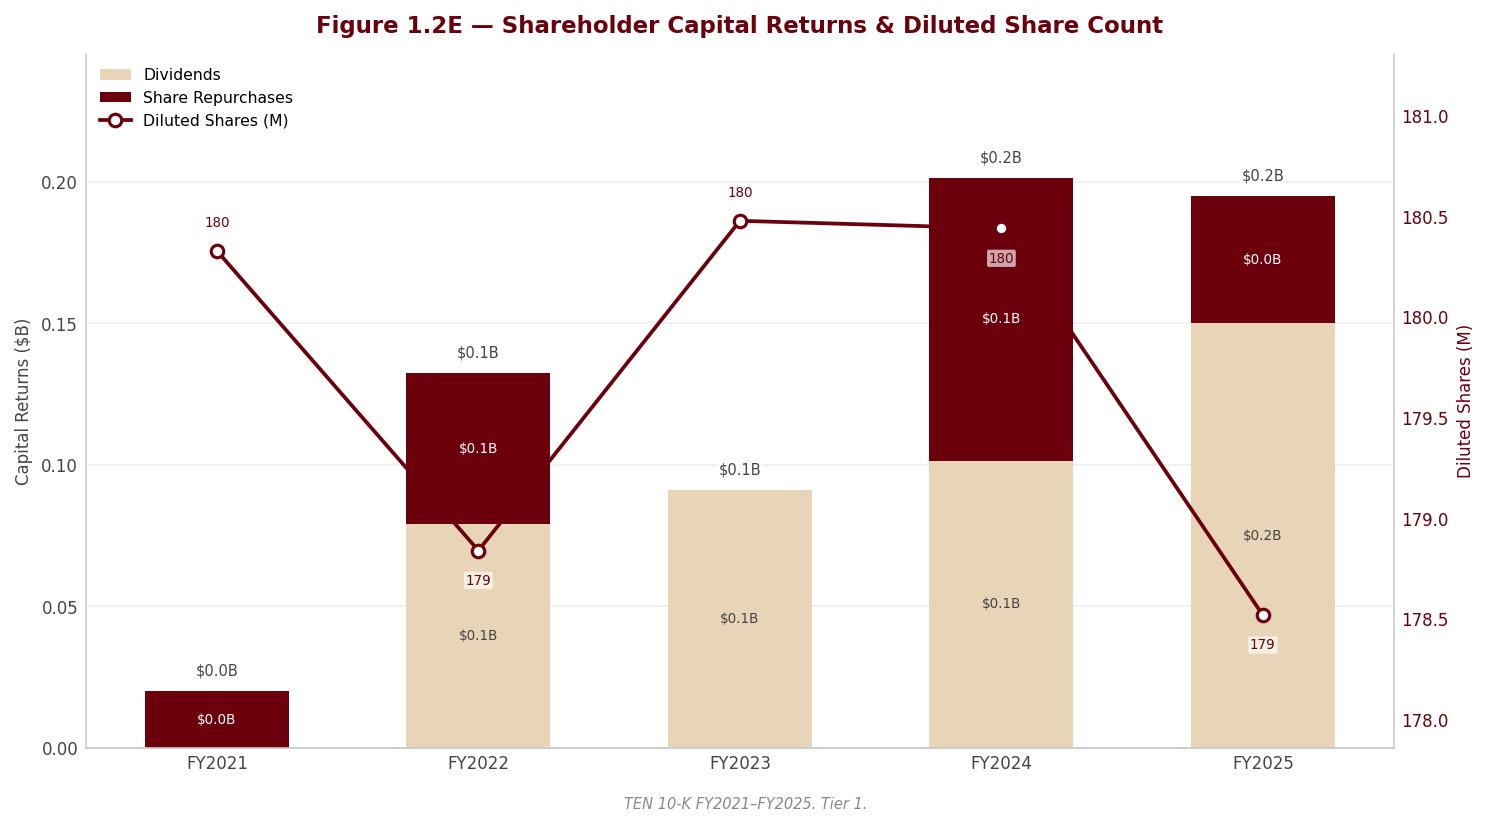
| Year | Dividends Paid (€M) | Share Repurchases (€M) | CapEx (€M) |
|---|---|---|---|
| FY2021 | — | €20.0M | €49.6M |
| FY2022 | €79.0M | €53.5M | €46.7M |
| FY2023 | €91.2M | €0.0M | €48.4M |
| FY2024 | €101.5M | €100.0M | €84.6M |
| FY2025 | €150.2M | €45.0M | €89.4M |
Source: Company Annual Report 2025 (IFRS as adopted by the EU); see Appendix A.1.
Management describes an asset-light model that it argues underpins high returns and a robust balance sheet, and it deploys capital along three lines: reinvestment in innovation, talent and technology; targeted acquisitions concentrated in the higher-margin Technology, Products & Services segment; and cash returns to shareholders through a growing dividend, at a payout of 41.3% and a total shareholder yield of 3.1%, alongside a buyback. The clearest recent expression of the acquisition strategy is the purchase of an advanced-materials-and-catalysts business — presented as the company’s first major acquisition, immediately accretive and a platform for recurring, higher-margin revenue — though it closed on the final day of the reporting year on provisional acquisition accounting with the price still subject to post-closing true-ups, and is therefore a watch item for next year (forensic F004). The low capital intensity implied by €89.4M against the scale of revenue is consistent with the asset-light characterisation: the business consumes engineering hours and working-capital float, not heavy fixed assets.
The critical qualification is what funds the returns. The apparent firepower rests on a net-cash position that is substantially customer-advance float rather than owned cash, and it is drawn down as the backlog that generated those advances is delivered (forensic F002). Two watch items sit against the durability of the cash returns: the backlog declined year-on-year and operating cash flow fell even as revenue grew, with receivables outpacing sales (forensic F008). Capital allocation has been disciplined and shareholder-friendly in form, but its sustainability is tied to continued award intake rather than to a self-funding cash machine — a point the separate valuation quantifies.
1.6 Competitive Positioning & Moat
sources §1.6.1 Industry structure. Energy-plant EPC combined with process-technology licensing is a concentrated industry dominated by a small number of capable players, because the work demands three scarce things at once: proprietary process technology with a credible reference base, a track record of executing multi-billion complex projects on schedule, and the balance-sheet and bonding capacity to stand behind performance guarantees. Returns accrue to the contractors that own the technology a client must license and that can be trusted to deliver it at scale; the losers are those that buy backlog on price and absorb the cost overruns that the fixed-price model punishes. Winning the front-end engineering is the wedge that positions a contractor to win the far larger execution contract.
§1.6.2 Competitive advantages. The moat is strongest where it rests on proprietary technology and reference plants. In liquefied natural gas the company draws on more than six decades of experience, having pioneered base-load LNG and delivered the first, largest and first deep-offshore floating facilities, giving it a claim to industry leadership across the full range of train sizes. In ethylene it positions itself as a world leader with the largest installed base of active facilities and a simulation tool it describes as the industry standard, supported by a broad downstream petrochemicals and fertiliser technology portfolio. These are underpinned by a patent portfolio and a network of laboratories and pilot plants, and by a capability management stresses repeatedly — carrying a technology from proof of concept through pilot to full commercial scale. On top of the conventional franchise sits a growing energy-transition offering with named positions in post-combustion carbon capture (through an exclusive alliance with a super-major on its licensed technology), blue and green hydrogen and ammonia, sustainable aviation fuel, and circularity. The selectivity discipline — bidding only where it was the front-end architect and requiring cash-positivity from award — is itself a structural advantage that protects margin in a business built to lose money on mispriced risk.
§1.6.3 Competitive vulnerabilities. The advantages are bounded by four exposures. First, customer and geographic concentration: a majority of revenue from one region and a disproportionate share from two projects for a single Qatari customer, now under a live regional conflict, means a geopolitical shock converts directly into a company-level revenue, backlog and cash-collection event (forensic F001). Second, the fixed-price EPC baseload carries inherent cost-overrun risk, and the reported margin is softened by discretionary, estimate-driven provision releases rather than being purely operational (forensic F006). Third, the balance-sheet strength that supports the equity story is advance-funded customer money, not owned capital, and it unwinds as backlog burns off — a backlog that has already declined (forensic F002, F008). Fourth, the contingent-obligation profile is large: off-balance-sheet parental guarantees backing project execution across the group dwarf book equity, a magnitude that means a cluster of troubled projects could crystallise claims far in excess of the balance sheet (forensic F003 and 5). The pace and profitability of the transition markets that anchor the growth narrative also remain uncertain by management’s own admission.
§1.6.4 Verdict. The moat is genuine but uneven. On proprietary technology and LNG and ethylene leadership it is durable and supports premium, higher-margin activity; on the Project Delivery baseload it is thinner, resting on selectivity and reputation in a fixed-price business where a single mispriced megaproject can erase a year’s discipline. Long-run margin durability therefore depends less on the technology franchise, which is defensible, than on execution and concentration: as long as the company can keep replenishing its backlog with well-chosen awards and can absorb the geopolitical risk embedded in its Qatari and Middle Eastern exposure, the hybrid model should sustain resilient mid-cycle margins — but the reported financial strength overstates how much of that resilience truly belongs to shareholders rather than to the customers financing the build.
Section 2 — Key Risks & Catalysts
sources
2.1 Downside Risks
sources Technip Energies is an engineering-and-construction contractor whose risk profile is dominated not by commodity price but by concentration and contingency: a book of very large, long-dated turnkey contracts clustered in a single region and, in the reporting year, effectively a single customer, executed under a model in which the customer’s cash and the company’s contractual guarantees do much of the heavy lifting. The most acute risks are geographic and client concentration meeting a live regional conflict, the true nature of the reported balance-sheet strength, and an off-balance-sheet performance-guarantee overhang — each of which the filing discloses directly.
Concentration in the Middle East under a live conflict
sources This is the company’s single most important risk and is flagged as a critical forensic finding. By the company’s own segment disclosure, the majority of revenue comes from Africa and the Middle East, and the filing confirms that two QatarEnergy liquefied-natural-gas megaprojects — the North Field East and North Field South developments — each individually exceeded a tenth of consolidated revenue in the year. A single client and a single country therefore drive a large share of the top line, and the region drives the majority of it. The company also states that its handful of largest customers together account for the majority of revenue and a large majority of backlog, and that its backlog is concentrated in a limited number of countries, with Qatar singled out in the reporting year. Layered on top of this, the company carries a dedicated subsequent-event disclosure describing a post-year-end military escalation across the Middle East, in response to which it activated crisis-management protocols, implemented precautionary measures and suspended travel to, from and through the affected countries. The danger is structural: concentration this high converts a regional geopolitical shock into a company-level event, threatening revenue recognition, backlog execution and cash collection simultaneously. The company cannot be underwritten as a diversified global contractor.
Probability: High | Timeframe: Immediate | Quantified potential impact: Not quantifiable from qualitative disclosure; a disruption to the Qatari and wider Middle Eastern portfolio would strike both the income statement and the balance-sheet liquidity narrative at once, because the customer advances that fund the reported cash position sit against these same contracts.
The reported “net cash” is customer money, not distributable capital
sources Also a critical forensic finding, and the key balance-sheet-quality point. The company presents a net cash position and an asset-light balance sheet as central to its equity story, framing that cash as firepower for acquisitions and shareholder returns. The accounting substance is different: the cash balance is exceeded by contract liabilities — customer billings and advances received ahead of revenue earned — so that, once the customer float is removed, the company’s own unencumbered cash is not positive. Under percentage-of-completion economics the company is paid in advance and holds that cash as a liability owed back in work still to be performed. Treating it as surplus capital overstates financial strength. Crucially, the float is self-liquidating: as backlog is delivered and new awards slow, incoming advances shrink faster than disbursements, draining the “net cash” without the company ever reporting an operating loss. This risk is directly coupled to the observed backlog contraction discussed below.
Probability: Medium | Timeframe: Near-term | Impact: A slowdown in order intake would erode the advance-funded cash position and, with it, the capacity for the buybacks, dividends and acquisitions the strategy relies upon — a balance-sheet event that would not show up in reported profit.
Off-balance-sheet parent-company performance guarantees
sources A further critical forensic finding. Beyond the third-party performance and financial guarantees disclosed in the consolidated notes, the far larger exposure sits in the separate parent-company financial statements, where Technip Energies N.V. has issued parental-company guarantees backing the group’s contractual delivery and performance obligations. In aggregate these guarantees are many multiples of the company’s book equity and dwarf the consolidated third-party figure. Much of this is intra-group backing of the very same performance obligations already shown to clients — so the risk is overlapping rather than purely additive — but the magnitude is the point: a cluster of troubled projects could crystallise claims far in excess of book equity. This is the true measure of the contingent project-execution exposure that the headline balance sheet does not convey, and it is disclosed only in the parent-company notes rather than on the face of the group accounts.
Probability: Low | Timeframe: Latent | Impact: Individually remote, but severe if it materialises; the guarantee overhang caps how benign the balance sheet can truly be treated and would compound any concentrated execution failure.
Fixed-price execution and the estimate-driven margin lever
sources The company operates a turnkey model and acknowledges it can lose money on fixed-price and lump-sum contracts where execution costs exceed estimates, a structural feature of the engineering-and-construction business; it also flags the failure to deliver backlog on schedule and on budget as a distinct operational risk. Compounding the judgment involved, the auditor identifies the estimation of costs to complete on long-term contracts as its single key audit matter and a fraud risk. A forensic watch item reinforces the concern: sizeable unused provision reversals — project close-out and contract-contingency releases — flowed back through earnings in the reporting year and the year before, and a negative revenue catch-up in the year shows prior-period optimism being unwound. These releases can be legitimate on completed, de-risked projects, but they are discretionary, not repeatable, and they flatter reported operating profit; margin quality is therefore softer than the headline suggests. Because reported profit depends on management estimates that are hardest to trust precisely when a project is under stress, execution risk and earnings-quality risk are the same risk viewed from two sides.
Probability: Medium | Timeframe: Ongoing | Impact: Cost overruns on large lump-sum contracts would hit margin directly, while the reversal of the discretionary provision cushion would remove a support the reported margin has recently enjoyed.
Backlog contraction, softening cash conversion, and legacy exposures
sources A forensic watch item records that backlog fell materially year over year — a leading indicator of slower future revenue — while trade receivables grew far faster than revenue, cutting cash provided by operating activities. A shrinking backlog paired with receivables outpacing revenue is the standard early warning of both a growth slowdown and weakening cash conversion, and it feeds directly into the customer-float risk above: as backlog burns off, the advances that prop up the net cash position decline. Separately, the company’s legacy Russian exposure — its exit from the Arctic LNG 2 venture, executed under an exit framework agreement in prior years, and the sale of its main Russian operating entity — appears substantially wound down, which is genuinely de-risking. The residual watch point is one of disclosure rather than magnitude: the current report no longer separately quantifies any remaining close-out provision or any trapped cash tied to the consolidated Russian entity, so a small legacy exposure that was once visible is now folded into broader contract contingencies.
Probability: Medium | Timeframe: Near-term | Impact: Continued backlog decline would temper forward revenue and free-cash-flow assumptions and accelerate the drawdown of the advance float; the Russian legacy is likely immaterial but is no longer transparently sized.
2.2 Upside Catalysts
sources The catalyst picture is genuine but narrower than the risk list, and it is honest to note the asymmetry: several of the most powerful catalysts are the mirror image of the dominant risks — a strong liquefied-natural-gas cycle rewards the very franchise whose concentration is the chief danger — and the single largest downside, concentration meeting conflict, has no offsetting catalyst on the same timeframe. The upside rests on a long-dated gas investment cycle, a deliberate shift toward higher-quality technology earnings, and the slow diversification of the portfolio.
A long-dated gas and liquefied-natural-gas investment cycle
sources Liquefied natural gas is the historical heart of the franchise, where the company positions itself as the industry leader across onshore and floating facilities. Management argues that natural gas is the one fossil fuel whose demand is expected to keep rising through the transition and that market attention has shifted from near-term oversupply toward the risk of under-supply later in the decade — framing a long investment cycle. It describes its commercial pipeline as rich and increasingly diversified and, on that basis, expects its highest-ever annual order intake in the year following the reporting period. Its modular, electrically driven liquefied-natural-gas offering targets the growing demand for smaller, schedule-certain, lower-emission trains.
Probability: High | Timeframe: Near-term | Monitoring trigger: Order intake and major award announcements, especially awards won outside Qatar that would confirm the pipeline’s stated diversification.
A mix shift toward higher-margin Technology, Products & Services
sources The company runs a hybrid model in which the shorter-cycle Technology, Products & Services segment carries structurally more accretive margins than long-cycle Project Delivery and is identified as the core focus of capital deployment. Growth here — organic and through acquisition — lifts overall margin and earnings quality. The segment houses the company’s world-leading ethylene technology position, a broad decarbonization portfolio, and services and consulting lines that secure the company a low-risk role before projects reach final investment decision. Concrete build-out is visible in an exclusive global alliance with Shell for post-combustion carbon capture, a sustainable-aviation-fuel pathway in partnership with LanzaJet, blue and green hydrogen and ammonia offerings, and circularity ventures — positioned as early leadership in nascent low-carbon markets under strict return-on-investment discipline. §
Probability: Medium | Timeframe: Medium-term | Monitoring trigger: A rising share of revenue and backlog from Technology, Products & Services, and commercial milestones in carbon capture, sustainable fuels and hydrogen.
Structural diversification of the backlog
sources Management explicitly frames a transformation of the opportunity set away from a pipeline once dominated by liquefied natural gas and the Middle East toward one in which no single region is dominant and decarbonization has grown from negligible at the company’s creation into a very large part of the prospect base. It argues that the growth of technology and carbon-free activities will expand the portfolio toward a larger number of smaller, more geographically diverse contracts with more diverse clients. If delivered, this is the one catalyst that directly attacks the concentration risk that anchors the downside case.
Probability: Medium | Timeframe: Long-term | Monitoring trigger: The regional and customer mix of new awards, and the degree to which backlog concentration in Qatar and the Middle East recedes over successive periods.
Disciplined capital allocation and shareholder returns
sources Management points to free-cash-flow generation and an asset-light model as the basis for investing in innovation, talent and targeted acquisitions while growing the dividend and running a share buyback, and it raised the proposed dividend and approved a buyback in the reporting year as affirmations of confidence. This optionality is real, but it must be read against the balance-sheet-quality risk above: the cash that funds it is substantially customer float, so the durability of returns depends on sustained order intake rather than on a genuinely unencumbered cash pile.
Probability: Medium | Timeframe: Near-term | Monitoring trigger: Continuation of the dividend and buyback alongside order intake sufficient to replenish the advance float that underpins them.
2.3 Risk & Catalyst Summary
| # | Item | Type | Probability | Timeframe | Status | Monitoring Trigger |
|---|---|---|---|---|---|---|
| 1 | Middle East and single-customer concentration under a live conflict | Risk | High | Immediate | Active | Regional security situation; status of the Qatari megaprojects |
| 2 | Reported net cash is customer-advance float | Risk | Medium | Near-term | Active | Order intake versus backlog burn; movement in contract liabilities |
| 3 | Off-balance-sheet parent-company performance guarantees | Risk | Low | Latent | Monitoring | Concentration of troubled projects; guarantee disclosures |
| 4 | Fixed-price execution and discretionary provision releases | Risk | Medium | Ongoing | Active | Project charges; scale of unused provision reversals |
| 5 | Backlog contraction, cash conversion, and Russian legacy | Risk | Medium | Near-term | Monitoring | Backlog trend; receivables versus revenue; residual legacy disclosure |
| 6 | Long-dated gas and liquefied-natural-gas investment cycle | Catalyst | High | Near-term | Active | Order intake and awards, especially outside Qatar |
| 7 | Mix shift toward higher-margin Technology, Products & Services | Catalyst | Medium | Medium-term | Monitoring | Technology segment share; carbon-capture, fuels and hydrogen milestones |
| 8 | Structural diversification of the backlog | Catalyst | Medium | Long-term | Latent | Regional and customer mix of new awards |
Source: Technip Energies 2025 Annual Report (IFRS) and forensic footnote review; see Appendix A.1.
Every row in this table maps to a subsection above.
2.4 Risk Interdependencies
sources The defining feature of Technip Energies’ risk profile is that its principal exposures are not independent — they are facets of a single scenario and would fire together. Geographic and customer concentration, the customer-advance float and the backlog trend form one tightly coupled system: the advances that constitute the reported net cash are owed against the same Qatari and Middle Eastern contracts that dominate revenue and backlog, so a disruption to that region would simultaneously depress the income statement, accelerate the burn of backlog, and drain the very float that makes the balance sheet look strong — the P&L and the liquidity narrative failing in the same instant rather than in sequence. The off-balance-sheet parent-company guarantees compound this precisely at the wrong moment: performance guarantees crystallise when projects go troubled, which is exactly the condition a concentrated regional shock would create. And the estimate-driven margin lever sits underneath all of it — because reported profit leans on discretionary cost-to-complete judgments and provision releases, earnings quality is thinnest exactly when execution stress is highest and the cushion of unused reversals is least likely to recur. A reader should therefore resist assessing these risks one at a time; their danger is that a single trigger in the Middle East activates all of them at once.
2.5 ESG & Regulatory Exposure
sources Governance reflects the company’s dual identity as a Netherlands-incorporated business listed in Paris: it operates a one-tier board, applies the Dutch Corporate Governance Code on a comply-or-explain basis rather than the French code, and discloses deliberate deviations — including super-majority thresholds to overrule a binding board nomination or to dismiss a director other than at the board’s proposal — which the board defends as providing the stability needed to execute long-term strategy. Ownership is concentrated in strategic shareholders — HAL Trust, through its investment arm, and the French state investment vehicle BPI — with BPI carrying board-nomination rights; the company itself flags that their interests may diverge from those of other shareholders and that their combined influence could delay, deter or enable a change of control against the wishes of the wider register. The shares are a single class, one vote each, trading on Euronext Paris with a sponsored depositary-receipt program traded over the counter.
On regulation and reporting, the company is subject to the EU Transparency Directive, to international financial-reporting standards as adopted in the European Union, to Dutch law, and to the European sustainability-reporting regime, and it flags that a material misstatement in its financial or sustainability statements could trigger clawback of variable compensation under Dutch law. Broader political and regulatory exposure — nationalisation and expropriation, sanctions and trade restrictions, civil unrest, currency and repatriation constraints, and abrupt regulatory change — follows from operating across many countries, with the residual Russian sanctions legacy the clearest live example.
On the environmental and social side, sustainability is framed as integral to strategy through a multi-year roadmap and scorecard built on innovation, delivery and empowerment, with safety treated as a zero-tolerance core value and emphasis placed on emissions avoided for clients. The central ESG-linked business risk is strategic rather than reputational: the company concedes that uncertainty in the pace and profitability of the energy transition could impair its investments in nascent low-carbon markets, and its stated response — rebalancing between oil, gas as a transition fuel and carbon-free solutions, growing the diversified technology portfolio, and acquiring transition-technology rights under strict return criteria — is itself the mechanism by which the transition both threatens and rewards the franchise.
Section 3 — Financial Analysis & Historical Performance
sources Three-Statement Linkage Confirmation: - Net Income ties (Income Statement → Cash Flow Statement): Confirmed. The consolidated statement of cash flows opens from the same net profit that closes the income statement (€363.8M in FY2025), with depreciation and amortisation of €121.9M added back as the first non-cash reconciling item. No discrepancy. - Cash ties (Balance Sheet → Cash Flow Statement): Confirmed. The closing cash and cash equivalents on the cash-flow statement reconcile to the €3,643.5M carried on the balance sheet. No discrepancy. - Retained Earnings reconciliation (Beg RE + NI - Dividends = End RE): Confirmed to within a small residual. Opening retained earnings of €1,341.9M plus FY2025 net income of €363.8M less dividends of €150.2M approximates closing retained earnings of €1,546.8M; the minor residual is consistent with share repurchases, currency-translation movements and other-reserve reclassifications and does not indicate a break in the statements.
Currency convention (applies to every table and figure in this section). Technip Energies reports under IFRS as adopted by the EU, and its functional and presentation currency is the euro (€). [Rating and price target withdrawn — see the note at the top.] There is no foreign-currency translation layer between the filing and these tables — the numbers are the company’s own reported euro figures.
3.1A Income Statement
Source: Technip Energies N.V. 2025 Annual Report — consolidated statement of income and Notes 3–4 (IFRS as adopted by the EU; audited by PwC). Gross profit and EBITDA are analyst-derived subtotals (see 3.1B); figures per the FL model — see Appendix A.1–A.2.
CAGR Summary
| Metric | 3Y CAGR | 5Y CAGR | 10Y CAGR |
|---|---|---|---|
| Revenue | 4.7% | 4.6% | - |
| EBITDA | -7.8% | -2.7% | - |
| Net Income | 6.6% | 12.0% | - |
| Diluted EPS | 6.7% | 12.1% | - |
| FCF | 60.7% | -6.6% | - |
Source: Company filings (Technip Energies N.V. Annual Reports); figures per the FL model — see Appendix A.1–A.2. The 5-year CAGRs reach back into FY2020, a pre-spin carve-out comparative (Technip Energies was spun out of TechnipFMC in February 2021); the 10-year columns are shown as an em-dash because no continuous standalone history predates the carve-out.
3.1B Income Statement — Analysis
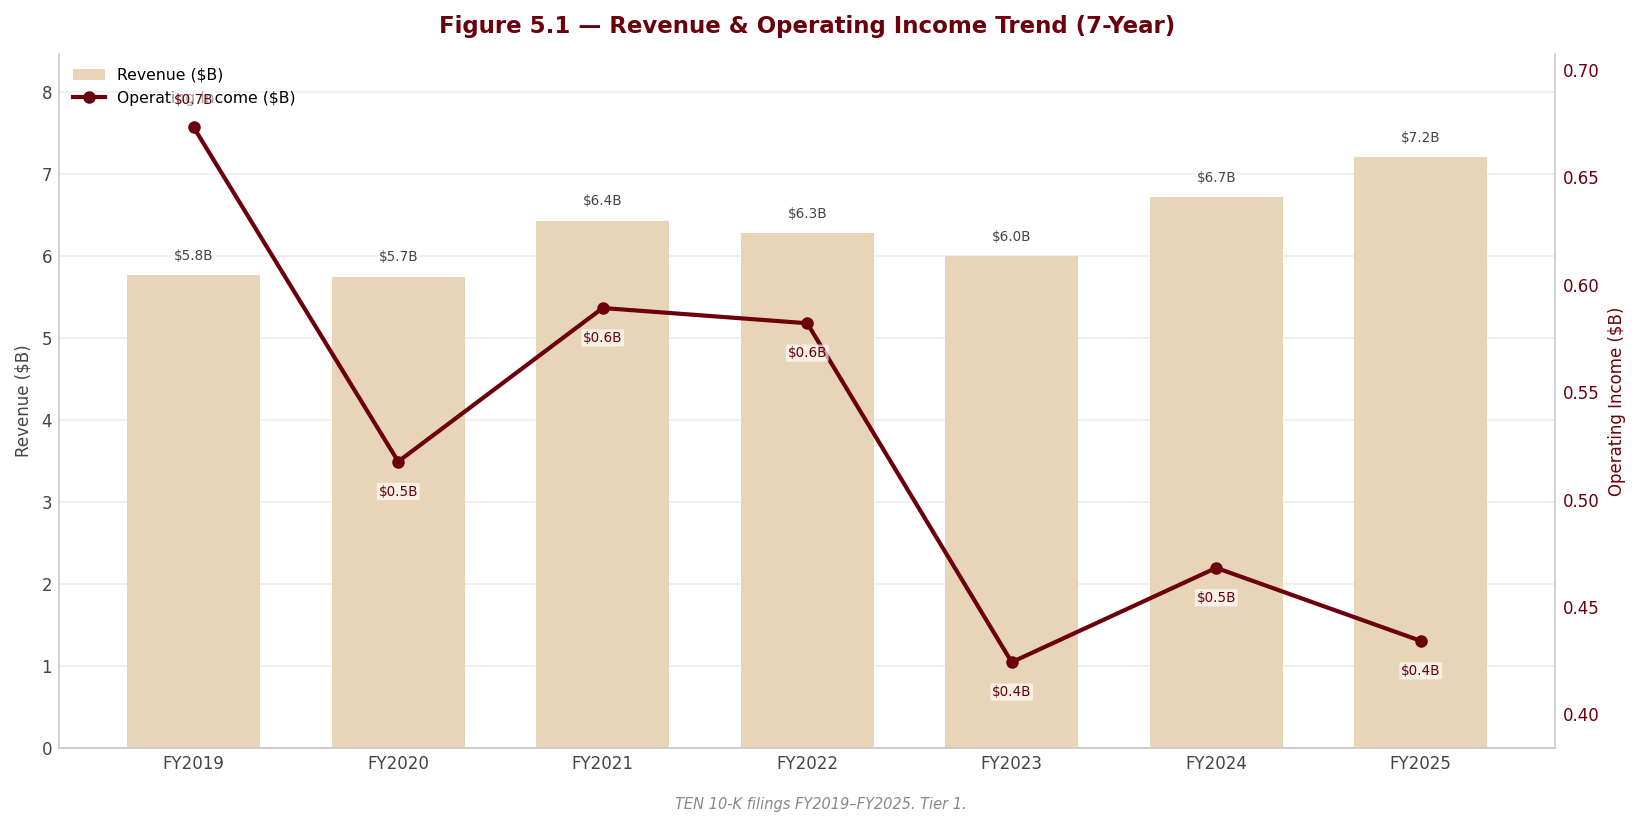
sources Revenue story. The top line traces a clean trough-and-recovery arc rather than a steady trend. Revenue eased from €6,433.7M in FY2021 to a cyclical low of €6,003.6M in FY2023 — two consecutive down years (-2.4% then -4.4%) as an earlier project vintage burned off faster than new large awards converted into recognised revenue — before reaccelerating to €6,718.9M (11.9%) and then to a record €7,203.8M (7.2%) in FY2025. Because Technip Energies recognises revenue on a percentage-of-completion basis against a multi-year backlog, this is an execution-phased trajectory: the swing is driven by where the large Project Delivery engagements sit in their build curve, not by unit price or volume in the conventional sense. The company’s hybrid model pairs that long-cycle Project Delivery baseload with a shorter-cycle, structurally higher-margin Technology, Products & Services (TPS) business, and management frames TPS as the segment it is steering capital toward for its more accretive economics. The mix matters for the margin story below: the FY2024–FY2025 revenue record was carried disproportionately by large, lower-margin project execution.
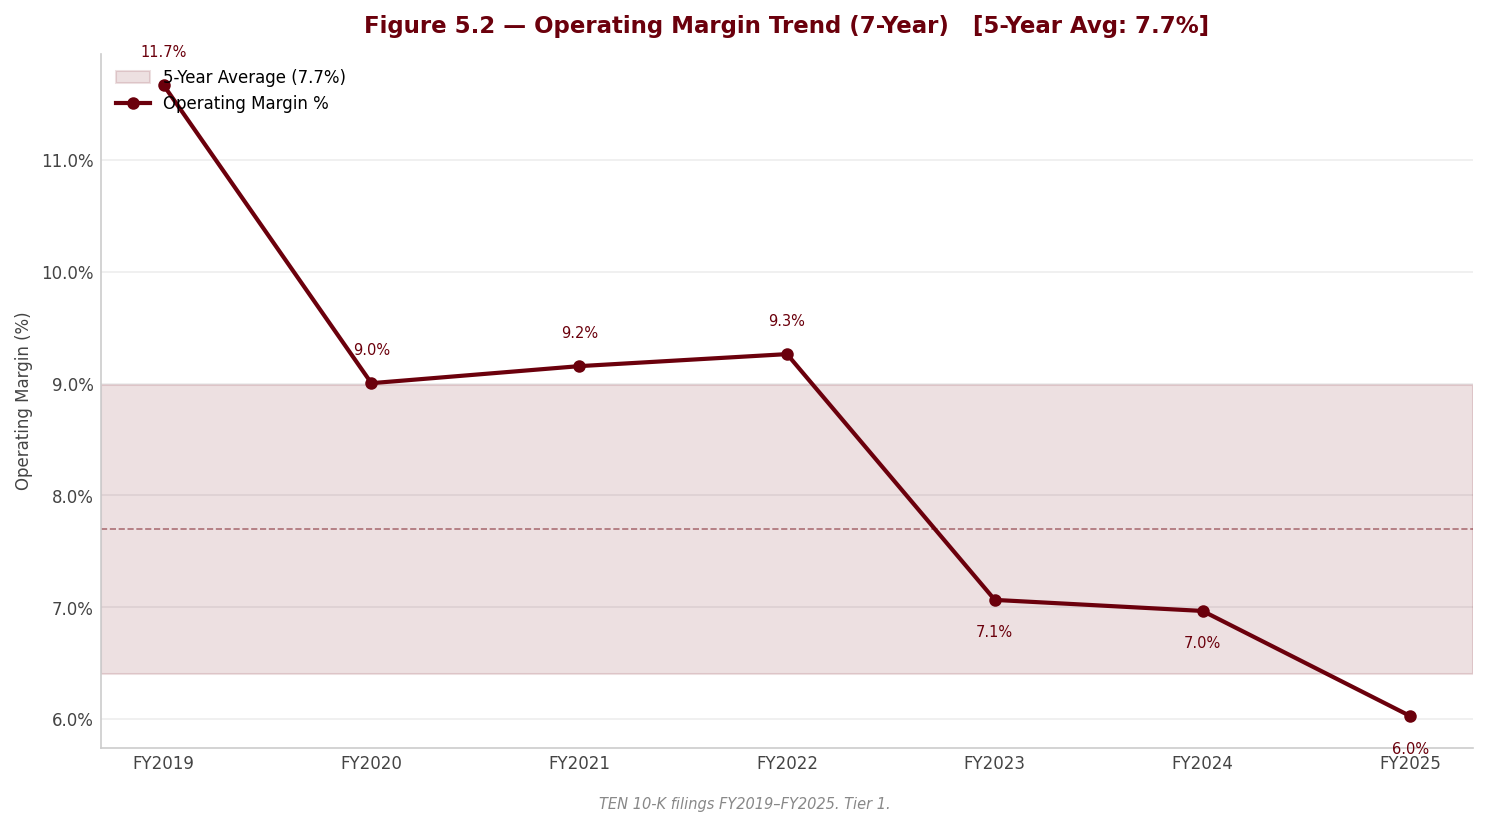
Margin trajectory. Profitability moved the opposite way to revenue over the window — the hallmark of an EPC contractor whose margin is set by execution and mix, not scale. EBIT margin compressed steadily from 9.3% in FY2022 to 7.1%, 7.0% and 6.0% in FY2025, and EBITDA margin fell in parallel from 11.3% to 7.7%. The record FY2025 revenue therefore produced lower absolute EBITDA (€556.0M versus €579.0M a year earlier) — a genuine margin event, not an optical one. The compression is part structural (a revenue mix tilted toward large, lower-margin Project Delivery as the Qatari LNG vintage executes) and part FY2025-specific project charges that weighed on the year. A note on the EBIT basis used here: the EBIT line in the table is defined as profit before net financial expense and income tax and includes the Group’s share of equity-affiliate results; it therefore sits modestly above the face “operating profit” subtotal shown on the income statement, which excludes equity-method income. The EBIT figures are used because they are the basis on which the segments reconcile to the group.
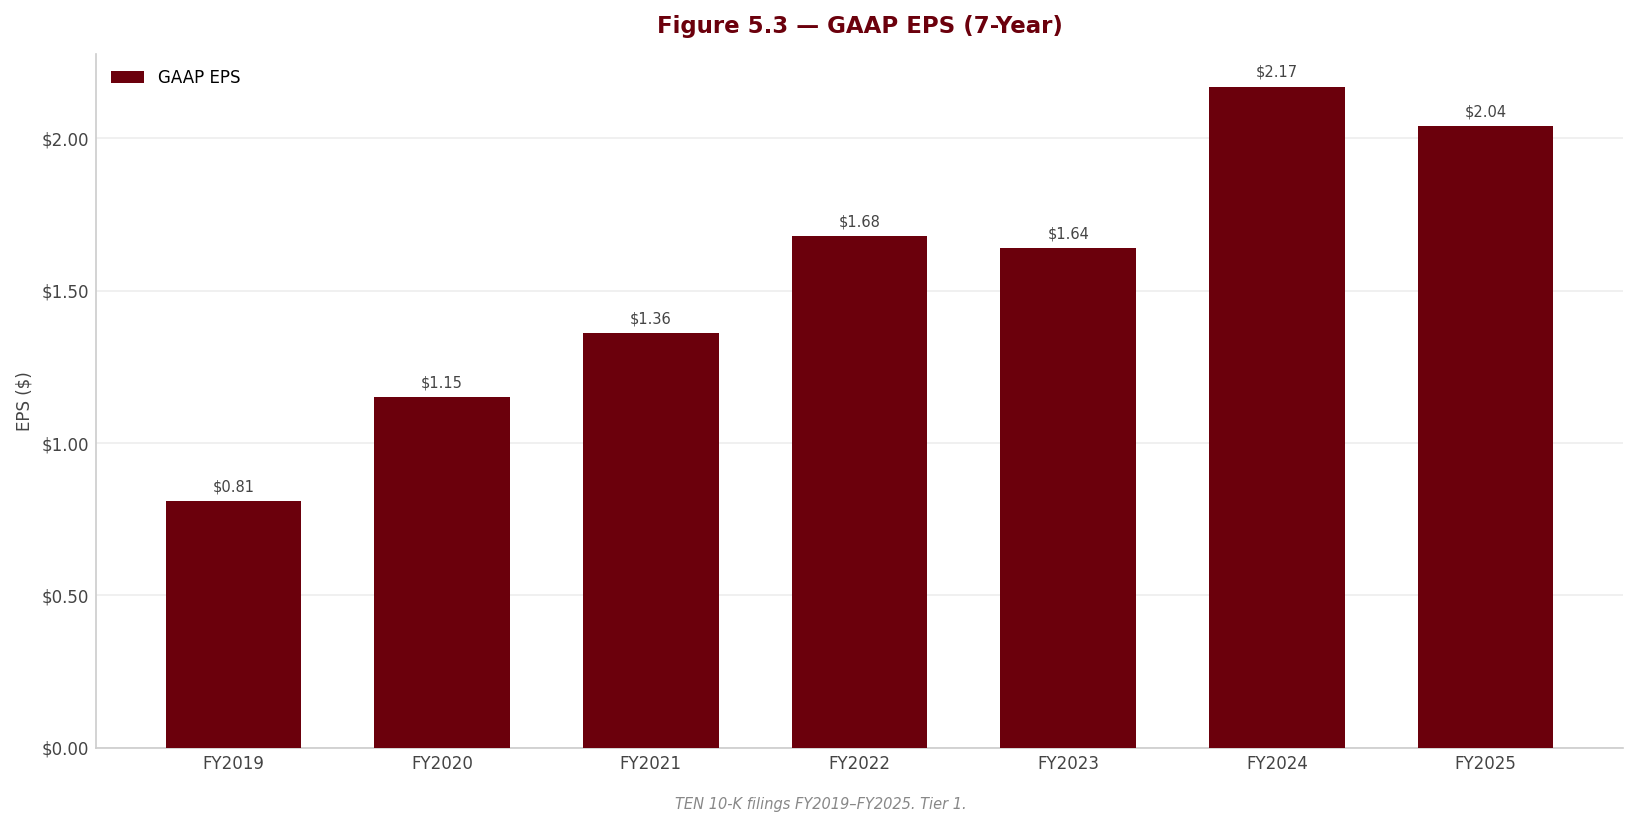
Major movers. - Revenue reacceleration off the FY2023 trough (structural, but execution-phased). The +11.9%/+7.2% rebound to a record €7,203.8M reflects the ramp of large Project Delivery work off backlog. It is structural in that it rests on a contracted backlog, but its timing is cyclical — the same mechanism that produced the FY2022–FY2023 decline. [Rating and price target withdrawn — see the note at the top.] - Operating-margin compression (mix-driven, part structural). EBIT margin fell roughly three points from its 9.3% peak to 6.0%. The driver is the revenue-mix shift toward lower-margin large-project execution layered with FY2025 project charges. To the extent it is mix, it is structural and reverses only as TPS grows its share; to the extent it is project charges, it is period-specific. - Cost-to-complete estimate lever / provision releases (quality-of-earnings item, F006). Reported operating profit is flattered by unused provision reversals released back through the P&L, and FY2025 carried a negative revenue catch-up on prior-period performance obligations — a modest deterioration in estimate reliability versus the prior year’s positive catch-up. These releases are legitimate on de-risked, completing projects but they are discretionary and not repeatable; underlying operating profit excluding them is the cleaner trend, and it is weaker than the face number. This is precisely the estimate-driven area the auditor singled out as its sole key audit matter (F010). [Rating and price target withdrawn — see the note at the top.] - Net income and EPS peaked in FY2024, then dipped. Net income rose to a record €390.7M (31.6%) before easing to €363.8M (-6.9%) as the margin compression outweighed revenue growth; diluted EPS followed from €2.17 to €2.04, cushioned slightly by a modestly lower diluted share count (180 to 179) from buybacks.
Quality of earnings. Three items temper the reported profit. First, the provision-release lever (F006) above. Second, the December-31 acquisition of the Ecovyst Advanced Materials & Catalysts business (F004) contributed nothing to FY2025 revenue or profit yet is fully consolidated on the year-end balance sheet, so any profit-to-balance-sheet comparison is distorted and the purchase-price allocation remains provisional. Third, equity-affiliate income fell year-on-year as the underlying joint ventures moved to an aggregate loss (F009); because the EBIT basis here includes equity-method results, that weakness sits inside the reported EBIT. Against these, the deterministic manipulation screens are reassuring: the Beneish screen reads clean, the Piotroski score is in the neutral band, and Sloan accruals are within the acceptable band — and the auditor issued an unqualified true-and-fair opinion with no going-concern doubt (F010). The concern here is the discretion in estimate-driven margin, not fabrication.
⚠ Items to Watch. If EBIT margin falls below its FY2025 level of 6.0%, it would extend rather than arrest the multi-year compression and force a re-examination of the mix-normalisation thesis. Separately, if the provision-release contribution stops or the negative prior-period revenue catch-up widens, underlying operating profit ex-releases would fall visibly below the reported line — the single most important earnings-quality threshold in this section.
3.2A Balance Sheet
Source: Technip Energies N.V. 2025 Annual Report — consolidated statement of financial position and Notes 4.3, 14, 19 and 28. The Inventory line is an em-dash by structure, not omission (see 3.2B); a standalone balance-sheet history does not extend before the FY2021 spin (no FY2019 balance-sheet column exists). Figures per the FL model — see Appendix A.1–A.2.
3.2B Balance Sheet — Analysis
sources Asset composition — and the missing inventory line. This is not an industrial balance sheet; it is a contractor’s. Two features dominate. First, there is no inventory — the line is an em-dash across every year because Technip Energies accounts for its long-cycle work under percentage-of-completion, so work-in-progress lives in contract assets and contract liabilities, not in an inventory account. Its absence is structural, and reading it as a gap misunderstands the model. Second, the asset base is cash- and goodwill-heavy and PP&E-light: cash and equivalents of €3,643.5M and goodwill and intangibles of €2,241.3M together dwarf net PP&E of just €272.2M — the asset-light EPC signature. PP&E did step up to €272.2M from €165.9M, but that jump largely reflects the December-31 Ecovyst consolidation (F004), not organic capital intensity. Critically, goodwill of €2,241.3M is almost the entire €2,233.6M of shareholders’ equity: tangible book equity is close to nil (F005), which is why book-value metrics below must be read with care.
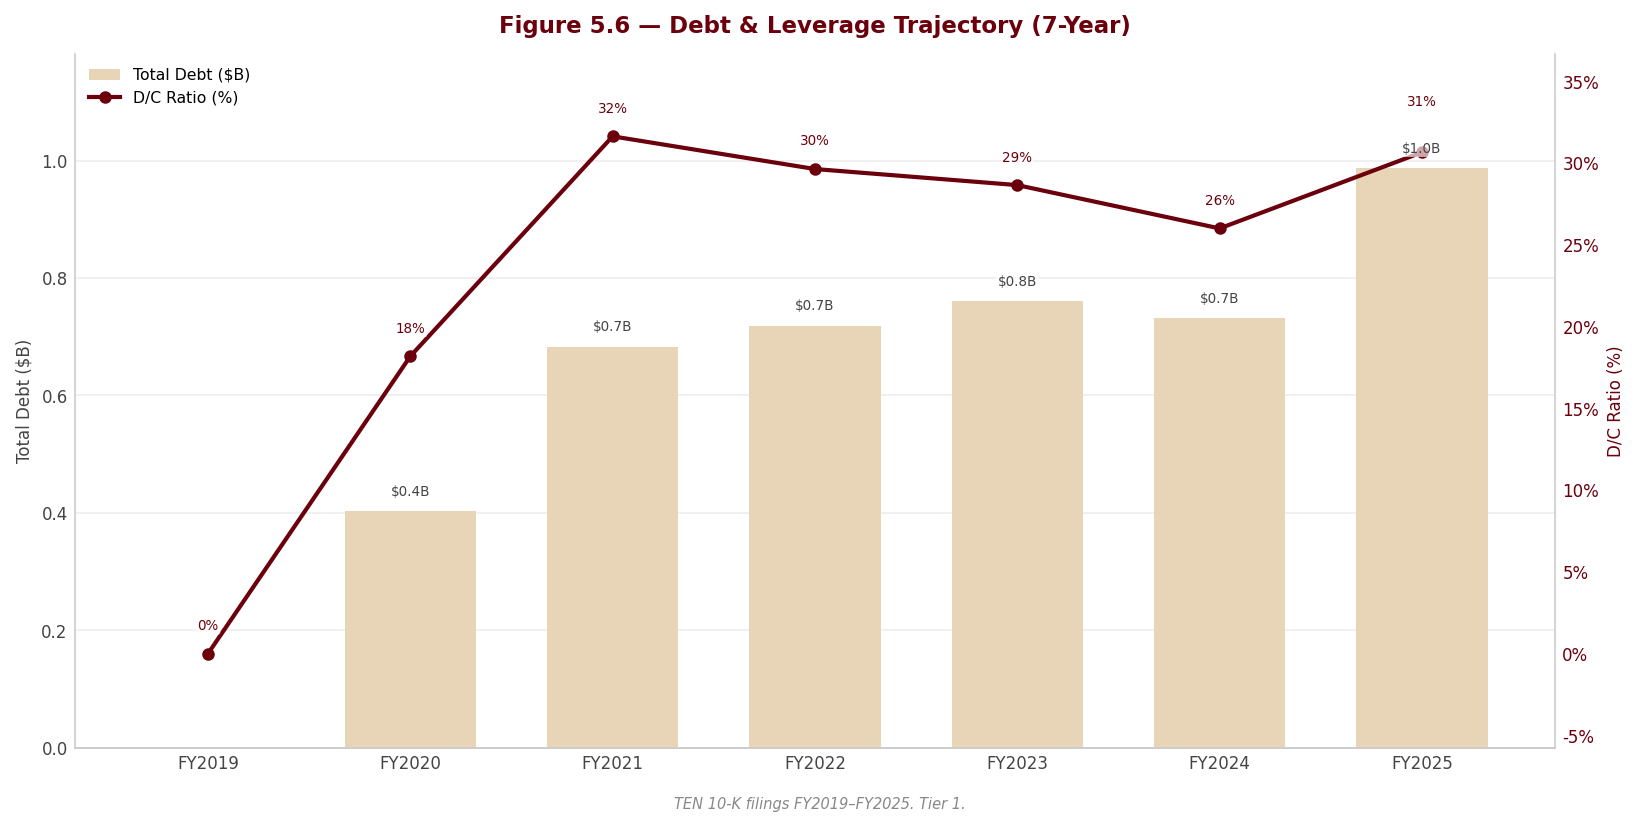
Leverage — why the headline is flattering. On its face the balance sheet looks pristine: net debt is negative in every year (a net cash position), running from -€2,955.3M to -€2,655.7M, and the resulting Net Debt/EBITDA screens deeply negative (-4.8x in FY2025). This conventional read is misleading for this business (F002). The cash that produces the net-cash position is substantially customer money — advance payments recorded as contract liabilities that, taken alone, exceed the entire €3,643.5M cash balance. Adjusted for those advances, the Group’s own cash is negative: the reported net cash is a liability-funded float, not distributable balance-sheet strength, and it drains if new awards slow and advances unwind faster than costs are disbursed. The honest presentation is to show the reported net cash of -€2,655.7M (net-debt line) alongside the advance-funded caveat, and not to credit the full figure as owned firepower. Gross debt itself rose in FY2025 to €987.8M from €731.4M, with short-term debt jumping to €309.5M from €93.8M, though Debt/Equity stayed modest at 0.4x. The larger solvency consideration is off the balance sheet entirely: parental-company performance guarantees (F003) that are many multiples of the €2,233.6M equity base — the true measure of contingent project-execution exposure — belong in the solvency picture and are developed further in the separate valuation.
Working capital. The cash conversion cycle is structurally negative — customers pre-fund the work — which is the engine behind both the flattering net-cash line and the strong-looking cash flow. But the cushion is thinning. Trade receivables climbed to €1,399.3M from €1,096.8M, growing materially faster than the 7.2% revenue increase (F008) — receivables outpacing revenue is the classic early-warning pair for softening collection and cash conversion. The current ratio has sat at 1.0x in every year of the window, a further reminder that current assets and current liabilities move essentially in lockstep because the contract-liability advances dominate the current section of the balance sheet.
⚠ Items to Watch. If the contract-liability advances continue to shrink relative to cash as backlog burns off, the reported net cash of -€2,655.7M would drain toward — and the advances-adjusted own-cash position further below — zero, removing the balance-sheet comfort the headline implies. [Rating and price target withdrawn — see the note at the top.]
3.3A Cash Flow Statement
| FY2021 | FY2022 | FY2023 | FY2024 | FY2025 | |
|---|---|---|---|---|---|
| Cash from Operations (€M) | €934.4M | €184.4M | €378.8M | €845.2M | €660.9M |
| — Depreciation & Amortization (€M) | €116.9M | €127.8M | €94.7M | €110.9M | €121.9M |
| Capital Expenditures (€M) | €49.6M | €46.7M | €48.4M | €84.6M | €89.4M |
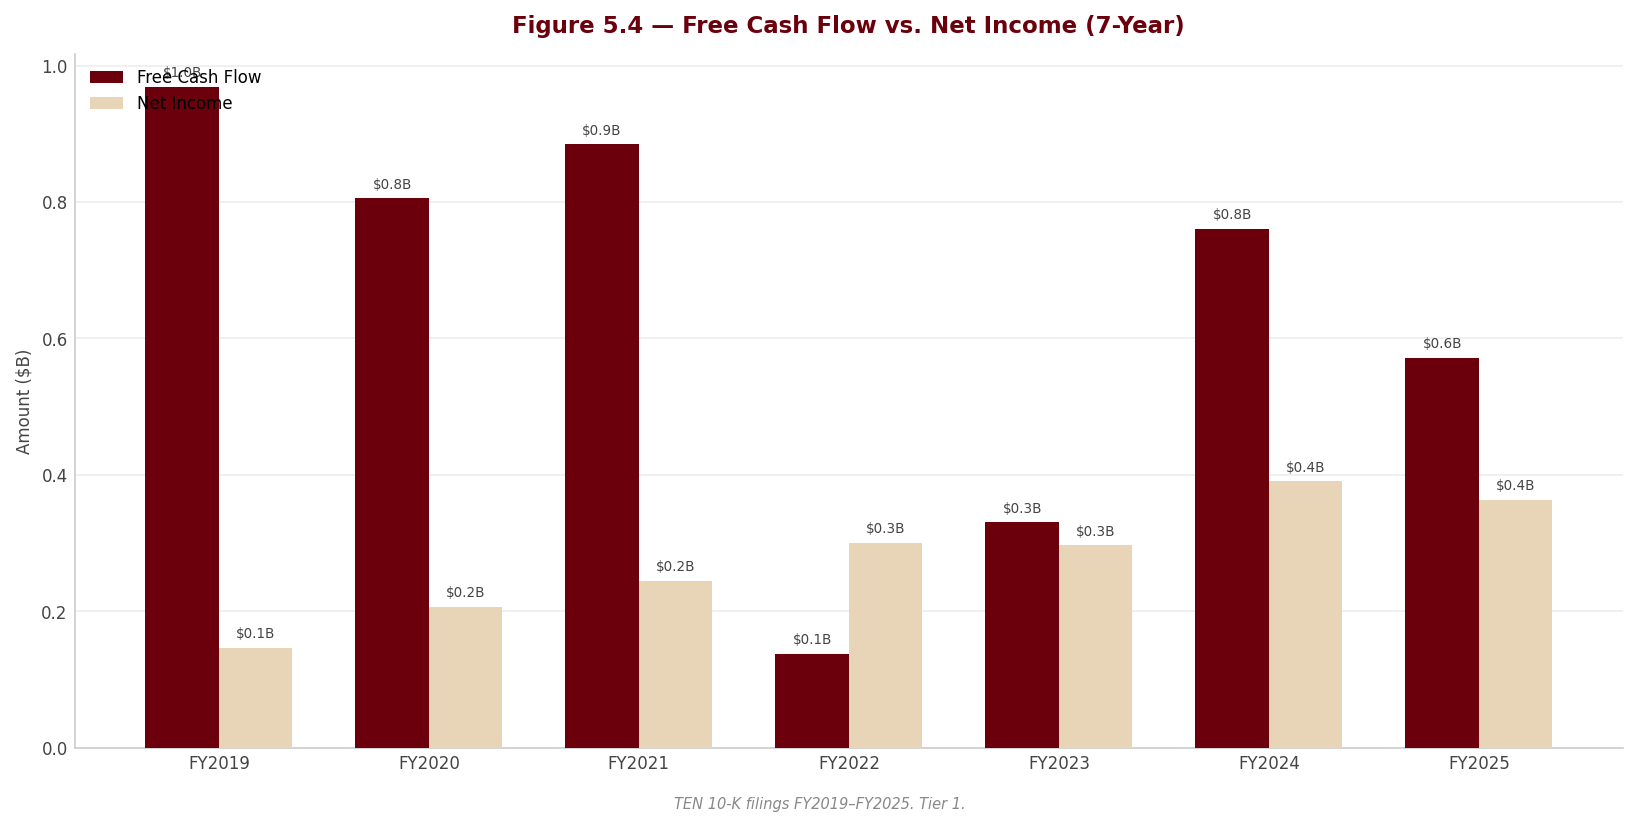
| Free Cash Flow (€M) | €884.8M | €137.7M | €330.4M | €760.6M | €571.5M |
| FCF Margin | 13.8% | 2.2% | 5.5% | 11.3% | 7.9% |
| FCF / Share | €4.91 | €0.77 | €1.83 | €4.22 | €3.20 |
| FCF Conversion (FCF/NI) | 361.7% | 45.8% | 111.3% | 194.7% | 157.1% |
| CapEx / Revenue | 0.8% | 0.7% | 0.8% | 1.3% | 1.2% |
| CapEx / D&A | 0.4x | 0.4x | 0.5x | 0.8x | 0.7x |
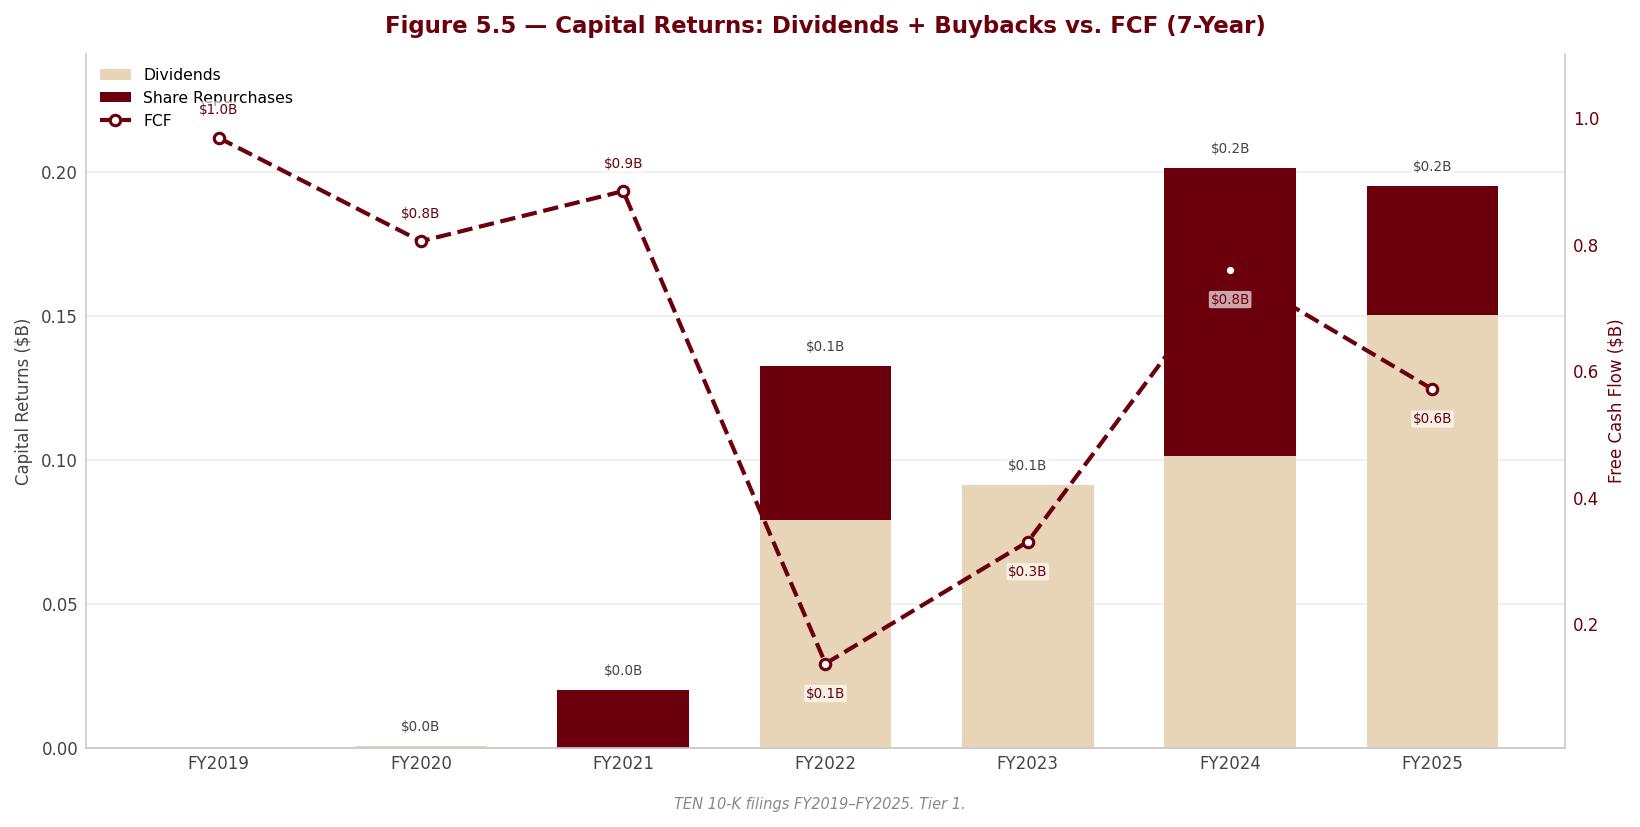
| Dividends Paid (€M) | — | €79.0M | €91.2M | €101.5M | €150.2M |
| Share Repurchases (€M) | €20.0M | €53.5M | €0.0M | €100.0M | €45.0M |
Source: Technip Energies N.V. 2025 Annual Report — consolidated statement of cash flows. Free cash flow is defined as cash from operations less capital expenditures; figures per the FL model — see Appendix A.1–A.2.
3.3B Cash Flow — Analysis
sources Quality of operating cash flow — the advance-inflation caveat. Operating cash flow is volatile and advance-driven, and it is the single most important thing to understand about this cash-flow statement. OCF swung from €934.4M in FY2021 down to just €184.4M in FY2022, back up to €845.2M in FY2024, and then down again to €660.9M in FY2025 — a range that bears no stable relationship to the far steadier net-income line. The reason is that OCF is inflated (and deflated) by the timing of customer advances: cash arrives when large projects are awarded and milestones are pre-billed, ahead of the costs and revenue they fund. FCF conversion illustrates the distortion vividly — it prints above 100% in most years (194.7% in FY2024, 157.1% in FY2025) yet collapsed to 45.8% in FY2022. [Rating and price target withdrawn — see the note at the top.] FY2025’s decline in OCF against higher revenue (F008) is the same mechanism working the other way as the receivables build and advance timing turned less favourable.
CapEx analysis. Investment intensity is negligible and confirms the asset-light model: capital expenditure has run at roughly one percent of revenue or less throughout (1.2% in FY2025), and CapEx/D&A has stayed well below 1.0x every year (0.7x in FY2025). For most companies a sub-1.0x CapEx/D&A signals harvest-mode underinvestment; here it simply reflects a business that engineers and manages projects rather than owning heavy plant. The modest uptick in absolute capex to €89.4M is consistent with selective build and the Ecovyst step-up, not a change in capital intensity.
Capital allocation. Returns to shareholders began only after the business established itself post-spin: dividends were nil in FY2021 and started in FY2022, then grew each year to €150.2M in FY2025, supplemented by episodic buybacks (€53.5M, then paused at €0.0M in FY2023, €100.0M in FY2024 and €45.0M in FY2025). Over the five-year window the great majority of free cash flow has been retained on the balance sheet or directed to targeted acquisitions, with a growing-but-still-minority slice returned via the dividend and opportunistic buybacks — a mix that fits a backlog-driven business wanting firepower for TPS-focused M&A. The essential caveat is that the free cash flow funding these returns is itself advance-supported, so distribution capacity is more contingent on the award cycle than the headline FCF/share of €3.20 suggests.
⚠ Items to Watch. If FCF conversion normalises back below 100% on a sustained basis — as it briefly did at 45.8% in FY2022 — dividend-plus-buyback coverage from organic cash would tighten materially. A repeat of an OCF year near the €184.4M FY2022 low, coinciding with the rising dividend of €150.2M, is the specific stress combination to watch.
3.4 Returns Analysis
| FY2021 | FY2022 | FY2023 | FY2024 | FY2025 | |
|---|---|---|---|---|---|
| ROIC | - | - | - | - | - |
| ROE | 14.9% | 18.9% | 16.5% | 19.7% | 16.9% |
| ROA | 3.0% | 3.5% | 3.4% | 4.4% | 3.8% |
| Interest Coverage | 30.4x | 25.9x | 23.2x | 22.2x | 23.6x |
Source: Company filings (Technip Energies N.V. Annual Reports); figures per the FL model — see Appendix A.1–A.2. ROIC is shown as an em-dash because invested capital is not meaningfully measurable here (see below).
ROIC, and why it is not shown. ROIC is ordinarily the single most important long-term return metric, but for Technip Energies it is presented as an em-dash by deliberate choice, not oversight: invested capital is not cleanly measurable when the balance sheet is dominated by a customer-advance float on one side (F002) and near-entirely-goodwill equity on the other (F005). A conventional ROIC would divide operating profit by a capital base that is simultaneously inflated by advances and hollow of tangible equity, producing a figure that flatters or distorts rather than informs. The returns read is therefore anchored on ROE and ROA, each with a caveat, and the ROIC-versus-WACC comparison is deferred to the separate valuation, where the cost of capital is derived and the advance-funded capital structure is addressed directly. Interest coverage, by contrast, is genuinely comfortable and stable (23.6x in FY2025), reflecting very low gross interest expense against operating profit.
DuPont decomposition. FY2025 ROE of 16.9% decomposes into a net margin of 5.1%, asset turnover of 0.76x and an equity multiplier of 4.41x. The decomposition is revealing: the net margin is thin and asset turnover is modest (assets are inflated by the advance float and the cash pile), so the swing factor that lifts ROE into the mid-teens is the equity multiplier of 4.41x — a high assets-to-equity ratio that exists precisely because equity is thin (goodwill-heavy, F005) and the asset side is grossed up by customer advances. In other words, the respectable-looking ROE (which peaked at 19.7% in FY2024 before easing to 16.9%) is a product of balance-sheet mechanics as much as operating performance, and it should be read alongside the low ROA of 3.8%, which strips the leverage out and shows the true asset productivity. This reinforces, rather than contradicts, the F002/F005 accounting caveats.
3.5 Altman Z′-Score (Private-Firm Weights, Most Recent FY)
| Component | FY2023 | FY2024 | FY2025 |
|---|---|---|---|
| X1 (Working Capital / Total Assets) | 0.018 | 0.029 | -0.005 |
| X2 (Retained Earnings / Total Assets) | 0.123 | 0.145 | 0.158 |
| X3 (EBIT / Total Assets) | 0.049 | 0.051 | 0.044 |
| X4 (Equity / Total Liabilities) | 0.282 | 0.292 | 0.297 |
| X5 (Revenue / Total Assets) | 0.692 | 0.727 | 0.735 |
| Z-Score | 1.08 | 1.15 | 1.13 |
| Zone | Distress (<1.23) | Distress (<1.23) | Distress (<1.23) |
Source: Company filings (Technip Energies N.V. Annual Reports); figures per the FL model — see Appendix A.1–A.2.
Interpretation — a structural false signal, read honestly. The Z′-Score — computed with Altman’s private-firm (Z′) weights, whose distress boundary is 1.23 rather than the public-company 1.81 — sits in the distress zone (below 1.23) in each of the last three years — 1.08, 1.15 and 1.13 — and it is trending sideways, not improving. Taken at face value that is an alarming credit signal, and it should not be softened: the number is in the distress band under either threshold family. But the Altman model, calibrated on asset-heavy manufacturers, systematically mis-scores an asset-light, advance-funded EPC contractor. Two of its five inputs are mechanically depressed by the very business features already discussed: X1 (working capital / total assets) is near zero and turns negative in FY2025 (-0.005) because the customer-advance contract liabilities sit in current liabilities (F002), and X5 (revenue / total assets) is structurally low because the asset base is inflated by cash and advances rather than productive plant. The score therefore captures the shape of the balance sheet, not genuine insolvency risk. The countervailing evidence is strong: the audit opinion is unqualified with no going-concern doubt (F010), the Beneish manipulation screen is clean, and interest coverage is comfortable at 23.6x. The credit reality for Technip Energies is better read off the off-balance-sheet guarantee overhang (F003) and its dependence on the customer-advance float (F002) — than off an Altman score the model was never designed to price.
4. Valuation withdrawn
This section stated what the shares were worth and what to do about them. It rested on an exit multiple set by hand — across the coverage it averaged 24% below where each company actually traded — so the conclusion largely restated that assumption instead of testing it. Rather than leave it standing, it has been withdrawn while the method is rebuilt.
Nothing else in this report depends on it: the financial analysis above and below is drawn from the company's own filings, and every figure links to the page it was verified against.
Section 5 — Financial Metrics & Peer Benchmarking
5.1 Peer Selection
sources Technip Energies is benchmarked against the three most defensible listed engineering-and-construction (E&C) comparables available: TechnipFMC (FTI), Maire S.p.A. (MAIRE) and Saipem (SPM). All four are project-based “energy E&C” businesses that recognise revenue over time on long-cycle contracts, but they are not identical franchises, and the set carries real limitations that frame every table below.
Maire is the closest true comparable. Like Technip Energies it is an IFRS reporter of similar revenue scale, built around downstream, fertiliser and energy-transition engineering plus a technology-licensing arm — an asset-light model with the same broad margin structure. Read Maire first when judging where the subject genuinely stands.
TechnipFMC is a structurally different business and a low-comparability peer. The majority of its activity is offshore Subsea and surface oilfield equipment and integrated services — a product-heavy mix that carries materially higher margins and richer multiples than pure project engineering. It also reports under US GAAP in US dollars, whereas the subject and the two Italian peers report under IFRS in euro. Its absolute figures are therefore not directly comparable in level, and even its margins and multiples should be read as directional only.
Saipem is a scale reference with incomplete data. Its FY2025 figures come from a preliminary results press release that contains the income statement but not a full balance sheet, so its balance-sheet-derived ratios are genuinely unavailable (shown as “—” throughout — a structural absence, not an omission). Its valuation multiples are further distorted by a pending all-share merger with Subsea7.
The single most important caveat cuts across the entire table and is developed in 5.5 and 5.7: all four firms are financed in large part by customer advances, so all four carry reported net cash. For Technip Energies specifically, that net cash is customer float rather than owned liquidity, which makes its enterprise-value-based multiples look artificially cheap.
| Peer | Ticker | Exchange | Filing Type | Accounting Standard | Fiscal Year End | Comparability Note |
|---|---|---|---|---|---|---|
| TechnipFMC plc | FTI | NYSE | FY2025 press release | US GAAP | December | Low comparability — product-heavy subsea/surface equipment, US GAAP/USD; ratios directional only |
| Maire S.p.A. | MAIRE | Euronext Milan | Annual report (IFRS) | IFRS | December | Closest comparable — IFRS energy-transition E&C plus technology licensing |
| Saipem S.p.A. | SPM | Euronext Milan | FY2025 results press release | IFRS | December | Scale reference — preliminary release (balance-sheet ratios unavailable); multiples distorted by pending Subsea7 merger |
| — | — | — | — | — | — | — |
Source: peer-company primary filings (TechnipFMC: company results release; Maire, Saipem: Euronext Milan issuers’ annual/preliminary reports); comparability notes in 5.7 — see Appendix A.1.
5.2 Profitability Comparison
sources Comparative: Most Recent Full Fiscal Year
Currency note: Technip Energies, Maire S.p.A. and Saipem S.p.A. report in euro; TechnipFMC plc reports in US dollars. Each money figure is shown in that company’s own reporting currency, so only the currency-neutral margins should be compared across the FTI line.
| Metric | Technip Energies N.V. | TechnipFMC plc | Maire S.p.A. | Saipem S.p.A. | — |
|---|---|---|---|---|---|
| Revenue (M, each in its reporting currency) | €7,203.8M | $9,932.6M | EUR 7,096.5M | EUR 15,497.0M | — |
| Gross Margin | 13.4% | — | — | — | — |
| EBITDA Margin | 7.7% | 17.6% | 7.0% | 11.1% | — |
| EBIT Margin | 6.0% | 13.2% | 6.1% | 4.4% | — |
| Net Margin | 5.1% | 9.7% | 3.7% | 2.0% | — |
| FCF Margin | 7.9% | 14.6% | 3.7% | 5.7% | — |
Source: peer-company primary filings (TechnipFMC: company results release; Maire, Saipem: Euronext Milan issuers’ annual/preliminary reports); comparability notes in 5.7 — see Appendix A.1.
Flag legend: ᶠ = IFRS-translated (directional only); ᵐ = market-sourced; ᶜ = computed from filing components. Flags per peer are recorded alongside each figure in the Peers sheet of the FL model.
Gross margin is not defined for any of these reporters: E&C income statements present costs by nature (or as a single cost line) with no cost-of-sales subtotal, so the row is intentionally blank rather than constructed inconsistently. On the metrics that are defined, Technip Energies sits closest to Maire S.p.A., the like-for-like comparable — both are thin-margin, asset-light engineering franchises. TechnipFMC plc screens materially more profitable, but that gap is a business-mix artifact, not superior execution of the same activity: its margin reflects the equipment and subsea product content of its revenue, and the reported figure is EBIT + D&A on a US-GAAP base, slightly below its own headline adjusted-EBITDA number. Saipem S.p.A.’s adjusted EBITDA margin looks respectable but converts to a thin EBIT margin, consistent with a lower-quality, offshore/onshore construction-and-drilling mix.
Two comparability points must temper the subject’s own reading. First, FY2025 was already a soft margin year for Technip Energies, and the trajectory has since deteriorated — a caveat carried in full in Section 7. Second, reported operating profit benefits from discretionary releases of contract-contingency provisions, so the underlying margin is a touch softer than the headline (see Section 3).
Historical: Technip Energies N.V. Own 5-Year Progression
| Metric | FY2021 | FY2022 | FY2023 | FY2024 | FY2025 |
|---|---|---|---|---|---|
| Gross Margin | 14.2% | 14.1% | 15.4% | 13.7% | 13.4% |
| EBITDA Margin | 11.0% | 11.3% | 8.6% | 8.6% | 7.7% |
| EBIT Margin | 9.2% | 9.3% | 7.1% | 7.0% | 6.0% |
| Net Margin | 3.8% | 4.8% | 4.9% | 5.8% | 5.1% |
| FCF Margin | 13.8% | 2.2% | 5.5% | 11.3% | 7.9% |
Source: peer-company primary filings (TechnipFMC: company results release; Maire, Saipem: Euronext Milan issuers’ annual/preliminary reports); comparability notes in 5.7 — see Appendix A.1.
The subject’s own five-year path shows a clear compression in operating margin as the revenue mix shifted toward large, lower-margin LNG project delivery and away from the richer earlier-cycle mix — the structural backdrop against which the peer comparison should be read. Free-cash-flow margin is volatile year to year because it is driven by the timing of customer advances rather than by earnings, a point that recurs throughout this section.
5.3 Returns Comparison
sources Comparative: Most Recent Full Fiscal Year
| Metric | Technip Energies N.V. | TechnipFMC plc | Maire S.p.A. | Saipem S.p.A. | — |
|---|---|---|---|---|---|
| ROIC | - | 26.0% | 20.7% | — | — |
| ROE | 16.9% | 28.7% | 36.5% | — | — |
| ROA | 3.8% | 9.6% | 3.5% | — | — |
| Asset Turnover | 0.73x | 0.98x | 0.87x | — | — |
Source: peer-company primary filings (TechnipFMC: company results release; Maire, Saipem: Euronext Milan issuers’ annual/preliminary reports); comparability notes in 5.7 — see Appendix A.1.
Return-on-invested-capital is not a meaningful ranking metric for this peer set, and the subject’s own ROIC is shown as “—” for exactly that reason: because these firms are financed by customer cash and carry net cash, their invested capital net of cash is negligible or negative, so the ratio is undefined or explosive. The peers’ ROIC figures are computed on gross invested capital (equity plus debt) and should be read as directional only — they cannot be compared against the cost of capital (8.58%) in the usual way, because the denominator does not represent capital genuinely at risk. Return on equity is the more usable cross-section: Technip Energies earns a respectable but middle-of-the-pack ROE, below Maire S.p.A. — whose licensing-led model and slimmer equity base drive a notably higher figure — and below TechnipFMC plc. The subject’s returns are solid for a project engineer but are not a point of differentiation versus the closest comparable.
Historical: Technip Energies N.V. Own 5-Year Progression
| Metric | FY2021 | FY2022 | FY2023 | FY2024 | FY2025 |
|---|---|---|---|---|---|
| ROIC | - | - | - | - | - |
| ROE | 14.9% | 18.9% | 16.5% | 19.7% | 16.9% |
| ROA | 3.0% | 3.5% | 3.4% | 4.4% | 3.8% |
Source: peer-company primary filings (TechnipFMC: company results release; Maire, Saipem: Euronext Milan issuers’ annual/preliminary reports); comparability notes in 5.7 — see Appendix A.1.
Read the subject’s ROE trend, not its ROIC, for a like-for-like view over time; the ROIC row is blank or distorted for the same net-cash reason across the whole history.
5.4 Leverage & Liquidity Comparison
sources Comparative: Most Recent Full Fiscal Year
| Metric | Technip Energies N.V. | TechnipFMC plc | Maire S.p.A. | Saipem S.p.A. | — |
|---|---|---|---|---|---|
| Net Debt / EBITDA | -4.8x | -0.3x | -1.4x | -0.6x | — |
| Total Debt / Equity | 0.4x | 0.1x | 0.8x | — | — |
| Interest Coverage | 23.6x | 33.2x | 4.7x | — | — |
| Current Ratio | 1.0x | 1.1x | 1.1x | — | — |
| FCF Margin | 7.9% | 14.6% | 3.7% | 5.7% | — |
Source: peer-company primary filings (TechnipFMC: company results release; Maire, Saipem: Euronext Milan issuers’ annual/preliminary reports); comparability notes in 5.7 — see Appendix A.1.
Every company in the set carries net cash, so all four show a negative net-debt-to-EBITDA ratio; low reported leverage is a shared feature of the advance-funded E&C model, not a distinguishing strength. The subject’s ratio looks the most conservative of the group, but this is precisely where the reader must not take the balance sheet at face value: and in the valuation, Technip Energies’ reported net cash is overwhelmingly customer advances — money received to build plants that have not yet been delivered — rather than owned, distributable liquidity. On an advances-adjusted basis the group’s own cash is close to nil. Interest coverage is comfortably high and debt-to-equity modest, confirming there is no solvency concern; but the apparent balance-sheet “firepower” implied by the deepest net-cash position in the peer group is largely an accounting artifact of the customer float. Current ratios cluster near parity across the set, as expected for firms whose current liabilities are dominated by contract liabilities.
5.5 Valuation Multiples Comparison
sources Comparative: Current Price
| Metric | Technip Energies N.V. | TechnipFMC plc | Maire S.p.A. | Saipem S.p.A. | — |
|---|---|---|---|---|---|
| EV/EBITDA | 4.6x | 16.9x | 6.4x | 4.5x | — |
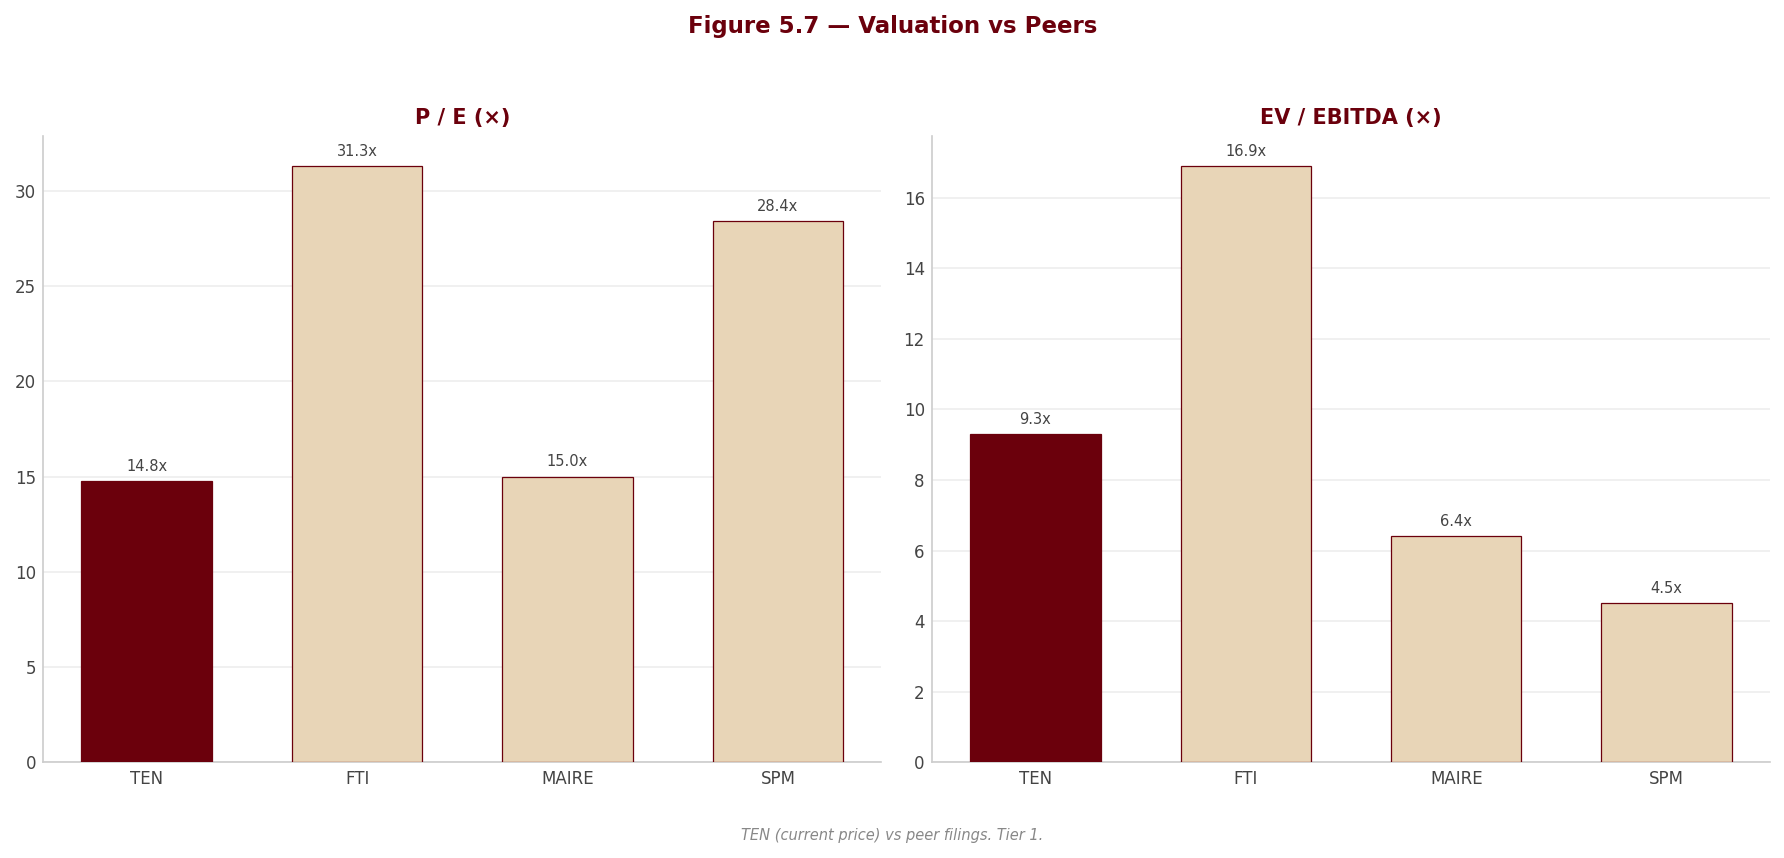
| P/E | 14.8x | 31.3x | 15.0x | 28.4x | — |
| FCF Yield | 11.0% | 4.8% | 6.7% | 10.0% | — |
Source: peer-company primary filings (TechnipFMC: company results release; Maire, Saipem: Euronext Milan issuers’ annual/preliminary reports); comparability notes in 5.7 — see Appendix A.1.
All peer valuation multiples are market-sourced. Subject to change with price movements.
This table is the crux of the peer read, and it is where the headline numbers are most misleading. On reported EV/EBITDA, Technip Energies screens as the cheapest name in the group — below its closest comparable, Maire S.p.A.. That apparent discount is an artifact, not a bargain. Enterprise value is market capitalisation minus net debt, and because the subject’s “net cash” is customer float, subtracting it deflates its EV and depresses the multiple. Strip the customer-advance cash back out — value the operating business on the cash it actually owns — and the subject’s EV/EBITDA roughly doubles, moving it above Maire S.p.A. rather than below it. The subject is therefore not the discount the reported multiple suggests.
The cleaner, net-cash-neutral comparison is the price/earnings multiple, which is struck on equity value and does not depend on how the customer float is treated. On that basis Technip Energies trades broadly in line with Maire S.p.A., the true comparable — the two “value” names of the group. TechnipFMC plc and Saipem S.p.A. both screen far more expensive on P/E, but neither is a clean read: TechnipFMC’s multiple reflects a roughly doubling of its share price over the year and its richer equipment mix, while Saipem’s embeds expectations tied to the pending Subsea7 merger rather than standalone earnings. The subject’s high reported free-cash-flow yield is likewise flattered by advance-driven cash inflows and should not be taken as a standalone valuation signal. Taken together, the currency-neutral, float-neutral evidence points to Technip Energies being roughly fairly valued against its honest comparable — consistent with the report’s valuation conclusion — rather than cheap.
Historical: Technip Energies N.V. EV/EBITDA (period-end price)
| FY2021 | FY2022 | FY2023 | FY2024 | FY2025 |
|---|---|---|---|---|
| -1.0x | -0.1x | 2.5x | 2.7x | 6.7x |
Source: peer-company primary filings (TechnipFMC: company results release; Maire, Saipem: Euronext Milan issuers’ annual/preliminary reports); comparability notes in 5.7 — see Appendix A.1.
The subject’s own historical EV/EBITDA is negative or near zero in the earlier years — a direct consequence of reported net cash exceeding the entire enterprise value — before rising as the market capitalisation grew. This history underlines the same warning: EV-based multiples are structurally unreliable for a company whose balance sheet is dominated by customer advances, and the P/E comparison should carry the weight.
5.6 Efficiency Comparison
| Metric | Technip Energies N.V. | TechnipFMC plc | Maire S.p.A. | Saipem S.p.A. | — |
|---|---|---|---|---|---|
| Days Sales Outstanding | 63 days | 42 days | 76 days | — | — |
| Days Inventory Outstanding | - | 49 days | 1 days | — | — |
| Days Payables Outstanding | 85 days | 50 days | 221 days | — | — |
| Cash Conversion Cycle | -22 days | 40 days | -144 days | — | — |
| CapEx / Revenue | 1.2% | 3.2% | 0.9% | 2.3% | — |
Source: peer-company primary filings (TechnipFMC: company results release; Maire, Saipem: Euronext Milan issuers’ annual/preliminary reports); comparability notes in 5.7 — see Appendix A.1.
The working-capital-cycle rows should not be read as an efficiency ranking. For all of these firms, contract assets, contract liabilities and subcontractor payables dwarf conventional trade receivables and inventory, so days-sales, days-payables and the cash-conversion cycle measure contract-billing structure rather than operational discipline — hence the negative cash-conversion cycles, which reflect customer prepayment, not superior collections. Saipem’s cells are blank because its preliminary release carries no balance sheet. The one genuinely informative row is capital intensity: all four run very low CapEx/Revenue, confirming the asset-light nature of the model, with Technip Energies among the lightest and TechnipFMC the highest, consistent with its equipment-manufacturing content.
5.7 Comparability Caveats
sources The peer comparison in this section is unusually caveat-heavy, and the caveats materially change the conclusion. Each material issue from the peer research is disclosed below.
Source-file misidentification (critical, FTI). The document supplied in the company folder as the “TechnipFMC” annual report was in fact the annual report of an unrelated Canadian mining company, reporting in a different currency and standard, containing no TechnipFMC data. It was discarded and not used anywhere in this analysis. TechnipFMC’s FY2025 figures were instead sourced from TechnipFMC’s own primary results press release. The folder file mapping should be corrected so that a genuine TechnipFMC filing is supplied for future runs.
Currency and accounting standard (FTI). TechnipFMC reports under US GAAP in US dollars, while Technip Energies, Maire S.p.A. and Saipem S.p.A. report under IFRS in euro. Peer figures are not currency-converted, so TechnipFMC’s absolute revenue and per-share figures (in USD) must not be compared in level against the euro names; its revenue is broadly comparable in scale but sits on a different base. Only its currency-neutral margins, returns and multiples are comparable, and even those are directional given the business-mix difference.
Business-mix differences (all peers). These are all “energy E&C” firms but not the same business. TechnipFMC is product- and equipment-heavy (subsea and surface), which structurally lifts its margins and multiples above those of a pure project engineer — its superior-looking profitability is a mix effect, not evidence of better execution of the same work. Maire S.p.A. is the closest match to Technip Energies in model and margin; Saipem S.p.A. is a larger, lower-margin offshore/onshore construction-and-drilling contractor.
The net-cash / customer-float illusion (all peers, most acute for the subject). All four are advance-funded, negative-working-capital businesses that report net cash rather than net debt. Three consequences follow and are applied consistently above: return-on-invested-capital is not meaningful and is shown as directional (or blank for the subject); the working-capital-cycle metrics measure billing structure, not efficiency, and are not ranked; and — most importantly for valuation — enterprise-value multiples are deflated by treating customer advances as net cash, which makes Technip Energies’ EV/EBITDA look artificially cheap. The report’s valuation neutralises this by crediting zero net cash in the equity bridge; the P/E comparison, which is unaffected, is the reliable cross-check and shows the subject roughly fairly valued against Maire S.p.A..
Saipem data completeness and merger distortion (SPM). Saipem’s figures come from a preliminary results press release that contains the income statement but not a full balance sheet, so its total assets, equity, EPS, finance expense and every balance-sheet-derived ratio are genuinely unavailable and are shown as “—” — a structural absence, not an omission. Separately, Saipem is in the middle of an all-share merger with Subsea7, so its market capitalisation, P/E and EV multiples embed merger expectations and are not a clean standalone read.
EBITDA definition (all peers). Peer EBITDA is computed as EBIT plus D&A to match the subject’s IFRS basis; this runs slightly below each company’s own headline “adjusted EBITDA,” which adds back further items. Peer EBITDA margins should therefore be read as marginally conservative relative to the companies’ own disclosures.
Gross margin not defined (all peers and the subject). E&C income statements present costs by nature or as a single cost line with no cost-of-sales subtotal, so a clean gross margin cannot be struck for any name in the set; the row is left blank rather than constructed inconsistently.
Market-sourced multiples. All valuation multiples are market-sourced (Tier 2) and move with prices. TechnipFMC’s rich P/E partly reflects a roughly doubling of its share price over the year; Saipem’s reflects the pending merger. On the earnings multiple, Maire S.p.A. and Technip Energies are the value names of the group.
Source: Peer-company primary filings and results releases; peer-researcher comparability notes — see Appendix A.1.
6. Valuation & Price Target withdrawn
This section stated what the shares were worth and what to do about them. It rested on an exit multiple set by hand — across the coverage it averaged 24% below where each company actually traded — so the conclusion largely restated that assumption instead of testing it. Rather than leave it standing, it has been withdrawn while the method is rebuilt.
Nothing else in this report depends on it: the financial analysis above and below is drawn from the company's own filings, and every figure links to the page it was verified against.
Section 7 — Quarterly Update: Q2 2026
sources All figures are in euro (€). Technip Energies reports on a cumulative half-year basis, so the current-quarter (Q2 2026) columns are derived as the reported six-month figures for H1 2026 minus the first quarter (Q2 = 6-month - 3-month). Balance-sheet, equity and non-controlling-interest rows are period-end at June 30, 2026 and are not derived.
Portfolio Action
sources [Rating and price target withdrawn — see the note at the top.]
| Assessment | |
|---|---|
| Action | [Rating and price target withdrawn — see the note at the top.] |
| Reason | Q2 2026 standalone EBIT collapsed to €3.9M on a Middle East contractual-dispute provision and incremental safety/business-continuity costs, but revenue kept growing and order intake hit a record — the quarter hurt earnings without breaking the growth thesis. |
| Thesis intact? | PARTIALLY — the backlog/growth pillar strengthened materially, but the margin-recovery pillar is now the open question after the charge, and the reported cash strength remains customer-advance float rather than owned liquidity. |
| Trigger to revisit | Evidence in H2 2026 / FY2027 that Project Delivery margin is recovering toward management’s reduced full-year guidance — or, conversely, a further Middle East charge that pushes standalone EBIT lower again. |
7.1 Results at a Glance
| Metric | Q2 2026 | Q2 2025 | YoY Δ | Q1 2026 | QoQ Δ |
|---|---|---|---|---|---|
| Revenue (€M) | €2,035.0M | €1,774.7M | +14.7% | €1,789.9M | +13.7% |
| Gross Profit (€M) | €130.3M | €250.0M | -47.9% | €189.9M | -31.4% |
| Gross Margin | 6.4% | 14.1% | -7.7 pp | 10.6% | -4.2 pp |
| EBITDA (€M) | €38.6M | €134.4M | -71.3% | €134.3M | -71.3% |
| EBITDA Margin | 1.9% | 7.6% | -5.7 pp | 7.5% | -5.6 pp |
| EBIT (€M) | €3.9M | €103.8M | -96.2% | €95.5M | -95.9% |
| EBIT Margin | 0.2% | 5.8% | -5.7 pp | 5.3% | -5.1 pp |
| Net Income (€M) | €12.1M | €86.7M | -86.0% | €84.5M | -85.7% |
| Net Margin | 0.6% | 4.9% | -4.3 pp | 4.7% | -4.1 pp |
| Diluted EPS | — | — | — | €0.48 | — |
Source: Technip Energies 2026 Half-Year Report, condensed consolidated statement of income (p. 18) and interim management report (pp. 6–9); Q2 2026 standalone derived as H1 2026 less Q1 2026.
7.2 P&L Drivers
sources Revenue: The top line kept growing year on year, driven by the Project Delivery segment ramping on LNG and low-carbon projects in the Americas (Commonwealth LNG and the Blue Point low-carbon ammonia project) and in Europe (the BP Net Zero Teesside project), which more than offset a decline in Africa & Middle East as the Qatari NFS and NFE megaprojects reached higher maturity and Middle East logistics tempered progress (interim management report, pp. 8–9). This is the reassuring half of the quarter: backlog conversion is intact and geographically diversifying.
Cost and margin: The story of the quarter is on the margin line. Standalone EBIT fell to €3.9M from €103.8M a year earlier and €95.5M in the prior quarter, as cost of sales (€1,904.7M vs €1,524.7M in Q2 2025) absorbed two Middle East items management identified explicitly: a provision taken against a contractual dispute with a Middle East customer, and incremental costs incurred for safety and business continuity on Middle East projects (segment highlights, p. 11). Management characterises these as prudently recognised now with cost recovery expected under strong contractual protection, but the timing and extent depend on the conflict’s evolution — so the compression is only partly temporary on current evidence. Reflecting this, management reduced its full-year Project Delivery margin guidance while raising its Technology, Products & Services margin guidance on a strong first half (pp. 5, 11–12).
[Rating and price target withdrawn — see the note at the top.]
7.3 Balance Sheet & Cash Flow
| Metric | Q2 2026 | Q2 2025 | YoY Δ | Q1 2026 | QoQ Δ |
|---|---|---|---|---|---|
| Cash (€M) | €4,490.4M | €3,879.1M | +15.8% | €3,861.3M | +16.3% |
| Net Debt (€M) | -€3,139.5M | -€3,156.5M | -0.5% | -€2,942.9M | +6.7% |
| Net Debt / LTM EBITDA | — | — | — | — | — |
| Total Assets (€M) | €10,504.9M | €9,297.7M | +13.0% | €9,916.7M | +5.9% |
| Equity (€M) | €2,064.1M | €2,127.0M | -3.0% | €2,358.9M | -12.5% |
| OCF (€M) | €576.0M | €303.8M | +89.6% | €304.3M | +89.3% |
| CapEx (€M) | €16.2M | €14.5M | +11.7% | €15.5M | +4.5% |
| FCF (€M) | €559.8M | €289.3M | +93.5% | €288.8M | +93.8% |
| Dividends Paid (€M) | €175.8M | €150.2M | +17.0% | €0.0M | — |
Net Debt / LTM EBITDA: not meaningful — the group is in a net-cash position, so the ratio is negative and low-signal for this advance-funded model, and a full trailing-twelve-month EBITDA is not compiled at the quarterly level in the FL model
Source: Technip Energies 2026 Half-Year Report, condensed statement of financial position (p. 20) and condensed statement of cash flows (p. 21); Q2 2026 standalone derived as H1 2026 less Q1 2026.
Balance sheet note: Cash rose to €4,490.4M and the group remained in a net-cash position (-€3,139.5M), but the increase is not owned liquidity — it is customer money: contract liabilities (customer advances) grew further and net contract liabilities increased over the half, so the balance-sheet “strength” continues to be advance-funded working capital rather than distributable cash (Note 6, contract balances, p. 29). Reported equity fell to €2,064.1M as the 2025 dividend and the completed share buy-back reduced it (Note 20, p. 42).
Cash flow note: Operating cash flow of €576.0M dwarfed net income of €12.1M — a divergence driven almost entirely by the customer-advance inflow in working capital, not by earnings quality (statement of cash flows, p. 21; Note 6, p. 29). This is the recurring caveat on this company: strong reported cash conversion at the top of a project-award cycle reflects prepayments that will reverse as the backlog is delivered, so the cash flow this quarter should not be read as owner free cash flow.
7.4 Footnote Review
sources Note 6 — Revenue and contract balances (p. 29–30) Revenue is recognised over time on long-cycle contracts. Customer advances (contract liabilities) rose over the half while contract assets fell, so the net contract-liability position grew — the mechanism behind the cash build in 7.3, and confirmation that the reported net cash is float. The backlog run-off schedule shows only a small share falling due in the remainder of 2026, with the bulk in 2028 and beyond, underlining strong multi-year visibility but back-end-loaded revenue.
Note 7 — Impairment, restructuring and other expense (p. 30) Broadly stable year on year; the largest component is investment in adjacent (early-stage decarbonisation/circularity) business models, with no asset impairment recognised in the half. Notably, the Middle East contractual charge is not booked here — it sits within cost of sales and provisions (Note 21), which is why operating profit rather than this line carries the damage.
Note 12 — Income tax (p. 34) [Rating and price target withdrawn — see the note at the top.]
Note 19 — Debt (p. 40–41) The group issued new euro-denominated senior unsecured notes maturing in 2033 during the half, lifting gross financial debt; commercial paper was reduced. Debt remains investment-grade (BBB), the €750 million revolving facility is fully undrawn with no financial covenant, and all covenants are compliant — so leverage is not a concern, and the new issuance funds general corporate purposes and capital returns rather than distress.
Note 20 — Shareholders’ equity (p. 42) Shares outstanding at period-end reconcile to the market share count used in the model. The group paid the 2025 final dividend (an increase year on year) and completed its announced share buy-back program, both of which reduced equity — evidence of management’s confidence and its stated capital-return priority, funded comfortably from the advance-rich balance sheet.
Note 21 — Provisions (p. 43) This is where the quarter’s charge surfaces on the balance sheet: current “contingencies related to contracts” provisions were increased during the half, consistent with the Middle East contractual-dispute provision management flagged in the segment commentary, even as older contract contingencies were used or released. The provisioning is estimate-driven and the same class of item the auditor identified as the key judgment area at year-end — so the recovery management expects is a genuine upside option, not a booked asset.
Related-party transactions (Note 23, p. 46–47) Related-party dealings are confined to project joint ventures and associates (JGC Coral Norte, CTEP France and CTEP Japan — the equity-method NFE joint ventures — TTSJV, and TPIT & DAR), comprising trade receivables, trade payables, JV revenue and expense, and loans to equity affiliates that increased over the half. There are no material transactions with controlling shareholders; terms are arm’s-length and consistent with the prior period. The rising loans to equity affiliates are worth monitoring as a modest cash commitment to the LNG joint ventures.
Contingencies and litigation (Note 25, p. 49) Third-party financial and performance guarantees issued to customers rose over the half in line with the surge in new awards; management does not expect losses that would be material. Various legal proceedings and liquidated-damages exposures are open, with management assessing that their ultimate resolution will not be material — unchanged in character from year-end. The far larger parent-company guarantee figure flagged in the annual accounts is not restated in this interim.
Subsequent events (Note 26, p. 49) The filing states there are no subsequent events. (The completion of the share buy-back on July 1, 2026 is disclosed within the equity note rather than here.)
7.5 What Changed This Quarter
sources - Standalone EBIT collapsed to €3.9M (from €103.8M a year earlier) on a Middle East contractual-dispute provision plus safety and business-continuity costs — the concrete crystallisation of the geopolitical-concentration risk that has always been the central thesis caveat. - Order intake reached a record and backlog jumped to roughly three-and-a-half years of revenue (interim management report, pp. 5, 9), driven by North Field West in Qatar, Commonwealth LNG in the US and Coral Norte in Mozambique — materially reinforcing the multi-year growth pillar even as near-term margins suffered. - Management cut full-year Project Delivery margin guidance while raising Technology, Products & Services guidance (pp. 5, 11–12) — the near-term earnings hit is acknowledged, but the higher-margin technology-and-services mix is holding up, supporting the eventual margin-recovery case. - Operating cash flow of €576.0M again vastly exceeded net income of €12.1M on customer-advance inflows (p. 21) — reconfirming, not resolving, the balance-sheet-quality caveat that the reported net cash is float. - Capital returns continued — the increased 2025 dividend was paid and the buy-back completed (Note 20, p. 42) — consistent with the capital-allocation story, comfortably funded, but note this is being paid out of an advance-rich, not an owned-cash-rich, balance sheet.
7.6 Portfolio Decision
sources [Rating and price target withdrawn — see the note at the top.] The quarter did exactly what the valuation feared and hoped in equal measure. On the downside, the Middle East concentration converted from a risk into a realised event: standalone EBIT of €3.9M confirms the H1 margin collapse is real, and management’s own guidance cut means the recovery is a forward hope, not a demonstrated fact. On the upside, the growth pillar strengthened decisively — a record order intake lifted backlog to around three-and-a-half years of revenue, which reinforces the medium-term revenue trajectory that underpins the base-case DCF. The footnote review confirms the two anchors of the investment view: the margin damage is provision-and-cost-driven and estimate-dependent (Note 21), and the headline cash strength (€4,490.4M, net cash -€3,139.5M) is customer-advance float, not owned liquidity (Note 6). [Rating and price target withdrawn — see the note at the top.]
What would change this view: - Upgrade condition: clear evidence in H2 2026 / FY2027 that Project Delivery margin is recovering toward management’s reduced full-year guidance, together with a durable easing of the Middle East conflict removing the overhang on the Qatari projects. - Downgrade condition: a further Middle East charge that pushes standalone EBIT lower again, or disruption to the Qatari NFE/NFS/NFW projects that simultaneously hits the P&L and drains the customer-advance float underpinning the reported net cash.
Report Versions
Every published version of this report, newest first — each one kept so a reader can see what changed and when.
| Version date | Files |
|---|---|
| 2026-08-20 Current | Model (Excel) |