
QUALCOMM Incorporated
Section 1 — Business Overview, Operations & Competitive Positioning
sources
1.1 The Business
sources QUALCOMM makes money two distinct ways: it sells Snapdragon and Dragonwing system-on-chip semiconductors that go into phones, cars and connected devices (the QCT segment), and it collects a per-unit royalty on essentially every 3G, 4G and 5G cellular device sold worldwide by licensing the foundational wireless-standard patents it owns (the QTL segment). The first business is a cyclical, intensely competitive, capital-light chip operation; the second is a high-margin toll on the global cellular installed base. Understanding that these are two different economic engines bolted onto one company is the starting point for everything that follows.
In FY2025 the company generated $44,284.0M of revenue, its highest ever, matching the prior FY2022 cyclical peak of $44,200.0M and rising from $38,962.0M the year before. The growth was real and operational — QCT handset, IoT and automotive chip sales all rose, while licensing revenue was roughly flat. A reader glancing only at the reported net-income line would draw the opposite conclusion, because net income fell sharply year-over-year. That decline is not an operating deterioration and, as of this report’s date, not even a permanent one: it was a single, discrete, non-cash charge to establish a deferred-tax valuation allowance, booked in the fourth quarter of FY2025 because the One Big Beautiful Bill Act (OBBB) led QUALCOMM to expect it would be perpetually subject to the corporate alternative minimum tax (CAMT) and therefore no longer able to realize substantially all of its existing federal deferred tax assets. Operating income and operating cash flow both rose through it. Critically, that charge has since been reversed: after the IRS issued guidance in the second quarter of FY2026 permitting CAMT to be reduced by previously capitalised domestic R&D, QUALCOMM concluded it no longer expects to be subject to CAMT for the foreseeable future and released the entire allowance as a non-cash benefit. The FY2025 charge was thus a round trip — non-cash in both directions — and did not impair the intrinsic value of the business. §
The reversal, however, is the less important half of the tax story, and it should not be read as good news. [Rating and price target withdrawn — see the note at the top.] This, not the dramatic valuation-allowance round trip, is the tax development that actually matters, and it is the easier of the two to miss. [Rating and price target withdrawn — see the note at the top.]
QUALCOMM is incorporated in Delaware, headquartered in San Diego, California, and trades on NASDAQ under the ticker QCOM. Its workforce is global and overwhelmingly technical — the substantial majority of employees sit in engineering or technical roles across dozens of countries — which is consistent with a company whose competitive position rests on continuous R&D and a patent portfolio rather than on physical assets. Substantially all of the products business and R&D is run through the QUALCOMM Technologies, Inc. subsidiary, while the parent, QUALCOMM Incorporated, owns the vast majority of the patents and operates the licensing business — a deliberate legal separation that protects the licensing model, discussed further in Section 1.6.
[Rating and price target withdrawn — see the note at the top.] We want to be explicit at the outset: this is a valuation call, not a quality call. The business is sound, cash-generative and competitively entrenched in its core markets. Our objection is price, and the derivation of the target — where a discounted-cash-flow view and a multiples view diverge.
Key Information
| Item | Value |
|---|---|
| Ticker | QCOM |
| Sector / Industry | Information Technology / Semiconductors |
| Report Date | 2026-08-20 |
| Most Recent FY Revenue | $44,284.0M |
| EBIT Margin (Most Recent FY) | 27.9% |
| Diluted Shares (FY2025 wtd. avg.) | 1,105M |
| Current Price | $162.83 |
| Market Capitalisation (on current shares outstanding) | $170,971.5M |
Source: Company SEC filings (10-K); see Appendix A.1.
1.2 Operating Segments
sources QUALCOMM reports through three segments — QCT, QTL and QSI — plus non-reportable activities. A structural note that governs how the numbers should be read: the company measures segment profitability as earnings before income taxes (EBT), its own management measure, not as operating income. Wherever this report discusses segment profit, it is EBT.
QCT (QUALCOMM CDMA Technologies) is the semiconductor business and the growth engine of the year. It designs and sells the Snapdragon and Dragonwing families — highly integrated processors that fuse an application processor, cellular modem, Wi-Fi/Bluetooth connectivity, positioning, RF front-end and power management into a single system-based solution, sold across the full device range from entry-level to premium. QCT reports revenue in three streams: handsets, automotive and IoT. The single economic variable that drives QCT is content-per-device multiplied by unit volume at the premium tier — the FY2025 gains came from higher revenue per chipset (better mix and pricing on premium-tier Android Snapdragon platforms) rather than from a broad volume surge. QCT is run on a fabless model: it owns almost no wafer fabrication, relying on third-party foundries (TSMC, Samsung, GlobalFoundries), with the notable exception of its RF front-end and RF-filter products, which it manufactures in-house in Germany, Singapore and China. That fabless structure keeps QCT capital-light but concentrates its supply chain in Asia — a fragility developed in Section 2.
QTL (QUALCOMM Technology Licensing) is the licensing business and the profit anchor. It grants licenses to QUALCOMM’s cellular standard-essential patent portfolio and collects royalties, calculated primarily as a percentage of the wholesale selling price of the complete licensed device (subject to per-unit floors and caps), paid quarterly by hundreds of licensees. The economic variable that drives QTL is the global sell-through of licensed cellular devices, weighted toward premium smartphones — not QUALCOMM’s own chip shipments, which is why QTL earns royalties even on devices that use a competitor’s or a customer’s in-house chip. Management is explicit that licensing carries a materially higher margin contribution than the chipset business; QTL is where the disproportionate share of the company’s profit and cash is generated.
QSI (QUALCOMM Strategic Initiatives) is the venture-investment arm. Through QUALCOMM Ventures it takes mostly early-stage, non-marketable equity positions in companies across 5G, AI, automotive, IoT and XR, intended to seed demand for QUALCOMM’s core technologies rather than to drive current earnings. Its results are lumpy and gain-driven — FY2025 benefited from IPOs of certain holdings — and it should be read as strategic optionality, not a recurring profit stream.
Beyond the three reportable segments sit non-reportable businesses: QGOV (U.S. government technologies) and a Data Center business (a rename of the former cloud-computing initiative), where management intends to leverage its custom-designed Oryon CPU cores. The Data Center effort is pre-revenue today but is the strategic destination of the pending Alphawave acquisition. §
The system fits together as a flywheel: QUALCOMM invents at the wireless standard, contributes those inventions to industry standards, then monetizes the same intellectual property twice — once as royalties through QTL and again as integrated silicon through QCT. The synergy is that leadership in 5G standards feeds both engines. The fragility is that the two engines share the same customer base and the same China exposure, so a single customer decision or a single policy action can hit chip revenue and royalty revenue at once. That correlation of risk across two nominally diversified segments is the most under-appreciated feature of the business.
1.3 Geographic Exposure
sources QUALCOMM’s revenue is heavily concentrated in China. A large share of consolidated revenue is tied to China (including Hong Kong), both through Chinese OEM customers and through non-Chinese brands manufacturing and selling into the Chinese market, and the company also sources certain critical integrated circuits from Chinese suppliers. This is the single most important geographic fact about the company: it is a U.S.-domiciled, U.S.-taxed business whose revenue base is disproportionately Chinese and whose supply chain runs through Taiwan, Korea, China, Germany and Singapore. [Rating and price target withdrawn — see the note at the top.] §
[Rating and price target withdrawn — see the note at the top.] The full treatment of this exposure, including the revoked Huawei export license and the Taiwan foundry-supply dependency, is in Section 2.
1.4 Management Team
sources The anchor of the team is President and CEO Cristiano Amon, a QUALCOMM insider who joined as an engineer in the mid-1990s, built the Snapdragon franchise, and now runs the company. His credibility with the market rests on the diversification strategy — pushing QUALCOMM’s technology into automotive, IoT, PC and data center — and the execution of that strategy is what his tenure will be judged on. Alexander Rogers, as President of QTL and Global Affairs, runs the licensing business and the litigation posture that protects it; given that QTL generates the disproportionate share of profit, his role is more central to the equity than an org chart would suggest.
The one structural governance feature worth flagging is that Akash Palkhiwala holds the combined title of Chief Financial Officer and Chief Operating Officer. Concentrating financial control and operational control in a single executive is efficient but reduces the internal check that a separate COO would provide, and it makes succession planning at the top of the finance and operations functions thinner than at a company that splits the roles. The technology bench saw a recent change — Baaziz Achour became CTO of the technologies subsidiary in early 2025 — which is a normal evolution rather than a red flag but does mean the top technical seat is newly held during a period when the custom Oryon CPU roadmap is strategically critical. Overall this is a long-tenured, engineering-led team with deep institutional knowledge of both the chip and the licensing businesses; the watch items are the doubled-up CFO/COO role and ordinary key-person dependence on Amon and Rogers, not any evident governance defect.
1.5 Capital Allocation Track Record
| Year | Dividends Paid ($M) | Share Repurchases ($M) | CapEx ($M) |
|---|---|---|---|
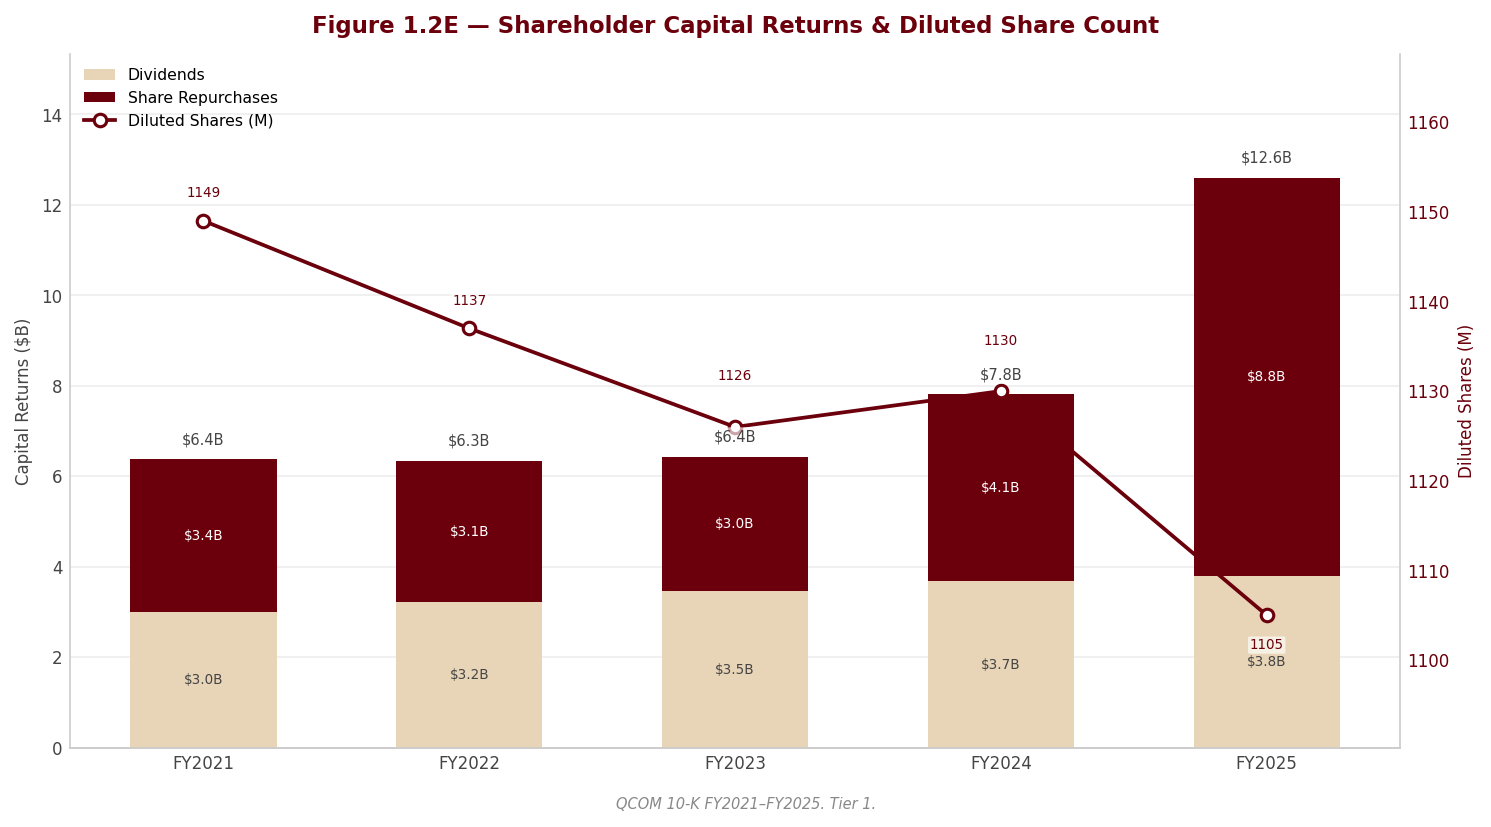
| FY2021 | $3,008.0M | $3,366.0M | $1,888.0M |
| FY2022 | $3,212.0M | $3,129.0M | $2,262.0M |
| FY2023 | $3,462.0M | $2,973.0M | $1,450.0M |
| FY2024 | $3,687.0M | $4,121.0M | $1,041.0M |
| FY2025 | $3,805.0M | $8,791.0M | $1,192.0M |
Source: Company SEC filings (10-K); see Appendix A.1.
QUALCOMM is run as a cash-return story, and FY2025 pushed that posture harder. Capital is deployed overwhelmingly toward shareholders rather than into the balance sheet: the dividend has been raised steadily and buybacks were stepped up sharply in FY2025, with repurchases well above the prior year. On a trailing basis the total-shareholder-return yield reached 6.9% and the dividend payout ratio was 68.7%. We would flag two things about that payout figure and the year’s returns. First, the payout ratio and the appearance that total capital returned exceeded net income are distorted by the non-cash tax charge described in Section 1.1 — measured against free cash flow, which the charge did not touch, the returns were covered. Second, the acceleration of buybacks is aggressive against a backdrop of two known revenue headwinds (Apple and Huawei, below) and a pending acquisition that has already required a portion of cash to be ring-fenced; whether that pace is sustainable if chip revenue softens is a legitimate question, taken up in Section 3.
CapEx is modest and consistent with the fabless model — QUALCOMM does not need to fund fabs, so its capital intensity is a fraction of an integrated chipmaker’s. Management has guided that capital expenditure will rise in the near term, primarily to support in-house testing of its integrated circuits, but this is incremental tooling, not a shift toward asset-heavy manufacturing. The signal from the CapEx-to-D&A relationship is that spending is oriented to maintaining and modestly expanding the existing asset base rather than to a large growth build-out; the company’s real “growth CapEx” is its R&D expense and its acquisitions, not property and equipment. The net read on capital allocation: disciplined and confident on returns, light on internal reinvestment by design, and — this year — leaning into buybacks at a point in the cycle where the forward revenue path is unusually uncertain.
1.6 Competitive Positioning & Moat
sources 1.6.1 Industry structure. The two segments live in structurally different industries. QCT competes in the merchant semiconductor market, which is intensely competitive, subject to rapid technological change, customer concentration, limited global foundry capacity and ongoing vertical integration by its own largest customers; returns there are earned by staying at the leading process node and winning premium-tier design sockets, and are perpetually pressured by average-selling-price erosion when volume does not grow. Named competitors span Broadcom, MediaTek, Nvidia, Samsung, Qorvo, Skyworks, NXP, Texas Instruments and others. QTL, by contrast, sits in a near-unique position: the mobile industry generally recognizes that a company cannot build and sell cellular devices without rights to QUALCOMM’s standard-essential patents, so QTL’s economics look less like a competitive market and more like a regulated toll — high margin, broad, and defended in courtrooms and standards bodies rather than in price competition.
1.6.2 Competitive advantages. The moat is real and rests on four supports, each grounded in a specific disclosure. First, the patent portfolio: management characterizes it as the most widely and extensively licensed in the industry, with broad coverage across the major device-manufacturing jurisdictions, and states the industry recognizes that cellular products require a license to it — this is the durable, high-margin core of the franchise. Second, the legal architecture: the licensing patents are held in the parent, QUALCOMM Incorporated, and are deliberately walled off from the chipset subsidiary, which has no authority to license them — a structure specifically designed to keep the licensing model intact even as chips are sold. Third, scale and integration leadership in premium chipsets: QCT’s ability to integrate modem, connectivity, RF front-end and now custom Oryon CPU cores into a single premium platform is what drove FY2025 content-per-device gains and is difficult for single-application specialists to match. [Rating and price target withdrawn — see the note at the top.]
1.6.3 Competitive vulnerabilities. The moat is being tested at exactly the point where it matters most — the top of the customer stack — and three disclosed developments make this concrete rather than theoretical. First, and most important, Apple has begun using its own modem in recently released devices instead of QUALCOMM’s, and management explicitly expects Apple to increasingly displace QUALCOMM’s modem products in future devices, with what it describes as a significant negative impact on QCT. This is not a contingency; it has started, and it removes a material chip revenue stream over the next several years. Second, the Huawei licensing royalty stream ended when Huawei’s QTL license expired during FY2025 — a permanent step-down in the highest-margin revenue base, following the earlier loss of Huawei product sales, and not within QUALCOMM’s control to reinstate given the U.S. export posture. Third, these two hits land against a backdrop of extreme customer and China concentration: a small number of customers — including Apple, Samsung and Xiaomi — each account for a significant share of consolidated revenue, and each of those top customers also designs its own chips and is therefore simultaneously a customer and a vertical-integration competitor. The same concentration exposes the company to Chinese self-sufficiency policy and U.S./China trade actions. The quantification of all three — customer shares, China share, and the timing of the licensing headwind — is in Section 2, where they are the leading risks. Two further vulnerabilities compound the picture: a wall of key OEM license expiries falling due over the coming years, each a renewal negotiation that could reduce the royalty base; and the fabless dependence on a small number of Asian foundries, concentrated in Taiwan, where a supply disruption would be material to the whole company.
1.6.4 Verdict. QUALCOMM’s competitive position is genuinely strong where it counts — the licensing toll on the cellular standard and premium-tier chipset integration are durable, high-margin advantages that support robust operating margins for the foreseeable medium term. But the moat is eroding at the top of the customer stack rather than at the bottom: the very customers large enough to matter are the ones in-sourcing silicon, and the highest-margin royalty base has just lost a permanent piece. The implication for margin durability is asymmetric — near-term profitability is well protected, but the growth trajectory is capped by disclosed, structural revenue cliffs, and that is precisely why the valuation assumes almost no growth. The business is sound; the competitive question is not whether QUALCOMM can defend its margins but whether it can grow into a price the market is already paying. On the evidence here, we think it cannot, which is what makes this a valuation call.
Section 2 — Key Risks & Catalysts
sources
2.1 Downside Risks
sources The dominant risk at QUALCOMM is not financial, operational or governance-related — the balance sheet is investment-grade and the accounting is clean (2.5 documents just how clean). It is structural and revenue-side: the company’s largest customers are also its most capable competitors, its revenue base is concentrated in a handful of names and in one country, and two of those revenue streams are already contracting on disclosed, non-contingent triggers. The risks below are ranked by how directly they bear on the forward revenue line, because that — not cost, leverage or fraud risk — is where this equity can be impaired.
Risk 1 — Apple’s modem in-sourcing has begun (RED flag)
sources This is the single largest identifiable forward headwind, and it has moved from expectation to fact. In the prior-year filing management framed Apple’s development of its own cellular modem only as a future possibility; this year it discloses that Apple has begun using its own modem in place of QUALCOMM’s in recently released smartphones, and that it expects Apple to increasingly displace QUALCOMM’s modem products in future devices, with what management itself describes as a significant negative impact on QCT revenues, results of operations and cash flows. Apple is one of QUALCOMM’s three largest customers, and the modem products it buys are lower-margin, application-processor-excluded thin-modem parts — so the transition removes a material chip-revenue stream over the next several device cycles. Because the disclosure is directional and management-confirmed rather than contingent, a base case that models QCT handset revenue as flat is too optimistic; the only open questions are the pace of the ramp and how much QUALCOMM content Apple retains in transceiver and front-end components. What makes it bite: each successive iPhone generation that ships with Apple’s in-house modem instead of QUALCOMM’s, and any extension of in-sourcing beyond the baseband into the RF front-end.
Probability: High (already underway) | Timeframe: Immediate and rolling over 1–3 years | Quantified potential impact: Not separately quantified in the data pack; directionally a multi-year step-down in QCT handset revenue and cash flow, partially cushioned by any retained RF/front-end content.
Risk 2 — Extreme customer and China concentration, where each top customer is also a competitor (RED flag)
sources QUALCOMM’s revenue is concentrated to a degree that turns any single relationship into a systemic exposure. A small number of customers — Apple, Samsung and Xiaomi are the three named in the filing — together account for more than half of consolidated revenue, and revenue tied to China, including Hong Kong, is close to half of the total. The compounding feature, and the reason this sits above generic “customer concentration” boilerplate, is that each of those three largest customers designs its own integrated circuits: every one of them is simultaneously a major customer and a vertical-integration competitor. The China exposure is doubly loaded, because QUALCOMM both sells heavily into China (through Chinese OEMs and through non-Chinese brands manufacturing there) and sources certain critical integrated circuits from Chinese suppliers, so U.S./China trade, entity-list and semiconductor-self-sufficiency policy is a first-order revenue variable rather than a tail risk. This concentration is the backdrop that makes Risks 1 and 3 so consequential: it is why the loss of a single customer relationship, a single license, or a single policy action is material rather than marginal. What makes it bite: any tariff, export-license or entity-list action restricting sales to Chinese customers or purchases from Chinese suppliers; a Chinese-government push toward domestic silicon; or a loss/reduction of purchases at any one of the top three names.
Probability: High (structural, and not improving year over year) | Timeframe: Immediate and ongoing | Quantified potential impact: Not quantified in the data pack; the loss or restriction of any single top-three customer, or a broad China restriction, would each be highly material to consolidated revenue.
Risk 3 — Erosion of the high-margin QTL royalty base: Huawei has ended, and the licensing model is under legal and regulatory attack (RED flag)
sources QTL is QUALCOMM’s profit anchor — a high-margin toll on the global cellular installed base — which is precisely why its durability matters more than its size. Two distinct pressures converge here. First, Huawei’s QTL license expired during the fiscal year and those royalties have stopped, a permanent step-down in the highest-margin revenue stream and the second Huawei-related revenue loss in two years, following the earlier loss of Huawei product sales when the U.S. export license was revoked. QUALCOMM has no control over reinstatement given the U.S. export posture. [Rating and price target withdrawn — see the note at the top.] Second, the licensing model itself is perpetually litigated: management expects certain OEMs, governments and regulators to keep challenging the practice of charging device-level royalties, through FRAND and antitrust allegations, demands to license at the chipset level or to cap the royalty base, and attempts to shift royalty obligations to suppliers — any of which would carry a disproportionate cash-flow impact given licensing’s margin. [Rating and price target withdrawn — see the note at the top.] What makes it bite: a further licensee non-renewal or arbitration, an adverse regulatory ruling forcing chipset-level licensing or a lower royalty base, or an unfavorable turn in the Arm appeal.
Probability: Medium-to-High (Huawei loss is realized; legal/renewal outcomes are uncertain) | Timeframe: Immediate (Huawei) to 3–5 years (license-expiry wall, appeals) | Quantified potential impact: Not quantified in the data pack; a permanent step-down in the QTL royalty base with an outsized cash-flow effect given QTL’s margin profile.
Risk 4 — Fabless supply concentration and Taiwan geopolitical dependence
sources QUALCOMM’s capital-light fabless model, a strength for returns, is a concentrated single point of failure on the supply side. It relies on a limited number of third-party foundries — principally TSMC, Samsung and GlobalFoundries — with the majority of foundry, assembly and test capacity located in the Asia-Pacific region, and it depends on sole- or limited-source suppliers for certain products. Management explicitly warns that a significant or prolonged military or geopolitical conflict involving China and Taiwan could severely limit chipset supply, with a material adverse impact on QUALCOMM and the semiconductor industry as a whole. Layered on top are ordinary fabless fragilities: capacity being reallocated to other customers (including competitors), suppliers unilaterally attempting to cut committed capacity, and leading process-technology nodes continuing to drive product-cost increases that pressure chipset gross margin. The company also carries a large multi-year purchase-commitment obligation to its wafer suppliers, most of it due within twelve months, which converts a demand shortfall into an excess-inventory or reserve risk. What makes it bite: a Taiwan-centred geopolitical shock, a foundry-capacity reallocation away from QUALCOMM, or a demand downturn against committed wafer purchases.
Probability: Low-to-Medium (low probability, very high severity for the Taiwan tail) | Timeframe: Immediate (cost/capacity) to unpredictable (geopolitical tail) | Quantified potential impact: Not quantified in the data pack; a Taiwan supply disruption would be severe and company-wide; node-cost inflation is a continuous margin drag.
Risk 5 — A legislative change has permanently raised the recurring tax rate, lowering free cash flow to shareholders (RED flag)
sources The year’s most dramatic reported number — a net-income decline driven by a large, non-cash charge to establish a valuation allowance against substantially all federal deferred tax assets — was, on its own terms, not the risk, and reading it as one would be a mistake in both directions. At the time, management booked the allowance because it expected QUALCOMM to be perpetually subject to the corporate alternative minimum tax (CAMT) and therefore no longer expected to realize those assets. That expectation did not survive contact with the following year: after a subsequent IRS notice permitted CAMT to be reduced by previously capitalized domestic R&D, management concluded it no longer expects to be subject to CAMT in the foreseeable future and released the allowance in full, reversing the entire charge. The CAMT thesis — and the accounting charge that flowed from it — is therefore closed, and there is no permanent economic loss to shareholders from the charge itself; the cash was never affected in the first place, and the reported net-income “collapse” it caused has now unwound. §
[Rating and price target withdrawn — see the note at the top.] Unlike the reversed accounting charge, this is a real, ongoing cash cost — it permanently lowers the after-tax free cash flow available to fund dividends, buybacks and reinvestment, and it does so regardless of operating performance. [Rating and price target withdrawn — see the note at the top.]
Two further points belong here. First, the episode is itself an estimation-sensitivity signal: within roughly nine months management moved from “perpetually subject to CAMT” to “no longer expect to be subject,” writing off and then writing back a very large deferred-tax balance on the strength of a regulatory notice. [Rating and price target withdrawn — see the note at the top.] Second, the company’s own disclosure is explicit that changes in future taxable income, tax laws and other factors may again change its determination on realizing the deferred tax assets — so this is a live, recurring exposure, not a closed matter, compounded by unresolved foreign transfer-pricing positions and a long-running Korean withholding-tax dispute. [Rating and price target withdrawn — see the note at the top.]
[Rating and price target withdrawn — see the note at the top.]
2.2 Upside Catalysts
sources We are deliberately not manufacturing symmetry: the risk side of this equity is heavier than the catalyst side, and that asymmetry is the core of our valuation stance in the separate valuation. [Rating and price target withdrawn — see the note at the top.] They matter because they are what has to work for the diversification thesis, and the stock, to grow into the price the market already pays.
Catalyst 1 — Automotive and IoT diversification converting the design-win pipeline into revenue
sources The most credible growth vector is the diversification away from handsets into automotive and IoT, both of which grew this year. [Rating and price target withdrawn — see the note at the top.] This is the part of the business least exposed to the vertical-integration and handset-maturity risks above. It matters because it is the only path by which QUALCOMM replaces handset-content erosion with durable, higher-visibility revenue.
Probability: Medium-to-High (already growing) | Timeframe: 2–5 years (design-win-to-revenue lag) | Monitoring trigger: Continued sequential growth in automotive and IoT revenue and disclosure of a growing automotive design-win backlog.
Catalyst 2 — On-device and edge AI expanding content per device across phones, PCs and new form factors
sources Management positions on-device AI and high-performance, low-power computing as the vector that carries smartphone-class technology into PCs, XR, wearables, industrial IoT and automotive — with proprietary building blocks (Oryon and Kryo CPUs, Adreno GPUs, Hexagon NPU, a unified AI stack) as the differentiators. The investment logic is content-per-device expansion: if AI capability becomes a standard requirement across a widening set of devices, QUALCOMM’s integration advantage lets it capture more silicon value per unit, partially offsetting unit-level pressure at the premium handset tier. It shows up first in the PC/compute and premium-Android content story before it is material to consolidated revenue.
Probability: Medium | Timeframe: 2–5 years | Monitoring trigger: Rising revenue-per-chipset and content gains in premium-tier platforms; traction in the PC/compute and emerging AI-device categories.
Catalyst 3 — Restored R&D expensing lowering cash taxes beginning next fiscal year
sources The same legislation behind the tax changes in Risk 5 carries a genuine cash tailwind: it permanently restores immediate deduction of domestic R&D expenditures beginning next fiscal year, reversing the prior requirement to capitalize and amortize them that had raised cash taxes and dragged on operating cash flow. For an R&D-intensive company, this is a direct, mechanical benefit to next year’s free cash flow — and, unlike most catalysts here, it is near-certain in direction and near-term in timing. §
[Rating and price target withdrawn — see the note at the top.]
Catalyst 4 — Data-center entry via the pending Alphawave acquisition (optional, and two-sided)
sources The pending acquisition of Alphawave IP Group, tied to the still-pre-revenue Data Center business where management intends to leverage its custom Oryon CPU cores, is the company’s first data-center M&A of scale and a call option on an entirely new end market. We flag it as a catalyst with candor: it is unproven, it remains subject to regulatory approval and a first-quarter-of-next-calendar-year expected close, and its purchase price and potential share dilution are uncertain because part of the consideration can be elected in stock. It is optionality on the diversification thesis, not a modeled earnings driver.
Probability: Low-to-Medium (execution- and approval-dependent) | Timeframe: 3–5 years to revenue materiality | Monitoring trigger: Deal close and regulatory approval; first disclosed data-center revenue and design wins.
2.3 Risk & Catalyst Summary
| # | Item | Type | Probability | Timeframe | Status | Monitoring Trigger |
|---|---|---|---|---|---|---|
| 1 | Apple modem in-sourcing | Risk | High | Immediate / 1–3 yrs | Active | Each iPhone cycle shipping Apple’s own modem; extension into RF front-end |
| 2 | Customer & China concentration (customers are also competitors) | Risk | High | Immediate / ongoing | Active | Tariff, entity-list or export action; China self-sufficiency push; loss at any top-three customer |
| 3 | QTL royalty erosion (Huawei ended; licensing model litigated; Arm/Oryon) | Risk | Medium–High | Immediate / 3–5 yrs | Active | Licensee non-renewal or arbitration; adverse FRAND/antitrust ruling; Arm appeal outcome |
| 4 | Fabless supply concentration & Taiwan dependence | Risk | Low–Medium | Immediate / tail | Latent | Taiwan geopolitical shock; foundry-capacity reallocation; demand vs. committed wafer buys |
| 5 | [Rating and price target withdrawn — see the note at the top.] | Risk | High | In effect / ongoing | Active | [Rating and price target withdrawn — see the note at the top.] |
| 6 | Automotive & IoT diversification | Catalyst | Medium–High | 2–5 yrs | Active | Sustained auto/IoT revenue growth; growing automotive design-win backlog |
| 7 | On-device / edge AI content expansion | Catalyst | Medium | 2–5 yrs | Monitoring | Rising revenue-per-chipset; PC/compute and AI-device traction |
| 8 | Restored R&D expensing → lower cash taxes | Catalyst | High | Next FY | Monitoring | Lower cash taxes paid; step-up in free cash flow |
Source: Company SEC filings (10-K) and forensic footnote review; see Appendix A.1.
2.4 Risk Interdependencies
sources These risks are not independent draws; they share a common root and compound one another. The concentration in Risk 2 is the amplifier for the whole system: it is precisely because three customers and one country dominate the revenue base that the Apple in-sourcing of Risk 1, the Huawei royalty loss and licensing-model attack of Risk 3, and the Taiwan supply dependence of Risk 4 each translate into material rather than marginal outcomes. The most damaging scenario is a correlated hit — because QUALCOMM monetizes the same customer twice, once as chip revenue through QCT and again as royalty through QTL, a single large customer’s decision or a single China policy action can strike both engines at once, defeating the apparent diversification of the two-segment structure. A concrete example: a further deterioration in U.S./China relations would simultaneously threaten chip sales into China (Risk 2), pressure the Chinese-licensee royalty base and complicate the Arm-dependent CPU roadmap and any regulatory approvals (Risk 3), and raise the Taiwan-supply tail (Risk 4). Separately, the vertical-integration and licensing risks reinforce each other on margin mix: as premium handset chip content erodes (Risk 1) and the higher-margin QTL base steps down (Risk 3), the revenue mix shifts toward lower-margin chipsets, so two revenue risks combine into a compounded margin risk. [Rating and price target withdrawn — see the note at the top.]
2.5 ESG & Regulatory Exposure
sources QUALCOMM’s material ESG and regulatory exposures are concentrated in governance-of-the-business-model and geopolitical-regulatory areas rather than in environmental liability, and — importantly for credibility — the accounting and controls hygiene is genuinely clean, which we state plainly rather than burying among the negatives.
[Rating and price target withdrawn — see the note at the top.] Trade and national-security regulation is a first-order revenue factor given the China concentration — tariffs, export-license revocations (as with Huawei) and entity-list actions have restricted, and could again restrict, transacting with Chinese customers and suppliers. [Rating and price target withdrawn — see the note at the top.] Acquisitions face multi-jurisdiction regulatory approval, with management specifically warning that strained U.S./China relations could impede required Chinese approvals — a live consideration for the pending Alphawave deal.
Environmental. Exposure is modest relative to an integrated manufacturer because the model is largely fabless, but not zero: the in-house RFFE and RF-filter fabrication facilities (in Germany, Singapore and China) carry environmental, health-and-safety and contamination liability and climate-regulation exposure, and management notes certain customers now require suppliers to meet sustainability/climate targets, so failure to meet those could cost business. The company references a long-term net-zero commitment with interim goals. This is a manageable, disclosed exposure rather than a value driver.
Social / human capital. The business depends on attracting and retaining specialized engineering talent in an intensely competitive market, with immigration constraints on recruiting foreign-national graduates cited as a specific pressure — a genuine key-input risk for an R&D-led company, though not an acute one.
Governance and accounting hygiene (the clean side, stated for balance). A risk section that lists only negatives is not credible, and here the positives are substantive and verified in the footnote review. The auditor (PricewaterhouseCoopers, engaged since 1985) issued unqualified opinions on both the financial statements and internal control, with no going-concern or emphasis-of-matter language, no restatement and no material weakness; the single critical audit matter is QCT product-revenue recognition, a matter of audit effort rather than a deficiency. Most notably, QTL’s sales-based royalty estimation — historically QUALCOMM’s most judgement-heavy accounting area — is unchanged in method and reconciles to actuals, with management stating no significant revenue reversals were required; that is a real positive in the one place investors have most reason to scrutinize. Beyond that, there is no goodwill impairment (QCT and QTL reporting-unit fair values are substantially above carrying value), no Level 3 recurring fair-value assets, no unconsolidated variable-interest entity, no defined-benefit pension, no related-party transactions disclosed in the statements (and no controlling shareholder), and no financial covenants on the notes with no near-term maturity wall. The one governance item worth continued attention — noted in Section 1 rather than as a risk here — is the combined CFO/COO role, which is an efficiency-versus-internal-check trade-off, not a defect.
Section 3 — Financial Analysis & Historical Performance
sources
Three-Statement Linkage Confirmation (complete before writing begins): - Net Income ties (Income Statement → Cash Flow Statement): Confirmed. The consolidated statement of cash flows begins from net income of $5,541.0M, identical to the bottom line of the income statement. The linkage is intact — and it is the linkage that carries the analytical point of the whole year, because the same net-income figure that fell sharply is the one from which operating cash flow of $14,012.0M is built up, the reconciliation adding back the large non-cash tax charge in between. - Cash ties (Balance Sheet → Cash Flow Statement): Confirmed. Cash and equivalents of $5,520.0M on the balance sheet is the ending unrestricted cash position reconciled on the cash-flow statement. Note that a further material tranche of cash sits outside this line, classified as restricted and legally ring-fenced to fund the pending Alphawave acquisition; headline “liquidity” therefore overstates freely-available cash, a point developed in 3.2B. - Retained Earnings reconciliation (Beg RE + NI - Dividends = End RE): Confirmed, once buyback charges to equity are included. Beginning retained earnings of $25,687.0M plus net income of $5,541.0M, less dividends of $3,805.0M and less the portion of the $8,791.0M of repurchases charged to retained earnings rather than paid-in capital, reconciles to ending retained earnings of $20,646.0M. Retained earnings fell despite a profitable year because capital returned to shareholders was charged against an equity base whose earnings inflow had been halved by the non-cash tax charge — a distortion, not a distribution the business could not support on a cash basis.
3.1A Income Statement
Source: QCOM FY2025 Form 10-K (fiscal year ended September 28, 2025) and prior-year 10-Ks; figures per the FL model. FY2022–FY2024 net income includes discontinued operations; FY2025 is continuing operations only. YoY growth rates, margins and effective tax rates are analyst-computed (underlined). Tier 1. See Appendix A.1–A.2.
CAGR Summary
| Metric | 3Y CAGR | 5Y CAGR | 10Y CAGR |
|---|---|---|---|
| Revenue | 0.1% | 13.5% | - |
| EBITDA | -7.5% | 12.8% | - |
| Net Income | -24.6% | 1.3% | - |
| Diluted EPS | -23.9% | 2.1% | - |
| FCF | 23.3% | 23.8% | - |
Source: Company SEC filings (10-K); figures per the FL model — see Appendix A.1–A.2. The 10Y CAGR column is blank across all metrics because no fiscal-2015 filing exists in the source set; the usable history begins in FY2016, so the 3Y and 5Y windows are the meaningful reference periods. The 3Y and 5Y CAGRs bridge the FY2022 cyclical peak, which depresses the 3Y figures and flatters nothing.
3.1B Income Statement — Analysis
sources The revenue story. FY2025 revenue of $44,284.0M was an all-time high, up 13.7% and edging past the prior FY2022 cyclical peak of $44,200.0M — but the two peaks were reached by different routes, and that distinction matters. FY2022’s 31.7% surge was a post-pandemic demand-and-restocking spike that reversed hard the following year (revenue fell -19.0% in FY2023 to $35,820.0M as the channel de-stocked). FY2025’s growth, by contrast, is content-led rather than volume-led: management attributes the QCT increase to higher revenue per chipset — better mix and pricing on premium-tier Android Snapdragon platforms — alongside contribution from IoT and automotive, while QTL licensing revenue was roughly flat. This is a higher-quality composition of growth than FY2022’s, but it is not evidence of a broad unit up-cycle, and the flat licensing line is doing more work than the headline suggests (see Major Movers). [Rating and price target withdrawn — see the note at the top.] The truth is between the two — a business whose top line has essentially round-tripped a cycle and is now re-testing its prior high on better mix, against the disclosed structural headwinds (Apple, Huawei) set out in Sections 1 and 2.
The margin trajectory. Operating profitability improved and the mechanics are clean. EBIT rose to $12,355.0M and the EBIT margin expanded to 27.9% from 25.8%, recovering most of the ground lost in the FY2023 down-cycle (21.7%) though still below the FY2022 peak of 35.9%. EBITDA of $13,957.0M grew 18.5%, a faster clip than revenue, confirming genuine operating leverage on the higher-content revenue base. The one soft spot is gross margin, which slipped to 55.4% from 56.2%. This is not a cost problem — it is a mix effect that management states plainly: a smaller proportion of total revenue came from the very-high-margin QTL licensing line, so the blend shifted toward the structurally lower-margin chipset business. That is the margin signature of the entire investment case: as chip revenue grows and the licensing toll stays flat (or steps down), the consolidated gross margin drifts lower even as absolute operating profit rises. The trend is structural, not cyclical, and it is the quiet cost of the diversification-into-silicon story.
Major Movers (five identified):
-
The non-cash deferred-tax valuation allowance — the dominant bottom-line mover, and non-operational (RED flag). This is the single most important item in the section and the reason every net-income-derived metric for FY2025 must be read as distorted. [Rating and price target withdrawn — see the note at the top.] The charge was booked in the fiscal fourth quarter to establish a valuation allowance against substantially all federal deferred tax assets, because management at the time expected QUALCOMM to be perpetually subject to the corporate alternative minimum tax under the One Big Beautiful Bill Act and therefore no longer expected to realize those assets. It was a one-off, non-cash accounting event that did not touch cash taxes or operations — and, as of this report’s date, it did not survive: after subsequent IRS guidance led QUALCOMM to conclude it no longer expects to be subject to the alternative minimum tax for the foreseeable future, the company released the entire allowance in fiscal 2026, booking an equal and opposite non-cash benefit. The FY2025 charge was therefore a round trip; it never permanently destroyed value. [Rating and price target withdrawn — see the note at the top.] That is a durable reduction in the cash flow available to shareholders, which no reversal offsets, and it is carried into the valuation. [Rating and price target withdrawn — see the note at the top.]
-
QCT content-led revenue growth (handsets, IoT, automotive) — the core operating driver. The rise in QCT revenue on higher revenue per chipset and premium-tier Android demand, supplemented by IoT and automotive, is what pushed the top line to a record and expanded operating margin. This is the operationally healthy part of the year. It is, however, partly cyclical (premium-handset demand and ASPs are demand-sensitive) and shadowed by the disclosed Apple modem in-sourcing that will erode the handset stream over the coming device cycles. Structural in the diversification vectors (auto/IoT); cyclical and headwind-exposed in handsets. §
-
Flat QTL licensing revenue — flattered by non-recurring items (YELLOW flag). Reported licensing was approximately flat, but that flatness absorbed the permanent loss of Huawei royalties (Huawei’s license expired in Q2 FY2025) only by being backfilled with lower-quality revenue: a one-time dispute-settlement amount reported as unallocated (excluded from QTL segment results), a step-up in revenue recognized from previously satisfied performance obligations (prior-period royalty true-ups), and newly signed/renewed licenses with two key Chinese OEMs and Transsion. [Rating and price target withdrawn — see the note at the top.] Because segment profit here is measured as EBT (QUALCOMM’s management measure), and because QTL is the highest-margin engine, the analytically correct view nets these one-offs out. The Huawei step-down is permanent (structural); the backfill items are temporary.
-
Gross-margin mix compression. As quantified above, the drift from 56.2% to 55.4% is a direct consequence of the revenue mix tilting away from licensing toward chipsets. This is a recurring, structural feature that will persist as long as chip revenue out-grows the royalty base.
-
Buyback-driven share-count reduction. Diluted shares fell to 1,105M from 1,130M as repurchases more than doubled to $8,791.0M. In a normal year this alone would have lifted EPS; this year it only partially cushioned the tax-driven collapse, with diluted EPS of $5.01 down -44.1%. The buyback is a genuine per-share tailwind masked by the tax event, and is examined against free cash flow in 3.3B. Structural (ongoing program), though the FY2025 pace is elevated.
Quality of earnings. The reported earnings line is low-quality this year only, and for a fully-disclosed, non-cash reason. [Rating and price target withdrawn — see the note at the top.] QUALCOMM’s tax line is episodically dominated by discrete legislative events, and any multi-year net-income or EPS comparison must account for them. [Rating and price target withdrawn — see the note at the top.] On the revenue-recognition side, by contrast, the news is reassuring: QTL’s judgement-heavy sales-based royalty estimation is unchanged in method and reconciles to actuals with no significant reversals — the accounting is clean where investors have most reason to look.
⚠ Items to Watch. - Gross margin below 55.7% (the recent down-cycle low) would signal that chipset mix-dilution is running ahead of QTL’s ability to hold the blend, and would require re-checking the operating-leverage assumption. - EBIT margin below 21.7% would reverse the two-year recovery in operating profitability and reopen the question of whether the content-per-device gains are durable. - Near-term revenue momentum. The multi-year revenue path is capped by the disclosed Apple and Huawei step-downs; the first place their bite will show is in year-on-year quarterly revenue, where momentum has been fading through the FY2026 interim periods. This is the single most important thing to monitor for evidence the cliffs are becoming realized declines rather than disclosed risks; the quarter-by-quarter detail is analyzed in Section 7. [Rating and price target withdrawn — see the note at the top.]
3.2A Balance Sheet
Source: QCOM FY2025 Form 10-K and prior-year 10-Ks; figures per the FL model. Net debt, leverage ratios, current ratio and book value per share are analyst-computed (underlined). Tier 1. See Appendix A.1–A.2.
3.2B Balance Sheet — Analysis
sources Asset composition. This is a cash-generative, intangible-heavy, capital-light balance sheet — exactly what the fabless-plus-licensing model should produce. PP&E of $4,690.0M is small relative to a $50,143.0M asset base, while goodwill and intangibles of $11,358.0M reflect the acquisitive build-out of the diversification strategy; management’s Q4 impairment test found QCT and QTL reporting-unit fair values substantially above carrying value, so there is no impairment overhang on that goodwill. The single most consequential balance-sheet movement of the year is that total assets shrank, from $55,154.0M to $50,143.0M — and the shrinkage is the asset-side mirror of the same non-cash tax event that hit the income statement. Establishing the valuation allowance removed the bulk of the federal deferred tax assets from the balance sheet; the contraction is an accounting write-down of a tax asset, not an erosion of operating capacity. Alongside it, unrestricted cash fell to $5,520.0M from $7,849.0M as the company funded doubled buybacks and ring-fenced a material tranche of restricted cash for the pending Alphawave deal (that restricted balance is not included in the $5,520.0M line above and should be treated as unavailable for net-cash or deployment purposes). Shareholders’ equity fell to $21,206.0M from $26,274.0M — again a function of buybacks charged to equity and the tax-depressed retained-earnings inflow, not of value destruction — pulling book value per share down to $19.19 from $23.25.
Leverage trajectory. Leverage is low, investment-grade and comfortably within management’s capacity to keep returning cash. Total debt of $14,811.0M is essentially flat year-over-year (the company repaid maturing notes and issued a similar amount), and short-term debt is $0.0M — there is no near-term maturity wall, with nothing due in FY2026. Net debt rose to $9,291.0M from $6,785.0M, but that increase is a cash-deployment story (buybacks plus restricted-cash carve-out), not new borrowing. Net debt/EBITDA of 0.7x and debt/equity of 0.7x sit at the low end of the historical range; the notes carry no financial covenants, and the undrawn revolving facility and commercial-paper program provide ample backstop. There is no covenant concern in the forensic memo. The one nuance is that the restricted-cash carve-out means the freely-available net cash position is weaker than the reported net-debt figure implies — relevant when judging how much buyback firepower remains against the Alphawave commitment.
Working capital. The cash conversion cycle is tightening, and healthily so. The cycle fell to 104 days from 123 days the prior year and 126 days in FY2023 — a two-year improvement driven almost entirely by inventory. Inventory of $6,526.0M is essentially flat against revenue that grew 13.7%, so days of inventory fell to 120 days from a FY2023 peak of 147 days: the bloated inventory built during the FY2022–FY2023 down-cycle has been worked down without a write-off problem (management reports the net inventory-reserve estimate change was an immaterial share of cost of revenues). Receivables of $4,315.0M grew more slowly than revenue, with days-sales-outstanding steady at 34 days — there is no receivables build outpacing revenue, which is the classic channel-stuffing / aggressive-recognition trigger, and it is absent here. This is a clean, improving working-capital picture and a genuine, if modest, source of the year’s strong cash generation.
⚠ Items to Watch. - A rise in net leverage toward the FY2020 level of 1.2x — the recent-history high — while buybacks run at the elevated FY2025 pace and a material tranche of cash stays restricted, would be the first sign the capital-return program is being funded by the balance sheet rather than by free cash flow. - A reversal in the cash conversion cycle back toward 126 days (a renewed inventory build, most likely from a demand air-pocket against committed wafer purchases) would both consume cash and signal softening end-demand — the more so given the large multi-year wafer purchase commitment disclosed in the footnotes, most of it due within twelve months. - Depletion of unrestricted cash below a prudent operating minimum as the Alphawave close approaches would constrain buyback flexibility.
3.3A Cash Flow Statement
| FY2021 | FY2022 | FY2023 | FY2024 | FY2025 | |
|---|---|---|---|---|---|
| Cash from Operations ($M) | $10,536.0M | $9,096.0M | $11,299.0M | $12,202.0M | $14,012.0M |
| — Depreciation & Amortization ($M) | $1,582.0M | $1,762.0M | $1,809.0M | $1,706.0M | $1,602.0M |
| Capital Expenditures ($M) | $1,888.0M | $2,262.0M | $1,450.0M | $1,041.0M | $1,192.0M |
| Free Cash Flow ($M) | $8,648.0M | $6,834.0M | $9,849.0M | $11,161.0M | $12,820.0M |
| FCF Margin | 25.8% | 15.5% | 27.5% | 28.6% | 28.9% |
| FCF / Share | $7.53 | $6.01 | $8.75 | $9.88 | $11.60 |
| FCF Conversion (FCF/NI) | 95.6% | 52.8% | 136.2% | 110.0% | 231.4% |
| CapEx / Revenue | 5.6% | 5.1% | 4.0% | 2.7% | 2.7% |
| CapEx / D&A | 1.2x | 1.3x | 0.8x | 0.6x | 0.7x |
| Dividends Paid ($M) | $3,008.0M | $3,212.0M | $3,462.0M | $3,687.0M | $3,805.0M |
| Share Repurchases ($M) | $3,366.0M | $3,129.0M | $2,973.0M | $4,121.0M | $8,791.0M |
Source: QCOM FY2025 Form 10-K and prior-year 10-Ks; figures per the FL model. Free cash flow, FCF margin, FCF/share, FCF conversion and CapEx ratios are analyst-computed (underlined). Tier 1. See Appendix A.1–A.2.
3.3B Cash Flow — Analysis
sources Quality of operating cash flow — and a caution the year demands. Operating cash flow rose to $14,012.0M from $12,202.0M, and free cash flow to $12,820.0M from $11,161.0M, at an FCF margin of 28.9% — a genuinely strong cash year that is the truest reflection of the business’s FY2025 performance, precisely because cash flow is immune to the tax accounting that distorted the income statement. This is where the year’s headline metric becomes a trap. FCF conversion (FCF/net income) reads 231.4% for FY2025 — a startling jump from 110.0% — and it would be a serious analytical error to present that as improving earnings quality. It is not. The ratio is inflated purely because its denominator, net income, was halved by the non-cash tax charge while its numerator, cash flow, was unaffected (the charge is added back on the cash-flow statement). Normalize net income for the charge and conversion falls back toward the 110.0% level recorded in FY2024 — high-quality, but not the outlier the headline implies. The correct reading is that OCF and FCF rose modestly and cleanly; the conversion ratio this year is an artifact, not a signal. The warning cuts both ways: fiscal 2026’s reported net income is inflated by the non-cash release of the very same allowance, so the identical FCF-conversion ratio will read artificially low next year — misleading in the opposite direction. In neither year is the ratio a clean read on earnings quality without first normalizing net income for the non-cash tax swing. Underlying cash quality is corroborated by the working-capital tightening in 3.2B and by a five-year FCF CAGR of 23.8%.
CapEx analysis. Investment intensity is low and falling, consistent with the fabless model. Capital expenditure of $1,192.0M is just 2.7% of revenue, and CapEx/D&A of 0.7x sits below 1.0x — the company is spending less on physical assets than it is depreciating, the signature of a harvest-mode, capital-light operation rather than underinvestment. That is appropriate here: QUALCOMM’s real growth investment is not property and equipment but the $9,042.0M of R&D it expensed through the income statement (roughly a fifth of revenue) and its acquisitions. The CapEx/D&A ratio last exceeded 1.0x in the FY2021–FY2022 build; the pullback since is deliberate. Management has guided that CapEx will rise modestly to support in-house testing of its integrated circuits — incremental tooling, not a pivot to owning fabs — so a step-up toward the FY2022 intensity of 5.1% would be worth noting but not alarming.
Capital-allocation waterfall. Over the five years shown, QUALCOMM has consumed the large majority of its free cash flow on shareholder returns rather than reinvestment, and in FY2025 it leaned in hard. The year’s $3,805.0M of dividends plus $8,791.0M of repurchases — the buyback more than doubling from $4,121.0M — together exceeded GAAP net income. That optic is, once again, an artifact of the tax charge: measured against free cash flow of $12,820.0M, the combined return was covered. So this is not a solvency question; it is a prioritization question. Returning the bulk of FCF to owners is a rational allocation for a business whose internal growth is R&D- and M&A-funded and whose end-markets are maturing — but the pace of the FY2025 buyback is aggressive against two disclosed structural revenue cliffs (Apple, Huawei) and a pending acquisition that has already required a material tranche of cash to be restricted. The waterfall mix (heavy buyback, steady dividend growth to $3.44 per share, minimal CapEx) fits the opportunity set; the open question, taken up in the separate valuation, is whether management sustains that buyback tempo if QCT revenue softens.
⚠ Items to Watch. - FCF conversion normalization. Expect the FY2025 headline of 231.4% to fall back toward the 110.0% range once the tax charge annualizes out of the base; that normalization is not a deterioration and should not be read as one. - The FY2026 cash-tax tailwind. The same legislation that drove the charge restores immediate expensing of domestic R&D from FY2026, which management expects to lower cash taxes — a direct, near-certain uplift to next year’s free cash flow. If it fails to show up in lower cash taxes paid, that is a genuine negative surprise. - Buyback pace versus FCF. Repurchases sustained above free cash flow, while restricted cash is committed to Alphawave, would mean returns are being funded from the balance sheet — the trigger to reassess capital-return capacity.
3.4 Returns Analysis
| FY2021 | FY2022 | FY2023 | FY2024 | FY2025 | |
|---|---|---|---|---|---|
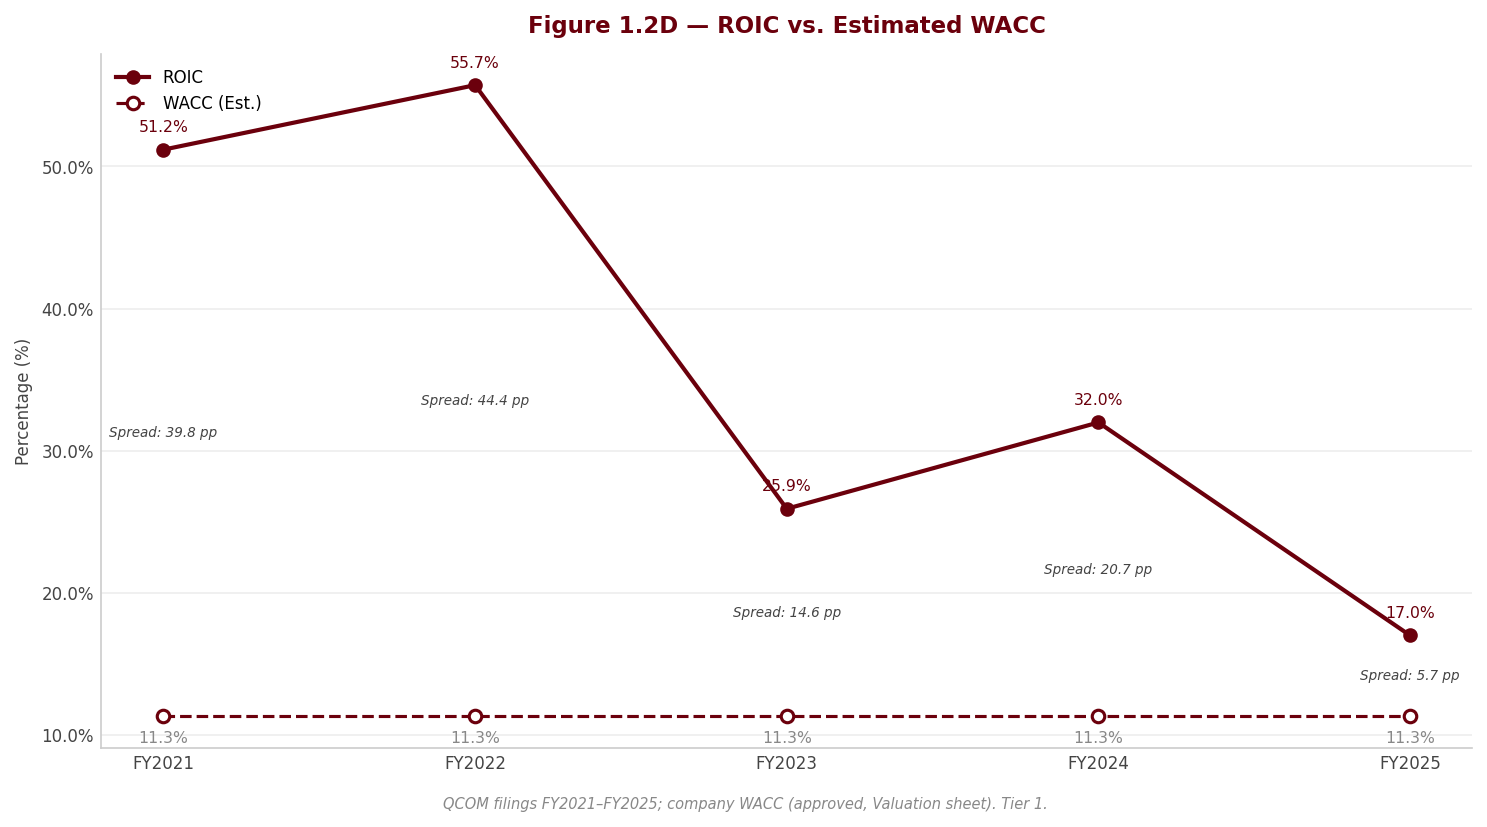
| ROIC | 51.2% | 55.7% | 25.9% | 32.0% | 17.0% |
| ROE | 112.8% | 92.5% | 36.5% | 42.4% | 23.3% |
| ROA | 23.5% | 28.7% | 14.5% | 19.1% | 10.5% |
| Interest Coverage | 17.5x | 32.4x | 11.2x | 14.4x | 18.6x |
Source: Company SEC filings (10-K); figures per the FL model — all returns metrics are analyst-computed (underlined). Tier 1. See Appendix A.1–A.2.
ROIC versus the cost of capital. ROIC is the metric that matters most for a business like this, and it is also — this year — the metric most contaminated by the tax charge, so it must be read with care. [Rating and price target withdrawn — see the note at the top.] The honest statement is: FY2025 reported ROIC is distorted low; the durable spread of returns over WACC is intact, and it is that normalized spread — not the 17.0% optic — that the valuation relies on. Interest coverage tells the undistorted operating truth, because it is built on EBIT rather than net income: coverage of 18.6x (up from 14.4x) confirms operating profit rose and that debt service is a trivial claim on it. ROE of 23.3% and ROA of 10.5% are likewise depressed by the tax charge (ROE additionally by the buyback-shrunk equity base) and carry the same caveat — read them as distorted, not as evidence of a weaker franchise. The mirror-image caveat applies prospectively: because the allowance was released in fiscal 2026, that year’s net-income-derived returns — ROE, ROA, ROIC and net margin alike — will be flattered by the non-cash benefit, exactly as FY2025’s were depressed. Both years’ bottom-line returns are tax-distorted in opposite directions; only the pre-tax and operating measures (EBIT margin, interest coverage, EBITDA) read cleanly across the two.
DuPont decomposition. The decomposition isolates the distortion with unusual clarity. FY2025 ROE of 23.3% resolves into net margin of 12.5%, asset turnover of 0.84x, and an equity multiplier of 2.22x. Two of the three components actually improved or held: asset turnover rose to 0.84x from 0.73x (better revenue productivity on a tax-shrunk asset base), and the equity multiplier was essentially flat at 2.22x versus 2.22x — so leverage did not drive the ROE change. The entire decline in ROE runs through the net-margin leg, which collapsed to 12.5% from 26.0% — and that collapse is, once again, the tax charge and nothing else. [Rating and price target withdrawn — see the note at the top.] Strip the tax event and ROE returns toward the 42.4% level of FY2024.
3.5 Altman Z-Score (Most Recent FY)
| Component | FY2023 | FY2024 | FY2025 |
|---|---|---|---|
| X1 (Working Capital / Total Assets) | 0.251 | 0.267 | 0.331 |
| X2 (Retained Earnings / Total Assets) | 0.406 | 0.466 | 0.412 |
| X3 (EBIT / Total Assets) | 0.153 | 0.183 | 0.246 |
| X4 (Equity / Total Liabilities) | 0.733 | 0.910 | 0.733 |
| X5 (Revenue / Total Assets) | 0.702 | 0.706 | 0.883 |
| Z-Score | 2.01 | 2.24 | 2.54 |
| Zone | Gray | Gray | Gray |
Source: Company SEC filings (10-K); figures per the FL model — Z-Score and components are analyst-computed (underlined). Tier 1. See Appendix A.1–A.2.
Interpretation. The Z-Score has trended steadily upward — 2.01 in FY2023, 2.24 in FY2024, 2.54 in FY2025 — and is improving within the Z′ model’s gray band (1.23–2.90) toward its 2.90 safe threshold. The improvement is telling on two counts. First, it is driven by the operationally sound components: X1 (working capital rose as the cash-conversion cycle tightened and current liabilities fell), X3 (EBIT/assets rose as operating profit grew against a tax-shrunk asset base) and X5 (revenue/assets improved on the record top line). Second — and this is the point that matters for reading it — the Z-Score is built on EBIT and revenue, not net income, so the year’s tax charge, which battered every net-income-derived ratio in 3.4, barely touches it. The Z-Score is thus a cleaner read on solvency than the reported ROE or ROA, and it corroborates the credit picture from the balance sheet: low leverage, no covenant issues, no near-term maturities, an investment-grade profile with improving distance from distress. The one component that dipped, X2 (retained earnings/assets), fell only because buybacks were charged to retained earnings — the same cosmetic equity effect discussed throughout, not a solvency signal. Credit risk is low and improving; nothing in the Z-Score trend argues otherwise.
4. Valuation withdrawn
This section stated what the shares were worth and what to do about them. It rested on an exit multiple set by hand — across the coverage it averaged 24% below where each company actually traded — so the conclusion largely restated that assumption instead of testing it. Rather than leave it standing, it has been withdrawn while the method is rebuilt.
Nothing else in this report depends on it: the financial analysis above and below is drawn from the company's own filings, and every figure links to the page it was verified against.
Section 5 — Financial Metrics & Peer Benchmarking
sources
5.1 Peer Selection
sources The peer set is built to triangulate QUALCOMM from three directions rather than to flatter it. Broadcom Inc. (AVGO) is the scale comparator — the largest diversified US semiconductor franchise and the reference point for how the market is currently pricing chip-plus-software cash flows. MediaTek Inc. (2454.TW) is the direct product rival in premium and mid-tier handset application processors and modems, and the single peer whose competitive pressure is most visible in QUALCOMM’s own QCT numbers. NXP Semiconductors N.V. (NXPI) is the best proxy for the automotive and industrial/IoT diversification that Section 1 identified as QUALCOMM’s durable growth vector. Skyworks Solutions, Inc. (SWKS) is the closest structural mirror — a fabless RF/analog supplier with heavy exposure to a single dominant smartphone customer, i.e. precisely the concentration risk QUALCOMM carries.
The set is deliberately imperfect, and the imperfections must be stated up front because they govern how every table below should be read. Three of the four (AVGO, NXPI, SWKS) report under US GAAP and are cleanly comparable in accounting basis; MediaTek Inc. reports under IFRS in New Taiwan dollars with a December year-end and is therefore a directional comparator only. On business model, none of the four carries an equivalent to QUALCOMM’s QTL technology-licensing segment, so QUALCOMM’s blended margins and returns are structurally higher than a pure-chip read would suggest — a genuine advantage, not an accounting quirk, but one that makes like-for-like operating comparison against NXPI and SWKS impossible without adjustment. [Rating and price target withdrawn — see the note at the top.] The valid comparisons in this section are cash-flow generation, leverage, working-capital efficiency and — with the caveats spelled out in 5.7 — relative valuation; the invalid one is any naive ranking on GAAP net margin, P/E or ROIC without the normalizations discussed below.
| Peer | Ticker | Exchange | Filing Type | Accounting Standard | Fiscal Year End | Comparability Note |
|---|---|---|---|---|---|---|
| Broadcom Inc. | AVGO | NASDAQ | 10-K | US GAAP | November | [Rating and price target withdrawn — see the note at the top.] |
| MediaTek Inc. | 2454.TW | Taiwan Stock Exchange | Consolidated FS (IFRS) | IFRS | December | IFRS, TWD-reported, Dec year-end — directional only; large net-cash base inflates returns |
| NXP Semiconductors N.V. | NXPI | NASDAQ | 10-K | US GAAP | December | Cleanest operating comparator; Dec year-end ~3 months after QCOM |
| Skyworks Solutions, Inc. | SWKS | NASDAQ | 10-K | US GAAP | October | Closest structural mirror (single-customer RF); fiscal period aligns to within ~1 week |
Source: Peer-company SEC filings; comparability notes in 5.7 — see Appendix A.1.
5.2 Profitability Comparison
sources Comparative: Most Recent Full Fiscal Year
| Metric | QUALCOMM Incorporated | Broadcom Inc. | MediaTek Inc. | NXP Semiconductors N.V. | Skyworks Solutions, Inc. |
|---|---|---|---|---|---|
| Revenue ($M) | $44,284.0M | $63,887.0M | $19,122.0Mᶠ | $12,269.0M | $4,086.9M |
| Gross Margin | 55.4% | 67.8% | 47.5%ᶠ | 54.7% | 41.2% |
| EBITDA Margin | 31.5% | 53.6% | 21.2%ᶠ | 31.6% | 23.6% |
| EBIT Margin | 27.9% | 39.9% | 17.4%ᶠ | 24.8% | 12.2% |
| Net Margin | 12.5% | 36.2% | 17.7%ᶠ | 16.5% | 11.7% |
| FCF Margin | 28.9% | 42.1% | 24.8%ᶠ | 19.7% | 27.1% |
Source: Peer-company SEC filings; comparability notes in 5.7 — see Appendix A.1.
Flag legend: ᶠ = IFRS-translated (directional only); ᵐ = market-sourced; ᶜ = computed from filing components. Flags per peer are resolved from the IFRS_TRANSLATED / MARKET_SOURCED class of cells in the Peers sheet — see data pack.
The single most important line in this table is QUALCOMM’s net margin, and it is the one line the reader must not take at face value. [Rating and price target withdrawn — see the note at the top.] Strip that discrete charge out and QUALCOMM’s normalized net margin approximately doubles, lifting it clear of NXPI (16.5%), SWKS (11.7%) and MediaTek’s translated 17.7%ᶠ, and leaving only Broadcom’s 36.2% — itself flattered by a current-year income-tax benefit — ahead of it. On a normalized basis QUALCOMM leads the peer set on net margin apart from Broadcom — a completely different competitive picture from the depressed GAAP optic. None of the four peers carries an equivalent FY2025 charge. That this charge was fully reversed in the second quarter of FY2026 — after a change in the corporate-alternative-minimum-tax (CAMT) treatment of previously capitalized domestic R&D led QUALCOMM to conclude it no longer expects to be subject to the CAMT and to release the entire allowance — confirms that normalizing it out is the correct treatment for peer comparison, not a generous adjustment: the item was, as classified, a discrete non-cash charge that has since unwound. Every net-margin, ROE, ROA, ROIC and P/E comparison in this section is therefore presented on the reported basis for traceability, but must be read on the normalized basis for judgment; the reported net-income ranking is an accounting artifact, not an economic one.
The gross, EBITDA and EBIT lines are cleaner, and they tell the structural story. QUALCOMM’s gross margin of 55.4% and EBIT margin of 27.9% sit comfortably above the pure-chip peers NXPI (24.8%) and SWKS (12.2%), and that premium is real but it is not primarily an efficiency story — it is the QTL licensing segment, whose IP royalties carry very high, almost-fully-incremental margins that no pure-chip peer can replicate, structurally lifting the consolidated blend. AVGO’s still-higher headline margins are a separate case entirely: its EBIT margin of 39.9% is depressed by a very large charge for acquisition-related intangible amortization (VMware and prior deals), while its EBITDA margin of 53.6% is correspondingly inflated once that amortization is added back — so AVGO’s unusually wide EBIT-to-EBITDA gap is an artifact of acquisition accounting and is not comparable to QUALCOMM’s. MediaTek’s margins, all flagged ᶠ, are lower on every line and reflect its more product-weighted, IFRS-reported, TWD-translated mix — directional only.
Historical: QUALCOMM Incorporated Own 5-Year Progression
| Metric | FY2021 | FY2022 | FY2023 | FY2024 | FY2025 |
|---|---|---|---|---|---|
| Gross Margin | 57.5% | 57.8% | 55.7% | 56.2% | 55.4% |
| EBITDA Margin | 33.9% | 39.9% | 26.8% | 30.2% | 31.5% |
| EBIT Margin | 29.2% | 35.9% | 21.7% | 25.8% | 27.9% |
| Net Margin | 26.9% | 29.3% | 20.2% | 26.0% | 12.5% |
| FCF Margin | 25.8% | 15.5% | 27.5% | 28.6% | 28.9% |
Source: Peer-company SEC filings; comparability notes in 5.7 — see Appendix A.1.
QUALCOMM’s own history confirms that the FY2025 net-margin collapse is an outlier, not a trend. Gross and EBIT margins have held in a stable band across the five years, and FCF margin has if anything strengthened to 28.9% — consistent with the Section 3 finding that cash generation improved in FY2025 even as GAAP net income fell. The net-margin line is the only one that breaks from its own history, and it breaks for the tax reason above, not for any operating one. Read against its own record, QUALCOMM’s underlying profitability in FY2025 is in line with or better than its recent norm; only the tax-distorted bottom line says otherwise.
5.3 Returns Comparison
sources Comparative: Most Recent Full Fiscal Year
| Metric | QUALCOMM Incorporated | Broadcom Inc. | MediaTek Inc. | NXP Semiconductors N.V. | Skyworks Solutions, Inc. |
|---|---|---|---|---|---|
| ROIC | 17.0% | 19.9% | 51.8%ᶠ | 12.9% | 8.1% |
| ROE | 23.3% | 31.0% | 26.4%ᶠ | 21.0% | 7.9% |
| ROA | 10.5% | 13.7% | 14.6%ᶠ | 7.9% | 5.9% |
| Asset Turnover | 0.88x | 0.38x | 0.83xᶠ | 0.48x | 0.50x |
Source: Peer-company SEC filings; comparability notes in 5.7 — see Appendix A.1.
Historical: QUALCOMM Incorporated Own 5-Year Progression
| Metric | FY2021 | FY2022 | FY2023 | FY2024 | FY2025 |
|---|---|---|---|---|---|
| ROIC | 51.2% | 55.7% | 25.9% | 32.0% | 17.0% |
| ROE | 112.8% | 92.5% | 36.5% | 42.4% | 23.3% |
| ROA | 23.5% | 28.7% | 14.5% | 19.1% | 10.5% |
Source: Peer-company SEC filings; comparability notes in 5.7 — see Appendix A.1.
The same tax distortion that depressed net margin flows straight through the returns table, because ROIC, ROE and ROA all sit on the same after-tax numerator. QUALCOMM’s FY2025 ROIC of 17.0% and ROE of 23.3% look pedestrian relative to their own five-year history — where ROIC ran far higher — but that step-down is the deferred-tax charge, not a deterioration in the business earning power. [Rating and price target withdrawn — see the note at the top.] Even on the depressed reported basis, QUALCOMM still clears its 11.34% cost of capital with room to spare, which is the finding that matters for value creation: this is a business earning above its WACC through a genuinely bad-optics year.
Two peer readings need care. MediaTek’s ROIC of 51.8%ᶠ is the highest in the table by a wide margin, but it is structurally overstated: MediaTek runs a very large net-cash and financial-asset balance, which shrinks its invested-capital base and mechanically inflates the ratio — and it is IFRS-basis, TWD-translated, Dec-year-end, so it should be treated as directional, not as evidence that MediaTek out-earns QUALCOMM on operating capital. AVGO’s ROIC of 19.9% is dragged the other way by an outsized goodwill and intangibles balance carried on its books from the VMware and prior deals, so its invested-capital base is inflated and its return understated relative to underlying cash economics. QUALCOMM’s asset turnover of 0.88x is the highest of the US-GAAP peers — well above AVGO’s 0.38x and NXPI’s 0.48x — reflecting an asset-light, fabless model uncluttered by acquisition goodwill; that is a real and favorable structural difference.
5.4 Leverage & Liquidity Comparison
sources Comparative: Most Recent Full Fiscal Year
| Metric | QUALCOMM Incorporated | Broadcom Inc. | MediaTek Inc. | NXP Semiconductors N.V. | Skyworks Solutions, Inc. |
|---|---|---|---|---|---|
| Net Debt / EBITDA | 0.7x | 1.4x | -1.8xᶠ | 2.3x | -0.2x |
| Total Debt / Equity | 0.7x | 0.8x | 0.0xᶠ | 1.2x | 0.2x |
| Interest Coverage | 18.6x | 7.9x | 158.7xᶠ | 6.5x | 18.4x |
| Current Ratio | 2.8x | 1.7x | 1.3xᶠ | 2.0x | 2.3x |
| FCF Margin | 28.9% | 42.1% | 24.8%ᶠ | 19.7% | 27.1% |
Source: Peer-company SEC filings; comparability notes in 5.7 — see Appendix A.1.
Leverage is the cleanest comparison in the section, and it places QUALCOMM in a conservative, well-defended position. At 0.7x net debt to EBITDA and interest coverage of 18.6x, QUALCOMM sits between the two net-cash peers (SWKS at -0.2x and MediaTek, in a net-cash position at -1.8xᶠ) and the two more-levered names — AVGO at 1.4x, whose balance sheet still carries the VMware acquisition debt, and NXPI at 2.3x, the most levered of the group. [Rating and price target withdrawn — see the note at the top.] Its coverage of 18.6x comfortably exceeds AVGO’s 7.9x and NXPI’s 6.5x; MediaTek’s coverage of 158.7xᶠ is a near-meaningless artifact of its almost-zero borrowings and should be read as “no leverage” rather than as a precise figure. The current ratio of 2.8x is the strongest of the group, confirming ample liquidity. The one honest critique here is the mirror of the strength: with FCF margin of 28.9% and leverage this low, QUALCOMM’s balance sheet is arguably under-worked relative to its cash-generating capacity — financial flexibility bought at the cost of a possibly sub-optimal capital structure.
5.5 Valuation Multiples Comparison
sources Comparative: Current Price
| Metric | QUALCOMM Incorporated | Broadcom Inc. | MediaTek Inc. | NXP Semiconductors N.V. | Skyworks Solutions, Inc. |
|---|---|---|---|---|---|
| EV/EBITDA | 12.9xᵐ | 55.7xᵐ | 42.8xᵐᶠ | 17.9xᵐ | 9.7xᵐ |
| P/E | 32.5xᵐ | 80.3xᵐ | 53.5xᵐᶠ | 29.6xᵐ | 20.0xᵐ |
| FCF Yield | 7.5%ᵐ | 1.4%ᵐ | 2.6%ᵐᶠ | 4.0%ᵐ | 11.6%ᵐ |
Source: Peer-company SEC filings; comparability notes in 5.7 — see Appendix A.1.
All peer valuation multiples are market-sourced. Subject to change with price movements.
Note: QUALCOMM’s current EV/EBITDA and FCF yield above are computed on the FY2025 weighted-average diluted share count — consistent with the reported per-share statistics used elsewhere in Sections 3 and 5 — whereas the market capitalisation and the four valuation methods in the separate valuation use the current shares outstanding, so the two bases differ slightly by construction.
Historical: QUALCOMM Incorporated EV/EBITDA (period-end price)
| FY2021 | FY2022 | FY2023 | FY2024 | FY2025 |
|---|---|---|---|---|
| 13.8x | 8.0x | 13.8x | 16.9x | 13.8x |
Source: Peer-company SEC filings; comparability notes in 5.7 — see Appendix A.1.
On the multiples, QUALCOMM screens inexpensive against this peer set — and this is where the section’s central tension must be stated plainly rather than smoothed. On EV/EBITDA — the cleanest of the three because it strips out both QUALCOMM’s tax charge and differences in capital structure — QUALCOMM trades at 12.9xᵐ, below NXPI (17.9xᵐ) and a fraction of AVGO (55.7xᵐ) and MediaTek (42.8xᵐᶠ), and cheaper only than SWKS (9.7xᵐ), the lowest-quality peer. The headline P/E of 32.5xᵐ looks unremarkable — but it is computed on the tax-charge-depressed GAAP earnings, so it materially overstates how expensive QUALCOMM actually is; normalize for the deferred-tax charge and the P/E approximately halves, dropping QUALCOMM to the clear low end of the group, well beneath AVGO’s 80.3xᵐ and MediaTek’s 53.5xᵐᶠ. [Rating and price target withdrawn — see the note at the top.] QUALCOMM’s FCF yield of 7.5%ᵐ is among the highest of the quality names in the set, well above AVGO (1.4%ᵐ) and MediaTek (2.6%ᵐᶠ).
So the relative-value screen says cheap. [Rating and price target withdrawn — see the note at the top.] The answer is methodological, and it is the honest core of this section. The multiple-based composite is calibrated on where these companies trade today: every peer multiple in the table is a market-sourced snapshot, so a peer-relative conclusion is partly circular — it can only ever tell you QUALCOMM is cheap relative to the current prices of other semiconductors, which themselves embed the same cycle-peak optimism and, in AVGO’s case, an AI premium. If the whole complex is richly priced, “cheap versus the complex” is not the same as “cheap versus intrinsic value.” The discounted cash flow in the separate valuation is the one method in this report that is not anchored to current trading levels — it is built from QUALCOMM’s own disclosed structural headwinds (the Apple modem in-sourcing and the expired Huawei licence) discounted at a beta-driven WACC — and it lands below the current price across the entire reasonable range of assumptions. [Rating and price target withdrawn — see the note at the top.] QUALCOMM’s own EV/EBITDA history reinforces the point: at 13.8x it is not at a stretched level versus its five-year record, so the multiple is not screaming overvaluation — but a multiple that is merely in line with its own history is not, on its own, a reason to own a business whose intrinsic-value estimate sits below the market price.
5.6 Efficiency Comparison
| Metric | QUALCOMM Incorporated | Broadcom Inc. | MediaTek Inc. | NXP Semiconductors N.V. | Skyworks Solutions, Inc. |
|---|---|---|---|---|---|
| Days Sales Outstanding | 34 days | 33 days | 32 daysᶠ | 31 days | 49 days |
| Days Inventory Outstanding | 120 days | 36 days | 73 daysᶠ | 162 days | 117 days |
| Days Payables Outstanding | 50 days | 29 days | 50 daysᶠ | 66 days | 31 days |
| Cash Conversion Cycle | 104 days | 40 days | 56 daysᶠ | 127 days | 135 days |
| CapEx / Revenue | 2.7% | 1.0% | 2.5%ᶠ | 3.2% | 4.8% |
Source: Peer-company SEC filings; comparability notes in 5.7 — see Appendix A.1.
On collection and payment discipline QUALCOMM is unremarkable and in line with the group — DSO of 34 days sits right alongside AVGO, MediaTek and NXPI, and payables of 50 days are middle-of-the-pack. The distinguishing line is inventory: QUALCOMM’s DIO of 120 days and cash conversion cycle of 104 days are elevated versus AVGO (40 days) but sit below both NXPI (127 days) and SWKS (135 days) — the two inventory-heavy analog/RF and automotive/industrial names, which carry the highest conversion cycles in the group. This is not a working-capital red flag — it is end-market mix. NXPI’s very high inventory reflects its automotive and industrial exposure, where long-lifecycle parts and supply-assurance commitments demand more stock; SWKS carries the set’s longest cycle on its RF/analog inventory and its higher DSO (49 days) into a concentrated customer base; QUALCOMM’s own inventory build, discussed in Section 3, reflects the same forces as it diversifies into automotive and IoT. AVGO’s low cycle reflects its software-and-infrastructure weighting rather than superior discipline. QUALCOMM’s CapEx intensity of 2.7% is modest and consistent with the fabless model, marginally above AVGO’s 1.0%, below NXPI’s 3.2% and well below SWKS’s 4.8% — capital-light, as the asset-turnover advantage in 5.3 already implied.
5.7 Comparability Caveats
sources The tables above are only as honest as the caveats attached to them. Five material issues govern how this peer comparison should be read, and each has been reflected in the commentary rather than buried here.
[Rating and price target withdrawn — see the note at the top.] No peer carries an equivalent FY2025 charge. In the second quarter of FY2026 an IRS notice permitted the CAMT base to be reduced by certain previously capitalized domestic R&D, QUALCOMM concluded it no longer expects to be subject to the CAMT in the foreseeable future, and it released the entire allowance, booking a benefit that offsets the original charge. The establishment and prompt reversal confirm the item was genuinely discrete: QUALCOMM’s reported FY2025 net margin, ROE, ROA, ROIC and P/E all understate its underlying economics, and on a normalized (ex-charge) basis net margin approximately doubles and the P/E approximately halves, moving QUALCOMM from a distorted mid-pack optic to genuinely inexpensive on earnings. This is the single most important adjustment in the section — QUALCOMM must not be ranked on FY2025 GAAP net income.
[Rating and price target withdrawn — see the note at the top.] The consequence is directional and important: QUALCOMM’s past superiority on after-tax metrics flatters what it can deliver going forward, so a reader who benchmarks QUALCOMM on its historical net-margin or ROE premium will overstate its sustainable edge. [Rating and price target withdrawn — see the note at the top.]
QUALCOMM’s QTL licensing segment structurally lifts its margins and returns (affects Gross/EBIT/EBITDA Margin, ROIC). QUALCOMM earns a stream of technology-licensing royalties with very high, almost-fully-incremental margins that none of the four peers possesses. This is a genuine business-model advantage, not an accounting artifact, but it means QUALCOMM’s blended margins are not a like-for-like operating comparison against the pure-chip peers NXPI and SWKS — part of the margin premium is IP economics, not chip-operating efficiency. Note also that QTL segment profitability is reported on a pre-tax (EBT) basis, never as operating income, and must be read accordingly.
[Rating and price target withdrawn — see the note at the top.] Its net income also benefits from an income-tax benefit this year, lifting net margin and ROE. With an outsized goodwill and intangibles balance on its books from those deals, its ROIC and asset-based ratios are not clean against QUALCOMM’s. Critically, AVGO’s EV/EBITDA and P/E reflect an AI-driven market valuation, not operating fundamentals comparable to QUALCOMM’s; AVGO’s multiples must not be treated as a benchmark QUALCOMM should trade toward.
MediaTek reports under IFRS in New Taiwan dollars with a December year-end — directional only (affects all metrics). MediaTek reports under IFRS (TIFRS) in TWD with a December year-end, versus US GAAP for QUALCOMM and the three other peers. [Rating and price target withdrawn — see the note at the top.] Three layers reduce comparability: IFRS versus US GAAP treatment (capitalized development, leases, FVOCI investment gains routed through equity), the TWD-to-USD translation, and a fiscal period ending roughly three months after QUALCOMM’s, capturing a different slice of the semiconductor cycle. MediaTek’s large net-cash and financial-asset base makes its ROIC and net-debt/EBITDA structurally extreme (very high ROIC, net-cash leverage). Every MediaTek figure is flagged ᶠ and should be read as directional, not precise. The comparison uses MediaTek’s consolidated statements (MediaTek Inc. and subsidiaries), not the parent-only file.
Fiscal periods do not fully align (affects cyclicality reads). The five companies close their books at different points in the cycle: QUALCOMM in late September, SWKS about a week later (effectively aligned), AVGO in early November (within ~5 weeks, treated as aligned), and NXPI and MediaTek at end-December — roughly three months after QUALCOMM. Small period-driven differences for NXPI and MediaTek should not be over-interpreted as fundamental gaps. Finally, the leverage and inventory spreads across the set (NXPI most levered and most inventory-heavy; SWKS and MediaTek net-cash) are genuine balance-sheet and end-market differences, not comparability defects, and have been used as findings rather than caveated away.
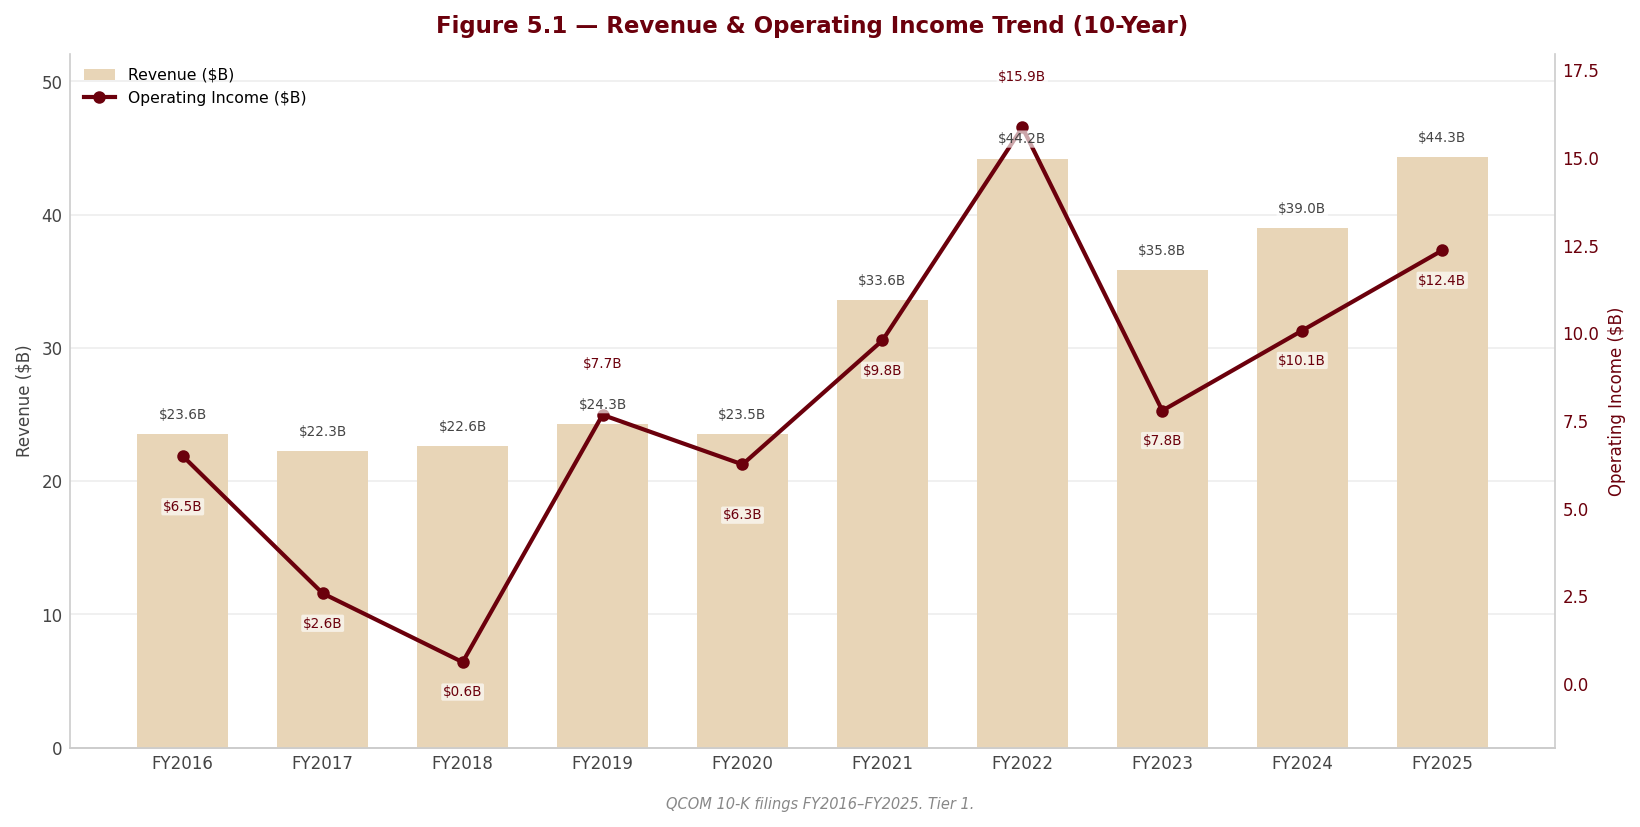
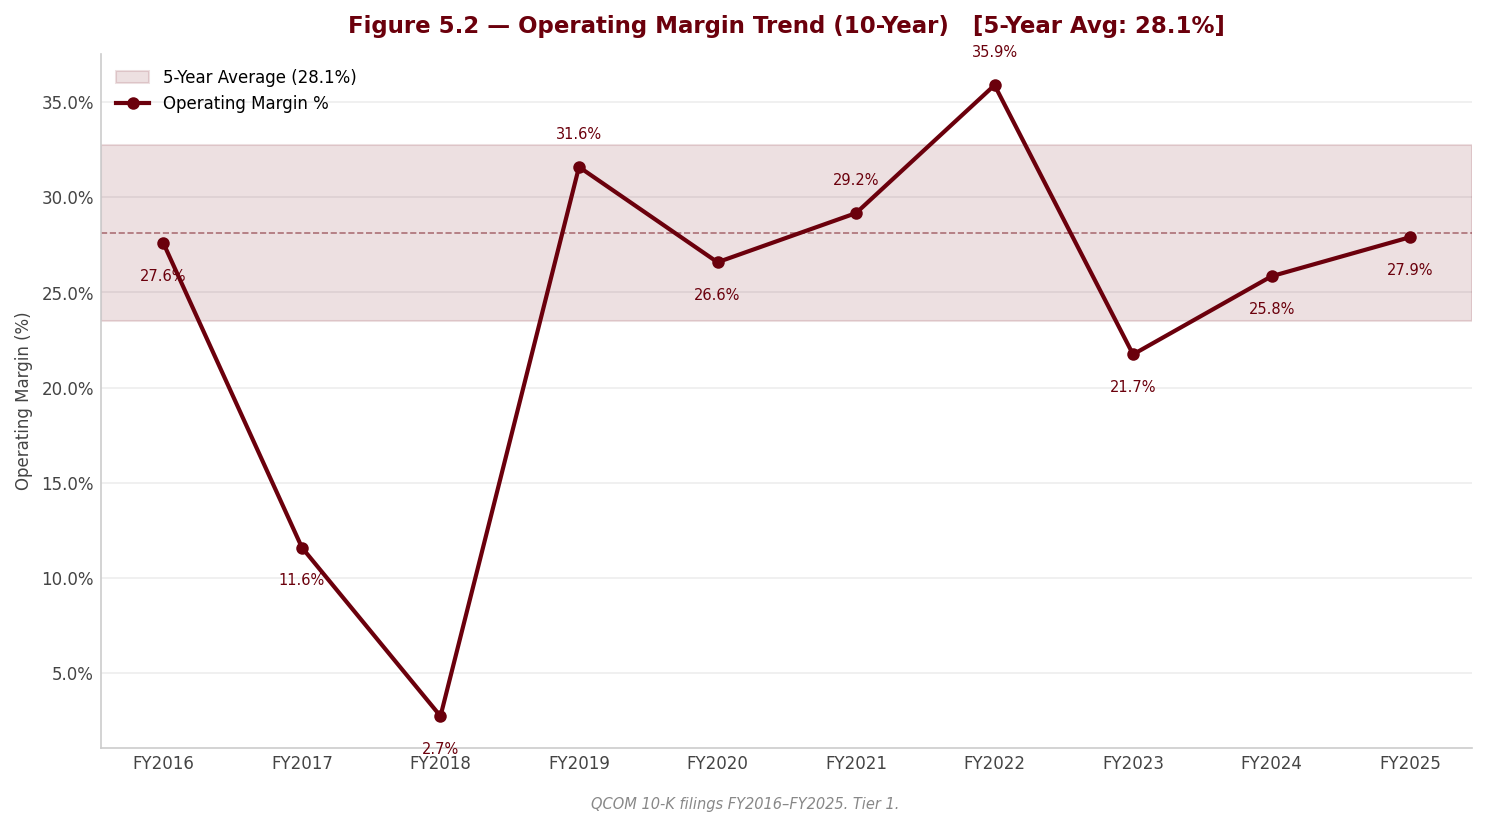
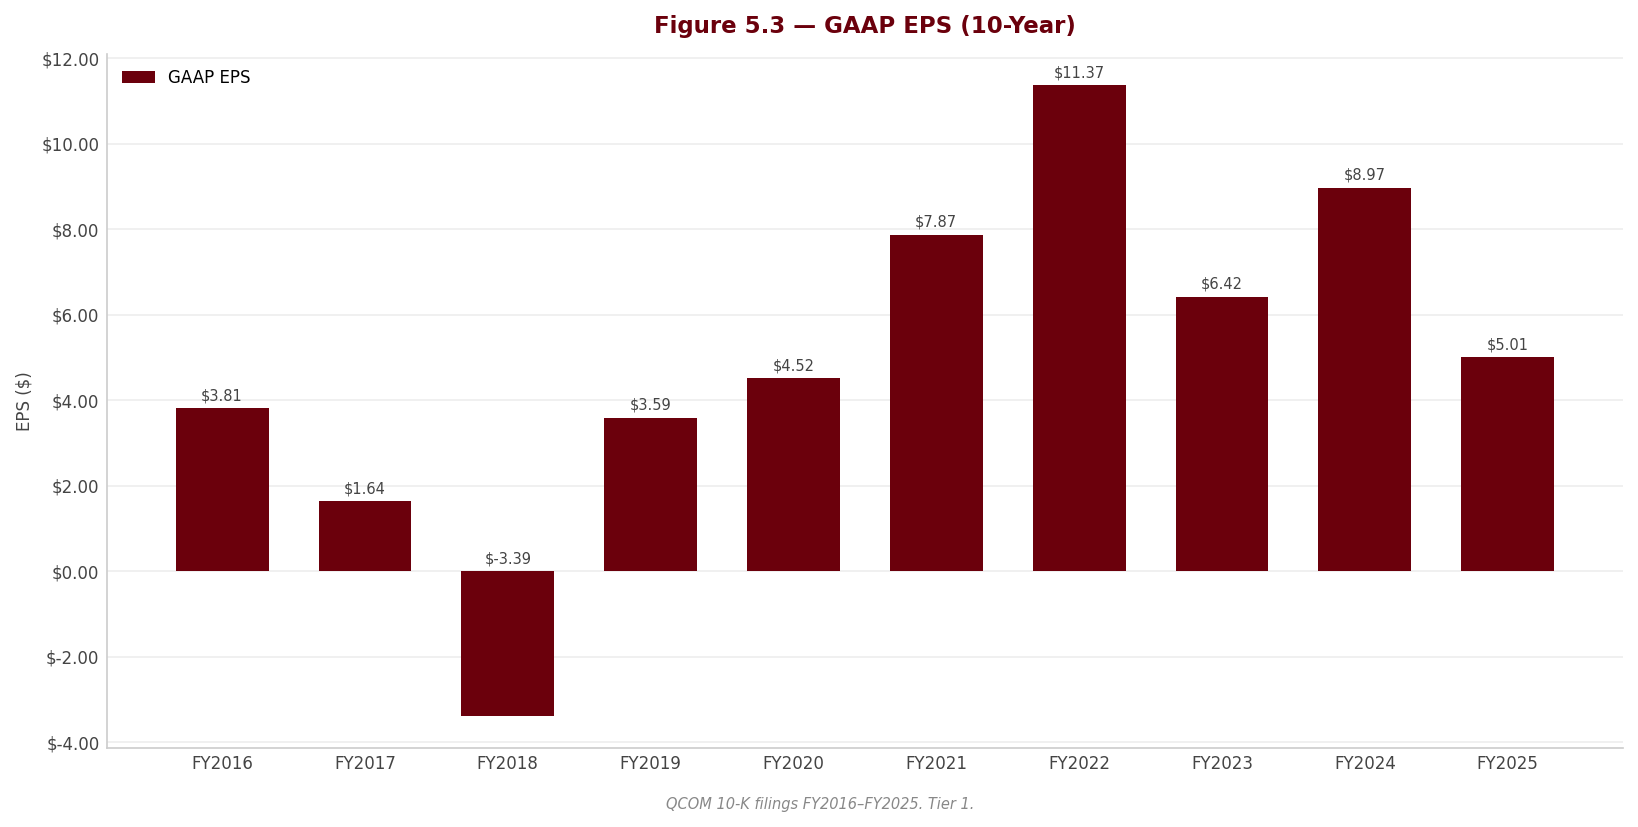
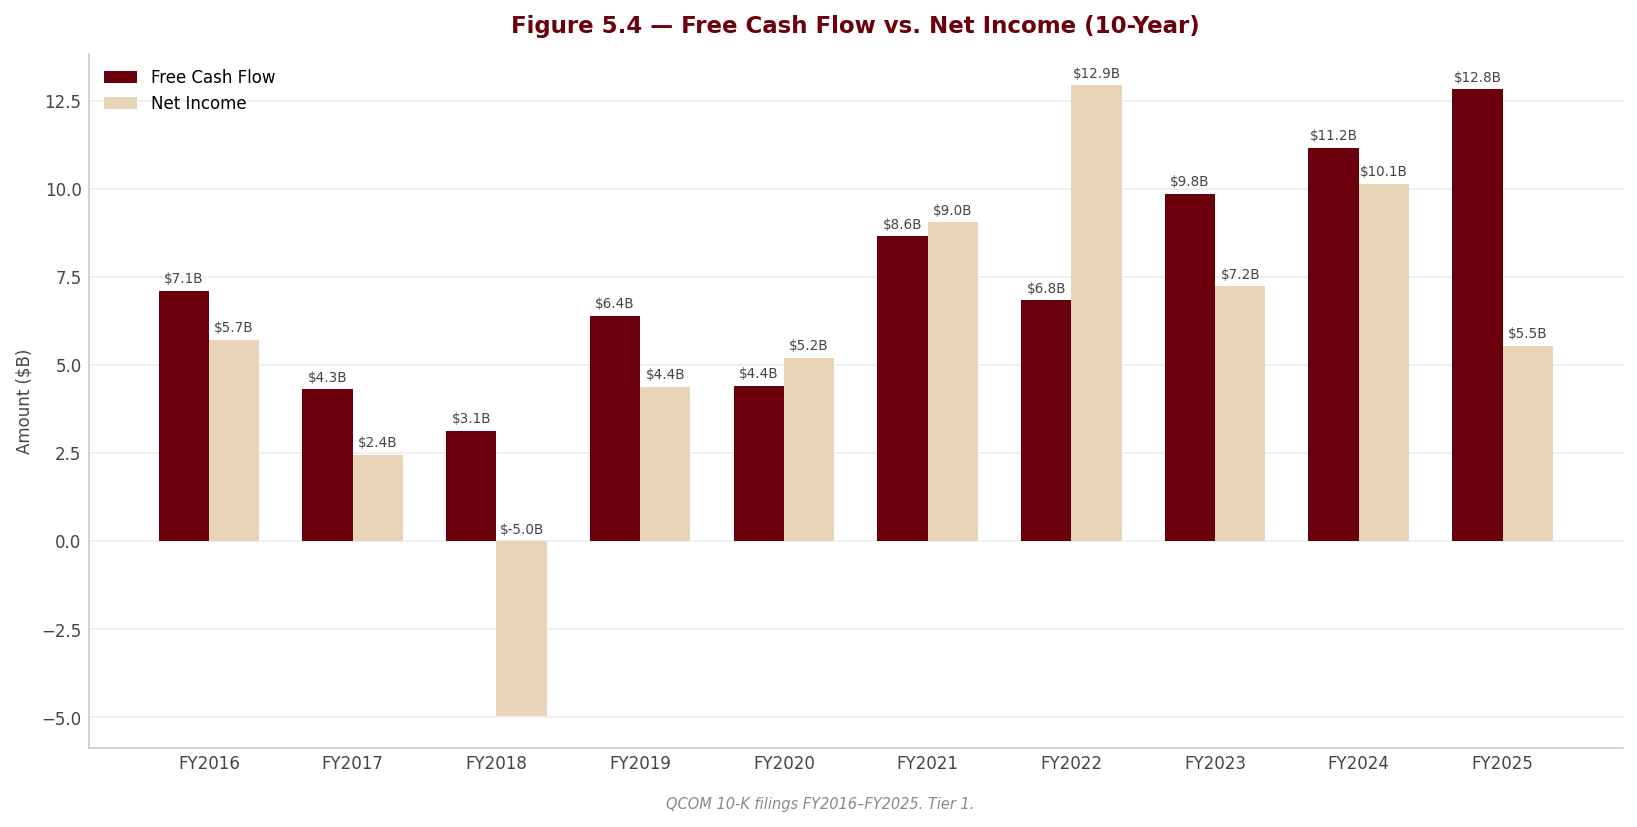
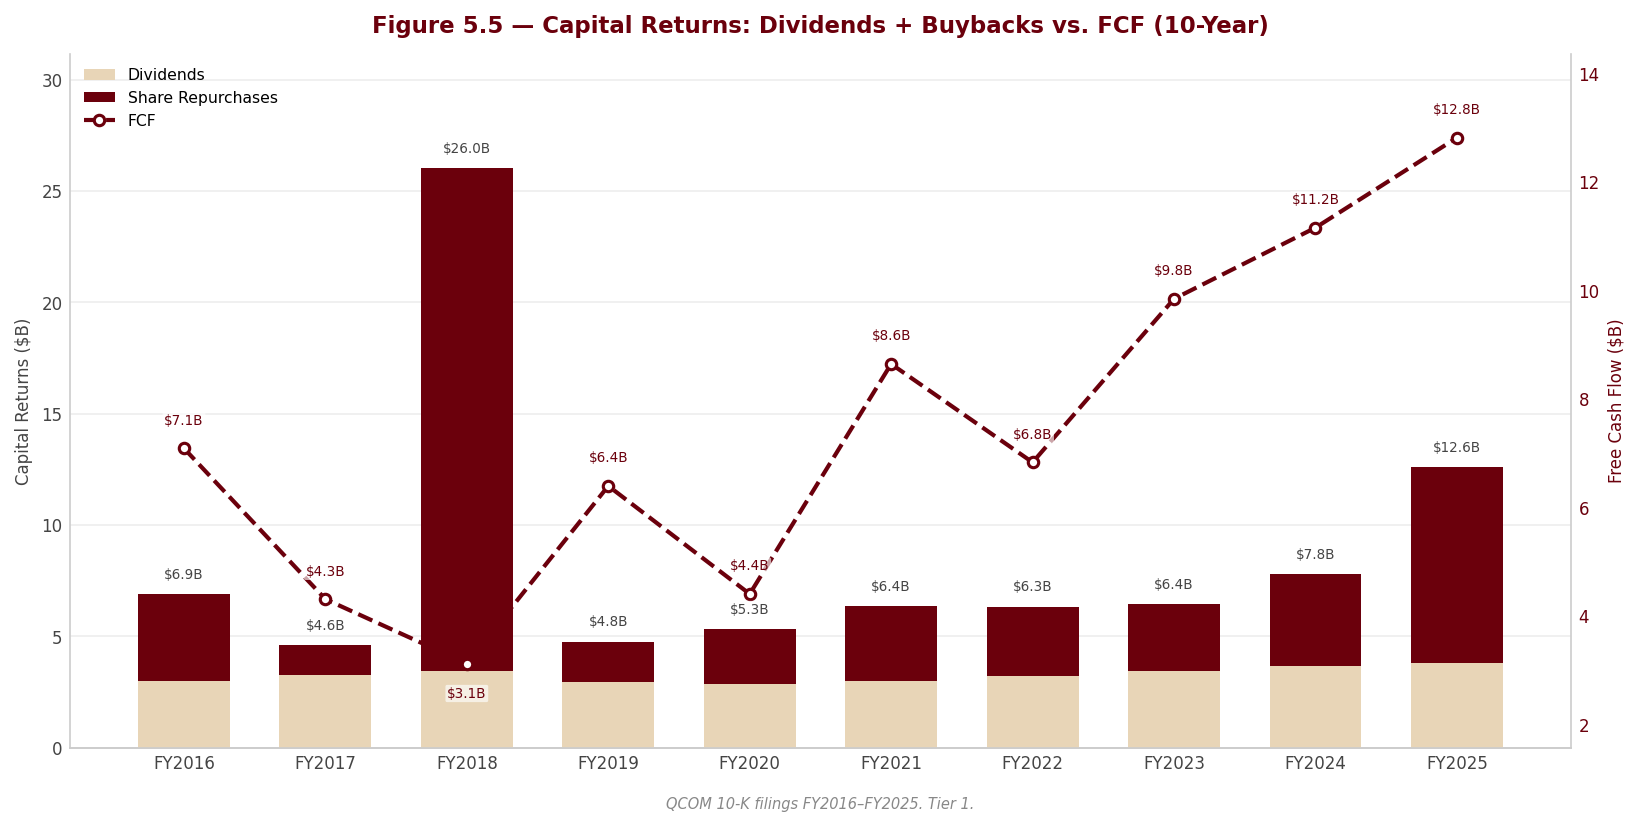
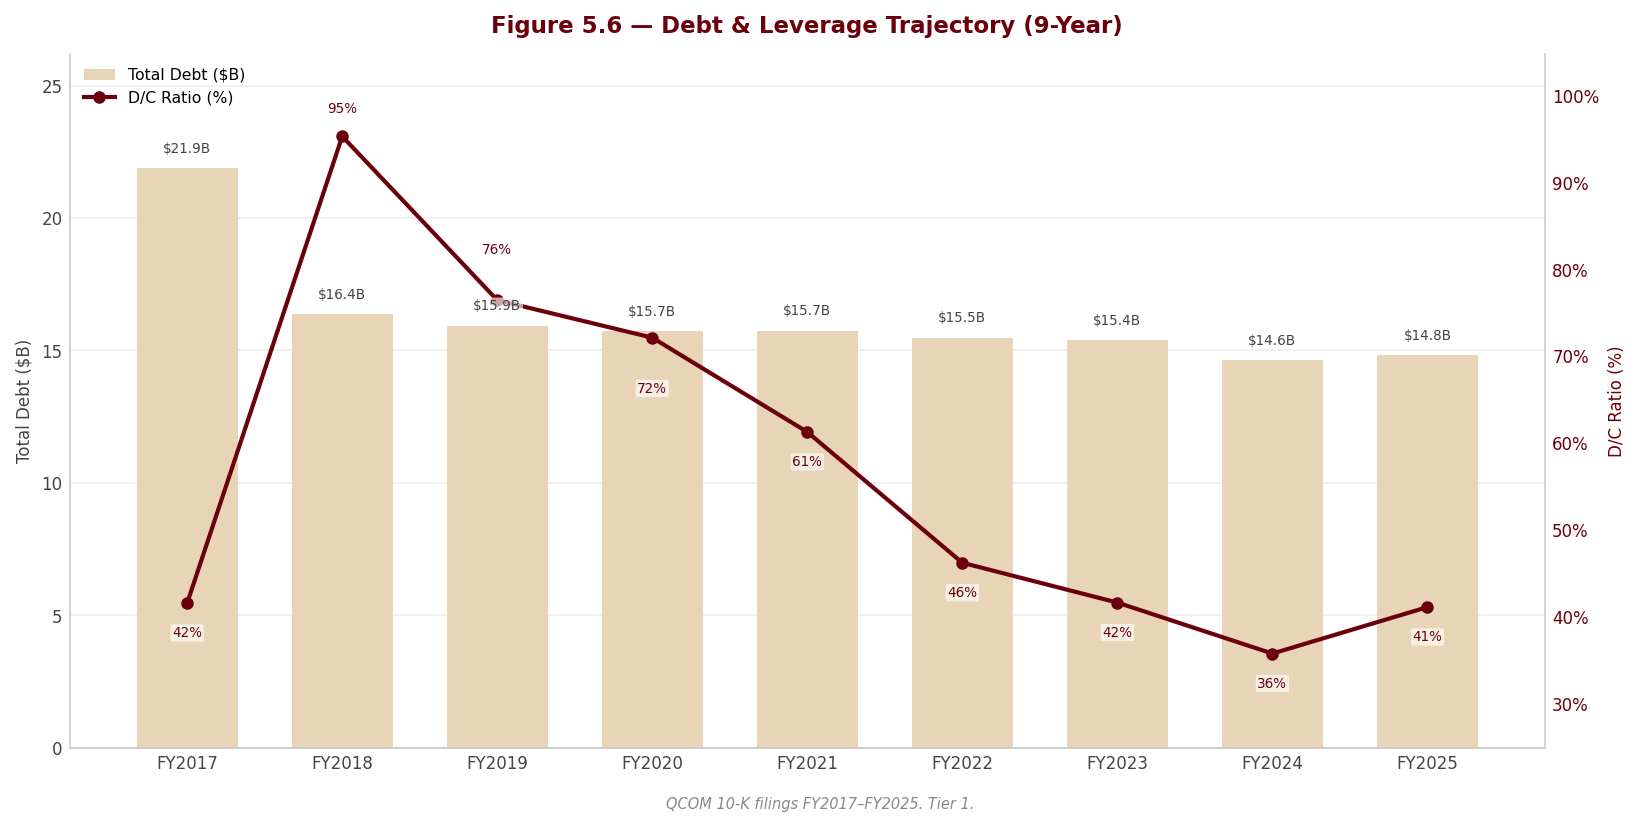
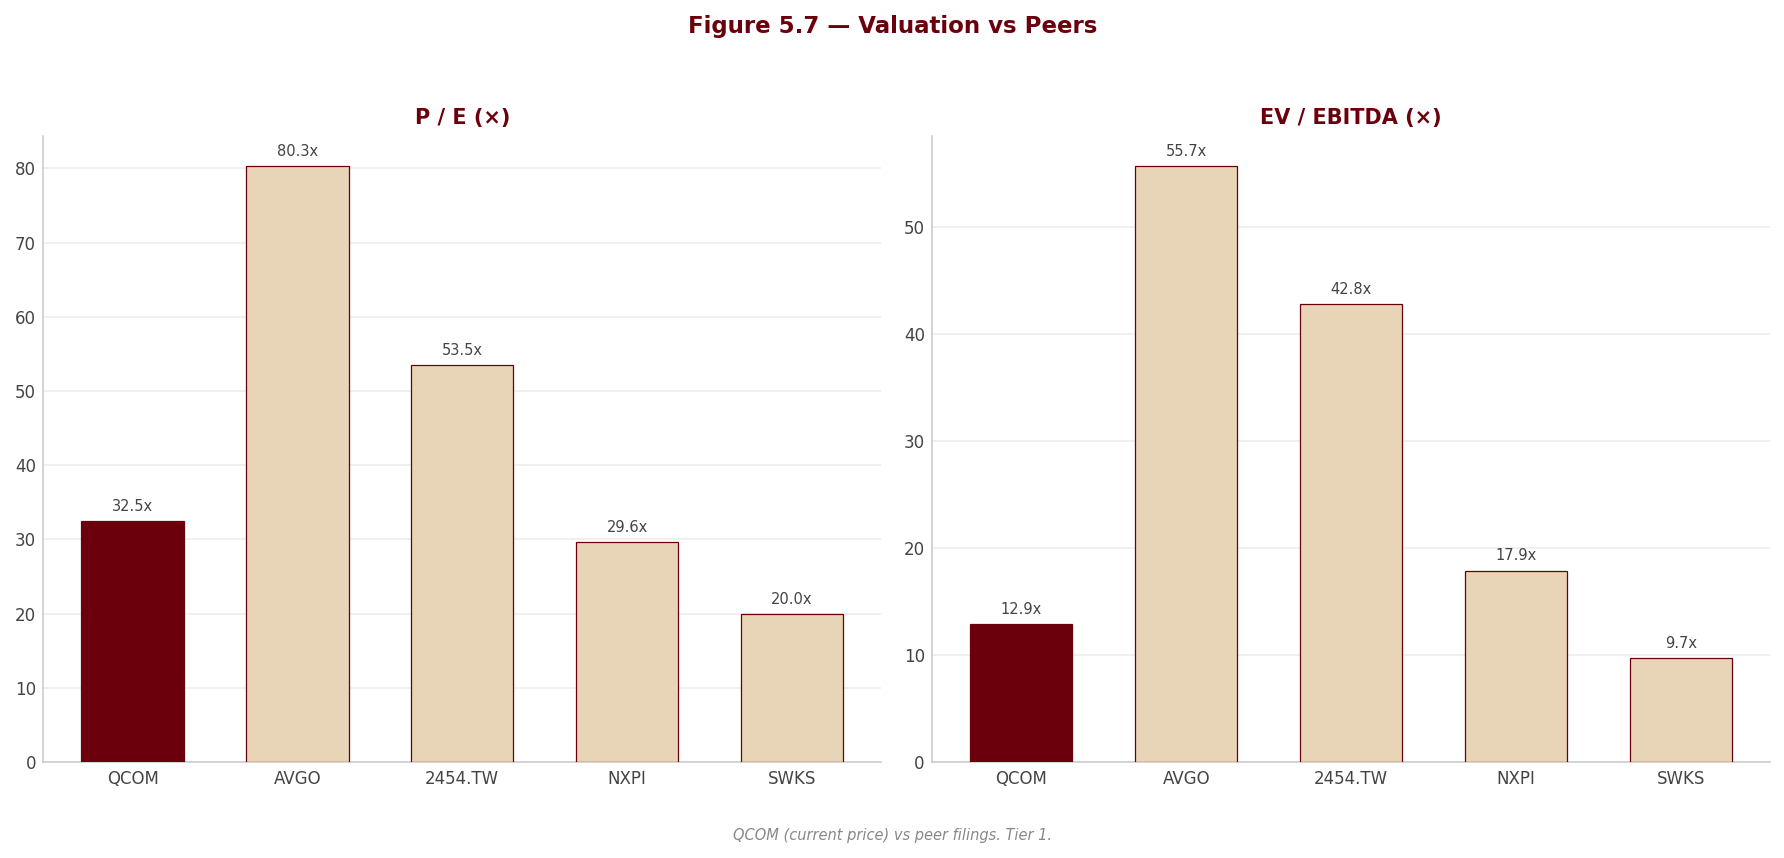
6. Valuation & Price Target withdrawn
This section stated what the shares were worth and what to do about them. It rested on an exit multiple set by hand — across the coverage it averaged 24% below where each company actually traded — so the conclusion largely restated that assumption instead of testing it. Rather than leave it standing, it has been withdrawn while the method is rebuilt.
Nothing else in this report depends on it: the financial analysis above and below is drawn from the company's own filings, and every figure links to the page it was verified against.
Section 7 — Quarterly Update: Q3 2026 (fiscal third quarter ended 28 June 2026)
Portfolio Action
[Rating and price target withdrawn — see the note at the top.]
| Assessment | |
|---|---|
| Action | [Rating and price target withdrawn — see the note at the top.] |
| Reason | [Rating and price target withdrawn — see the note at the top.] |
| Thesis intact? | YES — reinforced. The Section 2 revenue-cliff thesis is now visible in the numbers: QCT handset revenue -19.6% YoY to $5,086M, with consolidated growth deteriorating from +5.0% in Q1 2026 to -3.5% in Q2 2026 to -4.0% now; and the Section 2 Risk 5 tax thesis has crystallised (FDDEI benefit -$233M YoY in the quarter). |
| Trigger to revisit | QCT handset revenue stabilising YoY for two consecutive quarters (i.e. the Apple/OEM step-down proving smaller than modelled), or the share price converging toward the $93.13 DCF-anchored target — QUALCOMM repurchased stock at rising prices from $130.45 to $222.00 per share through this quarter, so the valuation gap widened rather than closed. |
7.1 Results at a Glance
| Metric | Q3 2026 | Q3 2025 | YoY Δ | Q2 2026 | QoQ Δ |
|---|---|---|---|---|---|
| Revenue ($M) | $9,947.0M | $10,365.0M | -4.0% | $10,599.0M | -6.2% |
| Gross Profit ($M) | $5,277.0M | $5,759.0M | -8.4% | $5,699.0M | -7.4% |
| Gross Margin | 53.1% | 55.6% | -2.5 pp | 53.8% | -0.7 pp |
| EBITDA ($M) | $2,022.0M | $3,160.0M | -36.0% | $2,722.0M | -25.7% |
| EBITDA Margin | 20.3% | 30.5% | -10.2 pp | 25.7% | -5.4 pp |
| EBIT ($M) | $1,626.0M | $2,762.0M | -41.1% | $2,309.0M | -29.6% |
| EBIT Margin | 16.3% | 26.6% | -10.3 pp | 21.8% | -5.4 pp |
| Net Income ($M) | $2,002.0M | $2,666.0M | -24.9% | $7,370.0M | -72.8%ᵃ |
| Net Margin | 20.1% | 25.7% | -5.6 pp | 69.5%ᵃ | -49.4 ppᵃ |
| Diluted EPS | $1.87 | $2.43 | -23.0% | $6.88 | -72.8%ᵃ |
YoY Δ formula (shown once): (CQ - PYSQ) / |PYSQ| × 100 — e.g. Revenue = (9,947 - 10,365) / 10,365 × 100 = -4.0%. QoQ Δ = (CQ - PQ) / |PQ| × 100 — e.g. Revenue = (9,947 - 10,599) / 10,599 × 100 = -6.2%. Margin = line / Revenue × 100 (e.g. Gross Margin CQ = 5,277 / 9,947 × 100 = 53.1%); margin Δ is in percentage points (pp) = CQ margin - comparison margin.
[Rating and price target withdrawn — see the note at the top.] Excluding the release, Q2 2026 net income was approximately $1,646M and diluted EPS approximately $1.54 (analyst-computed: $7,370M - $5,724M, on the ~1,071M diluted shares implied by the reported figures). On that comparable basis, Q3 2026 diluted EPS of $1.87 is up roughly 21% sequentially, not down 72.8%. Use only the YoY column and the pre-tax lines to judge this quarter.
Source: QUALCOMM Form 10-Q for the quarterly period ended June 28, 2026, Condensed Consolidated Statements of Operations (p. 6); prior sequential quarter per QUALCOMM Form 10-Q for the quarterly period ended March 29, 2026 (pp. 20–21).
7.2 P&L Drivers
sources Revenue: Revenue of $9,947.0M declined for the second consecutive quarter and the deterioration is accelerating — FY2026 quarterly revenue went +5.0% YoY in Q1 (to $12,252M), -3.5% in Q2 and -4.0% in Q3 — exactly the trajectory Section 2 anticipated from Apple’s commenced modem in-sourcing and the expired Huawei QTL licence. Management attributes the $418M YoY decline to $502M of lower QCT equipment and services revenue and $40M of lower QTL licensing, offset by $88M of Data Center revenue from the Alphawave acquisition (10-Q p. 23). Inside QCT, handsets fell 19.6% YoY to $5,086M from $6,328M — management cites lower chipset shipments to certain major OEMs as customers cut build plans in response to memory supply constraints and price increases (10-Q pp. 12, 27) — while automotive rose 61.4% to $1,588M ($381M from higher revenue per unit, $223M from higher shipments) and IoT rose 8.9% to $1,830M (10-Q p. 27). The diversification engine is working; it is not yet working fast enough to offset the handset base, which is the entire Section 2 thesis restated in one quarter’s numbers.
Cost and margin: COGS rose to $4,670.0M in Q3 2026 from $4,606.0M in Q3 2025 (+1.4%) on 4.0% lower revenue, cutting gross margin to 53.1% from 55.6% (-2.5 pp); management attributes this entirely to lower QCT gross margin driven by higher product cost, partially offset by higher average selling prices (10-Q pp. 23, 27). D&A was $396.0M in Q3 2026 vs $398.0M in Q3 2025 (-0.5%), so it explains none of the EBITDA decline. The EBIT margin collapse of -10.3 pp is three-quarters an operating-expense story: R&D rose 17.1% to $2,607M (+$244M of wireless/IC development cost driven by lower non-recurring engineering reimbursements, +$101M share-based compensation), SG&A rose 26.6% to $976.0M (+$62M share-based compensation, +$27M sales and marketing, +$24M deferred-compensation revaluation), and a new $68M restructuring and severance charge appeared with no prior-year comparative (10-Q pp. 13, 24). None of this is temporary: management states it will continue investing in growth and diversification and has replaced FY2026–FY2027 cash incentives with a two-year equity award, which is why share-based compensation is rising structurally (10-Q p. 24).
Below the line: Interest expense was $178.0M (+6.0% YoY), but the decisive item is investment and other income of $1,014M vs. $358M — a $656M swing of which $522M is higher net gains on marketable securities, driven by initial public offerings of certain QSI equity investments (10-Q pp. 13, 25). That is why pre-tax income fell only 16.6% (to $2,462M from $2,952M) while EBIT fell 41.1%: non-operating, non-recurring, mark-to-market gains absorbed two-thirds of the operating deterioration. Diluted EPS fell $0.56 (-23.0%) YoY to $1.87; the $5.01 (-72.8%) sequential fall is an artefact of the Q2 2026 tax release and should be read as approximately +21% on a comparable basis (see 7.1 note ᵃ).
7.3 Balance Sheet & Cash Flow
| Metric | Q3 2026 | Q3 2025 | YoY Δ | Q2 2026 | QoQ Δ |
|---|---|---|---|---|---|
| Cash ($M) | $4,533.0M | $5,448.0M | -16.8% | $5,435.0M | -16.6% |
| Net Debt ($M) | $10,737.0M | $9,340.0M | +15.0% | $9,835.0M | +9.2% |
| Net Debt / LTM EBITDA | 0.91× | — | — | — | — |
| Total Assets ($M) | $57,367.0M | $54,862.0M | +4.6% | $57,136.0M | +0.4% |
| Equity ($M) | $27,658.0M | $27,209.0M | +1.7% | $27,278.0M | +1.4% |
| OCF ($M) | $991.0M | $2,875.0M | -65.5% | $2,449.0M | -59.5% |
| CapEx ($M) | $496.0M | $294.0M | +68.7% | $533.0M | -6.9% |
| FCF ($M) | $495.0M | $2,581.0M | -80.8% | $1,916.0M | -74.2% |
| Dividends Paid ($M) | $973.0M | $968.0M | +0.5% | $946.0M | +2.9% |
Net Debt / LTM EBITDA: LTM EBITDA = Q4 2025 (3,289) + Q1 2026 (3,759) + Q2 2026 (2,722) + Q3 2026 (2,022) = 11,792; Net Debt CQ (10,737) / 11,792 = 0.91×. Leverage is comfortable in absolute terms, but the trend is adverse on both sides of the ratio: net debt is up 15.0% YoY while LTM EBITDA is falling. CapEx and dividends are shown as positive magnitudes; both are cash outflows.
Source: QUALCOMM Form 10-Q for the quarterly period ended June 28, 2026, Condensed Consolidated Balance Sheets (p. 4) and Condensed Consolidated Statements of Cash Flows (p. 8); liquidity table (p. 30). Standalone-quarter cash-flow figures are analyst-derived by differencing the nine-month statement (p. 8) against the six-month statement in the Q2 2026 10-Q (p. 6), because the 10-Q cash-flow statement is presented year-to-date only.
Balance sheet note: Two items moved materially and both matter. Inventories rose to $8,379M from $7,368M at Q2 2026 and $6,526M at fiscal year-end 2025 — a 28.4% build since September against falling revenue (10-Q p. 11; Q2 2026 10-Q p. 8) — which management links to customer demand impacts from memory supply constraints (10-Q p. 30); this is the classic set-up for excess or obsolete inventory charges if handset demand does not recover. Second, deferred tax assets jumped to $5,679M from $743M at fiscal year-end 2025 (10-Q p. 4) — the balance-sheet footprint of the Q2 2026 valuation-allowance release — while goodwill rose $2,916M to $14,274M on the Alphawave and seven smaller acquisitions (10-Q pp. 4, 21). Debt rose modestly to $15,270M from $14,811M, of which $2,489M is now current ($1,991M of long-term debt maturing May 2027 plus $498M of commercial paper), and the credit facility was undrawn (10-Q pp. 12, 30).
Cash flow note: FCF conversion = FCF / Net Income = 495 / 2,002 = 24.7% — the weakest line in the quarter. Standalone Q3 operating cash flow of $991.0M against net income of $2,002.0M diverged for two identifiable reasons (analyst-derived by differencing nine-month against six-month cash flows, 10-Q p. 8; Q2 2026 10-Q p. 6): a roughly $996M inventory build, and roughly $886M of net gains on marketable securities and other investments — the QSI IPO marks — being backed out as non-cash, with a further ~$322M absorbed by receivables. In other words, the same item that flattered pre-tax income is the item that drained cash conversion. Capex of $496.0M was 68.7% above the prior-year quarter, so free cash flow of $495.0M did not cover the $973.0M dividend, let alone the roughly $1,364M of share repurchases made in the quarter.
7.4 Footnote Review
sources Note 1 — Basis of Presentation and Significant Accounting Policies Update (10-Q p. 11) Standard interim-GAAP basis; both the three-month and nine-month periods contained 13 and 39 weeks respectively in FY2026 and FY2025, so the YoY comparison is period-clean and fiscal 2026 is a 52-week year. Two pending FASB standards are disclosed — income-tax disclosure detail (annual periods from fiscal 2026, prospective) and expense disaggregation (fiscal 2028) — both disclosure-only with no measurement effect. The note also states that certain prior-year amounts have been reclassified to conform to current presentation. Read against the same note in the Q2 2026 10-Q (p. 8), the only change is the income-tax disclosure standard now described as prospective-only rather than retrospective-or-prospective. No thesis impact.
Note 2 — Composition of Certain Financial Statement Items (10-Q pp. 11–13) The most information-dense note in the filing and the one that most affects the thesis. (i) Inventories $8,379M vs. $6,526M at fiscal year-end 2025, with work-in-process $5,005M (from $3,985M) and raw materials doubling to $682M (p. 11) — a build into a declining handset market. (ii) Capacity purchase commitments: advance payments fell to $769M from $1.9B (p. 11), i.e. prior supply prepayments are being consumed rather than replenished. (iii) Other current liabilities: customer incentives and other customer-related liabilities rose to $2,762M from $1,948M (p. 11) — a 41.8% increase against falling revenue, which is worth monitoring as a revenue-quality signal. (iv) Short-term debt of $2,489M appeared where there was none at fiscal year-end (p. 12). (v) Concentrations: customer/licensee (x) rose to 23% of revenue from 18%, (y) was 20% vs. 21%, and (z) dropped below 10% from 13% (p. 13) — concentration in the top name is increasing, not diversifying, which is Section 2 Risk 2 worsening. (vi) Revenues from previously satisfied performance obligations were $165M vs. $189M (p. 12), so prior-period royalty true-ups are not propping up QTL this quarter. (vii) Other expenses of $68M (nine months $97M) are restructuring and severance with no prior-year comparative (p. 13). (viii) Investment and other income is broken out on p. 13 and discussed in 7.2.
Note 3 — Income Taxes (10-Q pp. 13, 15; MD&A reconciliation p. 25; OBBB narrative p. 27) This is the headline of the quarter’s reporting, and the durable half of it is the half that is easy to miss. The one-off: in Q4 FY2025 QUALCOMM established a $5.7 billion valuation allowance on federal deferred tax assets because the One Big Beautiful Bill Act (OBBB) led it to expect to be perpetually subject to the corporate alternative minimum tax (CAMT); in Q2 2026 the Treasury and IRS issued Notice 2026-07 permitting CAMT to be reduced by certain previously capitalised domestic R&D expenditure, so the company “no longer expect[s] to be subject to CAMT in the foreseeable future” and released the entire allowance for a $5,724M income tax benefit (10-Q pp. 13, 25, 27; Q2 2026 10-Q pp. 20–21). [Rating and price target withdrawn — see the note at the top.] A $151M adverse swing on the foreign-withholding-tax-receivable currency line ($28M loss vs. $123M gain) compounded it. Unrecognized tax benefits rose to $3.0 billion from $2.7 billion at fiscal year-end 2025, and management believes it is reasonably possible they will change within twelve months (p. 27). Implication: Section 2 Risk 5 — erosion of the historically low tax profile — is no longer a risk, it is a realised fact, and it permanently lowers the after-tax cash flows underpinning the DCF. The valuation-allowance release, by contrast, is a non-cash accounting reversal that changes no future cash flow.
Note 4 — Capital Stock (10-Q p. 15) A new $20.0 billion repurchase authorisation was announced on 17 March 2026 on top of $2.1 billion then remaining, leaving $20.6 billion authorised at 28 June 2026. Shares outstanding fell to 1,057M from 1,074M at fiscal year-end (25M issued, 42M repurchased). Dilutive share equivalents were 12M vs. 7M a year earlier, and no equivalents were excluded as anti-dilutive this quarter (vs. 2M in Q3 2025). Changed vs. Q2 2026, where $21.9 billion remained authorised and 18M equivalents were anti-dilutive (Q2 2026 10-Q p. 11). Implication: capital return remains aggressive against a shrinking free-cash-flow base — this quarter’s repurchases of roughly $1,364M plus $973.0M of dividends were nearly three times free cash flow of $495.0M.
Note 5 — Commitments and Contingencies (10-Q pp. 15–16) Covered in full under “Contingencies and litigation” below.
Note 6 — Segment Information (10-Q pp. 16–18) Three reportable segments, unchanged in composition, plus nonreportable QGOV and Data Center. Segment profit is EBT — earnings before income taxes — management’s own measure, not operating income, and it includes allocated D&A while excluding share-based compensation, certain interest and investment income, and acquisition-related and restructuring charges (p. 17).
| Segment | Revenue Q3 2026 | Revenue Q3 2025 | YoY Δ | EBT Q3 2026 | EBT Q3 2025 | YoY Δ | EBT margin Q3 2026 |
|---|---|---|---|---|---|---|---|
| QCT | $8,504M | $8,993M | -5.4% | $2,192M | $2,671M | -17.9% | 25.8% |
| QTL | $1,278M | $1,318M | -3.0% | $881M | $942M | -6.5% | 68.9% |
| QSI | — | — | — | $768M | $149M | +415.4% | n.m. |
| Reportable total | $9,782M | $10,311M | -5.1% | $3,841M | $3,762M | +2.1% | — |
Source: QUALCOMM Form 10-Q for the quarterly period ended June 28, 2026, Note 6 — Segment Information (pp. 17–18) and MD&A Segment Results (pp. 27–28). EBT margins are analyst-computed as segment EBT / segment revenue × 100.
The +2.1% reportable-segment EBT line is the single most misleading number in the filing. Strip QSI — which has no revenue at all and whose EBT is entirely investment gains from QSI portfolio IPOs (p. 28) — and the two operating segments’ combined EBT fell 14.9% to $3,073M from $3,613M. QCT EBT margin fell to 25.8% from 29.7% on lower gross margin from higher product cost (p. 27); QTL EBT margin fell to 68.9% from 71.5% on a $67M decline in estimated cellular-product sales and $25M less prior-period royalty catch-up, partly offset by $59M of mix-driven revenue-per-unit gain (p. 28). Nonreportable segments — chiefly the newly acquired Data Center business — lost $214M of EBT versus $10M a year ago (p. 18): diversification is currently being bought, not earned.
Note 7 — Fair Value Measurements and Marketable Securities (10-Q p. 19) Total assets measured at fair value were $6,946M with no Level 3 recurring assets — the same clean structure the FY2025 forensic review found. The material disclosure is footnote (1): the $926M of Level 1 equity securities “primarily consists of equity securities in certain QSI investees that have completed initial public offerings, which remain subject to short-term lock-up restrictions on the ability to sell.” Management separately warns under Item 3 that these are growth-stage public companies whose fair values have been and may continue to be subject to increased volatility (p. 31). [Rating and price target withdrawn — see the note at the top.] Implication: the $726M of gains that carried pre-tax income this quarter sit in positions QUALCOMM is contractually unable to sell and that can mark back down — they are neither cash nor locked in.
Note 8 — Acquisitions (10-Q pp. 19, 21) Alphawave closed 18 December 2025 for $2.3 billion ($1.8 billion in 11 million shares plus $301 million cash), allocated to $2,210M of goodwill, $239M of amortisable intangibles and $107M of in-process R&D, with the purchase price allocation still preliminary (pp. 19, 21). Goodwill went to the Data Center operating segment and is not tax-deductible. Seven other businesses were acquired in the first nine months for $1.1 billion, adding $737M of goodwill ($661M to QCT, $76M to Data Center). Modular was acquired after quarter end (see Subsequent events). Implication: QUALCOMM has now put roughly $3.4 billion of purchase price plus a further ~$3.1 billion post-quarter into a Data Center business that is loss-making at the segment level (-$214M EBT this quarter, p. 18). This is Section 2 Catalyst 4 — real optionality, real cash, no earnings yet.
Related-party transactions (10-Q pp. 13, 19, 21, 56) QUALCOMM has no controlling shareholder and the 10-Q contains no related-party transactions footnote — this is a widely-held issuer, so there is no affiliate-transaction structure to document. The related and quasi-related items the filing does disclose, with amounts, are: (i) equity-method investees — equity in net earnings of $66M in Q3 2026 versus a $4M loss in Q3 2025, and $149M versus $13M for the nine months, driven by QSI equity-method investments (pp. 13, 28); (ii) deferred compensation plan assets of $1,293M against liabilities of $1,289M at 28 June 2026, with $149M of gains on plan assets in the quarter (Q3 2025: $84M) offset by a corresponding $24M increase in SG&A from revaluing the obligation (pp. 19, 24) — an insider-benefit arrangement that flows through both income lines and nets to approximately zero; (iii) shares issued to executives of acquired businesses — Exchangeable Shares of $746M estimated fair value issued to certain Alphawave executives, of which $453M is inside the $2.3 billion purchase price and the remainder is subject to a four-year service requirement and recognised as compensation expense (p. 21), and approximately $700M of Modular shares (4 million) issued to certain Modular executives on the same four-year-service basis (p. 21). Items (i) and (ii) existed in the prior-year quarter at the amounts stated above and their terms are unchanged; item (iii) is new in FY2026 and has no Q3 2025 comparative because both acquisitions post-date it. Finally, Item 5 confirms that during the quarter ended 28 June 2026 no director or officer adopted or terminated a Rule 10b5-1 or non-Rule 10b5-1 trading arrangement (p. 56). No value-extraction structure exists and none of these items alters the thesis.
Contingencies and litigation (10-Q pp. 15–16) Three matters are disclosed, all patent/licensing-related, and no accrual has been recorded at 28 June 2026 because management believes losses, while reasonably possible, are not probable and no amount or range can be reasonably estimated (p. 16). 1. ParkerVision v. QUALCOMM — 2014 complaint, patents now expired and injunctive relief unavailable; ParkerVision continues to seek damages on RF products sold 2008–2018. Final judgment for QUALCOMM on the Receiver Claims entered 2 October 2025; the Transmitter Claims are severed and stayed; the Federal Circuit heard ParkerVision’s appeal on 1 June 2026 — within this quarter (p. 15). Amount at stake: not stated. 2. Arm v. QUALCOMM (Nuvia ALA) — the December 2024 jury verdict for QUALCOMM was upheld in a final judgment on 30 September 2025; Arm appealed to the Third Circuit on 1 October 2025 (p. 16). Arm seeks specific performance including destruction of technology developed under the Nuvia ALA, which Arm alleges includes the Oryon CPU cores. Amount at stake: not quantified, but the remedy sought is existential for a core technology. 3. QUALCOMM v. Arm — QUALCOMM’s own complaint, amended 30 March 2026 to add a good-faith-negotiation breach claim; the court denied Arm’s motion to strike on 14 July 2026 (after quarter end) and trial is scheduled to begin 5 October 2026 (p. 16). Versus the Q2 2026 10-Q (pp. 11–12), the changes are the completed ParkerVision appeal hearing, the 14 July 2026 ruling and the confirmed 5 October 2026 trial date. [Rating and price target withdrawn — see the note at the top.]
Subsequent events (10-Q pp. 2, 16, 21) The 10-Q does not carry a separate subsequent-events note; the post-quarter disclosures are distributed and are as follows. (i) Modular Inc acquisition completed 28 July 2026, valued at approximately $3.1 billion, consideration primarily 18 million QUALCOMM shares, including 4 million shares of approximately $700M fair value issued to executives subject to four-year service; purchase price allocation not yet practicable (p. 21). (ii) The Arm litigation developments dated 14 July 2026 and the 5 October 2026 trial date (p. 16). (iii) Shares outstanding were 1,050 million at 27 July 2026 versus 1,057 million at 28 June 2026 (p. 2), i.e. buybacks continued after quarter end — before the ~18 million Modular shares issued the following day. Implication: the Modular purchase is a further ~$3.1 billion of equity-funded spend into the pre-revenue Data Center effort, and it partially re-dilutes the share count the buyback has been shrinking.
Every footnote in the filing is addressed above: Notes 1 through 8, plus the mandatory related-party, contingencies and subsequent-events treatments. Item 4 Controls and Procedures (p. 31) reports disclosure controls effective and no change in internal control over financial reporting during the quarter.
7.5 What Changed This Quarter
sources [Rating and price target withdrawn — see the note at the top.] This is permanent, it flows straight into the DCF’s after-tax cash flows, and it is the most consequential development of the quarter — far more so than the $5,724M one-off release that dominates the headline. - Operating quality deteriorated behind a flattering pre-tax line. EBIT fell 41.1% YoY to $1,626.0M and EBIT margin fell 10.3 pp to 16.3%, but pre-tax income fell only 16.6% because QSI investment gains contributed $768M of EBT — 31.2% of the $2,462M pre-tax total — from IPOs of portfolio holdings still under lock-up (10-Q pp. 19, 28). Excluding QSI, QCT and QTL combined EBT fell 14.9%. - The handset cliff is now measurable, not prospective. QCT handset revenue of $5,086M was down 19.6% YoY and $18,934M for the nine months, down 9.1% (10-Q p. 27). Automotive (+61.4%) and IoT (+8.9%) are growing but from a base too small to offset it — precisely the Section 2 Risk 1 mechanism. - Cash conversion broke down. Free cash flow of $495.0M covered only 24.7% of net income and did not cover the $973.0M dividend, against a $1,011M sequential inventory build to $8,379M into a market management expects to weaken further (10-Q pp. 11, 29). - Customer concentration worsened. The largest customer/licensee rose to 23% of revenue from 18% a year ago while the third 10%+ name fell out of the disclosure entirely (10-Q p. 13) — the opposite of the diversification the thesis requires. - Guidance turned explicitly cautious. Management now expects memory supply constraints and related price increases to adversely affect demand from several handset OEMs, and warns of broad-based input-cost and capacity constraints across wafer, assembly, test, packaging and memory that could negatively impact margins (10-Q p. 29). Both were framed more narrowly in the Q2 2026 filing (p. 22–23). - Diversification spend accelerated ahead of returns. $2.3 billion for Alphawave, $1.1 billion for seven other businesses, and $3.1 billion for Modular post-quarter, against a Data Center/nonreportable segment EBT loss of $214M this quarter versus $10M a year ago (10-Q pp. 18, 21).
7.6 Portfolio Decision
sources [Rating and price target withdrawn — see the note at the top.] [Rating and price target withdrawn — see the note at the top.] The confirmation: revenue declined 4.0% YoY with QCT handsets down 19.6%, exactly the Apple/OEM step-down Section 2 identified, while EBIT fell 41.1% to $1,626.0M and EBIT margin fell 10.3 pp to 16.3% — the franchise is not broken, but its operating earnings are contracting, and the report’s core objection was always price versus intrinsic value rather than business quality. [Rating and price target withdrawn — see the note at the top.] The $5,724M valuation-allowance release makes reported Q2 2026 earnings and every sequential comparison spectacular and meaningless; it is a non-cash accounting reversal that changes no future cash flow, and it should not be allowed to make this quarter look good. The footnote review adds three specific reasons for caution rather than comfort: $768M of the $2,462M pre-tax income is QSI investment gains on lock-up-restricted, growth-stage IPO positions that can mark back down (p. 19); free cash flow of $495.0M covered only 24.7% of net income and less than half the dividend while inventories built 28.4% since fiscal year-end into a demand environment management itself is warning about; and the Arm trial is now docketed for 5 October 2026 with no accrual recorded. [Rating and price target withdrawn — see the note at the top.]
What would change this view: - Upgrade condition: QCT handset revenue stabilising year over year for two consecutive quarters — i.e. quarterly handset revenue holding at or above the $5,086M level against its prior-year comparative — combined with QCT EBT margin recovering above 28%, which together would signal the Apple displacement is smaller or slower than the base case assumes and would justify raising the forward QCT path in the DCF. - Downgrade condition: a further leg down in operating quality — consolidated EBIT margin below 16.3% in the next quarter, or free cash flow again below the ~$973.0M quarterly dividend, or an adverse outcome in the 5 October 2026 Arm trial that puts the Oryon CPU licensing basis at risk — would move this to EXIT, since the dividend would then be funded from the balance sheet while a core technology’s licensing foundation is unresolved.
Report Versions
Every published version of this report, newest first — each one kept so a reader can see what changed and when.
| Version date | Files |
|---|---|
| 2026-08-20 Current | Model (Excel) |
| 2026-08-10-2 | Model (Excel) |
| 2026-08-10 | Model (Excel) |