
PayPal Holdings
Section 1 — Business Overview, Operations & Competitive Positioning
1.1 The Business
sources PayPal takes a fee every time money moves across a network on which it sits on both sides of the transaction — a cut of the payment itself, and a second cut of the credit, currency-conversion and interest-bearing services wrapped around it. §
That two-part economic model is visible in the income statement. Net revenues of $33,172.0M in FY2025, up 4.3% year over year, are earned in two streams: transaction revenue — fees charged to merchants and consumers for completing payments, currency conversion and instant transfers, which scales with the volume processed on the platform — and revenues from other value-added services, which is where interest and fees on the consumer and merchant loan books, a revenue share earned from a partner chartered financial institution on U.S. branded credit programmes, interest earned on the assets underlying customer balances, and subscription, referral and gateway fees are collected. The company generally does not charge customers to fund or withdraw from their accounts; the monetisation event is the transaction, not the relationship. §
What makes PayPal structurally different from most companies a portfolio manager will compare it against is the shape of its cost base. There is no cost of revenue, no gross profit and no inventory: the income statement runs from net revenues directly to total operating expenses to operating income. The largest single cost is transaction expense, which is essentially the cost of accepting the customer’s chosen funding source — highest when a transaction is funded by a credit card, lower on debit, close to nominal when funded from a bank transfer, a stored balance or PayPal’s own credit products. The practical consequence for analysis is that the first margin this business reports is the operating margin, 18.3% in FY2025, and that the true analogue of a gross margin — transaction revenue less transaction expense — is set by two mix variables management does not control contractually: how customers choose to fund payments, and how much of the volume arrives through the low-yield unbranded processing channel rather than the high-yield branded one. Mix, not cost discipline, is the margin story here.
That claim can now be tested rather than asserted. Total payment volume — a management-defined operating metric disclosed in MD&A, not an audited financial-statement line — rose from $359,928.0M in FY2016 to $1,793,979.0M in FY2025, while the yield PayPal captures on that volume, net revenues divided by total payment volume, fell from 3.01% to 1.85%. It fell in every single year in between, without one exception. One caution on the series: PayPal broadened its definition of total payment volume in the first quarter of FY2018 — to capture partner payment solutions, certain tokenised and contextual-commerce transactions, and the merchant debit-card programme — and restated FY2016 and FY2017 onto that new basis in the FY2018 10-K. The series used throughout this report is the restated one, so it is internally consistent on a single definition; a reader comparing against a pre-FY2018 filing will see different FY2016 and FY2017 figures.
The balance sheet is equally unconventional. PayPal holds a very large pool of custodial customer funds, recorded simultaneously inside current assets (funds receivable and customer accounts) and current liabilities (funds payable and amounts due to customers), against which it must hold at least an equivalent value of eligible liquid assets. Working-capital and liquidity ratios computed on the reported balance sheet are therefore not comparable to those of an industrial company and should not be read as such; the float is a regulated obligation that happens to earn interest, not spare working capital.
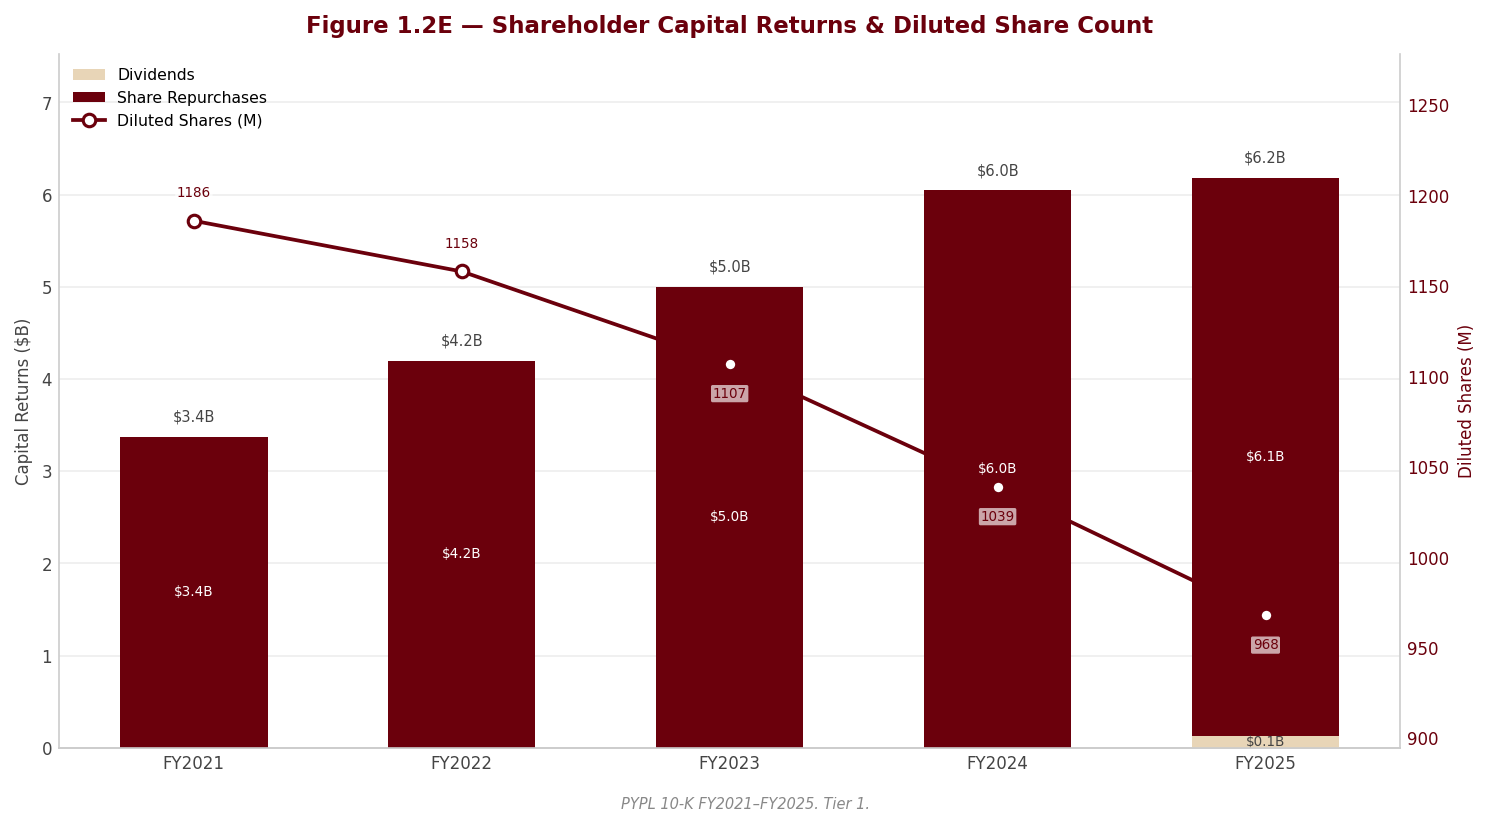
The workforce is global — spread across the Americas, Asia-Pacific, and Europe and the Middle East, predominantly full-time, and concentrated in engineering, risk and compliance disciplines that the filing identifies as the scarcest talent the company competes for. The shares trade on NASDAQ under the ticker PYPL. Diluted weighted-average shares outstanding were 968M in FY2025, materially below the FY2020 base of 1,187M — the cumulative effect of a repurchase programme discussed in §1.5. [Rating and price target withdrawn — see the note at the top.]
Key Information
| Item | Value |
|---|---|
| Ticker | PYPL |
| Sector / Industry | Financials / Transaction & Payment Processing Services |
| Report Date | 2026-08-10 |
| Most Recent FY Revenue | $33,172.0M |
| EBIT Margin (Most Recent FY) | 18.3% |
| Diluted Weighted-Average Shares | 968M |
| Current Price | $61.66 |
Source: Company SEC filings (10-K); see Appendix A.1.
1.2 Operating Segments
sources PayPal reports as a single operating and reportable segment, consistent with the prior year and unchanged in substance by the new segment-expense disclosure standard. There is no segment operating income, no divisional margin, and no divisional capital employed anywhere in the filing. [Rating and price target withdrawn — see the note at the top.] Everything below is therefore a decomposition of a single P&L, not a segment walk.
Branded checkout (PayPal and Venmo). The core franchise: the PayPal or Venmo button at an online or in-person checkout, where the consumer pays without exposing card credentials to the merchant and the merchant buys a measurable lift in conversion and a reduction in cart abandonment. This is the differentiated product and the one that carries materially richer economics. The single economic variable that drives it is consumer selection at the moment of checkout — the share of available checkouts where the consumer chooses PayPal rather than a stored card.
Unbranded payments processing (Braintree). A technology-agnostic acceptance layer that processes cards, wallets, instalment products, certain cryptocurrencies and local payment methods on behalf of large merchants. [Rating and price target withdrawn — see the note at the top.] Its driver is volume won on price and service terms. Management’s stated pivot to “profitable growth” was executed here: it accepted lower Braintree volume and revenue in the first half of FY2025 while renegotiating merchant terms, before returning to growth in the second half.
Person-to-person money movement (PayPal, Venmo, Xoom). Largely unmonetised in itself, but positioned as both an engagement driver and the cheapest customer-acquisition channel the company has. Its driver is network density.
Consumer credit and BNPL. Buy-now-pay-later in several markets (including Japan under Paidy), interest-bearing instalment products, and, in the U.S., branded credit cards and a revolving credit product issued through a partner chartered financial institution. This is presented as an engagement lever, but economically it is a lending business: its driver is originations multiplied by net credit spread, and it introduces charge-off risk into a company most investors price as a payments network.
Merchant financing (Working Capital, Business Loan). Small-business lending against platform transaction history, originated through an independent chartered bank, deepening merchant lock-in. Driver: merchant volume history and underwriting standards — the latter being the concern discussed in Section 2.
Value-added services and the float. Interest earned on the assets underlying customer balances, the partner-institution revenue share, gateway, subscription and referral fees. [Rating and price target withdrawn — see the note at the top.]
Optionality. PayPal USD under the newly enacted federal stablecoin framework, agentic commerce (payments initiated by AI agents), advertising-related services, cross-wallet interoperability under the PayPal World initiative, and the applications filed with Utah regulators and the FDIC to establish a Utah-chartered industrial loan company. None is yet a business; the bank charter in particular is explicitly disclosed as subject to regulatory approval that may not be granted.
How the system fits together — and where it is fragile. The intended flywheel is coherent: person-to-person transfers and Venmo acquire consumers cheaply; branded checkout monetises them at a high yield; unbranded processing buys scale and merchant relationships at low yield; credit and cards deepen engagement on both sides; and the data generated by sitting on both sides of every transaction is fed back into risk models, conversion and personalisation. The fragility is that the parts of the flywheel that are growing fastest are the parts that earn least. Volume increasingly arrives through the low-yield unbranded channel and through credit, while engagement in the high-yield branded franchise — transactions per active account — had been going backwards, though Section 7 records the first year-over-year rise in the most recent quarter: one quarter of the two the report requires before treating it as a turn. [Rating and price target withdrawn — see the note at the top.] That gap, not the headline revenue line, is the variable that matters.
| Fiscal Year | Total Payment Volume ($M) | Net Revenues ($M) | [Rating and price target withdrawn — see the note at the top.] |
|---|---|---|---|
| FY2016 | $359,928.0M | $10,842.0M | 3.01% |
| FY2017 | $456,179.0M | $13,094.0M | 2.87% |
| FY2018 | $578,419.0M | $15,451.0M | 2.67% |
| FY2019 | $711,925.0M | $17,772.0M | 2.50% |
| FY2020 | $936,062.0M | $21,454.0M | 2.29% |
| FY2021 | $1,245,879.0M | $25,371.0M | 2.04% |
| FY2022 | $1,357,122.0M | $27,518.0M | 2.03% |
| FY2023 | $1,528,579.0M | $29,771.0M | 1.95% |
| FY2024 | $1,681,150.0M | $31,797.0M | 1.89% |
| FY2025 | $1,793,979.0M | $33,172.0M | 1.85% |
Source: Total payment volume is a management-defined operating metric disclosed in MD&A, taken from the FY2018–FY2025 10-Ks, with FY2016 and FY2017 on the restated post-Q1-FY2018 definition; net revenues from the audited consolidated statements of income. Take rate is analyst-computed as net revenues divided by total payment volume. See Appendix A.1.
This table carries more information than any other disclosure in this section. Volume compounded relentlessly across the decade — through the pandemic surge, through the post-pandemic normalisation, through the volume-first era and through the current profitable-growth pivot — while the yield on that volume fell in every one of the last nine years without a single interruption. An erosion that monotonic is not a cyclical artefact and it is not chiefly a pricing decision; it is the arithmetic of a mix in which each incremental dollar of volume tends to arrive through a lower-yielding channel than the dollar before it: unbranded processing rather than branded checkout, and increasingly volume that is bought on price. It also frames what the FY2025 strategy did and did not accomplish. [Rating and price target withdrawn — see the note at the top.] Any thesis on PayPal is ultimately a view on whether that line flattens.
1.3 Geographic Exposure
sources The United States is the single largest market and the only geography PayPal discloses on a stand-alone revenue basis; international operations nonetheless generate a significant portion of net revenues, and the company is licensed to move money across substantially every market where digital commerce is legally addressable. Three geographic realities matter economically.
First, cross-border trade is disproportionately profitable. Management states directly that cross-border transactions generally produce higher revenues and higher operating income than domestic ones. This makes tariffs, trade disputes, sanctions and import/export controls a margin risk, not merely a volume risk — the volume most exposed to trade friction is the volume that earns the most. §
Second, currency exposure is real and only partially hedgeable. Material revenue is denominated in the British pound, euro, Australian dollar, Canadian dollar and Indian rupee. The company runs a cash-flow hedging programme, but management concedes it cannot eliminate the total effect of currency movements — and in FY2025 the hedging programme itself was an explicit drag on transaction-revenue growth. Hedging here transfers volatility across periods; it does not remove it. §
Third, the operating footprint is a regulatory footprint. EU customers are served through a Luxembourg-licensed credit institution, U.K. customers through a U.K.-regulated electronic money institution, and U.S. activity under state money-transmitter licences plus a New York virtual-currency authorisation. Each geography carries its own capitalisation, funds-management, governance and reporting obligations, and management notes that exceeding certain thresholds could bring the Luxembourg entity under direct European Central Bank supervision. The licence portfolio is simultaneously a barrier to entry (§1.6) and a permanent compliance cost; the specific jurisdictional and litigation exposures are assessed in Section 2.
1.4 Management Team
sources PayPal is not a founder-led or family-controlled company, and this section deliberately assesses the leadership situation rather than listing titles. Three points are relevant to an investor.
The anchor is the transformation agenda, not a single executive. Current management’s programme is legible from the filing: a strategic pivot from volume to profitable growth, executed first in unbranded processing; a multi-year re-engineering of technology infrastructure with data-centre exits and cloud migration; a workforce optimisation running alongside it; and a set of new-growth bets in stablecoins, agentic commerce, advertising and cross-wallet interoperability. This is a coherent plan with a long execution tail, and it is the plan on which the equity should be judged.
There is a visible discontinuity with the prior regime. The filing’s legal disclosures reference a former Chief Executive Officer, a former Chief Financial Officer and a former Chief Strategy, Growth and Data Officer as named defendants in securities litigation arising from disclosures about net-new-active-account results. Wholesale turnover at the top of the finance and strategy functions during a turnaround is a real execution risk: institutional knowledge is thinner than the organisation chart suggests, and the credibility of forward targets is built on a shorter track record than a decade-old franchise would imply.
Governance overhang has increased since the 10-K was filed. Shareholder derivative actions filed after the fiscal year-end name officers and directors and, in the newest set, allege insider trading alongside breach of fiduciary duty, in connection with disclosures about branded-checkout growth and the publicly communicated multi-year financial targets. These matters post-date the annual report entirely and are assessed in Section 2; for the purposes of this section, they raise the bar on the governance discount an investor should apply and make the credibility of management’s public targets an explicit variable in the thesis rather than an assumption.
Two mitigating facts deserve equal weight. There is no controlling shareholder and no material related-party transaction structure — the only legacy arrangements of that type are the separation agreements with eBay — so the minority-shareholder extraction risk seen at controlled companies is absent. And the external audit position is clean: an unqualified opinion on both the financial statements and internal control over financial reporting from a firm that has audited the company since long before its separation from eBay, with a single critical audit matter, on the allowance for certain consumer loans receivable, that points precisely where the forensic work in this report points.
1.5 Capital Allocation Track Record
| Year | Dividends Paid ($M) | Share Repurchases ($M) | CapEx ($M) |
|---|---|---|---|
| FY2021 | — | $3,373.0M | $908.0M |
| FY2022 | — | $4,199.0M | $706.0M |
| FY2023 | — | $5,002.0M | $623.0M |
| FY2024 | — | $6,047.0M | $683.0M |
| FY2025 | $130.0M | $6,052.0M | $852.0M |
Source: Company SEC filings (10-K), consolidated statements of cash flows; see Appendix A.1.
The five-year record describes a company that has decisively stopped investing for growth and started liquidating its share count. Repurchases rose in every single year of the window, from $3,373.0M to $6,052.0M, while capital expenditure fell from $908.0M to a trough mid-window before a partial rebuild to $852.0M. [Rating and price target withdrawn — see the note at the top.] For an asset-light platform, spending less than depreciation is not automatically alarming; capitalised internal-use software amortises over a short life and cloud migration converts capital spending into operating expense. But it does establish the direction of travel unambiguously: this is not a company reinvesting to widen its moat. It is one returning cash and re-engineering its cost base, with acquisitions in the period immaterial in scale.
FY2025 marked the structural change in the return mix. The Board initiated the company’s first-ever quarterly cash dividend late in the year, producing the first entry in the dividend column of the table above and a payout ratio of only 2.5% of earnings. The dividend is best read as a signalling instrument — a statement that management now regards the cash generation as durable enough to support a recurring commitment — rather than as a material claim on cash. The buyback remains the entire return story: a buyback yield of 10.7% inside a total shareholder yield of 10.9%, which has taken diluted shares from 1,187M in FY2020 to 1,039M in FY2024 and 968M in FY2025.
Two disciplines should be applied to that record before crediting it. First, the pace of return exceeded internal generation. Repurchases of $6,052.0M plus dividends of $130.0M were larger than free cash flow of $5,564.0M in FY2025, and the gap was bridged in part with new debt while gross borrowings rose. Returning more than the business generates is a defensible choice at a low valuation and an expensive one at a high valuation; it is not a permanent capacity. Second, a shrinking denominator flattered FY2025 per-share growth. [Rating and price target withdrawn — see the note at the top.] Neither is a repeatable source of earnings, and both are already unwinding: in the first half of FY2026 revenue continues to grow while net income falls year over year. The capital allocation is defensible; the FY2025 earnings it produced are lower quality than the headline, and this report does not anchor its case on them.
1.6 Competitive Positioning & Moat
1.6.1 Industry structure
sources Digital payments is not one industry but two stacked on top of each other, with opposite economics. The lower layer — authorising, routing and settling card transactions — is a scale-and-cost business with a commoditising price curve, where the largest processors win on unit cost and merchants re-tender aggressively. The upper layer — owning the consumer relationship at the instant of checkout — is a distribution business, where the owner of the default payment choice captures a materially higher fee because it is selling a measurable conversion uplift to the merchant rather than selling transaction processing. Returns in this industry accrue to whoever controls consumer selection, not to whoever moves the most volume; and the card networks sit above both layers, setting the cost base through interchange and assessments. PayPal is one of the few operators with a genuine position in the upper layer, and it also competes in the lower one.
1.6.2 Competitive advantages
sources The two-sided network and the brand. PayPal’s defining structural feature is that it sits on both sides of the transaction, holding consumer and merchant relationships and the data from both. [Rating and price target withdrawn — see the note at the top.]
Regulatory licensing as a barrier. Management characterises its portfolio of licences as a distinct competitive advantage, and on the evidence it is right: state-by-state U.S. money-transmitter authorisations, a Luxembourg credit-institution licence covering the EU, a U.K. electronic-money-institution licence and a New York virtual-currency authorisation are years and material cost away from replication. The pending application for a Utah industrial loan company charter would deepen this position and reduce dependence on partner banks for origination.
The custodial float. PayPal earns interest on the assets underlying customer balances and pays no interest to customers on those balances, and its Luxembourg regulator permits management to designate a portion of European customer balances to fund European and U.K. credit activities. This is a structurally cheap, regulator-sanctioned funding base that a non-licensed competitor cannot assemble.
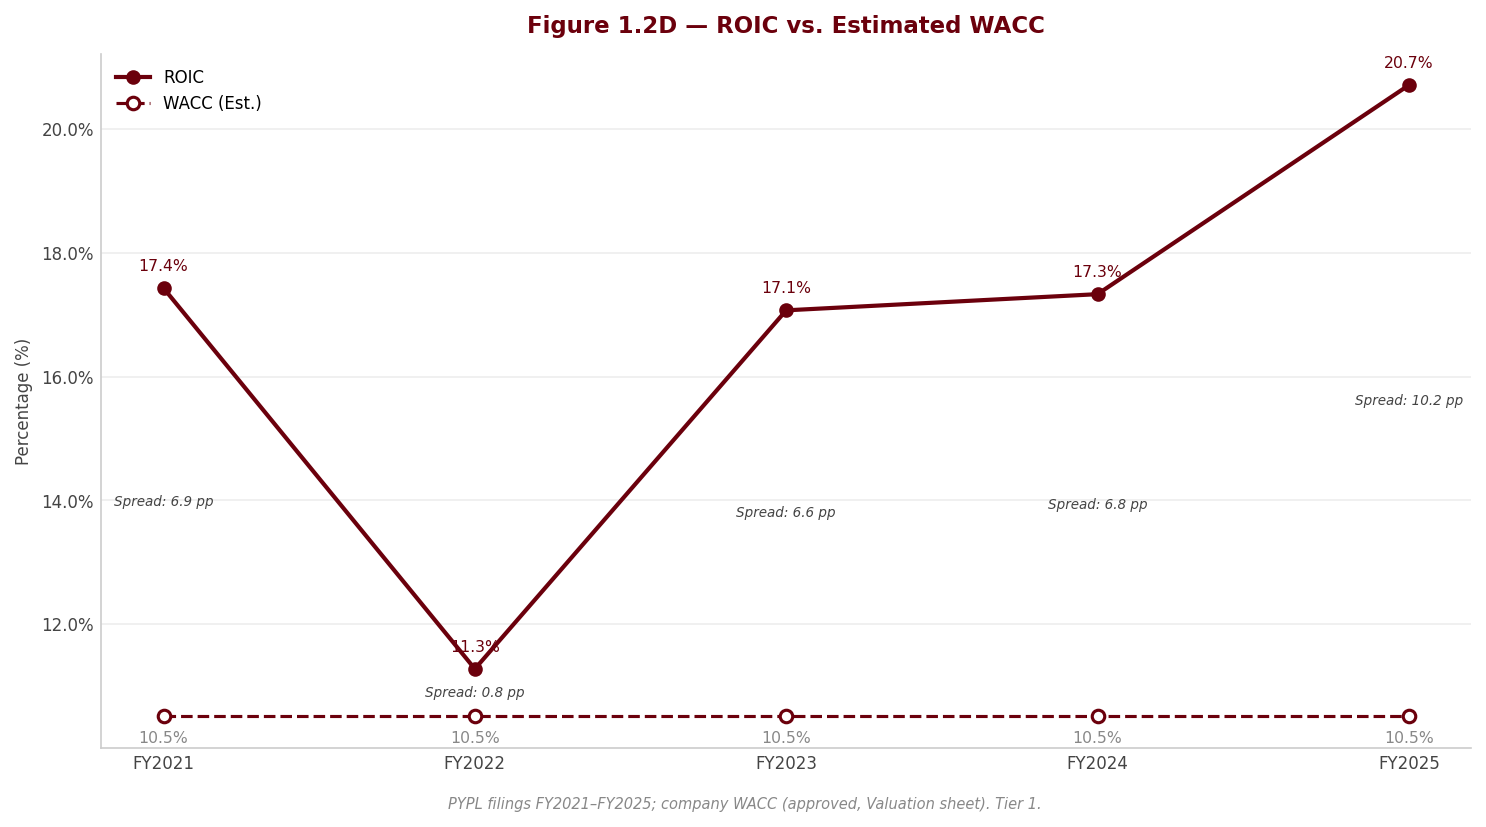
Returns that corroborate the moat. The claims above are supported by outcomes rather than adjectives: an operating margin of 18.3% and a return on invested capital of 20.7% on capital expenditure of only 2.6% of revenue. A business earning that return on that little capital is earning economic rent from something; the licences, the brand and the two-sided data are the plausible sources.
1.6.3 Competitive vulnerabilities
sources The moat is at the checkout button, and the checkout button is the most contested piece of real estate in consumer finance. Device- and operating-system-native wallets, one-click card-on-file services, real-time account-to-account payment schemes, instalment specialists and, prospectively, AI agents transacting on a consumer’s behalf all attack the same choice architecture PayPal depends on — and management itself warns that autonomous agents and distributed-ledger rails could render current technologies obsolete. The observable symptoms are already present, and one of them is measurable: engagement per active account is declining even as volume grows, and the price PayPal captures per dollar it moves has fallen from 3.01% to 1.85% over the period in §1.2. The network is being used less intensively by the customers it has, and is being paid less for each dollar it does move.
Four further vulnerabilities compound this. The cost base is set by counterparties: card networks control interchange and assessments, have imposed fees specifically targeted at digital-wallet transactions and have alleged that aspects of PayPal’s model breach their rules; concentration among the payment processors that carry the largest cost line has been increasing. The funding mix is a margin variable outside management’s control — any shift toward card-funded transactions raises transaction expense directly. The credit book imports a different risk: growing loan originations to sustain value-added-services revenue means importing charge-off cyclicality into a payments multiple, and the merchant portfolio’s credit performance deteriorated after an admitted broadening of borrower eligibility. [Rating and price target withdrawn — see the note at the top.]
1.6.4 Verdict
sources PayPal’s competitive advantage is real but it is a distribution moat, not a cost moat, and it is being monetised at a falling yield. The evidence is unambiguous and it is the strongest single fact in this section: the moat has held volume but it has not held price. Total payment volume grew from $359,928.0M to $1,793,979.0M, and over the same span the yield on that volume fell from 3.01% to 1.85% — lower in every one of the last nine years. [Rating and price target withdrawn — see the note at the top.] Long-run margin durability therefore depends almost entirely on mix — how much volume arrives through branded checkout versus unbranded processing, and how customers fund it — rather than on the cost programmes management is running, which can protect the margin but cannot restore the yield.
That distinction defines the investment debate and frames everything that follows. [Rating and price target withdrawn — see the note at the top.] It is worth stating where that debate sits today, because it governs how the rest of this report should be read. [Rating and price target withdrawn — see the note at the top.] Priced above the bear and below the base, the market has already conceded that the yield keeps falling and is arguing only about how fast. [Rating and price target withdrawn — see the note at the top.]
Section 2 — Key Risks & Catalysts
2.1 Downside Risks
sources PayPal’s risk profile is not the one the market prices when it prices a payments network: the dominant exposure is not transaction volume or macro sensitivity but a structural erosion of pricing power at the checkout button, compounded by a credit book and a loan-distribution machine that have been quietly growing underneath a payments multiple — and, since the annual report was filed, by new securities and derivative litigation alleging that the company concealed exactly that erosion. The most important single fact in this section is that the legal picture in the FY2025 10-K is stale. Investors relying on the annual report alone would materially understate PayPal’s current legal and governance exposure.
Risk 1 — Erosion of the branded checkout franchise, now the subject of a new securities class action
sources This is the risk from which almost everything else in the thesis descends, and it carries a RED forensic flag in two distinct respects.
The economics first. [Rating and price target withdrawn — see the note at the top.] Management attributes the gap to product mix, merchant mix and unfavourable foreign-exchange hedging. Two of those three are structural, not cyclical. Net revenue growth of 4.3% in FY2025 and an operating margin of 18.3% were therefore delivered despite a franchise that is being used less intensively by the customers it already has. This is a YELLOW forensic flag on the operating metrics, and it is the leading indicator an investor should weight most heavily, because engagement per account turns before revenue does.
The blended price PayPal earns per dollar of volume has fallen in every one of the last nine years. The single-segment disclosure means branded and unbranded profitability cannot be verified separately, and that constraint stands. [Rating and price target withdrawn — see the note at the top.] It has declined without a single interruption, from 3.01% in FY2016 to 1.85% in FY2025. [Rating and price target withdrawn — see the note at the top.] This is the mix shift, measured. [Rating and price target withdrawn — see the note at the top.]
| Fiscal Year | Total Payment Volume ($M) | [Rating and price target withdrawn — see the note at the top.] |
|---|---|---|
| FY2016 | $359,928.0M | 3.01% |
| FY2017 | $456,179.0M | 2.87% |
| FY2018 | $578,419.0M | 2.67% |
| FY2019 | $711,925.0M | 2.50% |
| FY2020 | $936,062.0M | 2.29% |
| FY2021 | $1,245,879.0M | 2.04% |
| FY2022 | $1,357,122.0M | 2.03% |
| FY2023 | $1,528,579.0M | 1.95% |
| FY2024 | $1,681,150.0M | 1.89% |
| FY2025 | $1,793,979.0M | 1.85% |
Source: Company SEC filings (10-K, MD&A total payment volume), compiled across five annual reports with every overlapping year in agreement. Total payment volume is a management-defined operating metric disclosed in MD&A — it is not an audited financial-statement figure and is not covered by the auditor’s opinion. PayPal redefined total payment volume in the first quarter of 2018 and restated the earlier years onto the new basis; the series above uses the restated figures throughout and is therefore consistent on a single definition across the full period. Blended take rate is analyst-computed as net revenues divided by total payment volume. See Appendix A.1.
[Rating and price target withdrawn — see the note at the top.] Winning large-merchant unbranded volume at a lower price is still incremental profit if the incremental volume more than covers the incremental transaction expense it carries, and management has been explicit that it deliberately accepted lower unbranded volume and revenue in the first half of the year while renegotiating merchant terms — the opposite of buying volume at any price. [Rating and price target withdrawn — see the note at the top.] The question the trend poses, and which the single-segment disclosure prevents an investor from answering directly, is whether the volume gained compensates for the price given up. Nine uninterrupted years of decline, arriving alongside falling transactions per active account, is at minimum consistent with the less comfortable answer: that price is being conceded in the high-value branded channel as well as in the low-yield unbranded one, in which case the volume is not compensating — it is disguising.
The competitive mechanism is well disclosed and credible. Management warns that real-time payment systems, tokenisation, contactless and QR solutions, card-on-file services, distributed-ledger rails, generative AI and autonomous AI agents transacting on a consumer’s behalf could render current technologies obsolete. Every one of those attacks the same thing: the consumer’s choice at the moment of checkout. PayPal does not own the operating system, the browser or, increasingly, the agent that will make that choice.
The legal expression of this risk is the RED flag that supersedes the 10-K entirely. The forensic review of the most recent quarterly filing discloses that two putative securities class actions filed after the fiscal year-end were consolidated as In re PayPal Branded Checkout Securities Litigation, alleging that the company failed to disclose impediments to its branded-checkout growth strategy that impaired its ability to meet its publicly communicated multi-year financial targets. A cluster of related shareholder derivative actions, alleging breach of fiduciary duty and insider trading, was consolidated shortly afterwards. Separately, the older securities action concerning net-new-active-account disclosures was dismissed with prejudice at first instance and is now on appeal. None of this existed in the annual report. Accruals are characterised as not material and the matters are early-stage, so the near-term financial exposure is the defence cost and the management distraction rather than a settlement provision; the real exposure is that a contested, document-heavy discovery process now sits on top of the exact operating question the equity turns on, and that any adverse factual finding about what management knew when it set its forward targets converts a growth debate into a credibility event.
Probability: High (the erosion is measured, not inferred; the litigation already exists) | Timeframe: Immediate, with legal resolution over 3–5 years | Quantified potential impact: Partially quantifiable. [Rating and price target withdrawn — see the note at the top.] What remains unquantifiable is the split — the company reports a single segment and discloses no branded-versus-unbranded profitability, so an investor cannot establish how much of the decline is deliberate low-yield mix and how much is price erosion inside the branded franchise itself. That disclosure gap is itself part of the risk.
Risk 2 — Merchant-loan credit quality deteriorated after management broadened borrower eligibility
sources A RED forensic flag, and the one most likely to be underestimated by investors who think of PayPal as a payments company rather than a lender.
PayPal’s value-added-services revenue depends increasingly on interest and fees from its consumer and merchant loan books. [Rating and price target withdrawn — see the note at the top.] Critically, management’s own explanation for the increase in the allowance attributes the decline in credit quality to modifications in acceptable risk parameters made in the prior year, which included broadened eligibility. [Rating and price target withdrawn — see the note at the top.] The estimation risk in this company sits in credit, and both management and the auditor say so. §
Why it hits the financials: credit losses run through transaction and credit losses in operating expenses, so provisioning flows straight to operating income; a deterioration also reduces the revenue share PayPal earns from its partner chartered financial institution (Risk 4); and it raises the cost and shrinks the appetite of the third-party investors who buy PayPal’s loans (Risk 3). What would make it materialise further: rising unemployment or falling small-business receipts feeding the externally sourced macroeconomic forecasts that drive the allowance models. §
Probability: Medium-to-High for continued deterioration in the merchant book; Medium for a broader credit event | Timeframe: 1–2 years | Impact: Direct and recurring pressure on operating income, on the value-added-services revenue line, and on the partner revenue share. The merchant book is smaller than the consumer book, which bounds the immediate loss, but a broadening into the consumer portfolio would strike the Critical Audit Matter directly.
Risk 3 — The off-balance-sheet loan-distribution machine, and the repurchase tail it leaves behind
sources A RED forensic flag, and the most technically obscure risk in the filing.
PayPal originates loans and then sells large volumes of them to third-party investors under multi-year forward-flow agreements that were extended during the year and carry very large committed capacity. The forensic footnote review establishes three distinct problems with how this is presented. First, the recurring net losses on sale and the lower-of-cost-or-fair-value adjustments on these loans are recorded inside the line labelled restructuring and other — a line investors habitually treat as non-recurring — and those loss amounts have grown in each of the last three years. A growing, credit-driven, structurally recurring cost is therefore sitting inside a caption that most screens and most adjusted-earnings measures add back. Second, the economic credit exposure is larger than the balance sheet shows: PayPal retains a contingent obligation to indemnify the purchasers or repurchase the loans, and the disclosed maximum potential exposure equals the entire outstanding balance of the loans sold — a balance that grew materially year over year and has grown further since. Third, the loans held for sale and the proceeds from selling them both run through operating activities, so reported operating cash flow moves with the loan-warehousing cycle rather than with core payments economics; this is a separate YELLOW flag on cash-flow quality and the principal reason free cash flow of $5,564.0M should not be read as a clean measure of the payments business. The company nonetheless states that it has no off-balance-sheet arrangements with a material effect. That characterisation deserves scepticism.
What would make it materialise: a credit deterioration that triggers representation-and-warranty or indemnity claims, or a withdrawal of forward-flow investor appetite — which would force PayPal to retain originations on its own balance sheet precisely when its capital is committed elsewhere.
Probability: Low-to-Medium for a claim event; High that the reported earnings quality is overstated by the classification | Timeframe: Immediate for the earnings-quality distortion; 1–2 years for a funding or indemnity event | Impact: Not directly quantifiable — the contingent maximum is disclosed but no probability is attached. The analytically material point is that operating credit costs and true operating cash generation are both flattered by presentation.
Risk 4 — PayPal does not control its own cost base or its own operating stack
sources The single largest cost in this business is transaction expense, and PayPal sets almost none of it.
The card networks set interchange and assessments, have introduced fees aimed specifically at digital-wallet transactions that PayPal’s processors may pass through, and have alleged that aspects of PayPal’s model breach their operating rules — a dispute that can end in fines or forced, costly changes to how the wallet works. The forensic review of the concentrations footnote adds a second layer: a clear majority of transaction expense now flows through a very small number of payment processors, and that concentration increased year over year, reducing PayPal’s negotiating leverage over its largest cost line. A third layer is the funding mix, which management explicitly identifies as a direct driver of profitability — card-funded transactions cost materially more than bank-, balance- or own-credit-funded ones — and which is determined by consumer behaviour, not by management.
A fourth exposure is asymmetric and easy to miss. A meaningful revenue stream is a revenue share earned from an independent chartered financial institution on U.S. revolving credit and branded credit-card programmes. PayPal earns it only when programme performance exceeds a minimum return threshold; if the threshold is missed the share falls to zero, and if it is missed over four consecutive quarters and the following quarter, PayPal would be required to make a payment to the partner. This is a YELLOW forensic flag and it converts a revenue line into a potential liability under precisely the credit conditions described in Risk 2. Management states the threshold was exceeded through the year-end. §
Finally, PayPal relies on unaffiliated banks to originate U.S. branded consumer credit and merchant financing, on third-party custodians for customer cryptocurrency, and on external cloud and data-centre providers for the platform itself. The filing’s own disclosure of a service disruption in Germany caused by a coding error in a system update — which produced fraudulent transaction activity, transaction losses and protection-programme claims — demonstrates how directly an operational failure converts into a P&L charge in this model. §
Probability: High (several elements are already in effect) | Timeframe: Immediate and continuous | Impact: Margin-level rather than event-level. Each element compresses the spread between transaction revenue and transaction expense, which is the only true unit-economics measure this company reports.
Risk 5 — A regulatory, legal and tax perimeter that is wide, active, and expanding
sources PayPal is regulated as a payments company, a lender, an electronic money institution, a credit institution and a virtual-currency business simultaneously, and management warns that a single event can trigger overlapping investigations across multiple jurisdictions. §
The active matters disclosed in the annual report are not trivial: Federal Trade Commission civil investigative demands covering both the practices of commercial customers submitting charges on behalf of other merchants and whether PayPal’s onboarding and due-diligence practices facilitated deceptive merchant schemes; Consumer Financial Protection Bureau demands on error-resolution obligations under Regulation E, on the presentment of transactions to linked bank accounts, and on PayPal Credit and wallet backup payment options; and a German Federal Cartel Office proceeding concerning contractual terms that prohibit merchant surcharging and require parity presentation of PayPal against other payment methods. The forensic review of the latest quarterly filing adds a further matter that post-dates the annual report: a U.K. Financial Conduct Authority competition investigation into PayPal’s contractual agreements with the card networks governing the funding and use of the digital wallet. The German and U.K. matters are the ones with genuine business-model consequence — surcharging and parity clauses are what protect PayPal’s price against cheaper alternatives at the checkout, and if they are struck down, the pricing power discussed in Risk 1 is attacked from the regulatory side as well as the competitive one. §
Lending regulation is a parallel exposure: global regulatory focus on short-term instalment products is intensifying, and there remains unresolved legal uncertainty over whether a non-bank purchaser of bank-originated receivables can rely on federal preemption of state usury laws — the “valid-when-made” question — which reaches directly into the merchant-loan model. The cryptocurrency perimeter adds its own: the stablecoin framework enacted during the year is still being implemented, PayPal depends on a third-party issuer to maintain adequate reserve assets, and customer crypto holdings sit with third-party custodians in a legal regime where bankruptcy courts have not definitively established whether contractually segregated digital assets stay outside a failed custodian’s estate. §
Finally, tax. A YELLOW forensic flag covers a large and growing balance of gross unrecognised tax benefits with substantial accrued interest and penalties, open examinations spanning more than a decade of tax years across several jurisdictions, a materially increased deferred-tax valuation allowance reflecting reduced confidence that certain U.S. attributes will be realised, and a significant unrecognised-tax-benefit liability excluded from the contractual-obligations table because its timing cannot be predicted. [Rating and price target withdrawn — see the note at the top.]
Probability: High that some matters resolve adversely; Low-to-Medium for any single material one | Timeframe: 1–2 years for investigations; 3–5 years for tax examinations | Impact: Management states accrued and reasonably possible losses are not material, and there is no reason to doubt that for the currently disclosed set. The asymmetry is that the surcharging/parity and network-agreement matters carry business-model consequences well in excess of any fine.
2.2 Upside Catalysts
sources The catalyst picture is genuinely thinner than the risk picture, and this report will not pretend otherwise: five material risks against four catalysts, three of the risks carry RED forensic flags, and three of the four catalysts are unpriced options gated on either regulatory approval or an operating inflection that has not yet begun.
[Rating and price target withdrawn — see the note at the top.] At $61.66, the market sits between this report’s downside case of $51.62 and its base case of $63.46 — below fair value, but no longer at the floor, with real room beneath the price. That distinction matters more than it sounds. An investor buying at the downside scenario is paid simply for the absence of further deterioration; an investor buying above it is underwriting an actual improvement, and is exposed if Risk 1 continues to run. The downside case in the separate valuation models exactly that continuation, which is why it now sits materially below the market rather than at it. [Rating and price target withdrawn — see the note at the top.] The catalyst picture below is therefore more demanding than the share price alone implies, not less.
Catalyst 1 — An inflection in branded-checkout engagement
[Rating and price target withdrawn — see the note at the top.] That sequence would simultaneously defuse the operating premise of the branded-checkout securities litigation.
Probability: Medium | Timeframe: 1–2 years | Monitoring trigger: Payment transactions per active account. This is the cleanest single disclosed metric for the thesis; two consecutive quarters of stabilisation would be the first credible evidence, and continued decline is confirmation that the separate valuation’s downside path is the one being travelled.
Catalyst 2 — Cost programme execution and the capital-return arithmetic at a de-rated price
sources Management is running a multi-year re-engineering of technology infrastructure — data-centre exits, cloud migration and workforce optimisation — expected to deliver annualised savings, and has announced a further and substantially larger reorganisation since the annual report was filed. This is a real margin lever, and it is the lever most within management’s control. §
It must be credited with two explicit discounts. First, a YELLOW forensic flag records that restructuring charges have appeared in every one of the last several years, with multiple plans in the most recent year and another announced since — a charge that recurs annually is a cost of doing business, not a one-off, and any adjusted-earnings measure that adds it back overstates sustainable earnings. Second, management has stated it intends to reinvest a portion of the savings, so the flow-through to margin will be partial. [Rating and price target withdrawn — see the note at the top.] That is genuine per-share value creation — but only on three conditions: that the cash flow being spent is durable, that the pace does not continue to exceed internal generation as it did in FY2025, and that the shares are actually worth more than is being paid for them. The third condition is no longer safe to assume. [Rating and price target withdrawn — see the note at the top.]
Probability: Medium-High for the cost savings; High for the buyback mechanics | Timeframe: 1–2 years | Monitoring trigger: Operating margin excluding restructuring, held against the announced savings target; and the ratio of capital returned to free cash flow, which should fall back below one.
Catalyst 3 — Approval of the proposed industrial loan company charter
sources PayPal has applied to state and federal regulators to establish a Utah-chartered industrial loan company. This is the most structurally significant of the optionality items because of what it would fix rather than what it would add: it would reduce PayPal’s dependence on unaffiliated partner banks to originate U.S. branded consumer credit and merchant financing, give it a regulated deposit-funded balance sheet against which to lend, and diminish the asymmetric partner-institution revenue-share arrangement described in Risk 4 — a contingent revenue stream that can fall to zero and reverse into a payment obligation. It would, in short, convert several of the dependencies in this section into owned capabilities.
Management explicitly cautions there is no assurance the applications will be approved, and industrial loan company charters have a long history of contested approval.
Probability: Low-to-Medium | Timeframe: 1–2 years to a decision; 3–5 years to financial effect | Monitoring trigger: Any published regulatory decision or withdrawal; and, if approved, whether merchant and consumer originations begin migrating off the partner-bank programme agreements.
Catalyst 4 — New rails: stablecoin, agentic commerce, advertising and wallet interoperability
sources Management names its stablecoin under the newly enacted federal framework, payments initiated through AI agents, advertising-related services built on two-sided transaction data, and cross-wallet interoperability as its new areas of growth. Each is a plausible option on the network PayPal already owns, and none is yet a business. Agentic commerce is the analytically interesting one because it is simultaneously the largest threat in Risk 1 and a catalyst here: if PayPal becomes the settlement layer that AI agents transact through, the same technology that could disintermediate the checkout button instead entrenches it. Advertising is the most immediately monetisable, and the most exposed to the privacy and cross-contextual-advertising rules discussed in §2.5.
Probability: Low individually, Medium that at least one contributes meaningfully | Timeframe: 3–5 years | Monitoring trigger: Any disclosure that moves these initiatives from the strategy narrative into the revenue discussion — specifically, their first appearance as a named driver of value-added-services revenue.
2.3 Risk & Catalyst Summary
| # | Item | Type | Probability | Timeframe | Status | Monitoring Trigger |
|---|---|---|---|---|---|---|
| 1 | [Rating and price target withdrawn — see the note at the top.] | Risk | H | Immediate; legal 3–5 yrs | Active | [Rating and price target withdrawn — see the note at the top.] |
| 2 | Merchant-loan credit deterioration after broadened borrower eligibility | Risk | M–H | 1–2 yrs | Active | [Rating and price target withdrawn — see the note at the top.] |
| 3 | Forward-flow loan sales: recurring losses inside “restructuring and other”; repurchase and indemnity tail | Risk | L–M (claim); H (earnings-quality distortion) | Immediate to 1–2 yrs | Active | Loans held for sale; outstanding balance of loans sold; loss-on-sale inside restructuring and other |
| 4 | Cost base and operating stack controlled by counterparties: networks, processor concentration, funding mix, partner revenue share | Risk | H | Immediate, continuous | Active | [Rating and price target withdrawn — see the note at the top.] |
| 5 | Regulatory, legal and tax perimeter: FTC, CFPB, German cartel office, U.K. competition investigation, lending and crypto rules, tax contingencies | Risk | H (some adverse); L–M (any single material) | 1–2 yrs; tax 3–5 yrs | Active | Surcharging and parity rulings; network-agreement investigation; unrecognised tax benefits and valuation allowance |
| 6 | Branded-checkout engagement inflection | Catalyst | M | 1–2 yrs | Monitoring | Two consecutive quarters of stabilising transactions per active account |
| 7 | [Rating and price target withdrawn — see the note at the top.] | Catalyst | M–H | 1–2 yrs | Active | Operating margin ex-restructuring; capital returned as a proportion of free cash flow |
| 8 | Industrial loan company charter approval | Catalyst | L–M | 1–2 yrs to decision | Latent | Published regulatory decision; migration of originations off partner-bank programmes |
| 9 | New rails: stablecoin, agentic commerce, advertising, wallet interoperability | Catalyst | L individually | 3–5 yrs | Latent | First appearance as a named driver of value-added-services revenue |
Source: Company SEC filings (10-K and subsequent 10-Q) and forensic footnote review; see Appendix A.1.
2.4 Risk Interdependencies
sources These risks are not independent draws. They share a single underlying variable — consumer and small-business credit conditions — and a single accounting channel, and the correlation between them is what makes the tail worse than the sum of its parts.
The credit chain is the dangerous one. A deterioration in consumer or small-business credit does four things simultaneously, and each amplifies the others. It raises charge-offs and allowance builds on the loans PayPal retains, hitting operating income directly (Risk 2). It threatens the minimum return threshold on the partner-institution branded credit programmes, which does not merely reduce a revenue line but can invert it into a payment obligation — a revenue stream turning into a cash outflow at the exact moment credit costs are rising (Risk 4). It widens the loss on sale and the lower-of-cost-or-fair-value adjustments in the forward-flow programme, and if it goes far enough it reduces third-party investor appetite altogether, forcing PayPal to retain originations on its own balance sheet and consuming liquidity (Risk 3). And it activates the repurchase and indemnity tail on loans already sold, which is precisely the exposure that is off the balance sheet. A single macroeconomic input therefore hits the income statement, the revenue line, the funding model and a contingent liability at once. That is not diversification; it is four expressions of one bet.
[Rating and price target withdrawn — see the note at the top.] That cuts both ways in the litigation — a publicly observable trend is a weaker basis for a concealment claim — but it cuts only one way for the equity: the impediment is real, it is measurable, and it did not begin with the class period. The two therefore materialise together and cannot be hedged against each other. Worse, the remedy for the operating problem — growing volume through Braintree and growing value-added-services revenue through lending — accelerates both the mix shift and the credit build. The strategy that defends revenue is the strategy that dilutes the quality of that revenue.
Presentation risk compounds economic risk. Three separate mechanisms make the reported numbers look better than the economics: recurring loan-sale losses sitting inside a caption investors treat as one-time; operating cash flow moving with gross held-for-sale loan flows rather than payments economics; and a single reportable segment that makes the branded-versus-unbranded profitability trade-off unverifiable from disclosure. None of these is an accounting irregularity — each is properly disclosed. But together they mean that if the credit chain or the mix chain does deteriorate, the reported financials will register it late, and the market’s repricing when it does register will be correspondingly abrupt.
The combination that would be disproportionately damaging is therefore a consumer credit downturn arriving while branded-checkout share continues to erode: revenue quality and revenue growth deteriorate at once, the credit book’s contribution to value-added services reverses, the forward-flow funding channel tightens, the partner revenue share flips to a cost, and the securities litigation gains its factual predicate — all while capital returns that already exceeded free cash flow in FY2025 either have to be cut or funded with more debt. Return on invested capital of 20.7% today provides a real cushion, but it is a cushion built on the current mix, not on a defended one.
2.5 ESG & Regulatory Exposure
sources Environmental exposure is immaterial to the economics and material only to compliance cost. PayPal is an asset-light network with no meaningful direct emissions profile; the relevant disclosure is that management identifies evolving and sometimes conflicting climate-related disclosure and diligence requirements as a compliance-cost risk, and that it reports its sustainability activity through an annual impact report rather than through the financial statements. Investors should treat environmental factors here as a reporting-burden item, not a valuation item. The one substantive environmental-adjacent consideration is the multi-year exit from owned data centres into third-party cloud infrastructure, which is being executed for cost and scalability reasons rather than environmental ones.
Social exposure is concentrated in consumer protection and data — and it is where the regulator actually shows up. The disclosed matters are specific: civil investigative demands from the Consumer Financial Protection Bureau on error-resolution obligations under Regulation E, on the presentment of transactions to linked bank accounts and on PayPal Credit and wallet backup payment options; a state consumer-protection action alleging unfair and deceptive practices, settled late in the year; and management’s own disclosure that it has previously paid to settle lawsuits alleging it improperly held consumer funds or improperly limited consumer accounts. Violations of statutes such as the Electronic Fund Transfer Act carry statutory and treble damages, so the exposure is not proportionate to actual consumer harm. Privacy is the second social axis and it interacts directly with strategy: the rules developing around personalisation, cross-contextual advertising and youth-specific obligations are precisely the rules that govern the advertising-services catalyst in §2.2, and the rapidly forming legal framework for artificial intelligence — including the European Union’s dedicated regime — governs the agentic-commerce initiative. In both cases, the regulatory constraint applies to the growth option rather than to the existing business. Anti-money-laundering, counter-terrorist-financing and sanctions compliance form a third axis; management discloses that it has voluntarily identified and reported potential compliance issues to U.S. sanctions authorities, which is the correct behaviour but does establish that the exposure is live.
Governance is the axis that has deteriorated, and it has deteriorated since the annual report was filed. The pre-existing derivative actions relating to net-new-active-account disclosures named former senior executives and board members and were stayed. The new set, consolidated after the fiscal year-end, alleges breach of fiduciary duty and insider trading in connection with disclosures about branded-checkout growth and the publicly communicated multi-year targets. An insider-trading allegation against officers and directors is a different category of governance risk from a disclosure dispute, and it justifies a wider governance discount than PayPal’s structure would otherwise warrant. Three mitigants deserve equal weight and are documented in the forensic review as clean areas: there is no controlling shareholder and no material related-party transaction structure beyond the legacy separation agreements with eBay, so minority-shareholder extraction risk is absent; the external auditor, in place since well before the separation, issued an unqualified opinion on both the financial statements and internal control over financial reporting, with no going-concern or emphasis-of-matter language; and board oversight of the information-security programme is explicitly structured, with a dedicated risk and compliance committee receiving regular reporting from the chief information security officer against recognised external frameworks.
The regulatory perimeter itself is the defining structural feature. As set out in Section 1, PayPal’s licence portfolio — U.S. state money-transmitter authorisations, a New York virtual-currency licence, a Luxembourg credit-institution licence covering the European Union and a U.K. electronic money institution licence — is simultaneously the barrier to entry that protects the franchise and the permanent cost and exposure that constrains it. Each carries capitalisation, funds-management, governance and reporting obligations; management notes that exceeding certain thresholds could bring the Luxembourg entity under direct European Central Bank supervision, which would raise the standard of prudential oversight applied to a business currently valued as a technology platform. Two pending regulatory decisions will move this perimeter in opposite directions: the industrial loan company charter application would widen PayPal’s own regulated capabilities, while the competition proceedings in Germany and the United Kingdom could narrow the contractual protections — surcharging prohibitions, parity presentation, and the wallet-funding agreements with the card networks — on which its pricing at the checkout depends. For an investor, the practical conclusion is that regulation is not a background compliance cost at PayPal. [Rating and price target withdrawn — see the note at the top.]
Section 3 — Financial Analysis & Historical Performance
sources Three-Statement Linkage Confirmation
- Net income (Income Statement → Cash Flow Statement): ties. Net income of $5,233.0M is the opening line of the operating section of the cash-flow statement in each year of the window, with no reconciling difference and no non-controlling interest to bridge.
- Cash (Balance Sheet → Cash Flow Statement): ties, but only at the combined caption — and the distinction is material. The cash-flow statement reconciles to cash, cash equivalents and restricted cash, the restricted portion being the assets underlying customer balances. The corporate cash and cash equivalents line on the balance sheet, $8,049.0M, is therefore one component of that total, not the total itself. The forensic review confirms that movements in custodial balances are split across the statement — funds receivable and customer accounts in investing, funds payable and amounts due to customers in financing — so the geography of PayPal’s cash-flow statement is set by a regulatory construct rather than by operating activity. No liquidity ratio in this section should be read as if the corporate cash line and the reconciled cash total were the same thing.
- Retained earnings roll-forward: ties. Opening retained earnings plus net income less dividends reconciles to closing retained earnings of $32,470.0M. In FY2023 and FY2024 the roll-forward is exact; in FY2025 a small positive residual is fully explained by the cumulative-effect adjustment on adopting the new crypto-asset accounting standard, not by an unexplained equity charge. Share repurchases do not pass through retained earnings, which is why retained earnings compound while total equity does not.
3.1A Income Statement
Source: Company SEC filings (10-K), consolidated statements of income; D&A and stock-based compensation from the consolidated statements of cash flows. PayPal presents no cost of revenue, no gross profit and no inventory — the statement runs from net revenues directly to total operating expenses to operating income, so the first margin this business reports is the operating margin, and no gross-margin line exists to be shown. Transaction expense, the largest single cost, sits inside total operating expenses and is not a cost of goods sold. Interest expense is not presented on the face of the income statement in any year: it is disclosed inside the “other income (expense), net” reconciliation in the notes, and is shown above on that basis. Growth rates, margins and effective tax rates are analyst-computed. See Appendix A.1–A.2.
CAGR Summary
| Metric | 3Y CAGR | 5Y CAGR |
|---|---|---|
| Net revenues | 6.4% | 9.1% |
| EBITDA | 10.9% | 9.4% |
| Net income | 29.3% | 4.5% |
| Diluted EPS | 37.3% | 8.9% |
| Operating cash flow | 3.3% | 1.9% |
| Free cash flow | 2.9% | 2.2% |
| Diluted shares | -5.8% | -4.0% |
Source: Company SEC filings (10-K); compound annual growth rates are analyst-computed from the FL model. Ten-year CAGRs are not presented: the extracted history begins in FY2016, the earliest comparative year carried in the oldest annual report obtained. See Appendix A.1–A.2.
[Rating and price target withdrawn — see the note at the top.] The five-year column is the more honest one, and it contains the single most important arithmetic in this section. Over five years net income compounded at 4.5% while diluted EPS compounded at 8.9% — and the diluted share count fell at -4.0% a year. Essentially all of the gap between earnings growth and per-share earnings growth is the buyback. Meanwhile operating cash flow compounded at 1.9% and free cash flow at 2.2%, against revenue at 9.1%. [Rating and price target withdrawn — see the note at the top.]
3.1B Income Statement — Analysis
The revenue story: more volume, less price
sources PayPal’s top line is the product of two variables — how much money crosses the network, and how much of each dollar the company keeps. Over the last decade the first has multiplied and the second has fallen every single year. Total payment volume rose from $359,928.0M in FY2016 to $1,793,979.0M in FY2025, an increase of roughly five times; net revenues rose from $10,842.0M to $33,172.0M, an increase of roughly three times. [Rating and price target withdrawn — see the note at the top.]
| Fiscal Year | Total Payment Volume ($M) | [Rating and price target withdrawn — see the note at the top.] | Revenue Growth | Operating Margin | ROIC |
|---|---|---|---|---|---|
| FY2016 | $359,928.0M | 3.01% | - | 14.6% | - |
| FY2017 | $456,179.0M | 2.87% | 20.8% | 16.2% | 12.3% |
| FY2018 | $578,419.0M | 2.67% | 18.0% | 14.2% | 15.9% |
| FY2019 | $711,925.0M | 2.50% | 15.0% | 15.3% | 18.3% |
| FY2020 | $936,062.0M | 2.29% | 20.7% | 15.3% | 14.1% |
| FY2021 | $1,245,879.0M | 2.04% | 18.3% | 16.8% | 17.4% |
| FY2022 | $1,357,122.0M | 2.03% | 8.5% | 13.9% | 11.3% |
| FY2023 | $1,528,579.0M | 1.95% | 8.2% | 16.9% | 17.1% |
| FY2024 | $1,681,150.0M | 1.89% | 6.8% | 16.7% | 17.3% |
| FY2025 | $1,793,979.0M | 1.85% | 4.3% | 18.3% | 20.7% |
Source: Total payment volume is a management-defined operating metric disclosed in MD&A across the FY2018–FY2025 Forms 10-K — it is not an audited financial-statement figure and is not covered by the auditor’s opinion. PayPal redefined total payment volume in the first quarter of 2018 and restated the earlier years onto the new basis; the series above uses the restated FY2016 and FY2017 figures throughout, so it is internally consistent on a single definition but will not agree with a pre-FY2018 filing. Take rate is analyst-computed as net revenues divided by total payment volume; revenue growth, operating margin and return on invested capital are analyst-computed from the FL model. Revenue growth and return on invested capital are not computable for FY2016, the first year of the extracted history. See Appendix A.1–A.2.
[Rating and price target withdrawn — see the note at the top.] Read the columns together and the last four years tell a coherent, uncomfortable story: the yield fell, revenue growth decelerated in every year from 18.3% in FY2021 to 4.3% in FY2025, and yet the operating margin and the return on invested capital both rose to the highest levels in the series. Those movements are not in tension. They are the same fact seen from two sides.
The mechanism is mix, and management describes it plainly. [Rating and price target withdrawn — see the note at the top.] The FY2025 margin expansion is therefore substantially the proceeds of shrinking the low-quality half of the business, which is a defensible strategy and a finite one. There is only so much unprofitable volume to shed, and once it is gone the margin lever goes with it. One further qualification belongs with it, and it is a YELLOW forensic flag: the majority of transaction expense — the largest single cost in the income statement — now flows through a very small number of payment processors, and that concentration increased during the year. [Rating and price target withdrawn — see the note at the top.]
Three further points on revenue quality follow from the same table. [Rating and price target withdrawn — see the note at the top.] Second, management’s own attribution of the FY2025 gap between volume growth and revenue growth — product mix, merchant mix, and unfavourable foreign-exchange hedging — is two-thirds structural and one-third a timing transfer; hedging moves currency effects between periods rather than removing them. [Rating and price target withdrawn — see the note at the top.] In other words, an increasing share of the growth that is holding the top line together is lending revenue and float revenue. [Rating and price target withdrawn — see the note at the top.] Neither is the branded-checkout franchise that justifies the multiple.
Margin trajectory
sources The operating margin of 18.3% is the highest in the ten-year series assembled here, up from 16.7% and well above the 13.9% trough of FY2022. This is a real improvement and it should be credited as one — but its composition matters more than its level, because three of the four contributing forces are either finite or mechanical.
The first is the mix effect described above, which is management’s deliberate work and the most defensible part of the gain. The second is cost containment of an unusually literal kind: technology and development expense was $3,103.0M in FY2025 against $3,038.0M in FY2021, essentially unchanged in nominal dollars over four years in which revenue grew from $25,371.0M to $33,172.0M, while sales, marketing and administrative expense actually fell in absolute terms from $4,559.0M to $4,262.0M. That combined line conceals a split worth stating: within FY2025 the fall is entirely general and administrative — sales and marketing ROSE by roughly a seventh year over year, which is the opposite of a company starving its commercial spend, and it sits oddly beside the 6% decline in the same line in the June quarter reported in Section 7. Margin produced by holding engineering spend flat for four years in a business whose central competitive threat is technological is margin borrowed from the future, not earned in the present — and it sits awkwardly beside the engagement deterioration documented in Section 2.
The third force is stock-based compensation, which has fallen from a peak of $1,475.0M in FY2023 to $1,002.0M. This is a genuine quality improvement — lower non-cash compensation with a simultaneously shrinking share count means less of the buyback is being spent offsetting dilution — and it deserves credit without qualification.
The fourth is the quietest and the least durable. Depreciation and amortisation has fallen from $1,317.0M in FY2022 to $963.0M in FY2025 as acquisition-related intangibles amortise away and owned data centres migrate to third-party cloud. Falling depreciation flows straight into operating margin without any operating improvement whatsoever. The evidence is in the EBITDA line: EBITDA margin of 21.2% remains below the 22.4% recorded in FY2017, even though the operating margin is at a series high. The wedge between the two margins has narrowed sharply over the period, and that narrowing is the depreciation roll-off, not operating leverage. It also reverses: capital expenditure has begun rebuilding from its FY2023 trough of $623.0M to $852.0M, and capital expenditure now runs at 0.9x depreciation against 0.5x in FY2022.
Major movers
sources Mover 1 — The branded/unbranded mix shift (structural, adverse to revenue, favourable to margin). The dominant driver of both the top line and the margin. [Rating and price target withdrawn — see the note at the top.] Historically it has run in one direction for nine years. It is structural, and the FY2025 version of it — deliberately shedding low-yield volume — is a finite lever rather than a repeatable growth engine.
Mover 2 — Operating cost containment and the depreciation roll-off (part structural, part mechanical). Flat technology spend, falling administrative and marketing spend, falling stock-based compensation and falling depreciation together carried a large share of the move from 13.9% to 18.3%. The cost programme is real and management has announced further phases; the depreciation component is arithmetic and reverses as capital expenditure rebuilds toward replacement.
Mover 3 — Below-the-line gains on strategic investments (temporary, volatile, and already reversing) — RED forensic flag. The forensic review establishes that a large share of the FY2025 net-income increase came not from operations but from a swing in non-cash fair-value marks on strategic investments — including privately held, illiquid positions carried under the measurement alternative — recorded in other income (expense), net. Management itself warns that these adjustments flow directly through net income and that it expects continued volatility. The distortion is visible in the model’s own extended DuPont decomposition without recourse to the footnotes: the interest-burden ratio, which measures how much of operating income survives to pre-tax income, was 1.037x in FY2025 against 1.001x in FY2024 — a figure above parity meaning that non-operating items added to pre-tax profit rather than subtracting from it, despite interest expense rising to $441.0M. The same line ran the other way in FY2022 at 0.877x, which is precisely why net income moved -42.0% that year while operating income fell by a fraction of that. This one line has swung reported earnings by hundreds of millions in both directions across the decade, and the forensic review confirms it has already reversed into a net expense in the first half of FY2026.
[Rating and price target withdrawn — see the note at the top.]
Mover 5 — The share count (durable, but purchased with cash). Diluted shares fell from 1,186M in FY2021 to 968M in FY2025, a reduction that on its own converted net income growth of 26.2% into EPS growth of 35.6% in FY2025. This is genuine per-share value creation and it is the most reliable of the five movers — but it is bought with cash that the FY2025 free cash flow did not fully cover, which is the subject of §3.3B.
Mover 6 — Credit revenue and credit cost (structural, and pointing the wrong way) — RED forensic flag. Growth in value-added services revenue is increasingly interest and fee income from the consumer and merchant loan books. [Rating and price target withdrawn — see the note at the top.] Credit losses run through transaction and credit losses inside operating expenses, so provisioning is an operating-margin item, not a below-the-line one. Revenue that is bought with loosened underwriting is the lowest-quality revenue in this income statement.
Quality of earnings — the central judgment of this section
sources FY2025’s reported earnings growth should not be treated as clean growth, and this report does not build its valuation on it. Net income grew 26.2% and diluted EPS 35.6% on revenue growth of 4.3%. [Rating and price target withdrawn — see the note at the top.] The forensic review confirms the reversal is already visible: in the first half of FY2026 revenue continued to grow while net income declined year over year. An investor extrapolating FY2025’s earnings trajectory is extrapolating three things that have already stopped. A RED forensic flag attaches to the disclosure context in which those results were reported: consolidated securities class actions and a related set of shareholder derivative actions, all filed after the annual report and therefore absent from it, allege that the company failed to disclose impediments to its branded-checkout growth strategy that impaired its ability to meet publicly communicated multi-year targets. The financial-statement consequence to date is nil — no material accrual is recorded — but the matters are early-stage and their subject is precisely the operating trend this section has just measured. The litigation itself is assessed in Section 2; what belongs here is that the financial history above is the evidentiary record those proceedings will examine.
Two further classification issues compound this, both RED or YELLOW forensic findings and both working in the same direction. First, the line captioned restructuring and other — which most screens and most adjusted-earnings measures treat as one-time — contains the recurring net losses on sale and lower-of-cost-or-fair-value adjustments on loans that PayPal originates and sells into its forward-flow programme, and the forensic review establishes that those loss amounts have grown in each of the last three years. That is a recurring, credit-driven operating cost sitting inside a non-recurring caption; reclassified where it economically belongs, PayPal’s true operating credit cost is higher than the income statement’s structure suggests. Second, the restructuring charges themselves recur: separate programmes have been announced in each of the last several years, with two in FY2025 alone and a further, substantially larger reorganisation announced after the fiscal year-end. A charge that appears every single year is a cost of doing business. Any measure of “adjusted” earnings that adds back both the restructuring and the loan-sale losses is measuring something that has never once existed in this company’s reported history.
Balanced against this, three things are genuinely clean and should be stated with equal clarity. The auditor issued an unqualified opinion on both the financial statements and internal control over financial reporting, with no going-concern or emphasis-of-matter language and a single critical audit matter on the consumer-loan allowance — which points exactly where the forensic work points. Free cash flow has been at or above net income in four of the five years of the window, and within a whisker of it in the fifth (§3.3A), so this is not a company whose earnings fail to become cash. And the accounting-policy change during the year was presentational only: adoption of the revised crypto safeguarding guidance removed an equal and offsetting asset and liability from the prior-year balance sheet with no effect on income, equity or cash flow (see §3.2B).
⚠ Items to Watch — Income Statement
sources [Rating and price target withdrawn — see the note at the top.] This is the single most informative line in the section. - Operating margin back below 16.7%. That would mean the mix and cost gains of FY2025 were transitory. the separate valuation’s forecast now starts its margin path below the FY2025 full-year level and lets it decay, precisely because this test was failed in the June quarter; a further decline from here would undercut even that reduced path. [Rating and price target withdrawn — see the note at the top.] - Technology and development spend materially below $3,103.0M. Further nominal reductions would confirm that margin is being funded by underinvestment in the platform, at a time when management identifies autonomous agents and new payment rails as existential technology risks. - EBITDA margin failing to follow the operating margin higher. Operating margin at a series high while EBITDA margin remains below its FY2017 level of 22.4% is the depreciation roll-off at work; if capital expenditure continues rebuilding toward 0.9x depreciation and beyond, that tailwind becomes a headwind.
3.2A Balance Sheet
Source: Company SEC filings (10-K), consolidated balance sheets. PayPal carries no inventory, so no inventory line and no inventory-based working-capital ratio exists to be shown. Total current assets and total current liabilities each include custodial customer balances — funds receivable and customer accounts on the asset side, funds payable and amounts due to customers on the liability side — which are restricted regulatory obligations rather than ordinary working capital; the current ratio above is therefore not comparable to an industrial issuer’s and is shown for continuity only. Short-term debt in FY2025 comprises the current portion of term debt plus a smaller commercial-paper balance drawn under a programme established in November 2025. Neither is presented as a distinct balance-sheet line — both are disclosed in the debt note and recorded within accrued expenses and other current liabilities — and both are classified as debt here on analyst judgment. FY2024 balances are as originally reported (see §3.2B on the crypto safeguarding restatement). Ratios and net debt are analyst-computed. See Appendix A.1–A.2.
3.2B Balance Sheet — Analysis
This is not an industrial balance sheet, and the ratios must not be read as one
sources The single most important thing to say about PayPal’s balance sheet is a caution rather than a conclusion. The majority of reported current assets and the great majority of reported current liabilities are custodial customer balances — money belonging to customers, recorded as a liability with matching restricted assets against which PayPal is required to hold at least an equivalent value of eligible liquid assets. It is a regulated obligation that happens to earn interest for PayPal, not spare working capital. Consequently: the current ratio of 1.3x carries no information about liquidity; the movement in total current assets and total current liabilities across the table is largely the movement in customer float, not in operating working capital; and total assets of $80,173.0M are grossed up by tens of billions of dollars of balances that generate no return on equity for shareholders. Every ratio in this section with total assets or current items in the denominator — asset turnover, return on assets, and every component of the Altman model in §3.5 — is depressed by that gross-up as a matter of arithmetic rather than performance. The forensic review adds a nuance that cuts the other way: PayPal’s Luxembourg regulator permits management to designate a portion of European customer balances to fund European and U.K. credit activities, reclassifying restricted customer money into corporate liquidity used to fund the loan book. The line between customer float and corporate funding is therefore not as bright as the balance-sheet captions imply.
A presentation caveat that materially affects the year-over-year comparison. The FY2024 column above is as originally reported. During FY2025 PayPal adopted the revised crypto safeguarding guidance and derecognised an equal and offsetting safeguarding asset and safeguarding liability from the FY2024 balance sheet, reducing both restated total assets and restated total liabilities by the same amount, with no effect on income, equity or cash flow. The consequence is specific and must be stated: the apparent decline in total assets and total liabilities from FY2024 to FY2025 in the table above is a presentation artefact. On the restated basis, both rose modestly. Analysts computing asset turnover, return on assets or any Altman component for FY2024 should be aware that the denominator is on the pre-restatement basis.
Asset composition and what it says about the business
sources Strip the float and what remains is a strikingly asset-light company. Property, plant and equipment is $1,700.0M — a rounding error against a balance sheet of $80,173.0M — and it has barely moved in five years despite revenue growing by roughly a third. This is the structural reason returns on invested capital are high (§3.4): there is very little invested capital.
The real asset-side concentration is intangible. Goodwill of $10,864.0M stands against shareholders’ equity of $20,256.0M — approximately half of book equity. The figure is goodwill alone: PayPal presents no combined subtotal, and separately-disclosed intangible assets net are immaterial beside it. A YELLOW forensic flag records that PayPal operates as a single reporting unit and performed only a qualitative impairment assessment, concluding no impairment, with no quantitative fair-value test or headroom disclosure. At the current market capitalisation the cushion is real and impairment risk appears low; but a single-reporting-unit structure means there is no partial impairment available — any future write-down would be a large, single event, and the disclosure gives an investor no sensitivity with which to gauge the distance to it. Goodwill has been essentially flat for three years, so this is a monitoring item rather than an active concern.
The most important thing about the asset side, however, is what the table above does not contain. The accounts receivable line of $840.0M is trade receivables only. PayPal’s credit exposure — the consumer and merchant loans and interest receivable whose deteriorating quality is documented in Section 2 and in Mover 6 above — sits in separate captions, and a further tranche of originated loans has been sold outright to third-party investors under the forward-flow programme while leaving behind a contingent repurchase and indemnification obligation equal to the full outstanding balance of the loans sold. The economic credit exposure of this company is larger than its balance sheet shows, and that is a RED forensic finding, not an inference. It is also why the trade-receivable metrics that follow, while clean, answer a narrower question than they appear to.
Leverage: low on every direct measure, rising on the trend
sources On the direct measures, PayPal’s credit position is comfortable. Net debt of $3,534.0M represents 0.5x EBITDA — comfortable, but above FY2023’s 0.3x, which is the low of the five-year window — and gross debt of $11,583.0M is 1.6x. Debt to equity is 0.6x. [Rating and price target withdrawn — see the note at the top.]
Two qualifications keep this from being an unambiguously benign picture. The first is trajectory: gross debt of $11,583.0M is well above the $9,048.0M of FY2021 and, as §3.3B sets out, part of that borrowing has funded capital returns rather than investment. Total debt ROSE in FY2025, from $11,070.0M to $11,583.0M, and the forensic review records that a further issuance after the fiscal year-end lifted it again — so the direction of travel on leverage is upward, not downward, which is the point this paragraph turns on. Borrowing to buy back stock is value-accretive only if the equity is genuinely undervalued and the cash flow is genuinely durable — the two propositions this entire report is testing. The second qualification is that interest coverage has fallen materially since FY2021 even as net debt fell, from 18.4x to 13.8x, because gross interest expense rose in every year of the window, from $232.0M to $441.0M. Coverage at this level is not a solvency question by any stretch; it is a signal that the cost of the balance sheet is rising while its benefit — funding buybacks at a depressed share price — depends on a judgment about value.
Note also the composition at the short end, and the fact that neither part appears as a separate line on the face of the balance sheet: the FY2025 short-term debt figure of $1,596.0M is overwhelmingly the current portion of term debt, with only a small commercial-paper balance drawn under a programme established late in the year. Both sit inside accrued expenses and other current liabilities, and both are disclosed in the debt note. Finally, a YELLOW forensic flag records a further set of obligations that never appear in this table at all: a large and growing balance of gross unrecognised tax benefits with substantial accrued interest and penalties, open examinations spanning more than a decade of tax years across several jurisdictions, and a rising deferred-tax valuation allowance — with a significant portion of the unrecognised-tax-benefit liability excluded even from the contractual-obligations table because its timing cannot be predicted. These are off the headline balance sheet and economically real.
Working capital
sources On the narrow measure, working capital is in good order and moving the right way. Days sales outstanding fell to 10 days in FY2025 from 12 days in FY2024, and trade receivables actually declined in absolute dollars, from $984.0M to $840.0M, while revenue grew. That is the opposite of the receivables build that would trigger a revenue-recognition concern; there is no evidence here of revenue being pulled forward or of collection quality deteriorating. There is no inventory and therefore no inventory-based cash conversion cycle to assess — a genuine feature of the business model, not a gap in the data.
The working-capital movements that actually matter at PayPal are the two that do not appear in the conventional ratios. The first is loans originated as held for sale, which the forensic review identifies as having grown sharply and which flows through operating cash flow — this is the principal reason reported operating cash flow fell in FY2025 and is dealt with in §3.3B. The second is the custodial float itself, whose asset and liability legs are classified in different sections of the cash-flow statement and can swing reported investing and financing cash flows by billions between years without any change in the underlying business. An analyst modelling PayPal’s working capital from the current-asset and current-liability lines of the balance sheet will model noise.
⚠ Items to Watch — Balance Sheet
sources - Net debt / EBITDA above 0.7x. A return to the FY2024 level would indicate that debt-funded capital returns are outrunning cash generation rather than smoothing it. - Interest coverage below 12.6x. Coverage has drifted down since FY2021 while gross interest expense rose every year; the FY2022 low is the threshold at which the rising cost of the balance sheet would start to constrain the capital-return programme. - Trade receivables growing faster than revenue, or days sales outstanding above 12 days. Neither is a current concern; both would be early evidence that collection quality is following merchant credit quality. [Rating and price target withdrawn — see the note at the top.] - The contingent repurchase and indemnification balance on sold loans. It grew year over year and has grown further since; it is disclosed but not accrued, and it is the clearest example of economic exposure sitting outside the balance sheet.
3.3A Cash Flow Statement
| FY2021 | FY2022 | FY2023 | FY2024 | FY2025 | |
|---|---|---|---|---|---|
| Cash from operations ($M) | $6,340.0M | $5,813.0M | $4,843.0M | $7,450.0M | $6,416.0M |
| — Depreciation & amortisation ($M) | $1,265.0M | $1,317.0M | $1,072.0M | $1,032.0M | $963.0M |
| — Stock-based compensation ($M) | $1,376.0M | $1,261.0M | $1,475.0M | $1,230.0M | $1,002.0M |
| Capital expenditures ($M) | $908.0M | $706.0M | $623.0M | $683.0M | $852.0M |
| Free cash flow ($M) | $5,432.0M | $5,107.0M | $4,220.0M | $6,767.0M | $5,564.0M |
| FCF margin | 21.4% | 18.6% | 14.2% | 21.3% | 16.8% |
| FCF growth | 8.9% | -6.0% | -17.4% | 60.4% | -17.8% |
| FCF / share | $4.58 | $4.41 | $3.81 | $6.51 | $5.75 |
| FCF conversion (FCF / net income) | 130.3% | 211.1% | 99.4% | 163.2% | 106.3% |
| CapEx / revenue | 3.6% | 2.6% | 2.1% | 2.1% | 2.6% |
| CapEx / D&A | 0.7x | 0.5x | 0.6x | 0.7x | 0.9x |
| Dividends paid ($M) | — | — | — | — | $130.0M |
| Share repurchases ($M) | $3,373.0M | $4,199.0M | $5,002.0M | $6,047.0M | $6,052.0M |
| Buyback yield | 1.5% | 5.1% | 7.4% | 6.8% | 10.7% |
Source: Company SEC filings (10-K), consolidated statements of cash flows. Free cash flow is analyst-computed as cash from operations less capital expenditures; margins, conversion, per-share and yield measures are analyst-computed. Dividends are blank before FY2025 because PayPal initiated its first-ever quarterly dividend in the fourth quarter of FY2025 — the absence is a fact, not a gap. The buyback yield is struck on each year’s OWN period-end market capitalisation, so the row is a genuine time series: it measures what an investor holding the shares at that year’s price actually had returned to them. Operating cash flow includes the gross origination and sale flows of loans held for sale, which are large relative to core payments cash generation (see below). See Appendix A.1–A.2.
3.3B Cash Flow — Analysis
Operating cash flow: high quality on the conversion test, distorted on the level
sources Start with what is unambiguously good. Free cash flow has been at or above net income in four of the five years of the window, and within a whisker of it in the fifth, at 106.3% in FY2025 and 163.2% in FY2024. PayPal’s earnings become cash. That is a real and unusual strength, and it is what separates this company from the many businesses whose reported profits never appear in the bank.
Now the qualification, which is a YELLOW forensic flag and is essential to interpreting FY2025. Operating cash flow fell to $6,416.0M from $7,450.0M, and free cash flow fell to $5,564.0M, a change of -17.8%. That decline was not a deterioration in core payments cash generation. The forensic review establishes that it was driven primarily by an increase in originations of loans receivable held for sale, net of sales and repayments — gross origination outflows and gross sale proceeds both run through operating activities, so PayPal’s headline operating cash flow moves with the loan-warehousing cycle rather than with the payments business. The same review notes the non-cash strategic-investment gain works in the opposite direction, subtracting from the reconciliation. The practical instruction for an analyst is blunt: PayPal’s reported operating cash flow is a mixture of a payments company and a loan warehouse, and neither the level nor the year-over-year change can be read as a clean signal. the separate valuation’s forecast normalises for this rather than extrapolating the reported line.
The longer-horizon picture is where the concern lies, and it is not a distortion. Over five years operating cash flow compounded at 1.9% and free cash flow at 2.2%, against revenue at 9.1% and EBITDA at 9.4%. Free cash flow of $5,564.0M in FY2025 is barely above the $5,432.0M of FY2021, and free cash flow margin has fallen from 21.4% to 16.8%. This is the fact that most contradicts the FY2025 earnings narrative. Reported net income and EPS reached records; the cash the business generates has been flat for five years. Free cash flow per share has risen — from $4.58 to $5.75 — but only because the denominator shrank, and even that measure fell in FY2025 from $6.51.
Capital expenditure: below replacement for five straight years
sources Capital expenditure absorbs 2.6% of revenue, down from 3.6% in FY2021, and runs at 0.9x depreciation and amortisation. It has been below depreciation in every year of the window, reaching a low of 0.5x in FY2022 — the definition of harvest mode. The filing does not split maintenance from growth capital expenditure, so the distinction cannot be made from disclosure.
Two readings are available and both are partly right. The benign one: PayPal is an asset-light network migrating out of owned data centres into third-party cloud infrastructure, which converts capital spending into operating expense and makes the capital-expenditure-to-depreciation ratio structurally understate true investment. The unsympathetic one: technology and development expense — the operating line into which cloud spending would migrate — has also been flat in nominal dollars since FY2021 (§3.1B). If investment were genuinely being reclassified rather than reduced, the operating line would be rising. It is not. Both lines being flat at once is the signature of a company optimising its cost base rather than reinvesting in its franchise. The partial rebuild from the FY2023 trough of $623.0M to $852.0M is worth noting, and it will be a margin headwind as the depreciation roll-off described in §3.1B exhausts itself.
The capital allocation waterfall
sources Over the five-year window, the destination of PayPal’s free cash flow is not in doubt: essentially all of it has gone to share repurchases. Buybacks rose in every single year, from $3,373.0M in FY2021 to $6,052.0M in FY2025, and in aggregate they absorb the overwhelming majority of the free cash flow the company generated across the period. Acquisitions were immaterial in scale. Dividends were zero until the Board initiated the company’s first-ever quarterly cash dividend late in FY2025, producing $130.0M of payments in the year and a payout ratio of 2.5% of earnings — a signalling instrument declaring the cash generation durable rather than a material claim on it.
Does that mix fit the opportunity set? On the evidence, yes — with one important discipline. A business earning a return on invested capital of 20.7% on capital expenditure of 2.6% of revenue has no large internal reinvestment sink; returning the cash is the correct default, and a buyback yield of 10.7% at a depressed share price retires far more stock per dollar than the same programme did at higher valuations. The discipline is that in FY2025 repurchases of $6,052.0M plus dividends of $130.0M exceeded free cash flow of $5,564.0M, and the gap was bridged in part with borrowing — a GREEN-flagged but explicitly noted forensic observation that debt is rising partly to fund capital returns. Returning more than the business generates is a defensible tactical choice at a low valuation and an unsustainable strategic one at any valuation. It also raises the stakes on the earnings-quality judgment in §3.1B: a company distributing more than it earns in cash, on the strength of a reported profit that was flattered by non-cash marks and a one-time tax benefit, is making a bet on the durability of its own cash flow.
⚠ Items to Watch — Cash Flow
- Free cash flow below $5,564.0M in FY2026. Free cash flow has been effectively flat for five years; a further decline would confirm that the reported earnings growth was a translation effect rather than a cash one, and would directly pressure the buyback.
- Capital returned exceeding free cash flow for a second consecutive year. The FY2025 excess was modest and debt-funded; a repeat converts a tactical decision into a structural funding gap.
- FCF conversion below the window low of 99.4%. Conversion has never fallen materially below net income in this window. A year that breaks the FY2023 floor would mean the loan-warehousing drag has become permanent rather than cyclical.
- CapEx / D&A rising materially through 0.9x. Not itself bad — it would signal genuine reinvestment — but it removes the depreciation tailwind that has been quietly supporting the operating margin.
- Buyback yield falling from 10.7%. A reduction in the repurchase pace would be the clearest signal that management’s own confidence in the cash flow has changed.
3.4 Returns Analysis
| FY2021 | FY2022 | FY2023 | FY2024 | FY2025 | |
|---|---|---|---|---|---|
| ROIC | 17.4% | 11.3% | 17.1% | 17.3% | 20.7% |
| ROE | 20.0% | 11.5% | 20.5% | 20.0% | 25.7% |
| ROA | 5.7% | 3.1% | 5.3% | 5.1% | 6.5% |
| Asset turnover | 0.33x | 0.35x | 0.36x | 0.39x | 0.41x |
| Interest coverage | 18.4x | 12.6x | 14.5x | 13.9x | 13.8x |
Source: Company SEC filings (10-K); all return measures are analyst-computed from the FL model. Return on assets is computed on AVERAGE total assets while asset turnover in this table is computed on ENDING total assets — so net margin x asset turnover does not reconcile exactly to the ROA shown, and the asset-turnover series in the DuPont table below (which uses average assets, as the identity requires) differs slightly from the one here. Both are computed on reported total assets, which include custodial customer balances and are therefore structurally inflated relative to an issuer without a customer float. Interest coverage is computed on the gross interest expense disclosed within other income (expense), net, since no interest-expense line appears on the face of the income statement. See Appendix A.1–A.2.
ROIC versus the cost of capital
sources Return on invested capital of 20.7% is the highest in the series and sits far above any cost of capital that could reasonably be derived for a business of this risk profile — the weighted average cost of capital confirms a wide positive spread. That spread is the economic justification for the moat argument in Section 1: PayPal earns a high return because its invested capital base is tiny relative to the revenue it produces, with property, plant and equipment of $1,700.0M supporting revenue of $33,172.0M. Licences, brand and two-sided data are the plausible sources of the rent; the returns corroborate that something is generating one.
Two disciplines must be applied before the FY2025 figure is used as a forward assumption. [Rating and price target withdrawn — see the note at the top.] The second is that the return is rising for a reason that is not entirely operational: equity has been shrinking as buybacks exceed retained profit, so the denominator is contracting independently of any improvement in the business. A rising return on a shrinking capital base is genuine for a shareholder, but it is not evidence of an improving franchise.
The trajectory nonetheless deserves credit, with one honest exception. Return on invested capital recovered from 11.3% in the FY2022 trough to 17.3% and then 20.7%. But at that FY2022 low the return was barely distinguishable from the weighted average cost of capital — in that year PayPal earned essentially no economic spread at all. That is the right benchmark for the bear case: not value destruction, but returns collapsing to the cost of capital in a year when the below-the-line and tax items turned against the company. It is a reminder of how much of this business’s apparent excess return sits below the operating line.
DuPont decomposition
| Component | FY2021 | FY2022 | FY2023 | FY2024 | FY2025 |
|---|---|---|---|---|---|
| Operating (EBIT) margin | 16.8% | 13.9% | 16.9% | 16.7% | 18.3% |
| × Interest burden (pre-tax / EBIT) | 0.962x | 0.877x | 1.076x | 1.001x | 1.037x |
| × Tax burden (net income / pre-tax) | 1.017x | 0.719x | 0.785x | 0.778x | 0.832x |
| = Net margin | 16.4% | 8.8% | 14.3% | 13.0% | 15.8% |
| × Asset turnover | 0.35x | 0.36x | 0.37x | 0.39x | 0.41x |
| × Equity multiplier | 3.50x | 3.68x | 3.89x | 3.95x | 3.98x |
| = ROE | 20.0% | 11.5% | 20.5% | 20.0% | 25.7% |
Source: Company SEC filings (10-K); five-factor DuPont decomposition analyst-computed from the FL model. The equity multiplier is computed on reported total assets, which include custodial customer balances — see the commentary below on why it must not be read as financial leverage. See Appendix A.1–A.2.
Return on equity of 25.7% in FY2025 is the highest in the series, and the decomposition shows exactly where it came from — which is the point of doing the decomposition rather than quoting the headline.
The level is driven by the equity multiplier, and the equity multiplier is not leverage. At 3.98x it looks like the balance sheet of a leveraged company. It is not: debt to equity is only 0.6x and net debt is 0.5x EBITDA. The multiplier is high because total assets are grossed up by custodial customer balances that belong to customers, and because the equity denominator has been shrinking under the buyback. The same custodial gross-up is why asset turnover of 0.41x looks like a capital-intensive manufacturer’s rather than an asset-light network’s. Neither of those two factors carries information about PayPal’s operations; together they account for most of the absolute level of the return on equity. Comparing PayPal’s ROE with a peer that holds no customer float is not a meaningful comparison, which is why Section 5 treats these measures with caution.
The swing factors are the two low-quality items. Between FY2024 and FY2025 the operating margin improved from 16.7% to 18.3% — genuine. But the interest burden moved from 1.001x to 1.037x and the tax burden from 0.778x to 0.832x, and both of those are the non-operating items identified as RED forensic flags: an interest-burden ratio above parity means below-the-line income added to pre-tax profit, which is the strategic-investment mark, and the improved tax burden is the one-time legal-entity restructuring. The DuPont therefore reaches the same conclusion as the earnings-quality analysis by an entirely independent route: more than half of the improvement in net margin from 13.0% to 15.8% comes from two factors that will not repeat. The historical comparison confirms how volatile these two multipliers are — the interest burden was 0.877x in FY2022 and the tax burden 0.719x, which is the entire explanation for that year’s collapse in reported profitability while operating margin fell only modestly.
3.5 Altman Z-Score
| Component | FY2021 | FY2022 | FY2023 | FY2024 | FY2025 |
|---|---|---|---|---|---|
| X1 (Working capital / total assets) | 0.126 | 0.158 | 0.172 | 0.156 | 0.166 |
| X2 (Retained earnings / total assets) | 0.218 | 0.241 | 0.282 | 0.335 | 0.405 |
| X3 (EBIT / total assets) | 0.056 | 0.049 | 0.061 | 0.065 | 0.076 |
| X4 (Book equity / total liabilities) | 0.402 | 0.347 | 0.344 | 0.334 | 0.338 |
| X5 (Revenue / total assets) | 0.335 | 0.350 | 0.362 | 0.390 | 0.414 |
| Z-Score | 0.95 | 0.96 | 1.06 | 1.13 | 1.25 |
| Zone — Z′ thresholds | Distress | Distress | Distress | Distress | Grey |
| Zone — original Z (market equity) | Safe | Grey | Grey | Grey | Grey |
Source: Company SEC filings (10-K); Altman components and Z-Score analyst-computed from the FL model. This is the Z′ (private-firm) variant, because X4 uses the BOOK value of equity; its thresholds are accordingly 2.90 safe / 1.23 distress, not the 2.99 / 1.81 of the original public-manufacturer Z, which requires the MARKET value of equity in X4. Computed on that original basis instead — market equity in X4 — the score sits in the safe zone in FY2021 and in the grey zone in every year since, never in distress. Every component with total assets or total liabilities in the denominator is computed on the reported balance sheet, which includes custodial customer balances — see the interpretation below. FY2024 components are computed on the pre-restatement balance sheet (§3.2B). See Appendix A.1–A.2.
The mechanical reading of this table understates the credit, and it is important to say so directly rather than to soften it. The two variants disagree sharply, and the disagreement is itself the finding: the private-firm Z′, which values equity at book, puts PayPal in the distress zone for most of the window, while the original public-firm variant — which uses the MARKET value of equity, and is the one calibrated for a listed company — puts it in the safe zone at the start of the window and the grey zone since. [Rating and price target withdrawn — see the note at the top.] A model whose two variants place the same investment-grade balance sheet in distress on one reading and in safety on the other is not detecting risk; it is misapplied.
The reason is structural and specific. The Z-Score was calibrated on public manufacturers, and three of its five components are denominated in total assets or total liabilities. PayPal’s total assets and total liabilities are each grossed up by tens of billions of dollars of custodial customer balances that are simultaneously an asset and an offsetting liability. That gross-up mechanically depresses X4 — because “total liabilities” in the denominator counts customer money that is not a creditor claim on the enterprise — and depresses X5 and X3 by inflating the asset base against which revenue and operating income are measured. A payments company holding a regulated customer float will be pinned toward the bottom of the scale by construction, however strong its actual credit. The same distortion is why return on assets and asset turnover in §3.4 must be read with the same caution.
What is informative is the trend, because the distortion is broadly constant year to year. The score has improved in every year of the window, from 0.95 in FY2021 to 1.25 in FY2025. The improvement is driven overwhelmingly by X2, retained earnings over total assets, which rose from 0.218 to 0.405 as accumulated profits compounded against a broadly flat asset base — the accounting expression of the point made in the linkage confirmation, that retained earnings compound while equity does not because buybacks are charged elsewhere. X3, operating income over total assets, also improved, from 0.056 to 0.076, which is the margin expansion of §3.1B. X4 has moved the other way, to 0.338 in FY2025 from 0.402 in FY2021, reflecting equity shrinking under the buyback while liabilities grew.
The credit conclusion, stated on the metrics that do apply to this issuer: PayPal’s credit risk is low, though it is no longer improving. Net debt to EBITDA of 0.5x is comfortable in absolute terms but is not the tightest of the window — FY2023’s 0.3x was, and leverage has risen since, with gross debt to EBITDA at 1.6x, interest is covered 13.8x, maturities are laddered with no single-year wall, the sole financial covenant has ample headroom, and the forensic review found no covenant concerns. The genuine credit watch items are not solvency but direction: gross debt trending higher across the cycle to help fund capital returns while free cash flow is flat, interest coverage drifting lower as gross interest expense rises every year, and a contingent repurchase and indemnification obligation on sold loans that grows with the loan-distribution programme and is disclosed rather than accrued.
4. Valuation withdrawn
This section stated what the shares were worth and what to do about them. It rested on an exit multiple set by hand — across the coverage it averaged 24% below where each company actually traded — so the conclusion largely restated that assumption instead of testing it. Rather than leave it standing, it has been withdrawn while the method is rebuilt.
Nothing else in this report depends on it: the financial analysis above and below is drawn from the company's own filings, and every figure links to the page it was verified against.
Section 5 — Financial Metrics & Peer Benchmarking
sources This section answers one question: is PayPal’s discount to its peer group a mispricing or a correct assessment of terminal risk? The comparison is genuinely difficult because the five companies in it do not report a comparable top line, do not all report under the same accounting standard, and do not all carry the same kind of balance sheet. Every one of those problems is disclosed below and carried through the tables rather than mentioned and then ignored.
5.1 Peer Selection
sources The set is deliberately small and deliberately heterogeneous, because no single listed company replicates PayPal’s combination of a branded consumer wallet, an unbranded merchant-processing arm, a consumer and merchant credit book and a regulated custodial float. Each peer was chosen to cover one of those exposures well rather than all of them badly.
Fiserv, Inc. is the closest scaled US-listed analogue to the merchant-acceptance half of PayPal: a merchant acquirer and bank-technology hybrid selling into the same merchant base, reporting under the same accounting standard and on the same fiscal calendar. Its weakness as a comparable is structural and must be applied to every margin comparison: it bought its scale rather than building it, and the resulting acquisition-intangible amortisation makes its EBIT and EBITDA margins tell two different stories (§5.7, note C005). It is also the only materially levered company in the set.
Block, Inc. is the most direct competitor in the set on both sides of PayPal’s network — a consumer wallet competing with Venmo and a merchant-acceptance business competing with branded and unbranded PayPal — and it shares the custodial-customer-funds balance-sheet structure that makes PayPal’s asset-based ratios difficult to read. Its weakness is the top line: its headline total net revenue is dominated by Bitcoin-ecosystem sales that are almost entirely offset by Bitcoin costs, so ranking it on reported revenue would be meaningless. Every Block margin in this section is struck on gross profit.
Adyen N.V. is the benchmark that matters most analytically: the pure enterprise-processing competitor taking exactly the volume that PayPal’s unbranded arm competes for, and the cleanest available evidence of what a well-run, single-product processor earns. It is also the weakest comparable mechanically — it reports under IFRS in euros, its full-year figures were assembled from two half-year shareholder letters rather than a single audited annual statement, and its headline EBITDA and free cash flow are company-defined non-IFRS measures. Every Adyen comparison in this section is directional.
Shopify Inc. is included as the competitive threat to the checkout surface itself rather than as a valuation comparable. It owns merchant checkout at the point where PayPal’s branded button has to be selected, and its accelerated-checkout product competes for the same consumer decision described in Section 1. Its multiples are a growth-cohort reference point and are not used to anchor value anywhere in this report.
Two exclusions are as deliberate as the inclusions. The card networks are absent because, as Section 1 sets out, they sit above both layers of this industry and set PayPal’s largest cost line through interchange and assessments — they are suppliers, not comparables, and including them would compare a toll-taker’s margin to a toll-payer’s. Bank-owned real-time payment schemes are absent because they are not separately listed. The consequence is an honest one: there is no clean comparable for PayPal’s branded checkout franchise anywhere in public markets, which is why this section leans on returns and multiples more than on margin rankings.
One piece of good news on construction: period alignment is unusually clean. Every company in the table shares a December fiscal year-end and every figure is the twelve months to that date, so no lag adjustment or stub-period relabelling is required anywhere in this section.
| Peer | Ticker | Listing | Filing used | Standard | FY end | Comparable top line used here |
|---|---|---|---|---|---|---|
| Fiserv, Inc. | FI | NYSE | 10-K | US GAAP | December | GAAP total revenue |
| Block, Inc. | XYZ | NYSE | 10-K | US GAAP | December | Gross profit |
| Adyen N.V. | ADYEN | Euronext Amsterdam | Shareholder Letter (IFRS) | IFRS | December | Net revenue, after interchange |
| Shopify Inc. | SHOP | NASDAQ | 10-K | US GAAP | December | GAAP total revenue |
Source: Peer-company primary filings — Fiserv, Block and Shopify Forms 10-K for FY2025; Adyen H1 and H2 2025 shareholder letters (interim condensed consolidated financial statements, IFRS). Comparability notes in §5.7 — see Appendix A.1.
5.2 Profitability Comparison
The top line is not comparable, and ranking on it would be wrong
sources This is the single most important disclosure in the section. The five companies use four different revenue definitions. PayPal reports net revenues gross of transaction expense — the cost of the funding instrument the customer chooses. Fiserv and Shopify report GAAP gross revenue, and Shopify’s merchant-solutions line is grossed-up payments processing. Block’s headline total net revenue is inflated by near pass-through Bitcoin-ecosystem sales, so its only comparable top line is gross profit. Adyen’s “net revenue” is struck after interchange and scheme fees and is therefore the narrowest base in the table — closer in character to Block’s gross profit than to anyone’s revenue line.
The practical instruction for the reader is blunt: the top-line column below measures size on four different bases and must not be used to rank these companies. It is printed because every margin underneath it is a ratio to that base, and a reader cannot interpret the margins without knowing which base each one uses.
| Company | Comparable top line ($M) | Comparability flag as recorded |
|---|---|---|
| PayPal Holdings, Inc. | $33,172.0M | Net revenues, gross of transaction expense |
| Fiserv, Inc. | $21,193.0M | OK |
| Block, Inc. | $10,359.9M | GROSS_PROFIT_BASIS |
| Adyen N.V. | $2,673.0Mᶠ | IFRS_EUR_NET_REVENUE |
| Shopify Inc. | $11,556.0M | OK |
Source: PayPal net revenues from the FY2025 Form 10-K consolidated statements of income (FL model, Data sheet); peer top lines from the peer-comparison artefact — Fiserv and Shopify GAAP total revenue per their Forms 10-K, Block gross profit per its Form 10-K consolidated statements of operations, Adyen net revenue per its H1 and H2 2025 shareholder letters, translated from euros. Basis flags are the peer-researcher comparability flags. See §5.7 notes C001 and C002 and Appendix A.1.
Flag legend: ᶠ = IFRS reporter, translated from euros — directional only; ᵐ = market-sourced multiple (Tier 2, single-source); ᶜ = computed by the peer researcher from filing components rather than taken from a printed line.
Margins
| Company | Gross margin | EBITDA margin | EBIT margin | Net margin | FCF margin |
|---|---|---|---|---|---|
| PayPal Holdings, Inc. | - | 21.2% | 18.3% | 15.8% | 16.8% |
| Fiserv, Inc. | 59.4% | 42.4%ᶜ | 27.5% | 16.4% | 20.3%ᶜ |
| Block, Inc. | 42.8% | 20.1%ᶜ | 16.5% | 12.6% | 23.4%ᶜ |
| Adyen N.V. | — | 52.7%ᶠ | 46.9%ᶠ | 44.9%ᶠ | 45.7%ᶠ |
| Shopify Inc. | 48.1% | 13.0%ᶜ | 12.7% | 10.7% | 17.4%ᶜ |
Source: PayPal margins analyst-computed in the FL model (Metrics sheet) from the FY2025 Form 10-K; peer margins from the peer-comparison artefact, computed on each company’s comparable top line as set out above — Block on gross profit, Adyen on post-interchange net revenue, Fiserv and Shopify on GAAP revenue. Adyen EBITDA and free cash flow are company-defined non-IFRS measures translated from euros. See §5.7 and Appendix A.1.
PayPal has no gross margin, and that is a fact about the business rather than a gap in the data. As Section 3 established, the income statement runs from net revenues directly to total operating expenses; there is no cost of revenue and no gross-profit subtotal. The first margin PayPal reports is the operating margin, which is why the operating and EBITDA lines carry the whole comparison here.
Three genuine operating conclusions survive the accounting noise, and one apparent conclusion does not.
Adyen earns materially more per unit of top line than anyone else in the set — but the gap is smaller than the table makes it look, and the direction of the distortion favours PayPal. Adyen’s margin is struck on a base that is already net of interchange and scheme fees; PayPal’s is struck on a base that still contains its largest cost. Restated onto an Adyen-equivalent post-funding-cost base, PayPal’s operating margin would be materially higher than the figure shown. [Rating and price target withdrawn — see the note at the top.] The same correction runs the other way for Block: its margin is struck on gross profit, so on PayPal’s gross-of-transaction-expense base Block’s operating margin would be lower than shown, not comparable to it.
Fiserv’s apparent margin superiority should be assessed on EBIT, not EBITDA. The gap between its EBITDA margin and its EBIT margin is far wider than PayPal’s, and the difference is acquisition-intangible amortisation from a large legacy transaction. On EBITDA the comparison flatters Fiserv; on EBIT — after the cost of the scale it bought — Fiserv is still the more profitable of the two, and that is the like-for-like read (§5.7, note C005). PayPal’s own EBITDA-to-EBIT wedge is narrow and, per Section 3, has been narrowing for the arithmetic reason that depreciation is rolling off rather than for any operating reason.
[Rating and price target withdrawn — see the note at the top.]
The conclusion that does not survive is the net-margin ranking. PayPal’s net margin sits mid-pack on reported figures — and it is the least trustworthy number in the table. [Rating and price target withdrawn — see the note at the top.] On normalised earnings PayPal’s net margin is lower than shown. The caveat cuts the opposite way for Shopify, whose FY2025 net income absorbed an unrealised loss on its equity-investment portfolio, and for Adyen, whose net margin includes non-operating finance income earned on cash balances. Net margin is the wrong metric on which to compare this particular set in this particular year.
PayPal’s own five-year progression
| Metric | FY2021 | FY2022 | FY2023 | FY2024 | FY2025 |
|---|---|---|---|---|---|
| EBITDA margin | 21.8% | 18.7% | 20.5% | 20.0% | 21.2% |
| EBIT margin | 16.8% | 13.9% | 16.9% | 16.7% | 18.3% |
| Net margin | 16.4% | 8.8% | 14.3% | 13.0% | 15.8% |
| FCF margin | 21.4% | 18.6% | 14.2% | 21.3% | 16.8% |
Source: Company SEC filings (Forms 10-K); all margins analyst-computed in the FL model (Metrics sheet). No gross-margin row is shown because PayPal reports no cost of revenue and no gross profit. See Appendix A.1–A.2.
The time series reframes the cross-section. PayPal’s operating margin is at a series high and its EBITDA margin has recovered to roughly where it stood at the start of the window — but its free cash flow margin has fallen over the same five years, from the FY2021 level to 16.8%, and now sits at the bottom of the peer set, below even Shopify’s. Over those five years PayPal’s accounting margin and its cash margin moved in opposite directions — a divergence that the single-year peer snapshot cannot show and that matters more than the snapshot does. Section 3 explains why — the reported operating margin is flattered by a depreciation roll-off, and reported operating cash flow now moves with a loan-warehousing cycle rather than with the payments business — but the peer comparison makes the consequence unmistakable: on the metric that a discounted cash flow model actually consumes, PayPal has been going backwards while its income statement improved.
5.3 Returns Comparison
| Company | ROIC | ROE | ROA | Asset turnover |
|---|---|---|---|---|
| PayPal Holdings, Inc. | 20.7% | 25.7% | 6.5% | 0.41x |
| Fiserv, Inc. | 8.7%ᶜ | 13.5% | 4.3% | 0.26x |
| Block, Inc. | 5.9%ᶜ | 5.9% | 3.3% | 0.26x |
| Adyen N.V. | 15.3%ᶠ | 20.1%ᶠ | 8.7%ᶠ | 0.19xᶠ |
| Shopify Inc. | 15.6%ᶜ | 9.1% | 8.1% | 0.76x |
Source: PayPal returns analyst-computed in the FL model (Metrics sheet); peer returns computed by the peer researcher from each company’s primary filing. Adyen’s return on invested capital is computed on an operating-capital basis because the conventional invested-capital formula is negative for a net-cash issuer with a banking licence (§5.7, note C007). Return on assets and asset turnover for PayPal, Block and Adyen are computed on balance sheets grossed up by custodial customer funds (§5.7, note C004). See Appendix A.1.
PayPal earns the highest return on invested capital in this peer set, and that is the strongest single fact in its favour anywhere in this report. It is also the fact that most sharply contradicts the multiple it trades on. The spread over the cost of capital 10.51%, is wide — and it remains wide, and remains the best in the set, even after the two corrections this report insists on. [Rating and price target withdrawn — see the note at the top.] Correcting for the shrinking equity denominator — buybacks have been contracting invested capital independently of any operating improvement — takes something further off the trajectory but nothing off the ranking.
The differential is structural rather than cyclical, and the peer set explains it precisely. Fiserv earns the second-lowest return in the group because it purchased its scale: a large acquisition sits in its invested capital at cost, so it earns a modest return on the price it paid for a business that is, on EBIT margin, more profitable than PayPal’s. Block’s return is depressed by a large goodwill balance and a balance sheet carrying loans held for investment, customer funds and a Bitcoin position. [Rating and price target withdrawn — see the note at the top.] PayPal earns the most because it has almost no invested capital to earn it on — property, plant and equipment is trivial against the revenue it supports, as Section 3 documented. This is the arithmetic signature of a genuine economic rent, and it corroborates the moat argument in Section 1 rather than merely restating it.
Two comparisons in the table above should be discarded rather than interpreted. Return on assets and asset turnover are not comparable across this set and no conclusion in this report rests on them. PayPal, Block and Adyen all carry very large custodial customer balances that gross up total assets with offsetting liabilities — customer money, not shareholder capital — while Fiserv’s settlement balances are smaller relative to its size and Shopify carries none. The effect is mechanical: the three custodial issuers show depressed asset turnover and depressed return on assets purely because their denominators contain other people’s money. Shopify’s apparently superior asset turnover is an artefact of that difference, not evidence of better capital efficiency. Return on equity is subject to a second distortion for PayPal specifically — as Section 3’s DuPont decomposition showed, the level is driven substantially by an equity multiplier inflated by the same custodial gross-up and by an equity base shrinking under the buyback, not by leverage.
PayPal’s own five-year progression
| Metric | FY2021 | FY2022 | FY2023 | FY2024 | FY2025 |
|---|---|---|---|---|---|
| ROIC | 17.4% | 11.3% | 17.1% | 17.3% | 20.7% |
| ROE | 20.0% | 11.5% | 20.5% | 20.0% | 25.7% |
| ROA | 5.7% | 3.1% | 5.3% | 5.1% | 6.5% |
Source: Company SEC filings (Forms 10-K); all return measures analyst-computed in the FL model (Metrics sheet). Return on assets is computed on reported total assets, which include custodial customer balances and are therefore structurally inflated. See Appendix A.1–A.2.
The history contains the bear case in one number. In FY2022 return on invested capital fell to 11.3% — barely distinguishable from the 10.51% cost of capital. In that year PayPal earned essentially no economic spread at all, and it did so not because the payments business collapsed but because the below-the-line and tax items that flatter FY2025 ran the other way. The peer comparison shows PayPal earning the best returns in its group; its own history shows how quickly that advantage can compress to nothing when the non-operating items turn. Both facts belong in the investment case.
5.4 Leverage & Liquidity Comparison
| Company | Net debt / EBITDA | Total debt / equity | Interest coverage | Current ratio | FCF margin |
|---|---|---|---|---|---|
| PayPal Holdings, Inc. | 0.5x | 0.6x | 13.8x | 1.3x | 16.8% |
| Fiserv, Inc. | 3.1x | 1.1x | 3.9x | 1.0x | 20.3%ᶜ |
| Block, Inc. | 0.1x | 0.3x | 13.2x | 2.2x | 23.4%ᶜ |
| Adyen N.V. | -8.5xᶠ | 0.1xᶠ | — | 1.7xᶠ | 45.7%ᶠ |
| Shopify Inc. | -3.9x | 0.0x | — | 6.0x | 17.4%ᶜ |
Source: PayPal ratios analyst-computed in the FL model (Metrics sheet) from the FY2025 Form 10-K; peer ratios computed by the peer researcher from each primary filing. Block’s debt excludes asset-backed warehouse funding facilities (§5.7, note C006). Adyen and Shopify carry no meaningful borrowings, so interest coverage is not meaningful for either and net debt to EBITDA is negative because both are net cash. Current ratios for PayPal, Block and Adyen are grossed up by custodial customer balances (§5.7, note C004). See Appendix A.1.
The leverage table produces a clear ranking and one trap.
The ranking: Fiserv is the only levered company in this set, and the gap is not marginal. It carries a net-debt-to-EBITDA multiple several times PayPal’s and covers its interest a small number of times over, against PayPal’s 13.8x. Block carries only a tenth of a turn of net debt once its self-liquidating warehouse facilities are excluded — immaterial, though not the net-cash position of the two unlevered names; Adyen has no borrowings at all beyond lease liabilities; Shopify redeemed its convertible notes during the year and ended it debt-free. PayPal therefore sits second on gross leverage in a group where second means barely levered — a net-debt multiple of 0.5x and debt to equity of 0.6x is a rounding error against the cash the business generates.
The trap is the current ratio, and it should be read as no information at all for three of the five. PayPal’s 1.3x, Block’s and Adyen’s are all computed on balance sheets in which both current assets and current liabilities are dominated by customer money held under regulatory obligation. Shopify’s far higher ratio reflects a conventional corporate balance sheet with a large securities portfolio and no custodial gross-up. Comparing these four current ratios is comparing three regulatory constructs to one working-capital measure.
What the table understates is trajectory, and here the peer set is genuinely instructive. PayPal’s balance-sheet capacity is not in question, but it is the only company in this group using that capacity to fund capital returns: Section 3 records that repurchases plus dividends exceeded free cash flow in FY2025 and that the gap was bridged in part with borrowing, while interest coverage has fallen from 18.4x in FY2021 as gross interest expense rose every year. Adyen and Shopify are accumulating cash; Block is holding a net-neutral position; Fiserv is running a levered roll-up. PayPal is the only one converting balance-sheet capacity into share count reduction — a defensible use of a low multiple, and one that consumes an option it cannot exercise twice.
5.5 Valuation Multiples Comparison
| Company | EV/EBITDA | P/E | FCF yield | Comparability flag as recorded |
|---|---|---|---|---|
| PayPal Holdings, Inc. | 8.0x | 11.4x | 10.5% | FL model, at current price |
| Fiserv, Inc. | 6.7xᵐ | 9.1xᵐ | 13.6%ᵐ | MARKET_SOURCED |
| Block, Inc. | 23.0xᵐ | 36.4xᵐ | 5.1%ᵐ | MARKET_SOURCED |
| Adyen N.V. | 24.3xᵐᶠ | 28.3xᵐᶠ | 3.6%ᵐᶠ | MARKET_SOURCED_IFRS_EUR |
| Shopify Inc. | 122.9xᵐ | 154.3xᵐ | 1.1%ᵐ | MARKET_SOURCED |
Source: PayPal multiples analyst-computed in the FL model (Metrics sheet) against the current share price and FY2025 reported figures. All four peers’ multiples are market-sourced (Tier 2, single-source market capitalisations as of early August 2026) and are subject to change with price movements; Adyen’s are additionally IFRS, euro-translated and struck on company-defined non-IFRS EBITDA and free cash flow. The peer artefact carries a comparability flag for EV/EBITDA but none for P/E, so the market-sourced mark — and, for Adyen, the IFRS/euro mark — is carried across to the P/E column by the analyst rather than by the source data. Peer P/E must not be read as a filing-sourced figure. Adyen’s EV/EBITDA does not net its custodial cash (§5.7, note C007); Block’s is struck on gross-profit-based EBITDA (note C006). See §5.7 and Appendix A.1.
PayPal’s own de-rating
| FY2021 | FY2022 | FY2023 | FY2024 | FY2025 |
|---|---|---|---|---|
| 41.2x | 16.6x | 11.4x | 14.7x | 8.5x |
Source: Analyst-computed in the FL model (Metrics sheet): enterprise value at each fiscal year-end share price divided by that year’s reported EBITDA. Year-end prices are market data (Tier 2); EBITDA is derived from the Forms 10-K. See Appendix A.1–A.2.
What the multiples actually say
sources Two conclusions come out of these tables, and they point in opposite directions. Both are stated because both are internally consistent with the evidence — but they are not equally weighted, and the balance between them has moved since this report was first drafted. The peer evidence supports the first; this report’s own cash-flow model, rebuilt on the most recent quarterly evidence, now supports the second.
Reading one: the discount is a mispricing. PayPal trades at a steep discount to Block, Adyen and Shopify on every earnings- and cash-based multiple, while earning the highest return on invested capital in the set, generating a free cash flow yield that only the levered roll-up beats, and carrying almost no debt. [Rating and price target withdrawn — see the note at the top.] On this reading the market has repriced sentiment, not economics: nothing in the returns, leverage or cash-generation comparisons above explains why this company should trade several times cheaper than the three names the market credits with duration.
[Rating and price target withdrawn — see the note at the top.] The market is no longer trading below this report’s own downside scenario; it is trading inside the range, close to the base case and well above the bear. That does not make the peer comparison wrong — PayPal still earns the highest return on invested capital in the set on the least capital and the least debt — but it removes the strongest form of the mispricing claim. An investor can no longer say the market has priced in more pessimism than this report’s own worst case; the honest statement is that the market has priced in more pessimism than the base case and less than the bear. The derivation belongs to the separate valuation and is not repeated here.
[Rating and price target withdrawn — see the note at the top.] PayPal and Fiserv — the two mature acquirer/wallet businesses — carry the two lowest earnings multiples and the two highest free cash flow yields in the set. Block, Adyen and Shopify — the three the market credits with duration — trade several times higher on both earnings and EBITDA. The market is not making a PayPal-specific judgment; it is making a judgment about which of these companies will still own the checkout in a decade, and it has put PayPal in the wrong cohort. The single best piece of evidence that this is a structural rather than cyclical assessment is the one measured in Sections 1 and 3: the price PayPal captures per dollar it moves fell from 3.01% to 1.85%, lower in every one of nine consecutive years, across two entirely different macroeconomic regimes. A multiple is a claim about the durability of a cash flow stream. A yield that has declined without interruption for nine years is the market’s justification for doubting that durability, and no peer in this set has an equivalent record.
[Rating and price target withdrawn — see the note at the top.] The cohort framing above is unaffected by any of it — the market’s division of this set into a mature cohort and a duration cohort is the same division it made before — but the question of whether PayPal is in the wrong cohort now has an answer pointing the other way from the peer multiples.
[Rating and price target withdrawn — see the note at the top.] On normalised earnings PayPal’s true price-to-earnings multiple is meaningfully higher than the figure shown, and the apparent discount to Adyen and Block is correspondingly narrower. It does not close: the gap is far too wide to be explained by earnings quality alone. But an investor building the value case on the headline multiple is building it on the weakest number in this report. The enterprise-value-to-EBITDA and free-cash-flow-yield comparisons are the more robust ones, because EBITDA is struck above the two distorted lines and free cash flow is cash.
The comparison with Fiserv deserves its own sentence, because it is the most awkward fact in this section for the bull case: PayPal is not the cheapest company in its own peer group. Fiserv trades below it on both earnings multiples and above it on free cash flow yield. The difference is that Fiserv carries several turns of leverage and earns among the lowest returns on invested capital in the set — only Block’s is lower, and Section 5.3 notes that Block’s is depressed by a large goodwill balance — while PayPal is nearly unlevered and earns the highest — which is why the two should not be read as a like-for-like pair. The market is pricing a levered, low-return acquirer approximately correctly. [Rating and price target withdrawn — see the note at the top.]
5.6 Efficiency Comparison
| Company | Days sales outstanding | Days inventory | Days payables | Cash conversion cycle | CapEx / revenue |
|---|---|---|---|---|---|
| PayPal Holdings, Inc. | 10 days | - | - | - | 2.6% |
| Fiserv, Inc. | 69 days | — | — | — | 8.3% |
| Block, Inc. | 48 days | — | — | — | 1.5% |
| Adyen N.V. | — | — | — | — | 4.9%ᶠ |
| Shopify Inc. | 16 days | — | — | — | 0.2% |
Source: PayPal efficiency measures analyst-computed in the FL model (Metrics sheet) from the FY2025 Form 10-K; peer measures computed by the peer researcher from each primary filing. No company in this set carries inventory, so days inventory, days payables and the cash conversion cycle are not applicable to any of them — the blanks are a feature of the business model, not missing data. Capital expenditure definitions differ: Fiserv’s line includes capitalised software and other intangibles, while Block’s and Shopify’s are purchases of property and equipment only. Adyen’s capital expenditure is a company-defined non-IFRS measure translated from euros. See Appendix A.1.
Not one company in this peer set carries inventory, which removes three of the five conventional efficiency metrics at a stroke and is worth stating plainly rather than leaving as a row of blanks. What remains says two useful things.
The first is a warning dressed as a strength. PayPal’s days sales outstanding is the lowest in the set, a handful of days against Fiserv’s and Block’s much longer cycles. That looks like exceptional collection discipline, and in a narrow sense it is: PayPal collects at the moment of the transaction, and Section 3 confirmed that trade receivables actually declined in absolute dollars while revenue grew. But the ratio measures a smaller share of PayPal’s economic exposure than it does for any peer here. PayPal’s consumer and merchant credit exposure sits in separate loan captions and, for the forward-flow programme, partly off the balance sheet entirely behind a contingent repurchase and indemnification obligation. Fiserv’s longer cycle reflects genuine B2B contract billing to bank and merchant clients; PayPal’s short one reflects a classification boundary. A reader who takes the days-sales-outstanding ranking as evidence of superior credit management has read the opposite of what Sections 2 and 3 establish about the merchant loan book.
The second is capital intensity, and here PayPal sits where the business model predicts: capital expenditure absorbs 2.6% of revenue, well below Fiserv, below Adyen, above Shopify’s near-zero figure and slightly above Block’s. The definitional caveat matters — Fiserv’s figure includes capitalised software and intangibles while Block’s and Shopify’s capture only purchases of property and equipment, so Fiserv’s apparent intensity is partly a broader definition. The substantive point is the one Section 3 made and the peer set corroborates: PayPal’s spend has run below its own depreciation for five consecutive years while technology expense was also flat in nominal dollars. Low capital intensity is the source of PayPal’s peer-leading return on invested capital; it is also, at this level and for this duration, the mechanism by which that return is being borrowed from the future.
5.7 Comparability Caveats
sources Every material issue identified by the peer research is disclosed here, with the adjustment a reader should make. None of them is mentioned here and then ignored above.
C001 — Revenue definitions are fundamentally different across the set (Block, Adyen; affects every margin and any enterprise-value-to-revenue measure). PayPal reports net revenues gross of transaction expense; Fiserv and Shopify report GAAP gross revenue, with Shopify’s merchant-solutions line being grossed-up payments processing; Block’s headline total net revenue is dominated by near pass-through Bitcoin-ecosystem sales; Adyen’s net revenue is struck after interchange and scheme fees. Block’s margins in this section are therefore computed on gross profit and Adyen’s on post-interchange net revenue. How to adjust: do not rank these companies by revenue size under any circumstances, and remember that PayPal’s own top line still contains its largest cost — its transaction-margin dollars are materially lower than the headline, so its margins are struck on a wider base than Block’s or Adyen’s and understate the like-for-like comparison.
C002 — Adyen is an IFRS reporter in euros, assembled from half-year letters, on non-IFRS measures (Adyen; affects everything). Adyen’s full-year figures were constructed by summing its H1 and H2 shareholder-letter figures; there is no single audited US-style annual statement in the source used. [Rating and price target withdrawn — see the note at the top.] Its EBITDA and free cash flow are company-defined non-IFRS measures. How to adjust: treat every Adyen comparison as directional. It supports statements about rank and order of magnitude, and it does not support statements about precise gaps.
[Rating and price target withdrawn — see the note at the top.] How to adjust: PayPal’s price-to-earnings multiple is higher, and its net margin, return on equity and return on invested capital lower, on normalised earnings than any table in this section shows. The same caveat runs in the opposite direction for Shopify, whose FY2025 net income absorbed an unrealised loss on its equity-investment portfolio, and for Adyen, whose net margin is lifted by non-operating finance income on cash balances. No conclusion in this report is anchored on the FY2025 price-to-earnings comparison.
C004 — Custodial customer balances gross up three of the five balance sheets (PayPal, Block, Adyen; affects ROA, asset turnover, current ratio, and any net-debt measure). All three carry very large customer balances recorded as both assets and offsetting liabilities. Fiserv’s settlement balances are smaller relative to its size and Shopify carries none. How to adjust: return on assets, asset turnover and the current ratio are not comparable across this set. They understate the true capital efficiency of PayPal, Block and Adyen, and they overstate Shopify’s relative efficiency. Discard those three comparisons rather than adjusting them.
C005 — Fiserv carries heavy acquisition-intangible amortisation and materially higher leverage (Fiserv; affects EBIT margin, EBITDA margin, net debt to EBITDA). The gap between its EBITDA and EBIT margins is several times PayPal’s, and it is amortisation of intangibles from a large legacy acquisition. It also runs the only meaningful leverage in the set. How to adjust: compare Fiserv to PayPal on EBIT, after the cost of the scale it bought, not on EBITDA. On EBITDA the comparison flatters Fiserv materially.
C006 — Block’s debt figure excludes warehouse funding facilities (Block; affects total debt, net debt to EBITDA, EV/EBITDA). Block discloses corporate debt and, separately, asset-backed warehouse facilities that fund its loans-held-for-investment book. The warehouse lines were excluded from Block’s debt for comparability with PayPal, on the same logic that excludes non-recourse debt. How to adjust: including them would raise Block’s net leverage but would leave it low; on the basis carried in the table it is a tenth of a turn — immaterial, though not the net-cash position the phrase would imply. The exclusion is disclosed so the reader knows which figure is in the table.
C007 — Adyen is unlevered, net-cash and holds a banking licence (Adyen; affects ROIC, net debt to EBITDA, interest coverage, EV/EBITDA). It carries no borrowings beyond lease liabilities, and its cash is overwhelmingly merchant funds held under its banking licence. The conventional invested-capital formula turns negative, so its return on invested capital was computed on an operating-capital basis (equity plus leases); its net-debt-to-EBITDA multiple and interest coverage are not meaningful; and its enterprise value was struck without netting the custodial cash, because netting it would understate enterprise value. How to adjust: read Adyen’s balance-sheet-derived metrics as approximations of a different capital structure, not as points on the same scale as PayPal’s.
C008 — Shopify is a growth outlier, not a valuation comparable (Shopify; affects EV/EBITDA, P/E, net debt to EBITDA, interest coverage). Its multiples are several times those of the rest of the set; it is debt-free and net-cash; its low operating margins reflect deliberate reinvestment rather than weak economics; and it carries a large equity-investment portfolio whose mark-to-market swings distort net income and returns. How to adjust: use Shopify as a growth benchmark and as the competitive reference point for the checkout surface. Do not use it to anchor a valuation for PayPal, and note that this report does not.
C009 — Fiscal-period alignment is clean (all peers; informational). PayPal and all four peers have December fiscal year-ends and every figure covers the twelve months to 31 December 2025. No period lag, stub-period relabelling or calendarisation adjustment is applied anywhere in this section.
C010 — Block’s prior-year earnings were tax-distorted; FY2025 is the clean base (Block; informational, affects P/E and ROE). Block’s FY2024 net income was inflated by large one-off tax benefits, so its year-over-year earnings comparison looks weak while the FY2025 base is in fact the cleaner one. Its price-to-earnings multiple in §5.5 is struck on the clean FY2025 figure.
Two further caveats belong to this report rather than to the peer research, and are disclosed on the same footing.
First, all peer valuation multiples are Tier 2, single-source market data. Peer market capitalisations were captured in early August 2026 from a single source and are subject to change with price movements; no operating figure in this section is aggregator-sourced. The peer artefact carries a comparability flag for enterprise value to EBITDA but none for price-to-earnings, so the market-sourced mark on the peer P/E column — and the additional IFRS and euro-translation marks on Adyen’s — have been carried across by the analyst rather than supplied by the source data. Peer price-to-earnings figures must not be read as filing-sourced. PayPal’s own multiples are computed in the FL model at the current share price against reported FY2025 figures, which is a different construction from the peers’ and a further reason to weigh rank over gap size.
Second, PayPal’s return measures come from the FL model while the peers’ were computed by the peer researcher from each filing. The two use slightly different invested-capital and averaging conventions. The ranking is robust to those differences — PayPal leads the set on return on invested capital under any reasonable convention — but the size of the gap to any individual peer should be treated as approximate rather than precise.
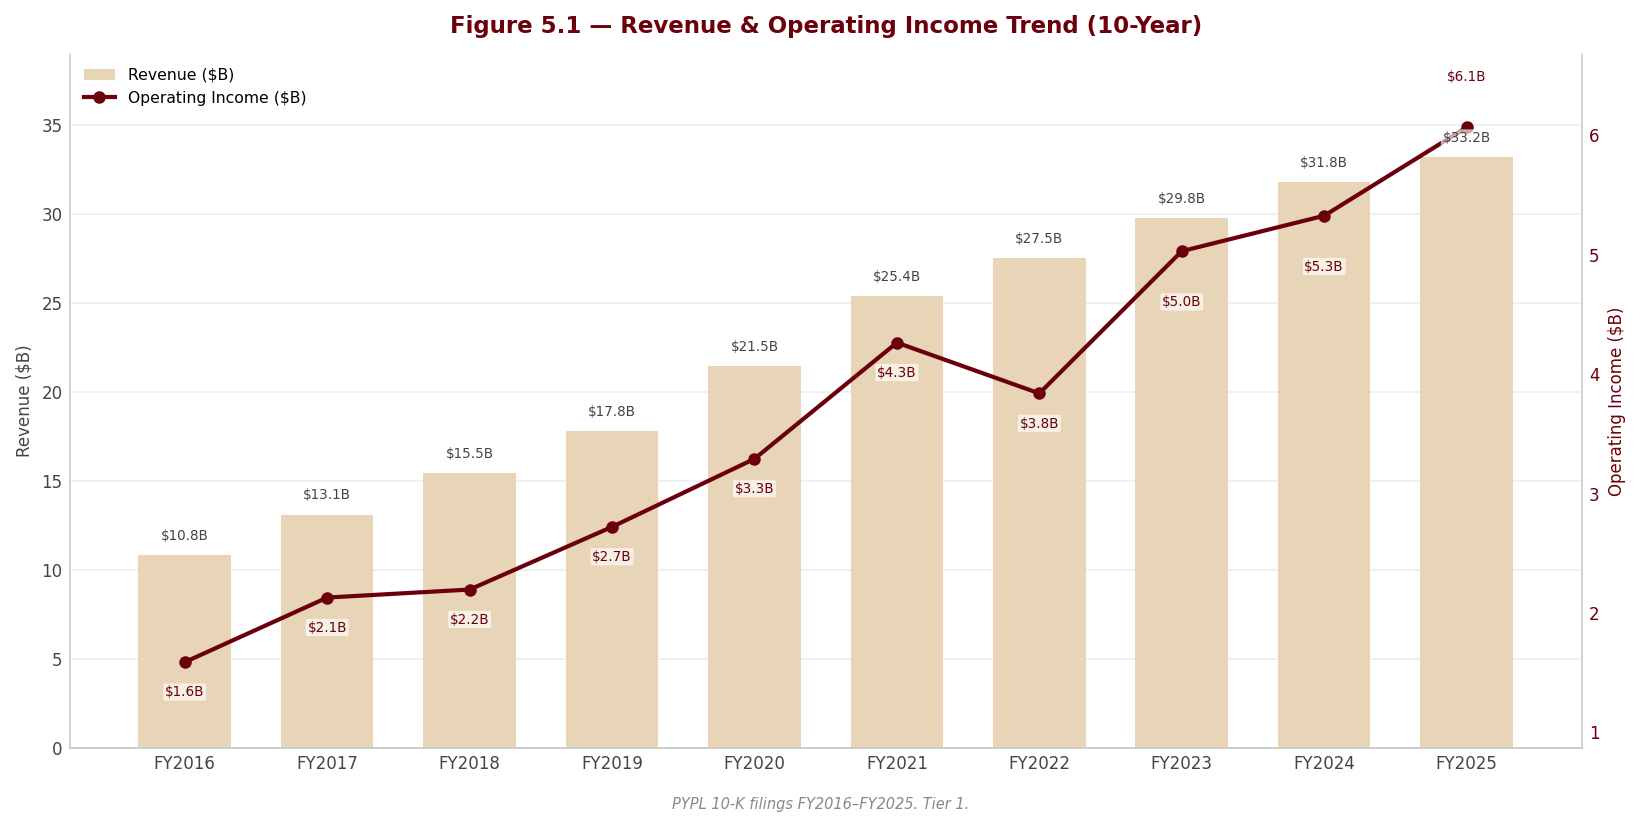
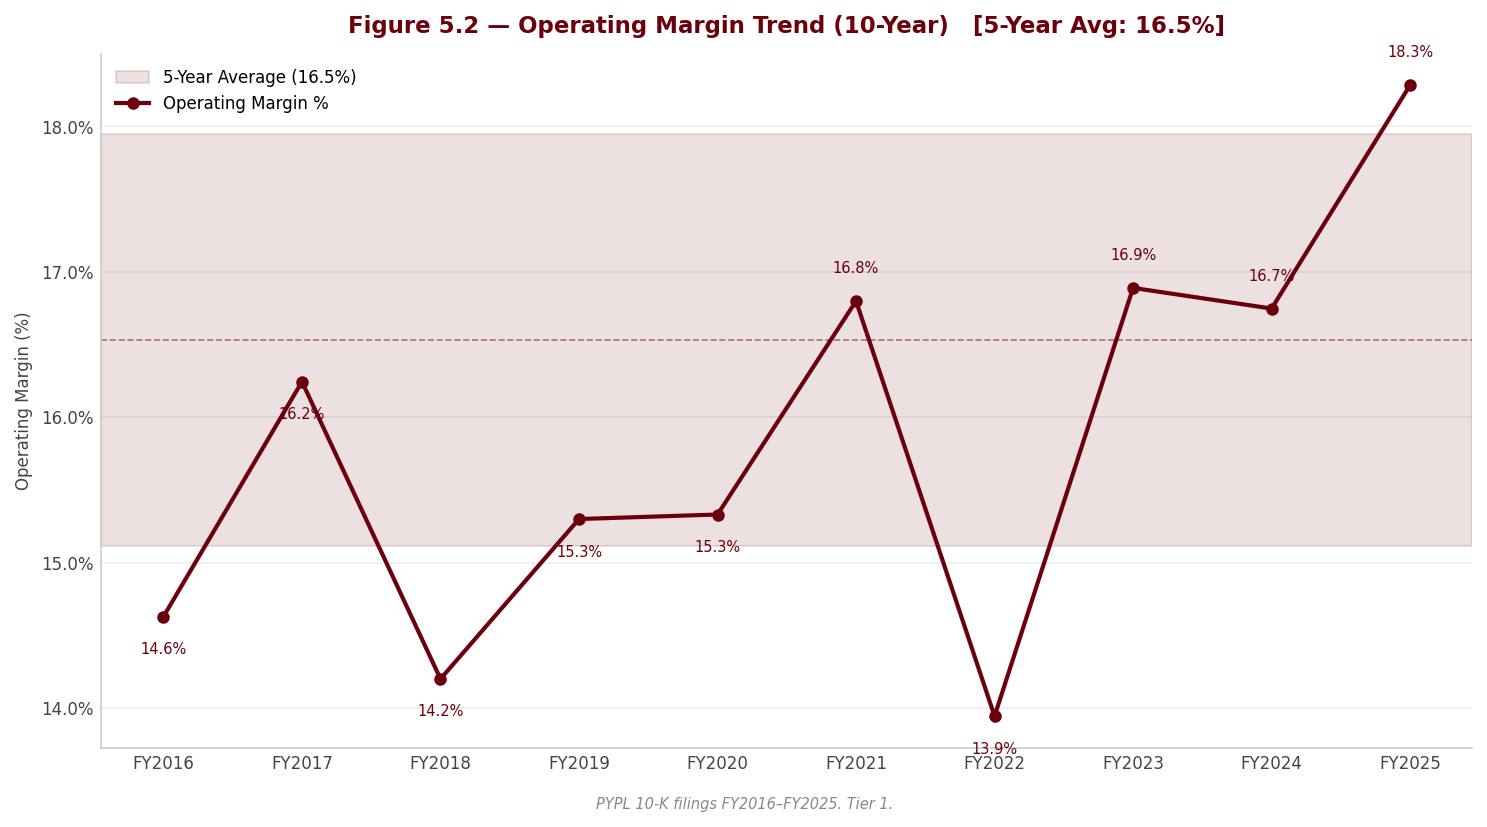
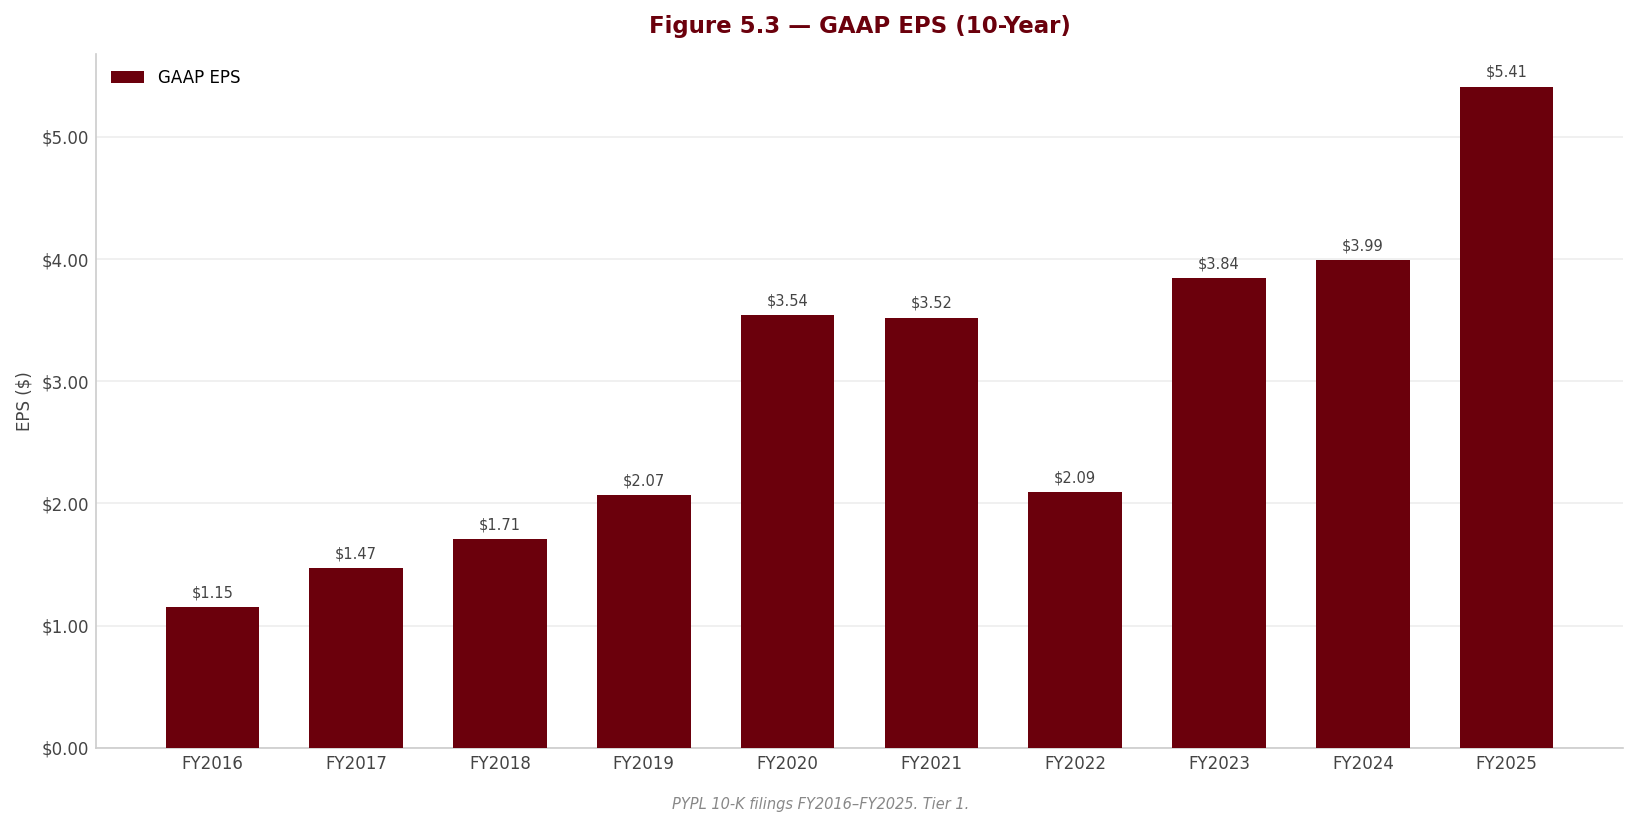
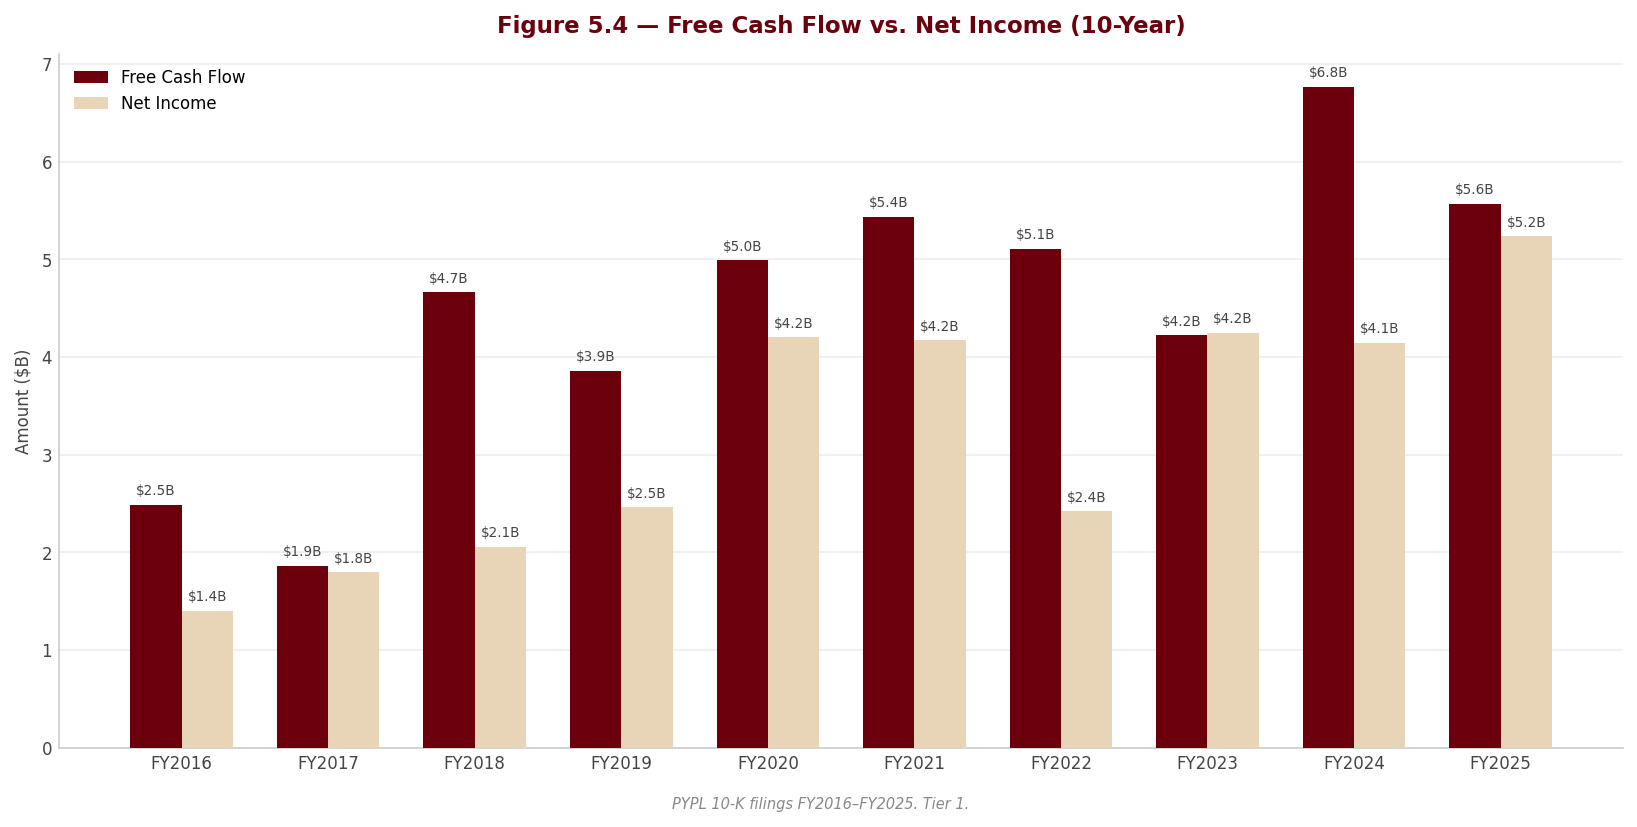
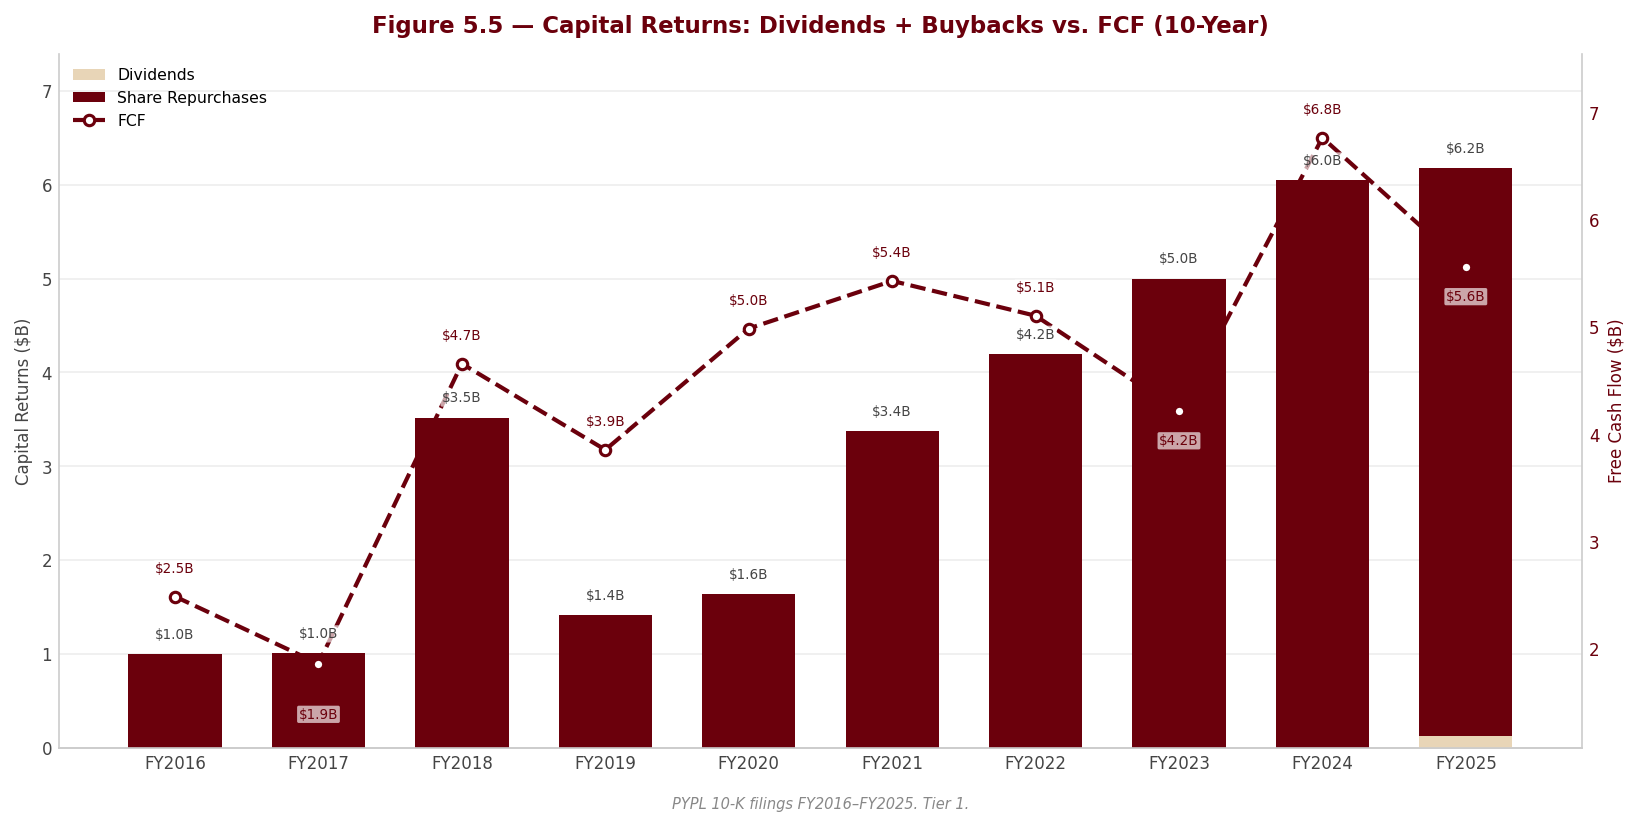
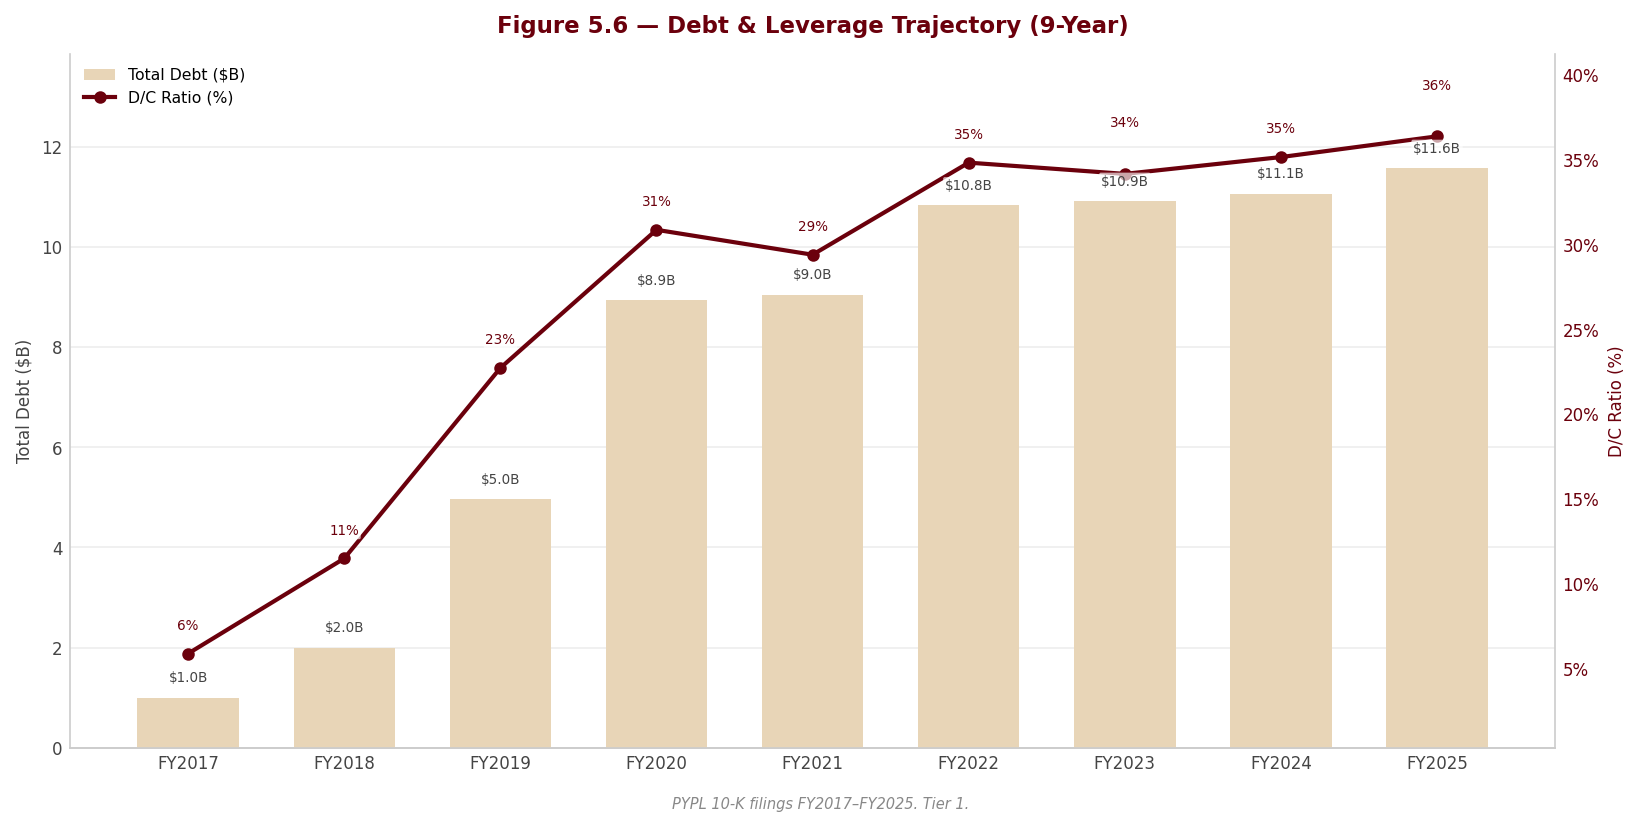
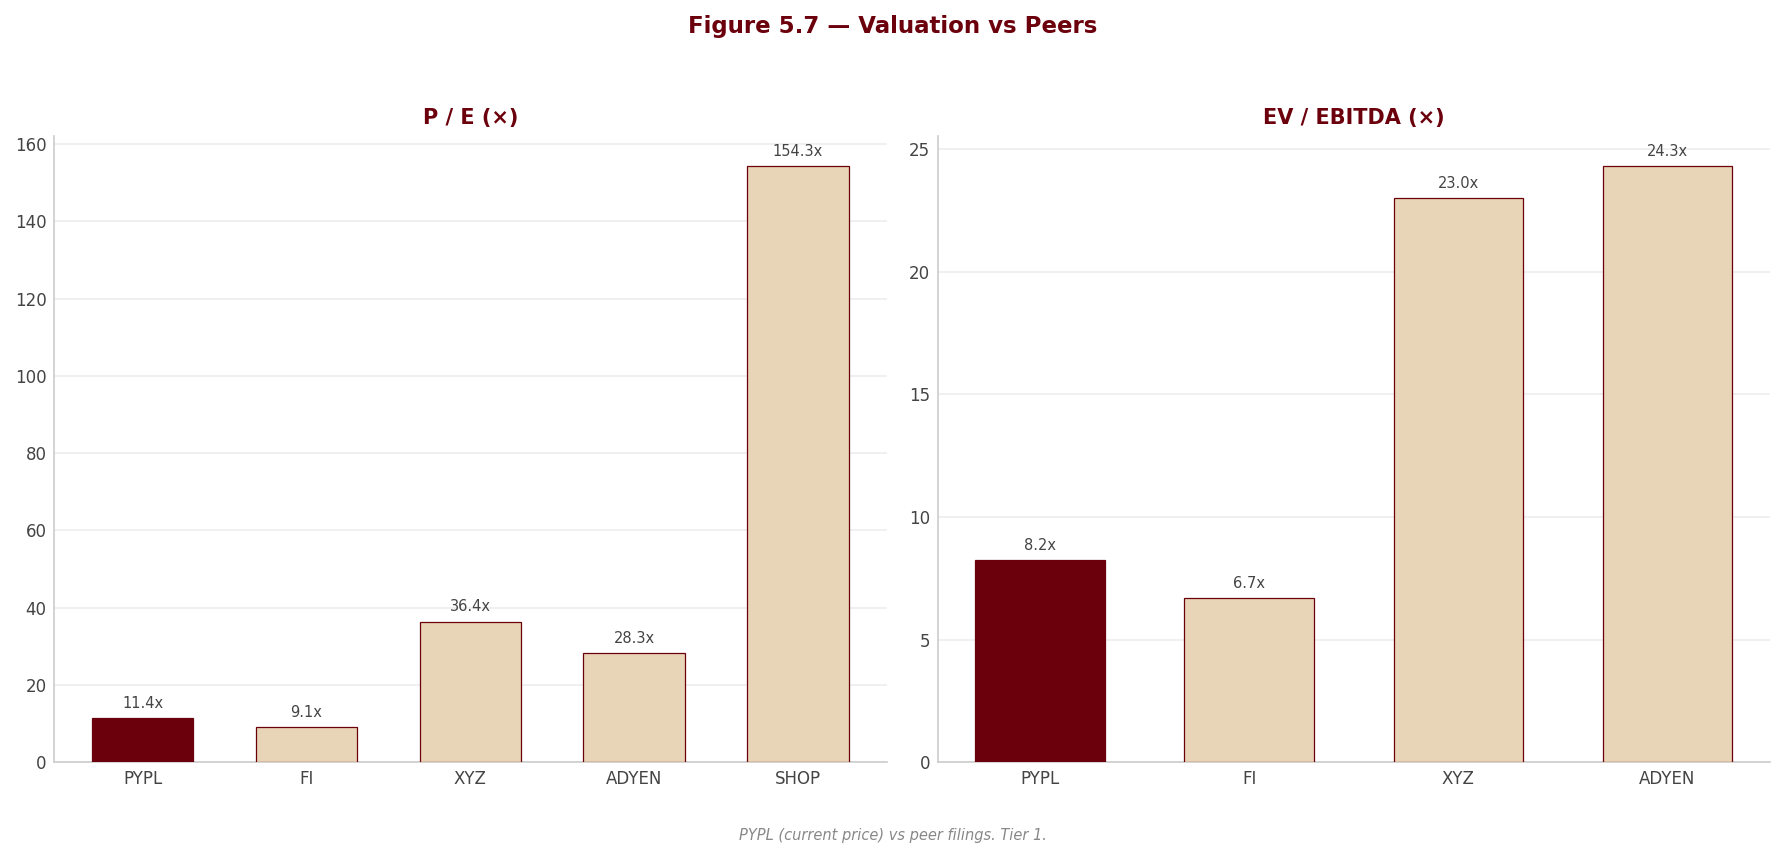
6. Valuation & Price Target withdrawn
This section stated what the shares were worth and what to do about them. It rested on an exit multiple set by hand — across the coverage it averaged 24% below where each company actually traded — so the conclusion largely restated that assumption instead of testing it. Rather than leave it standing, it has been withdrawn while the method is rebuilt.
Nothing else in this report depends on it: the financial analysis above and below is drawn from the company's own filings, and every figure links to the page it was verified against.
Section 7 — Quarterly Update: Q2 2026
Portfolio Action
[Rating and price target withdrawn — see the note at the top.]
| Assessment | |
|---|---|
| Action | [Rating and price target withdrawn — see the note at the top.] |
| Reason | [Rating and price target withdrawn — see the note at the top.] |
| Thesis intact? | [Rating and price target withdrawn — see the note at the top.] Two of the downgrade triggers the separate valuation pre-committed to are now firing. |
| Trigger to revisit | [Rating and price target withdrawn — see the note at the top.] |
Source: PayPal Holdings, Inc. Form 10-Q for the quarterly period ended June 30, 2026, and the FL model; see Appendix A.1.
7.1 Results at a Glance
| Metric | Q2 2026 | Q2 2025 | YoY Δ | Q1 2026 | QoQ Δ |
|---|---|---|---|---|---|
| Revenue ($M) | $8,682.0M | $8,288.0M | +4.8% | $8,353.0M | +3.9% |
| Gross Profit ($M) | —ᵃ | —ᵃ | —ᵃ | —ᵃ | —ᵃ |
| Gross Margin | —ᵃ | —ᵃ | —ᵃ | —ᵃ | —ᵃ |
| Transaction margin ($M)ᵇ | 3,447 | 3,473 | -0.7% | 3,336 | +3.3% |
| Transaction margin (% of TPV)ᵇ | 0.71% | 0.78% | -7.4 bp | 0.72% | -1.1 bp |
| [Rating and price target withdrawn — see the note at the top.] | 1.78% | 1.87% | -8.4 bp | 1.80% | -1.6 bp |
| EBITDA ($M) | $1,673.0M | $1,743.0M | -4.0% | $1,726.0M | -3.1% |
| EBITDA Margin | 19.3% | 21.0% | -1.8 pp | 20.7% | -1.4 pp |
| EBIT ($M) | $1,427.0M | $1,504.0M | -5.1% | $1,488.0M | -4.1% |
| EBIT Margin | 16.4% | 18.1% | -1.7 pp | 17.8% | -1.4 pp |
| Net Income ($M) | $1,104.0M | $1,261.0M | -12.5% | $1,113.0M | -0.8% |
| Net Margin | 12.7% | 15.2% | -2.5 pp | 13.3% | -0.6 pp |
| Diluted EPS | $1.25 | $1.29 | -3.1% | $1.21 | +3.3% |
YoY Δ formula (shown once for this subsection): (CQ - PYSQ) / |PYSQ| × 100 — e.g. Revenue = (8,682 - 8,288) / 8,288 × 100 = +4.8%. QoQ Δ = (CQ - PQ) / |PQ| × 100 — e.g. Revenue = (8,682 - 8,353) / 8,353 × 100 = +3.9%. Margin = line ÷ Revenue × 100 — e.g. EBITDA Margin CQ = 1,673 / 8,682 × 100 = 19.3%; EBIT Margin CQ = 1,427 / 8,682 × 100 = 16.4%; Net Margin CQ = 1,104 / 8,682 × 100 = 12.7%. [Rating and price target withdrawn — see the note at the top.]*
ᵃ PayPal reports no cost of revenue, no gross profit and no inventory: the income statement runs from net revenues directly to total operating expenses to operating income (10-Q p. 7). No gross-profit or gross-margin figure exists in this filing or in any comparative period, so none can be shown or computed. The first margin this business reports is the operating margin. §
ᵇ Analyst-computed from figures disclosed in the 10-Q, and shown here because they are the closest thing PayPal has to a unit-economics disclosure (Section 1, §1.1). Transaction margin = transaction revenues less transaction expense: Q2 2026 = $7,832M - $4,385M = $3,447M; Q2 2025 = $7,441M - $3,968M = $3,473M; Q1 2026 = ($15,333M - $7,832M) - ($8,550M - $4,385M) = $3,336M (10-Q pp. 7, 19, 76, 79). [Rating and price target withdrawn — see the note at the top.] Total payment volume is a management-defined operating metric disclosed in MD&A — it is not an audited financial-statement figure and is not covered by any auditor’s opinion.
Source: PayPal Holdings, Inc. Form 10-Q for the quarterly period ended June 30, 2026 — Condensed Consolidated Statements of Income (Loss) (p. 7), Net Income (Loss) Per Share (Note 3, p. 19), key metrics table (p. 78), net revenue analysis (p. 76), operating expenses (p. 79). EBITDA and D&A are analyst-derived standalone-quarter figures (EBIT + D&A), the quarterly D&A being total depreciation and amortisation for the three months as disclosed in the segment note (p. 69).
7.2 P&L Drivers
sources [Rating and price target withdrawn — see the note at the top.] The composition is the mix shift stated in dollars: Braintree, the low-yield unbranded channel, added approximately $400M and Venmo approximately $60M, while revenue from PayPal-branded products and services declined by approximately $130M on higher co-marketing campaigns with large merchants (recorded as reductions to revenue) and lower foreign-exchange fee revenue; the year-over-year swing in hedging contributed a further approximately $80M, moving from net losses to net gains (10-Q p. 76). Currency did roughly a fifth of the work: management quantifies the total favourable FX impact on net revenues at $80M — $74M excluding hedging plus $6M of hedging, a different measure from the $80M hedging swing above — and the net favourable impact on operating income at $55M, so ex-FX revenue growth was approximately 3.8% and ex-FX operating income would have been approximately $1,372M, down 8.8% YoY rather than 5.1% (10-Q p. 73). [Rating and price target withdrawn — see the note at the top.]
Cost and margin: PayPal reports no cost of revenue, so there is no gross margin to move; the operating margin is the first margin, and it fell 1.7 pp YoY to 16.4%. [Rating and price target withdrawn — see the note at the top.] D&A of $246.0M versus $239.0M in Q2 2025 is a non-factor (+2.9%), which is why the EBITDA margin fell almost as far as the EBIT margin (-1.8 pp versus -1.7 pp) — this is not a depreciation effect. Three cost lines helped and none is structural: transaction and credit losses fell 17% to $397M on lower fraud losses and higher recoveries (10-Q p. 79), sales and marketing fell 6% to $546M, and restructuring and other fell 3% to $113M. Working against them, technology and development rose 11% to $849M and customer support and operations rose 12% to $462M (10-Q p. 79). The most important number in this subsection is not a margin percentage: transaction revenues less transaction expense — PayPal’s only true unit-economics measure — fell in absolute dollars to $3,447M from $3,473M while volume grew 10%. On volume, that is 0.71% of TPV against 0.78% a year ago.
Below the line: Interest expense of $126.0M (up 10.5% from $114M) sits inside “other income (expense), net” and never appears on the face of the income statement (10-Q p. 28); that line swung to -$117M from +$25M, driven by net losses and impairments on strategic investments of -$74M against +$11M and by interest income falling to $104M from $135M (10-Q pp. 28, 83). This is the FY2025 earnings-quality reversal arriving on schedule: the same non-cash strategic-investment marks that added to FY2025 net income now subtract from it. Diluted EPS of $1.25 fell $0.04 (-3.1%) YoY and rose $0.04 (+3.3%) QoQ — net income fell 12.5% but EPS fell only 3.1% because the diluted share count fell 9.7% to 882M from 977M (10-Q p. 19); on the prior-year share count, EPS would have been approximately $1.13.
7.3 Balance Sheet & Cash Flow
| Metric | Q2 2026 | Q2 2025 | YoY Δ | Q1 2026 | QoQ Δ |
|---|---|---|---|---|---|
| Cash ($M) | $8,306.0M | $6,688.0M | +24.2% | $6,977.0M | +19.0% |
| Net Debt ($M) | $5,094.0M | $4,767.0M | +6.9%ᶜ | $4,589.0M | +11.0%ᶜ |
| Net Debt / LTM EBITDA | 0.74× | — | — | — | — |
| Total Assets ($M) | $82,737.0M | $79,777.0M | +3.7% | $80,546.0M | +2.7% |
| Equity ($M) | $19,820.0M | $20,201.0M | -1.9% | $20,024.0M | -1.0% |
| OCF ($M) | $1,983.0M | $898.0M | +120.8% | $1,134.0M | +74.9% |
| CapEx ($M) | $208.0M | $206.0M | +1.0% | $231.0M | -10.0% |
| FCF ($M) | $1,775.0M | $692.0M | +156.5% | $903.0M | +96.6% |
| Dividends Paid ($M) | $122.0M | $0.0M | —ᵈ | $130.0M | -6.2% |
Net Debt / LTM EBITDA: LTM EBITDA = Q3 2025 $1,765M + Q4 2025 $1,745M + Q1 2026 $1,726.0M + Q2 2026 $1,673.0M = $6,909M. Net Debt CQ $5,094.0M ÷ $6,909M = 0.74×. Net Debt is short-term debt plus long-term debt less cash and cash equivalents ($2,505M + $10,895M - $8,306M, 10-Q p. 6); it excludes $2,950M of short-term investments and $39,743M of funds receivable and customer accounts, the latter being custodial customer money and not a corporate asset.
ᶜ Stated on one consistent basis, which required rebuilding the comparatives from the notes. This 10-Q is the first to present a “Short-term debt” line on the face of the balance sheet: at 30 June 2026 it holds $2,505M — the current portion of term debt ($1,749M), $200M of commercial paper and the ~$556M Paidy yen facility, which moved out of long-term debt during the year (10-Q pp. 6, 55, 57). The comparative quarters were presented without that line, those borrowings sitting inside “accrued expenses and other current liabilities”, so taking net debt off the face of the earlier balance sheets would understate it and make the percentage change measure a change in presentation rather than in borrowing. Net debt is an analyst aggregate, not a filing line, so the fix is to build every period from the same disclosures: short-term debt is $159M at 30 June 2025 (current portion only — the Paidy facility was in long-term debt, Q2 FY2025 10-Q p.39, and the commercial paper programme did not yet exist) and $2,157M at 31 March 2026 (current portion $1,394M + commercial paper $200M + Paidy ~$563M, which that filing states was in current liabilities at 31 March 2026 and in long-term debt at 31 December 2025, Q1 FY2026 10-Q pp. 35–36). Each date ties out independently: at 31 March 2026 the balance sheet’s long-term debt of $9,409M equals the note’s total carrying amount of term debt exactly, proving the Paidy facility had left it. The cause of the increase is unambiguous: $2.0bn of notes issued in May 2026, with term debt rising to $12,728M from $10,884M at 31 December 2025.
YoY Δ and QoQ Δ use the same formulas shown in 7.1 — e.g. Net Debt QoQ = (5,094 - 4,589) / 4,589 × 100 = +11.0%; FCF YoY = (1,775 - 692) / 692 × 100 = +156.5%. CapEx and dividends are shown as positive magnitudes because that is how they are stored in the model; both are cash outflows.
ᵈ PayPal paid no dividend in Q2 2025 — the first quarterly dividend in the company’s history was declared in the fourth quarter of FY2025 — so a percentage change on a zero base cannot be computed. The absolute change is +$122M. The Q2 2026 figure of $122.0M is the standalone-quarter cash outflow derived from the six-month payment of $252M less the $130M paid in Q1 2026 (10-Q p. 13); the dividend declared for the quarter was $0.14 per share totalling approximately $125M (10-Q pp. 9, 63, 89).
Source: PayPal Holdings, Inc. Form 10-Q for the quarterly period ended June 30, 2026 — Condensed Consolidated Balance Sheets (p. 6), Condensed Consolidated Statements of Cash Flows (pp. 13, 15), Debt (Note 12, pp. 53–57). Standalone-quarter cash-flow figures are analyst-derived by differencing the six-month statement against Q1 2026, because the 10-Q presents cash flows on a year-to-date basis only. Q3 2025 and Q4 2025 EBITDA are standalone-quarter figures from the FL model (Data sheet, quarterly columns).
[Rating and price target withdrawn — see the note at the top.] Net debt therefore rose to $5,094.0M from $4,589.0M — both figures built on the same basis, since this is the first quarter to carry a short-term debt line on the face of the balance sheet and the comparative had to be rebuilt from the notes (see note ᶜ above) — and the proceeds are explicitly available for share repurchases (10-Q p. 53). Equity fell to $19,820.0M despite $1,104M of net income because $1,514M of stock was repurchased — taking treasury stock to $36,165M from $34,651M at 31 March 2026 — and $125M of dividends were declared (10-Q p. 9); note also that $39,743M of the $82,737M asset base is funds receivable and customer accounts, against $41,743M of funds payable and amounts due to customers, so reported current assets and current liabilities are custodial and must not be read as working capital (10-Q p. 6).
Cash flow note: FCF conversion = FCF ÷ Net Income = 1,775 ÷ 1,104 × 100 = 160.8%, and operating cash flow more than doubled YoY to $1,983.0M from $898.0M — but the improvement is substantially a tax-payment timing effect rather than operating strength: cash paid for income taxes in the six months was $225M against $837M, a $612M swing that management attributes to the final transition-tax instalment having been paid in the prior-year period (10-Q pp. 15, 87). Management’s own bridge for the $1.1 billion six-month OCF increase is approximately $450M from timing differences in payment-partner and income-tax receivables, approximately $240M from lower annual incentive plan payments, approximately $230M from net income adjusted for non-cash items and approximately $190M from accounts receivable — only the third of those four is recurring (10-Q p. 85). The gross loan-warehousing flows that Section 2 flagged as distorting this statement grew sharply: originations of loans held for sale of $23,779M and repayment/sale proceeds of $23,373M in the six months, against $14,358M and $14,112M a year earlier (10-Q p. 13).
7.4 Footnote Review
sources Every note in this filing (Notes 1 through 18, pp. 16–69), together with MD&A, Item 3 market-risk disclosures, Part II legal proceedings and risk factors, was read in this session.
Note 1 — Overview and Summary of Significant Accounting Policies (10-Q pp. 16–18) Basis of presentation and consolidation are unchanged; no variable interest entity qualified for consolidation at either 30 June 2026 or 31 December 2025. Non-consolidated VIE carrying value was $193M against $202M at 31 December 2025, with maximum exposure to loss of $246M at both dates — unchanged. Two pronouncements are disclosed as not yet adopted: ASU 2024-03 on expense disaggregation (annual periods beginning after 15 December 2026) and ASU 2025-06 on internal-use software (fiscal years beginning after 15 December 2027). One sentence deserves attention because it is easy to skim: “Certain amounts for prior periods have been reclassified to conform to the financial statement presentation as of and for the three and six months ended June 30, 2026” (p. 16). The filing does not quantify the reclassification or name the affected lines, so its size cannot be established from this document; the prior-period income-statement and key-metric figures shown throughout this section are those as presented in this 10-Q. ASU 2024-03 matters prospectively — it will eventually force the natural-expense disaggregation that a single-segment reporter currently does not provide.
Note 2 — Revenue (10-Q pp. 18–20) Net revenues disaggregate to U.S. $5,048M (from $4,709M, +7.2%) and other countries $3,634M (from $3,579M, +1.5%); by category, transaction revenues $7,832M (from $7,441M, +5.3%) and other value added services $850M (from $847M, +0.4%). Contract assets were $248M against $238M at 31 December 2025. The disclosure that changed is the footnote quantifying revenue outside the scope of ASC 606 — interest and fees on loans, hedging gains and losses, and interest on assets underlying customer balances — which rose to $589M from $506M in the prior-year quarter (p. 20). [Rating and price target withdrawn — see the note at the top.]
Note 3 — Net Income (Loss) Per Share (10-Q pp. 19–20) Diluted shares 882M against 977M (-9.7%); basic 877M against 969M. The dilutive effect of equity incentive awards shrank to 5M from 8M, while common stock equivalents excluded as anti-dilutive rose to 31M from 14M — more than doubling. That is a direct consequence of the depressed share price: a large part of the equity-award overhang is now out of the money and therefore invisible in diluted EPS. It flatters reported per-share figures today and would reverse if the share price recovered.
Note 4 — Business Combinations (10-Q p. 21) One acquisition completed in Q1 2026 for a total purchase price of $134M, primarily cash; the prior-year comparative is one acquisition in Q2 2025 for $19M. No acquisition occurred in the current quarter. Immaterial at roughly 1.5% of quarterly revenue; noted because it is the source of the goodwill movement in Note 5.
Note 5 — Goodwill and Intangible Assets (10-Q p. 21) Goodwill rose to $10,929M from $10,864M at 31 December 2025, being $104M acquired less $39M of foreign currency translation. No impairment was recorded and none is disclosed. Intangible assets, net fell to $178M from $208M; amortisation expense was $33M in the quarter against $48M in Q2 2025, and future amortisation is $50M for the remainder of 2026 and $67M in 2027. The $15M year-over-year decline in intangible amortisation is a small, finite tailwind inside sales and marketing — it explains part of that line’s 6% decline and it runs out inside two years.
Note 6 — Leases (10-Q pp. 23–25) Total lease expense, net was $47M against $42M in Q2 2025. The change worth naming is the commitment side: right-of-use assets obtained in exchange for operating lease liabilities were $154M in the quarter against nil in Q2 2025; total operating lease liabilities rose to $810M from $696M at 31 December 2025; and the weighted-average remaining operating lease term extended to 6.6 years from 5.4 years. PayPal signed materially longer-dated property commitments in the same quarter in which its restructuring plan is exiting data centres for cloud (Note 17). The amounts are small against a $7,255M quarterly cost base, but the direction sits awkwardly beside the cost-programme narrative.
Note 7 — Other Financial Statement Details (10-Q pp. 25–28) This note carries the interest-expense disclosure that never appears on the face of the income statement. Other income (expense), net was -$117M against +$25M, comprising interest income $104M (from $135M), interest expense -$126M (from -$114M), net losses on strategic investments -$74M (from +$11M) and other -$21M (from -$7M). AOCI improved to -$503M from -$513M at 31 March 2026, with cash-flow hedge gains of $101M against a -$277M position a year earlier. The analytically significant item is the $85M adverse swing in strategic-investment marks: this single non-cash line accounts for 54% of the $157M decline in net income, and it is the specific mechanism Section 3 identified as having flattered FY2025.
Note 8 — Cash, Funds Receivable and Customer Accounts, and Investments (10-Q pp. 29–36) Total funds receivable and customer accounts were $39,743M against $38,198M at 31 December 2025 — custodial money, not corporate liquidity. Total available-for-sale debt securities were $21,813M in fair value ($21,803M amortised cost) against $18,917M in fair value ($18,904M amortised cost) at 31 December 2025, with gross unrealised losses of only $5M at both dates; no credit-loss allowance was deemed necessary. Strategic investments fell to $1,735M from $1,904M at 31 December 2025, of which marketable equity securities $106M (from $180M) and non-marketable $1,629M (from $1,724M). Under the Measurement Alternative, gross unrealised losses and impairments were $63M in the quarter against $6M in Q2 2025, and $131M in the six months against $6M; cumulative gross unrealised losses and impairments reached $479M against $353M at 31 December 2025. [Rating and price target withdrawn — see the note at the top.]
Note 9 — Fair Value Measurement (10-Q pp. 37–42) No Level 3 assets or liabilities are measured at fair value on a recurring basis at either date. On a non-recurring basis the picture changed materially: loans and interest receivable held for sale measured at fair value were $1,395M, of which $253M is Level 3 (against $41M at 31 December 2025), and the Level 3 loans are marked using a price-based methodology at a weighted-average $0.89 per $1.00 of par (range $0.01 to $1.00). Non-marketable equity securities remeasured on observable price changes were $271M, of which $154M Level 3 against $11M at 31 December 2025. [Rating and price target withdrawn — see the note at the top.] The six-fold rise in Level 3 held-for-sale loans, carried at eleven cents below par, is the forward-flow programme’s execution price deteriorating in plain sight — and it corroborates the loss figures in Note 17.
Note 10 — Derivative Instruments (10-Q pp. 42–48) Total notional fell to $16,253M from $17,810M at 31 December 2025; derivative assets rose to $148M from $20M and liabilities fell to $52M from $158M as the dollar weakened. In the quarter, $6M of net cash-flow-hedge gains were reclassified into net revenues against $70M of losses in Q2 2025 — a $76M favourable swing inside the revenue line — and non-designated contracts produced -$42M in other income against -$152M. $101M of net derivative gains in AOCI are expected to reclassify into earnings within twelve months. The hedging programme is behaving as designed, but the $80M favourable total FX impact inside this quarter’s revenue growth (10-Q p. 76) — of which only $6M is the hedging programme itself, the rest being translation — is a timing transfer, not a durable revenue gain, and it will not repeat on the same basis.
Note 11 — Loans and Interest Receivable (10-Q pp. 48–53) This is the most important note in the filing for this thesis, and it deteriorated. Held for sale and the forward-flow programme: loans held for sale were $1.9 billion against $1.7 billion at 31 December 2025 and $817M at 30 June 2025 — a 133% year-over-year increase in the warehouse (10-Q pp. 48, 81). In the six months PayPal derecognised loans with an unpaid balance of $15.9 billion for net proceeds of $15.8 billion; in the prior-year six months unpaid balance and net proceeds were both $11.6 billion. A $0.1 billion gap has opened between par and proceeds where none existed a year ago. Consumer book: outstanding $5.5 billion, net of $36M of participation interest sold (from $33M). Delinquency at 30 June 2026 was 96.6% current and 1.5% over 90 days, against 96.4% and 1.4% at 31 December 2025. The allowance ended at $348M against $377M in the prior-year six months, on provisions of $101M (from $123M) and charge-offs of $156M (from $152M). Merchant book: outstanding $1.9 billion against $1.8 billion, net of $67M of participation interest sold (from $65M). Delinquency was 89.6% current against 89.8%, with 90–179 days at 3.3% against 3.0% and 180+ days at 0.6% against 0.5%. The allowance rose to $185M from $147M in the prior-year six months, on provisions of $91M (from $77M) and charge-offs of $84M — up 42% from $59M. Management states in both cases that the allowance “remained relatively consistent” with 31 December 2025 and that risk-parameter modifications had no material impact. [Rating and price target withdrawn — see the note at the top.]
Note 12 — Debt (10-Q pp. 53–57) [Rating and price target withdrawn — see the note at the top.] Total term debt is $12,728M against $10,884M at 31 December 2025; the current portion is $1,749M against $1,396M. Covenants: the notes carry limitations on liens, sale-and-leaseback transactions and merger or consolidation, plus an obligation to offer repurchase at 101% of principal upon both a change of control and a downgrade below investment grade. There is no financial maintenance covenant and no covenant ratio disclosed anywhere in this 10-Q, so no covenant level and no actual ratio against it can be reported — the only leverage measure available is the analyst-computed 0.74× net debt to LTM EBITDA in §7.3. Maturities are laddered: $1,250M remaining in 2026, $500M in 2027, $1,778M in 2028, $1,500M in 2029, $1,000M in 2030 and $6,700M thereafter. Interest expense on the notes was $119M against $110M. [Rating and price target withdrawn — see the note at the top.]
Note 13 — Commitments and Contingencies (10-Q pp. 57–63) Accrued amounts for legal and regulatory proceedings were “not material” at 30 June 2026, and reasonably possible losses in excess of accruals are also characterised as not material, with the caveat that non-monetary remedies cannot be estimated. Full treatment of each matter is in the dedicated litigation entry below. Two non-litigation items belong here. Indemnification on loans sold: the maximum potential future payment equals the outstanding balance of loans sold, which was $3.9 billion at 30 June 2026 against $3.8 billion at 31 December 2025 — the off-balance-sheet tail Section 2 identified, and it grew. Protection programmes: the allowance for transaction losses rose to $92M from $73M at 31 December 2025 while the allowance for negative customer balances fell to $221M from $271M; provision in the quarter was $323M against $383M, realised losses and charge-offs $373M against $371M, and recoveries $53M against $35M. The filing repeats that PayPal has “no off-balance sheet arrangements” with a material effect (p. 63) — a statement that sits uncomfortably beside a $3.9 billion contingent repurchase and indemnity exposure disclosed one page earlier.
Note 14 — Stockholders’ Equity (10-Q p. 63) In the six months PayPal repurchased approximately 67 million shares for approximately $3.0 billion at an average cost of $44.99, excluding excise tax, with approximately $10.9 billion remaining under the February 2025 authorisation. Quarterly repurchases were 33.0 million shares at monthly average prices of $48.24, $45.47 and $42.68 (10-Q p. 102) — the company bought progressively more shares at progressively lower prices through the quarter. Dividends: $0.14 per share paid 25 March 2026 ($130M) and $0.14 per share paid 25 June 2026 ($125M). The dividend per share is unchanged from its initiation; the total dollar cost is falling because the share count is falling.
Note 15 — Stock-Based Plans (10-Q p. 65) Stockholders approved the 2026 Equity Incentive Award Plan in May 2026, authorising up to 39.1 million new shares plus up to 44.6 million shares rolling over from the 2015 Plan. Stock-based compensation expense was $301M against $306M in Q2 2025 (-1.6%), with $31M against $33M capitalised. The expense is flat and modestly declining, consistent with the FY2025 trend Section 3 credited without qualification; the new plan’s 83.7 million share authorisation is, however, roughly 9.7% of the 862 million shares outstanding and is the future issuance the buyback must absorb.
Note 16 — Income Taxes (10-Q p. 65) [Rating and price target withdrawn — see the note at the top.] Gross unrecognised tax benefits were approximately $2.5 billion at both 30 June 2026 and 31 December 2025 — unchanged. [Rating and price target withdrawn — see the note at the top.]
Note 17 — Restructuring and Other (10-Q pp. 65–68) The $113M charge decomposes into: $44M for the strategic reorganisation announced in April 2026 (primarily severance, including stock-based compensation); approximately $2M for the 2Q 2025 Plan (a -$13M severance reversal offset by $15M of other costs), against $95M for that plan in Q2 2025; and approximately $65M of losses on sale of loans previously held for sale and lower-of-cost-or-fair-value adjustments, against $27M in Q2 2025. The restructuring reserve fell to $30M from $58M at 1 January 2026 on $41M of payments. The loan-sale losses inside this caption grew 141% year over year and are now 58% of the “restructuring” line — a recurring, credit-driven operating cost sitting inside a caption that most adjusted-earnings measures add back. Section 3 flagged this as a RED finding on FY2025 data; this quarter it is materially worse, not better.
Note 18 — Segment Information (10-Q p. 69) One operating and one reportable segment; the chief operating decision maker is the Chief Executive Officer and evaluates performance on consolidated net income. The note discloses significant expense categories for both periods on the same basis, and states total D&A of $246M for the quarter against $239M. Confirmed unchanged versus Q2 2025 (10-Q p. 69). The analytical consequence is unchanged and is stated once here: there is no segment operating income, so branded and unbranded profitability cannot be verified separately, and the transaction-margin calculation in §7.1 is the closest available substitute.
Related-party transactions (10-Q pp. 16–69, Notes 1–18; commitments at p. 62) PayPal has no controlling shareholder and there is no related-party transactions note in this filing. All eighteen notes were read in this session and none discloses a transaction with a controlling entity, affiliate, director or officer beyond ordinary-course compensation. The related-party-adjacent items that do exist, with amounts for both dates, are: equity-method non-marketable securities of $205M against $215M at 31 December 2025 (p. 35); non-consolidated VIE investments of $193M against $202M, with maximum exposure to loss of $246M at both dates (p. 16); participation interests sold to the partner chartered financial institution of $36M against $33M on the consumer book (p. 49) and $67M against $65M on the merchant book (p. 51); and the legacy eBay separation agreements, which provide reciprocal indemnity and liability obligations and under which no amount is quantified in this filing (p. 62). There are no non-controlling interests — total equity of $19,820.0M reconciles entirely to PayPal common stockholders (p. 6). The commercial arrangement with the third-party PYUSD stablecoin issuer is disclosed as a partnership with an unaffiliated party and carries no disclosed dollar amount (p. 98). No terms of any of the above are stated to have changed, and no dollar amount moved by more than $10M between the two dates. There is therefore no related-party extraction risk visible in this quarter, which is consistent with the clean finding recorded in Sections 1 and 2.
Contingencies and litigation (10-Q pp. 57–63; Part II Item 1, p. 96) Regulatory proceedings (p. 59). Five matters, all cooperative and none with a stated amount at stake: FTC civil investigative demands of February 2022 (commercial customers submitting charges for other merchants) and August 2025 (whether onboarding and due-diligence practices facilitated deceptive merchant schemes); a German Federal Cartel Office administrative proceeding of January 2023 on surcharging prohibitions and parity presentation; CFPB demands on Regulation E error-resolution and transaction presentment, and an August 2024 demand on PayPal Credit; and — new since the FY2025 10-K — U.K. Financial Conduct Authority investigations opened in March 2026 under the Competition Act 1998 into PayPal’s contractual agreements with Visa and Mastercard governing funding and use of the digital wallet. The German and U.K. matters are the ones with business-model consequence, because they attack the contractual protections on which checkout pricing rests. The older securities matter (p. 60). In re PayPal Holdings, Inc. Securities Litigation, concerning net-new-active-account disclosures for the class period 3 February 2021 to 1 February 2022, was dismissed in its entirety with prejudice on 31 March 2026; plaintiffs filed an appeal to the Third Circuit on 30 April 2026. The related Shah, Nelson and Spathias derivative actions remain stayed pending that action. This is the one favourable legal development in the filing. The branded-checkout matters — the material development (pp. 60–61). Darcy v. PayPal (filed 24 February 2026, class period 25 February 2025 to 2 February 2026) and Norfolk County Retirement System v. PayPal (filed 2 April 2026, expanding the class period back to 8 February 2024) were consolidated on 21 May 2026 as In re PayPal Branded Checkout Securities Litigation, Case No. 3:26-cv-01589, with Wayne County Employees’ Retirement System, three Macomb County funds and Norfolk County Retirement System appointed lead plaintiffs. Both allege failure to disclose impediments to the branded-checkout growth strategy that impaired the company’s ability to meet its 2027 financial targets. Five related derivative actions were filed in the same window — Goncalves (11 March), LR Trust (6 May), Stan (11 May), Lovoi (17 May) and Haliburton (3 June) — alleging breach of fiduciary duty, unjust enrichment, waste, gross mismanagement, abuse of control, insider trading and Exchange Act violations against officers and directors including the former Chief Executive Officer. Change versus the prior year: every branded-checkout matter above post-dates the FY2025 Form 10-K and did not exist in the Q2 2025 comparative. The escalation within this quarter is real — appointment of institutional lead plaintiffs and consolidation move the case from filing to litigation — and the class period has been extended backwards by a year. No amount at stake is stated in any matter, accruals are not material, and PayPal states it is unable to estimate the possible loss from non-monetary remedies (p. 57). The near-term financial exposure remains defence cost and management distraction; the analytical exposure is that discovery now runs directly across the operating question this section has just measured. General matters (pp. 61–62). Patent and intellectual-property claims and ordinary-course consumer, merchant and regulatory disputes are described generically, with no matter or amount identified — substantively unchanged language.
Subsequent events (10-Q pp. 3, 61, 89; Part II Item 5, p. 102) No subsequent-events note is presented — the notes run from Note 1 to Note 18 and none addresses post-balance-sheet events, and Part II Item 5 “Other Information” states “None” (p. 102). Four post-quarter facts are nonetheless disclosed elsewhere in the document and are listed here in full. (1) On 10 July 2026 the Goncalves, LR Trust, Stan and Lovoi derivative actions were consolidated in the Northern District of California as In re PayPal Holdings, Inc. Stockholder Derivative Litigation, Case No. 3:26-cv-02145 (p. 61). (2) In July 2026 management approved an additional $500M of European customer balances to fund credit activities, raising the cumulative approved amount to $2.5 billion from $2.0 billion — an increase of 25% in the customer float being redeployed into lending (p. 89). (3) 855,460,874 shares were outstanding as of 22 July 2026 against 862 million at the 30 June 2026 balance-sheet date (pp. 3, 6), indicating roughly 6.5 million further shares retired after quarter end. (4) The 10-Q was signed on 28 July 2026 by Enrique Lores as President and Chief Executive Officer and Jamie Miller as Chief Financial and Operating Officer (p. 104). Separately, though announced within the quarter rather than after it, management guided to a transformation-related charge of approximately $120M to $140M in the second half of 2026 (p. 71).
7.5 What Changed This Quarter
sources - The branded franchise shrank in revenue while the unbranded one grew. Revenue from PayPal-branded products and services fell by approximately $130M year over year, while Braintree added approximately $400M and Venmo approximately $60M (10-Q p. 76). Q1 2026 had shown PayPal-branded products up approximately $140M (Form 10-Q for the quarter ended March 31, 2026, p. 48), so this is a sequential reversal in the one line that matters most to the thesis. This is Risk 1 of Section 2 expressed in dollars rather than in a ratio.
[Rating and price target withdrawn — see the note at the top.] The annual steps in the FL model’s series had been narrowing: -8.0 basis points in FY2023, -5.6 in FY2024 and -4.2 in FY2025, which was the strongest single argument that the erosion was flattening. This quarter’s step is twice the FY2025 one and the largest annual-equivalent step since FY2021. [Rating and price target withdrawn — see the note at the top.]
- PayPal’s only true unit-economics measure went into absolute decline. Transaction revenues less transaction expense fell to $3,447M from $3,473M while TPV grew 10% (10-Q pp. 19, 79). Expressed on volume, PayPal kept 0.71 cents per dollar moved against 0.78 cents a year ago. Volume growth is no longer compensating for price concession — it is disguising it, which is precisely the outcome §2.1 warned could not be ruled out.
[Rating and price target withdrawn — see the note at the top.] Section 2 treated the deterioration as “concentrated rather than systemic” because the consumer book was moving the other way; that is no longer true. The consumer allowance is the auditor’s single critical audit matter, and Downgrade Trigger 4 is firing. [Rating and price target withdrawn — see the note at the top.]
-
The forward-flow programme is no longer selling loans at par, and the tail grew. In the six months PayPal derecognised loans with an unpaid balance of $15.9 billion for net proceeds of $15.8 billion; a year earlier both figures were $11.6 billion (10-Q p. 48). Level 3 loans held for sale rose to $253M from $41M at 31 December 2025 and are marked at a weighted-average $0.89 per $1.00 of par (10-Q pp. 40, 42). Losses on those sales inside “restructuring and other” grew to approximately $65M from $27M, and the contingent repurchase and indemnity balance rose to $3.9 billion from $3.8 billion (10-Q pp. 62, 68).
-
The first year-over-year rise in engagement per active account since the thesis was written — one quarter of the two required. Payment transactions per active account reached 60.0 against 58.3, up 3%, with transactions up 8% to 6,750 million and active accounts flat at 439 million (10-Q p. 78). In Q1 2026 the same metric was 58.7 against 59.4, down 1% (Form 10-Q for the quarter ended March 31, 2026, p. 48). the separate valuation’s first upgrade trigger requires two consecutive quarters of stabilisation; this is one. It is also worth exactly what it is worth: more transactions at a lower price per transaction.
[Rating and price target withdrawn — see the note at the top.]
[Rating and price target withdrawn — see the note at the top.] The quarter already carries $44M of the associated severance (10-Q p. 67).
[Rating and price target withdrawn — see the note at the top.] This is a variance against the report’s own expectation and is the single respect in which the quarter is better than Section 3 assumed — but it means the underlying operating deterioration is larger than the 12.5% net income decline shows.
7.6 Portfolio Decision
sources [Rating and price target withdrawn — see the note at the top.] This quarter delivered exactly the reversal Sections 1, 3 and 6 predicted — revenue up 4.8% to $8,682.0M while net income fell 12.5% to $1,104.0M as the strategic-investment marks that flattered FY2025 swung $85M the other way — and confirmation of a forecast is not, by itself, a reason to sell. [Rating and price target withdrawn — see the note at the top.] First, the operating margin fell to 16.4%, below the 16.7% FY2024 level that the separate valuation designated a downgrade condition, and it did so on transaction expense rising 11% against 4.8% revenue growth — with PayPal’s only unit-economics measure, transaction revenue less transaction expense, in absolute decline at $3,447M against $3,473M despite 10% volume growth. [Rating and price target withdrawn — see the note at the top.] The footnote review adds two things the income statement cannot show: the forward-flow programme is now selling loans below par ($15.8 billion of proceeds against $15.9 billion of unpaid balance, with Level 3 held-for-sale loans at $0.89 on the dollar), and the branded-checkout securities litigation has moved from filing to active litigation with institutional lead plaintiffs appointed and the class period extended back a full year. [Rating and price target withdrawn — see the note at the top.] What no longer exists is the valuation cushion. Once these figures were carried into the model, the downside case was rebuilt to compound the compression this quarter measured rather than to shift the base path by a fixed amount, and it fell to $51.62 — well below the $61.66 share price. [Rating and price target withdrawn — see the note at the top.] The judgment is that the price no longer discounts a slower decline than the one being measured, so the position should be sized down for that difference rather than exited on it — there is no margin beneath the price to be paid for waiting.
What would change this view: [Rating and price target withdrawn — see the note at the top.] Capital returned falling back below free cash flow would reinforce it. [Rating and price target withdrawn — see the note at the top.]
Report Versions
Every published version of this report, newest first — each one kept so a reader can see what changed and when.
| Version date | Files |
|---|---|
| 2026-08-20 Current | Model (Excel) |
| 2026-08-11 | Model (Excel) |