
PepsiCo, Inc.
Section 1 — Business Overview, Operations & Competitive Positioning
1.1 The Business
sources PepsiCo makes money by manufacturing branded convenient foods and beverages and moving them, at scale and at a modest premium to private label, through what is arguably the industry’s densest direct-store-delivery (DSD) system — with the larger and structurally higher-margin share of profit coming from salty snacks rather than from drinks. This is the single most important thing to understand about the company as an investment: despite the “Pepsi” name and its association with the cola wars, PepsiCo is first a snacks business and second a beverage business, and the snacks franchise is where its pricing power and returns are most durable.
The economic model has three layers. In convenient foods, PepsiCo owns and operates the manufacturing, warehousing and DSD route network end-to-end, capturing the full margin on brands such as Lay’s, Doritos, Cheetos, Ruffles, Fritos, Tostitos and Quaker. In beverages, the model is mixed: in North America and parts of EMEA the company runs its own bottling plants (high revenue, low margin, capital-intensive), while internationally it increasingly sells concentrate to authorized and independent bottlers under a franchise model (lower revenue, high margin, capital-light). That franchise-versus-company-owned distinction is why beverage revenue and beverage profitability do not move together, and it is now formalized in the segment structure discussed below. The company reaches consumers in more than two hundred countries and territories, sells through retail, foodservice and a growing e-commerce channel, and generated most-recent full-year net revenue of $93,925.0M. It employs a large, heavily unionized global workforce and is party to numerous collective bargaining agreements — a labor footprint that is a source of route-density advantage but also of cost and work-stoppage exposure. Originally incorporated in Delaware and later reincorporated in North Carolina, PepsiCo is listed on Nasdaq under the symbol PEP.
Key Information
| Item | Value |
|---|---|
| Ticker | PEP |
| Sector / Industry | Consumer Staples / Beverages |
| Report Date | 2026-08-05 |
| Most Recent FY Revenue | $93,925.0M |
| EBIT Margin (Most Recent FY) | 12.2% |
| Diluted Shares Outstanding | 1,373M |
| Current Price | $140.13 |
Source: Company SEC filings (10-K); see Appendix A.1.
1.2 Operating Segments
sources Effective the first quarter of FY2025, PepsiCo replaced its seven historical divisions with six new reportable segments as part of its “One PepsiCo” reorganization. Prior-period segment figures were recast onto the new basis, so any comparison to previously published divisional trend lines is no longer valid — a comparability break that matters for trend analysis and is examined further in Sections 2 and 3. The six segments are:
- PepsiCo Foods North America (PFNA) — the U.S. and Canadian convenient-food business (Lay’s, Doritos, Cheetos, Fritos, Ruffles, Tostitos, Quaker, Pearl Milling Company). This is the profit engine of the group. The one variable that drives it is snack volume in North America, which softened this year: management attributes the segment’s volume decline chiefly to weaker savory snacks. Sabra, the refrigerated dips business, became wholly owned during the year after PepsiCo bought out the Strauss Group’s remaining stake.
- PepsiCo Beverages North America (PBNA) — the U.S. and Canadian beverage business (Pepsi, Mountain Dew, Gatorade, Aquafina, Bubly, Propel), run through company-owned bottling. Its economics are dominated by pricing net of commodity and — this year — tariff cost inflation, and by non-carbonated volume, which declined. PBNA also houses the newly acquired poppi prebiotic soda and distributes third-party energy brands (Celsius, Alani Nu, Rockstar) in certain channels. The one swing factor for reported profit this year was the Rockstar-led intangible impairment, which sits inside this segment.
- International Beverages Franchise (IB Franchise) — the capital-light international concentrate-franchise business (7UP, Mirinda, Sting Energy, plus Pepsi and Gatorade abroad) together with the SodaStream sparkling-water hardware business. This segment was carved out of the old geographic divisions in the reorganization; its driver is franchise net pricing and emerging-market volume (Middle East, China, Pakistan).
- Europe, Middle East and Africa (EMEA) — a combined foods-and-beverages segment that also holds the international company-owned bottling operations. Convenient foods (Walkers, Chipsy, Sasko, Doritos, Lay’s) are the larger portion; the driver is net pricing and FX translation, partly offset by commodity cost (dairy, potatoes, cooking oil).
- Latin America Foods (LatAm Foods) — the Latin American snacks business (Sabritas, Gamesa, Doritos, Lay’s, Emperador). Its dominant variable is foreign-exchange translation, chiefly the Mexican peso, which more than offset local pricing this year.
- Asia Pacific Foods — the Asian snacks business (Kurkure, BaiCaoWei, Smith’s, Lay’s, Quaker), including noncontrolled affiliates. Its swing factor this year was a Be & Cheery brand impairment in China layered on top of otherwise positive volume in India, Thailand and Australia.
Read as a system, the portfolio is a snacks flywheel with a beverage attachment. The snacks franchises supply the group’s pricing power and route density; the DSD network built to serve high-velocity snacks is then leveraged across beverages and, increasingly, acquired brands (poppi, Siete). The synergies are real — shared routes, shared procurement and hedging, shared retail relationships — but so are the fragilities: North American volume has turned negative in both PFNA and PBNA simultaneously, and the reorganization’s decision to bundle the declining SodaStream hardware business with the higher-margin international franchise beverages inside IB Franchise can mask deterioration within a single reported line. The complementary foods-and-beverages structure diversifies demand, but it does not insulate the group from the common input-cost and health-regulation pressures that hit both halves at once.
1.3 Geographic Exposure
sources PepsiCo sells in more than two hundred countries and territories, but the revenue base is anchored in the United States, where the two North American segments (PFNA and PBNA) together represent the largest share of consolidated net revenue and, disproportionately, of profit. Internationally, the mix tilts toward convenient foods, with EMEA, LatAm Foods and Asia Pacific Foods weighted to snacks and IB Franchise carrying the capital-light international beverage franchise. Because the statements are reported in U.S. dollars while a substantial minority of revenue is earned in local currencies, translation is a recurring swing factor — this year unfavorable, driven mainly by weakness in the Mexican peso and Turkish lira and only partly offset by an appreciating Russian ruble.
Two geography-specific realities warrant flagging here, with the detail deferred to Section 2. First, Russia is a small share of revenue but a materially larger share of the group’s liquid cash, which is subject to local currency controls — meaning reported consolidated cash overstates freely deployable liquidity. Second, the Latin American and other emerging-market exposures carry the standard developing-market risks of high inflation, currency devaluation and controls. Both are geopolitical and liquidity-quality issues rather than demand issues, and both are treated as risks in Section 2.
1.4 Management Team
sources The FY2025 filing is unusual for the density of leadership change it discloses, which is itself a signal that this is a company in the middle of a self-declared reset. The anchor remains Ramon Laguarta as Chairman and CEO, providing continuity through the “One PepsiCo” reorganization and the pep+ transformation. Around him, however, the senior bench turned over materially: a new Chief Financial Officer, Stephen Schmitt, arrived from Walmart effective November 2025; a new CEO of PepsiCo North America, Ram Krishnan, was appointed in December 2025 — pointedly, the appointment of a dedicated North America leader coincides with management’s admission that North America is the problem to be fixed; and Athina Kanioura moved to CEO of LatAm Foods. §
The analytical read is twofold. On the positive side, installing an external, retail-native CFO and a focused North America operating leader is consistent with a genuine attempt to address the region where volume has turned negative, and the Walmart pedigree is relevant given the concentration of sales through large retailers. On the risk side, a simultaneous change of CFO and of the head of the largest, most troubled region concentrates execution risk at exactly the moment the company is integrating operating models, migrating financial systems to ERP, and finalizing several acquisitions — and the 10-K explicitly names CEO succession planning as a workforce risk. This is a capable but freshly reconstituted team being asked to execute a turnaround; the bench is deep, but the coordination burden in FY2026 is high.
1.5 Capital Allocation Track Record
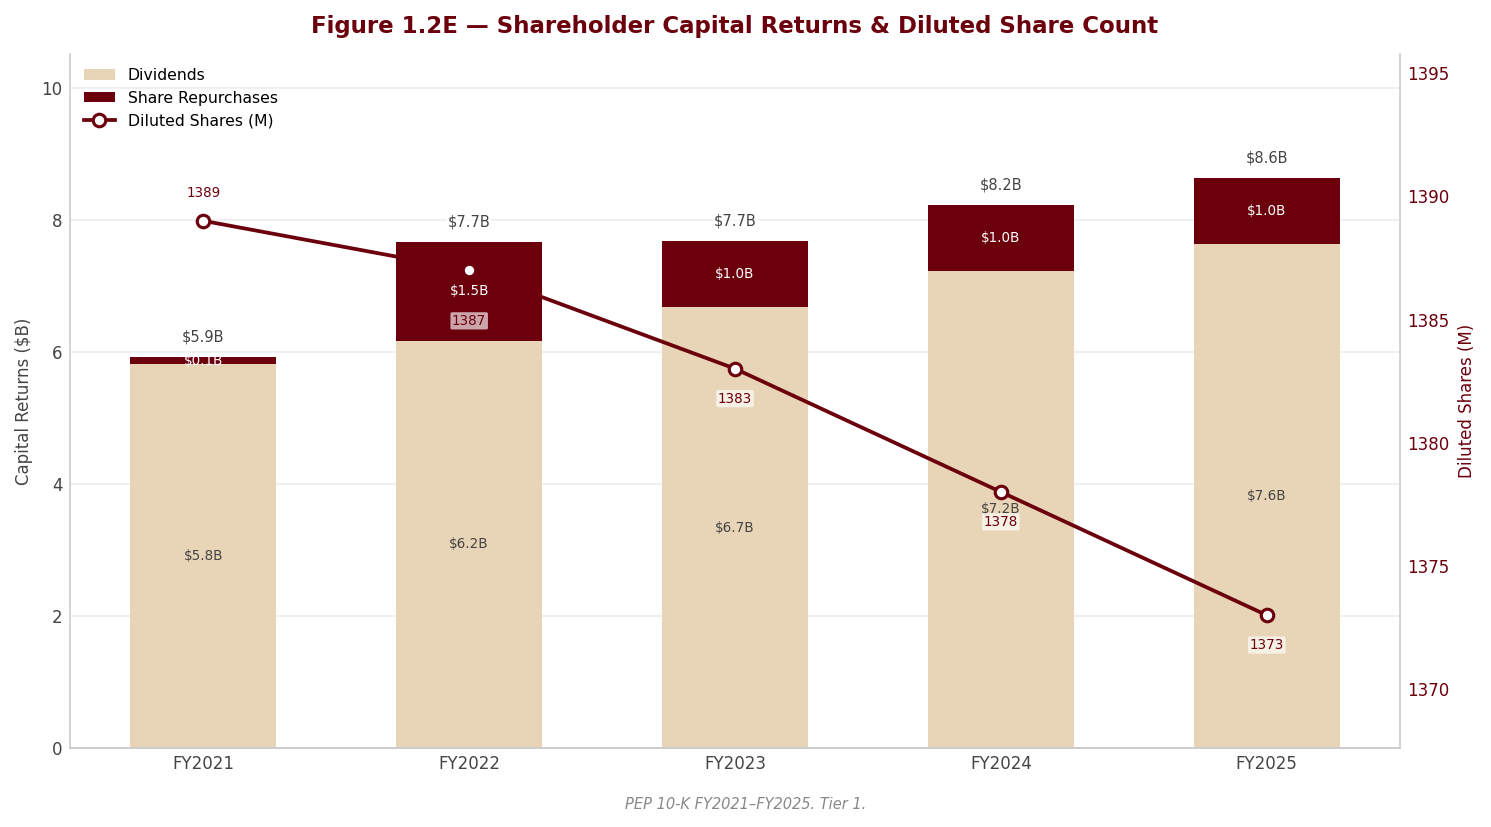
| Year | Dividends Paid ($M) | Share Repurchases ($M) | CapEx ($M) |
|---|---|---|---|
| FY2021 | $5,815.0M | $106.0M | $4,625.0M |
| FY2022 | $6,172.0M | $1,500.0M | $5,207.0M |
| FY2023 | $6,682.0M | $1,000.0M | $5,518.0M |
| FY2024 | $7,229.0M | $1,000.0M | $5,318.0M |
| FY2025 | $7,638.0M | $1,000.0M | $4,415.0M |
Source: Company SEC filings (10-K); see Appendix A.1.
PepsiCo’s capital-allocation identity is unambiguous and long-standing: it is a dividend company that also invests to maintain its physical and route infrastructure, with share repurchases a distant third priority. The company has paid consecutive quarterly dividends since 1965 and has grown the payout again this year, to $7,638.0M; buybacks, by contrast, have been held to a comparatively token $1,000.0M and are shrinking in relative importance rather than growing. That mix tells the reader that management’s confidence is expressed through a rising, defended dividend rather than through opportunistic share reduction — a posture appropriate to a mature staples business but one that leaves the dividend, not the buyback, as the flexible variable if cash generation weakens.
Capital expenditure of $4,415.0M is directed less at capacity expansion than at maintaining the manufacturing and DSD footprint and at the group’s technology agenda — the multi-year ERP migration and the AI/analytics and pep+ programs — where capitalized software has been rising. This is largely replacement-and-modernization spend rather than growth spend; PepsiCo is not building itself a bigger asset base so much as re-tooling the one it has. The critical judgment for a portfolio manager is that the combined dividend-plus-buyback return has, on management’s own framing, come to absorb essentially all of the company’s free cash flow while acquisitions (poppi, Siete) were funded alongside; the resulting funding and leverage picture — and the fact that returns exceeded free cash flow this year — is central to the investment case and is analyzed in full in Section 3. Here the point is narrower: the deployment pattern signals a company prioritizing an unbroken dividend record and infrastructure maintenance over both aggressive buybacks and step-change growth investment.
1.6 Competitive Positioning & Moat
sources Industry structure. Branded convenient foods and non-alcoholic beverages is a scale-and-shelf-space business. Returns accrue to the players who combine strong brands (which earn shelf placement and a price premium over private label), low-cost manufacturing, and a distribution system dense enough to keep high-velocity products in stock and merchandised. Because the underlying products are cheap, frequently purchased and impulse-driven, distribution reach and in-store presence matter as much as the product itself — which structurally favors the largest incumbents and disadvantages sub-scale entrants. The economics differ sharply between snacks, where a vertically integrated owner keeps the whole margin, and beverages, where company-owned bottling is capital-heavy and low-margin while concentrate franchising is capital-light and high-margin.
Competitive advantages. PepsiCo’s moat is strongest in convenient foods, where management states — and market structure corroborates — that its brands hold significant leadership positions in the U.S. and worldwide; the Frito-Lay portfolio has few genuine scaled competitors and commands premium shelf space. Supporting that brand strength are two hard-to-replicate assets: the DSD route network, which is expensive to build and particularly well-suited to the frequently restocked, promotion-sensitive snack products that are PepsiCo’s core, and procurement/hedging scale across agricultural commodities, energy and packaging that a regional competitor cannot match. The complementary foods-and-beverages portfolio adds retailer bargaining power — a single supplier spanning two large center-of-store and cold-vault categories is harder for a retailer to de-list. These are genuine, evidence-backed moats rather than asserted market-share claims.
Competitive vulnerabilities. The moat is materially narrower in beverages than in snacks: management concedes that The Coca-Cola Company holds a larger share of the U.S. liquid-refreshment-beverage category and a significant carbonated-soft-drink advantage in many international markets, so PepsiCo is the number-two beverage player in much of the world. Beyond the competitive gap, four erosion risks stand out. Customer concentration is real — the largest retail customer and its affiliates represent a significant share of consolidated net revenue, and management states that losing it would materially harm both North American segments; the growth of hard discounters and private label compounds this by pressuring shelf space and pricing. Input-cost and tariff sensitivity is acute, since PepsiCo cannot always pass rising commodity and tariff costs through without losing volume — and North American volume is already declining. Health and regulatory pressure — sugar, sodium and saturated-fat taxes, front-of-pack warning labels, “ultra-processed” scrutiny and GLP-1-driven demand shifts — strikes at the core categories. Finally, the acquired-brand track record is a self-inflicted vulnerability: the group’s history with acquired brands has produced repeated impairments, and the discipline of its M&A is a legitimate question for a moat that is otherwise built on organic brand strength.
Verdict. PepsiCo possesses a wide, durable moat in convenient foods and a narrower, second-place position in beverages; the blended franchise is defensible but not currently expanding. Long-run margin durability rests on the snacks pricing power and DSD scale, which we regard as intact, but it is being actively tested by declining North American volume, persistent input-cost and tariff inflation, and an intensifying health-and-regulatory overlay. Our judgment is that margins are more likely to be defended than expanded over the forecast horizon — a moat sufficient to protect the business, but not, on current evidence, wide enough to re-accelerate it.
Section 2 — Key Risks & Catalysts
2.1 Downside Risks
sources The risk that dominates PepsiCo today is not solvency or liquidity — the balance sheet and cash generation, examined in Section 3, remain investment-grade and well-backstopped — but a convergence of three softer, slower-acting threats: a demonstrated erosion in the value of acquired brands, a structural loss of volume in the core North American categories, and an intensifying health-and-regulatory overlay that strikes at the products the company sells most of. These are compounded by an earnings-presentation issue — a set of “one-time” costs that recur every year — that makes the reported turnaround harder to trust at face value. The risks below are ordered by our assessment of their weight to the equity, and the picture is deliberately risk-heavy: this is a company in the middle of a self-declared reset, and the reset has not yet shown up in the volume line.
Acquired-Brand Impairment and a Live Goodwill Trigger
sources This is the single most important risk in the filing, and it is a RED forensic flag on two counts. First, the company recorded a large write-down of indefinite-lived intangibles this year, overwhelmingly against the Rockstar energy brand — a brand PepsiCo acquired roughly five years ago for a multi-billion-dollar sum, wrote down by the great majority of its value, and then transferred to Celsius, in the same year, for a small fraction of what it paid. Management now distributes that same brand under a Celsius-owned trademark. This is not a paper adjustment; it is an acknowledged destruction of acquired-brand value, and it is the largest single driver of the gap between reported and “Core” earnings this year (analysed in Section 3). The repeat impairment of the Be & Cheery brand in China — written down once before and again this year — and the near-total impairment of the retained equity stake in TBG (the entity that bought PepsiCo’s divested Tropicana and Naked juice brands, which has since deteriorated, leaving PepsiCo carrying the downside of its own “divestiture”) reinforce a pattern: PepsiCo has repeatedly overpaid for, or under-managed, acquired and affiliated brands whose cash flows then disappointed.
[Rating and price target withdrawn — see the note at the top.] SodaStream — a declining, discretionary hard-goods business now housed inside the International Beverages Franchise segment — was already impaired once before. This is a self-disclosed, near-term impairment trigger, not a remote hypothetical. It matters disproportionately because PepsiCo’s goodwill and indefinite-lived intangibles together exceed the company’s entire book equity: a cluster of write-downs here would meaningfully reduce reported equity and earnings. The freshly acquired poppi and Siete brands, still carried at preliminary purchase-price allocations and, on management’s own policy language, “more susceptible to impairment,” extend the same exposure into the newly built part of the portfolio.
Probability: High (SodaStream trigger is live; broader acquired-brand risk is demonstrated) | Timeframe: Immediate to 1–2 years | Impact: Non-cash but material to reported equity and GAAP earnings; the specific charges and coverage sensitivities are quantified in Section 3.
Structural Volume Erosion in the Core North American Categories
sources PepsiCo’s profit engine is North American snacks, and for the first time in years both North American segments are losing volume simultaneously: savory-snack organic volume fell in the foods business and non-carbonated (and slightly carbonated) volume fell in the beverage business. This is the operational fact behind the entire “reset” narrative. It matters to the financials because PepsiCo’s model monetizes volume through a fixed-cost direct-store-delivery network — falling volume de-levers that network, and the company has increasingly leaned on price (“effective net pricing”) to hold revenue, a lever with a ceiling in a cost-of-living-pressured, trade-down environment. The threat is amplified by the retail structure: management concedes that its largest retail customer and its affiliates represent a concentrated share of consolidated revenue (loss of which would materially harm both North American segments), and that hard discounters and retailer private label are gaining shelf space and pricing leverage. Management’s stated response is credible but unproven: portfolio reformulation (reducing sugar, sodium and saturated fat and removing artificial colors and flavors in core brands such as Lay’s, Cheetos, Doritos and Gatorade), pack-price architecture across sizes and channels, and brand additions such as poppi and Siete. What would make this risk crystallize further is a continued negative organic-volume print in PFNA through 2026 despite the reformulation and pricing actions — evidence that the problem is category-level demand, not execution.
Probability: High (already materializing) | Timeframe: Ongoing | Impact: Direct operating-deleverage on the group’s highest-margin segments; volume trajectory is the key monitorable.
Health, Consumption-Shift and Product-Tax Regulation
sources The core categories — sweetened, salted, processed snacks and beverages — sit squarely in the path of the most active regulatory and consumption-shift narrative in consumer staples. Management explicitly names the rise of GLP-1 weight-loss medications as a demand risk, alongside intensifying scrutiny of “ultra-processed” foods (including proposals in the United States), the risk of exclusion from benefit programs such as SNAP, and public statements by government officials and third-party studies that can move consumer behavior regardless of scientific validity. On top of demand, the fiscal and labelling apparatus is tightening: jurisdictions imposing or raising taxes on sugar-, sodium- or saturated-fat-containing products (management cites an increased sweetened-beverage tax in Mexico as an example), front-of-pack warning-label regimes (a Texas warning-label law and color-coded “traffic-light” labelling in certain markets), and restrictions on marketing to children and on where products may be sold. Each of these can simultaneously raise cost (reformulation, compliance), depress consumption, and generate negative publicity. This is a slow-acting but broad-based structural headwind, not an event.
Probability: Medium-to-High | Timeframe: 1–5 years | Impact: Compression of volume and margin in the core categories; difficult to quantify precisely because it is diffuse and jurisdiction-by-jurisdiction.
Packaging Regulation and Plastic-Pollution Litigation
sources Two related packaging exposures are worth separating from the general health overlay. On the regulatory side, management describes a widening web of extended-producer-responsibility (EPR) laws across multiple U.S. states, plastic and packaging taxes, minimum-recycled-content mandates, tethered-cap and deposit-return requirements, and outright restrictions on single-use plastics and on packaging containing PFAS. On the litigation side — a forensic YELLOW watch item — the filing discloses a cluster of government-brought lawsuits asserting public-nuisance and deceptive-practices theories tied to plastic pollution: the New York Attorney General matter (dismissed at trial and now on appeal, with the plaintiff having briefed the appellate court in early 2026), a Baltimore matter (most claims dismissed, the public-nuisance claim stayed), and Los Angeles County and U.S. Virgin Islands matters. None specify damages, and no accrual is booked; management characterizes the exposure as immaterial, but that characterization is unverifiable precisely because no estimate exists. The analytical concern is that public-nuisance theory — the same legal architecture used against opioid and PFAS defendants — is being tested against a consumer-packaged-goods company in multiple venues at once. PepsiCo has prevailed on motions to dismiss so far, but an adverse appellate ruling could open an entirely new, un-reserved liability class.
Probability: Medium (regulation certain to broaden; litigation outcome uncertain) | Timeframe: 1–5 years | Impact: Rising packaging-compliance cost is near-certain and gradual; the litigation tail is low-probability but potentially step-change and currently un-reserved.
Russia: Trapped Cash and Geopolitical Concentration
sources A forensic YELLOW flag, and a worsening one. Russia is a small share of consolidated revenue but, per management’s own disclosure, a disproportionately large share of the group’s liquid cash — a share that roughly doubled year-over-year — and that cash is subject to local currency-transfer controls. The practical consequence is that reported consolidated cash overstates the cash PepsiCo can freely deploy (Section 3 nets this out). Layered on top is the geopolitical tail: management’s risk factors explicitly contemplate temporary or permanent loss of assets through nationalization or expropriation in conflict-affected jurisdictions, and a very large portion of the group’s accumulated translation loss is tied to Russia. Continued operation in Russia is also a standing reputational exposure. What would crystallize this risk is a forced exit, further sanctions, or a currency-control tightening that converts trapped cash into a write-off.
Probability: Medium | Timeframe: Ongoing, event-driven | Impact: A liquidity-quality haircut today; a potential impairment/expropriation loss in an adverse scenario. Figures in Section 3.
Earnings Quality: Recurring “One-Time” Costs and a Comparability Break
sources This is a RED forensic flag about how the results are presented rather than about the results themselves. PepsiCo’s “2019 Productivity Plan” — a restructuring program originally launched seven years ago, since extended to run through the end of the decade — has been charged in every year and, critically, added back to management’s Core (non-GAAP) earnings every year. A cost that recurs for more than a decade, roughly half of it cash severance, is in substance a permanent cost of doing business; treating it as non-recurring flatters the durability of Core EPS. It is not the only such item — recurring pension-settlement charges are excluded on the same basis (both are examined in Section 3). Compounding the transparency question, the “One PepsiCo” reorganization replaced seven historical divisions with six new reportable segments this year and recast prior periods, so every pre-2025 segment trend line must be rebuilt and direct comparison to previously published divisional results is impossible — a fully disclosed but genuinely complicating comparability break (a forensic YELLOW watch item). Finally, the group now carries a large, growing, hard-to-value stake in Celsius — an energy-drink company it both competes with and partners with, and to which it gave the Rockstar brand — marked using Level 3 (unobservable-input) assumptions whose swings run through equity rather than earnings. None of this is fraud; the auditor’s opinion is clean. But collectively it means the headline “Core EPS roughly flat” narrative should be treated with caution, and the true sustainable earnings power sits below the Core figure and above the reported GAAP figure.
Probability: Medium (a persistent presentation issue, not an event) | Timeframe: Ongoing | Impact: Overstates the durability of headline earnings; the GAAP-to-Core bridge and its recurring components are laid out in Section 3.
2.2 Upside Catalysts
sources The catalyst picture is honestly asymmetric: the risks above outnumber and, in aggregate, outweigh the catalysts below. PepsiCo’s upside is almost entirely self-help and operational — an execution story, not a set of binary events — and it is the mirror image of the volume risk. If management delivers the reset, the same operating leverage that is working against the company today works for it; if it does not, there is no external catalyst waiting to rescue the thesis. [Rating and price target withdrawn — see the note at the top.]
North America Turnaround Execution
sources [Rating and price target withdrawn — see the note at the top.] Management has installed a dedicated North America CEO and an external, retail-native CFO, is evaluating an integrated food-and-beverage operating model, and is funding the effort by reinvesting productivity savings into the brands. The mechanism to watch is volume: because the DSD network is a fixed-cost asset, an inflection from negative to flat-or-positive organic volume in PFNA savory snacks would restore operating leverage disproportionately to the revenue change. This is the cleanest signal in the entire investment case.
Probability: Medium | Timeframe: 1–2 years | Monitoring trigger: PFNA organic (unit) volume turning non-negative, sustained across consecutive quarters, alongside stabilizing private-label share.
Portfolio Reshaping Toward Functional and Energy
sources PepsiCo is actively re-weighting its portfolio toward faster-growing, better-perceived categories: poppi (prebiotic soda) and Siete (better-for-you Mexican-American foods) as owned brands, Pepsi Prebiotic Cola and reformulated core brands as organic additions, and — importantly — an energy-category exposure built through distribution of and a preferred-equity stake in Celsius (plus Alani Nu), which gives PepsiCo participation in energy-drink growth without owning the brands outright. The upward remeasurement of the poppi earn-out is, on its own terms, a signal that the business is tracking toward its performance milestones. If these additions scale into the DSD network, they can partially offset core-category maturity.
Probability: Medium | Timeframe: 1–3 years | Monitoring trigger: Growth in the functional/better-for-you portfolio and in distributed energy volume; poppi hitting its earn-out milestones.
Productivity Savings and the “One PepsiCo” Cost Reset
The same productivity program flagged as an earnings-quality concern is also a genuine cost-reduction engine. “One PepsiCo” — shared global services, simplified processes, an integrated North American model, and the ERP-enabled business transformation — is designed to lower structural cost, and the plan still has savings to deliver. The catalyst is margin: if the reset delivers cost savings faster than volume deleverage and input inflation erode them, operating margin can expand. The discipline for an analyst is to measure this on an underlying basis — stripping out the low-quality sale-leaseback gains and the Celsius mark discussed in Section 3 — so the improvement is real rather than presentational.
Probability: Medium | Timeframe: 1–3 years | Monitoring trigger: Underlying operating-margin expansion (ex sale-leaseback gains and non-operating marks) as productivity savings outrun cost inflation.
International Franchise Momentum
[Rating and price target withdrawn — see the note at the top.] Because the franchise model is high-margin and capital-light, incremental international growth is accretive to group returns even where it is modest in revenue terms.
Probability: Medium-to-Low | Timeframe: 1–3 years | Monitoring trigger: Sustained IB Franchise and international-foods volume and net-pricing growth, particularly in the Middle East and South/East Asia.
2.3 Risk & Catalyst Summary
| # | Item | Type | Probability | Timeframe | Status | Monitoring Trigger |
|---|---|---|---|---|---|---|
| 1 | Acquired-brand impairment & live SodaStream goodwill trigger (RED) | Risk | H | Immediate–2yr | Active | SodaStream coverage/WACC; further intangible write-downs |
| 2 | Structural volume erosion in core North American categories | Risk | H | Ongoing | Active | PFNA savory-snack organic volume; private-label share |
| 3 | Health, consumption-shift & product-tax regulation (GLP-1, ultra-processed, labels) | Risk | M/H | 1–5yr | Active | New product taxes / warning-label laws; SNAP eligibility |
| 4 | Packaging regulation (EPR/PFAS) & plastic-pollution litigation (YELLOW) | Risk | M | 1–5yr | Active/Monitoring | EPR enactments; appellate rulings on public-nuisance suits |
| 5 | Russia trapped cash & geopolitical concentration (YELLOW) | Risk | M | Ongoing | Active | Russia cash share; forced-exit / sanction developments |
| 6 | Earnings quality: recurring Core exclusions, comparability break, Celsius mark (RED) | Risk | M | Ongoing | Active/Monitoring | Annual restructuring add-back; Level-3 Celsius carrying value |
| 7 | North America turnaround execution | Catalyst | M | 1–2yr | Monitoring | PFNA organic volume inflection |
| 8 | Portfolio reshaping toward functional & energy (poppi, Celsius/Alani distribution) | Catalyst | M | 1–3yr | Monitoring | poppi earn-out milestones; distributed energy volume |
| 9 | Productivity savings & “One PepsiCo” cost reset | Catalyst | M | 1–3yr | Monitoring | Underlying operating-margin expansion ex one-offs |
| 10 | International franchise momentum | Catalyst | M/L | 1–3yr | Monitoring | IB Franchise / international-foods volume & pricing |
Source: Company SEC filings (10-K) and forensic footnote review; see Appendix A.1.
2.4 Risk Interdependencies
sources The risks above are not independent; their danger lies in how they feed one another. The central interdependency runs from volume to impairment. [Rating and price target withdrawn — see the note at the top.]
A second interdependency compounds the first through capital allocation. As Section 3 details, shareholder returns now absorb essentially all of free cash flow and have been part-funded by rising debt. That leaves little cushion: if volume deleverage and an impairment cluster arrive together, the company is simultaneously defending a rising dividend, servicing higher leverage, and absorbing non-cash charges — a combination that would pressure the very payout that anchors the equity’s appeal. Layered onto this is execution concentration: a new CFO and a new North America CEO are being asked to deliver the turnaround at the same time the company is migrating its financial systems to a new ERP platform — a change management itself discloses materially affected internal controls this year. A stumble in any one of these — the turnaround, the systems migration, or the balance sheet — makes the others harder. Finally, the earnings-presentation risk magnifies all of the above: because recurring costs are excluded from Core each year, an investor relying on the headline figure would be the last to see the underlying deterioration that the interdependencies above are quietly producing.
2.5 ESG & Regulatory Exposure
sources PepsiCo’s ESG and regulatory exposure is unusually central to its economics because the environmental and social pressures land directly on the products and packaging it sells, not merely on its operations.
Environmental — packaging and climate. The largest environmental exposure is packaging. Management discloses an expanding regime of extended-producer-responsibility laws, packaging and plastic taxes, minimum-recycled-content and tethered-cap requirements, deposit-return systems, and restrictions on single-use plastics and PFAS-containing packaging — a rising, largely non-discretionary compliance cost, layered on top of the plastic-pollution litigation cluster described in 2.1. Separately, management identifies water scarcity as a manufacturing and agricultural risk, and climate change as a threat to the availability and cost of key agricultural commodities (potatoes, corn, wheat, oats, sugar cane, oranges), alongside evolving sustainability-reporting standards and the countervailing risk of anti-ESG legislation and stakeholder backlash if sustainability and nutrition goals are missed.
Social — nutrition, labelling and access. The social dimension is the health-and-nutrition overlay covered above: sugar/sodium/saturated-fat taxes, front-of-pack warning and traffic-light labelling, restrictions on marketing to children and on sales in schools, “ultra-processed” scrutiny, and potential exclusion from benefit programs such as SNAP. This is the most financially material ESG axis for PepsiCo, because it can simultaneously raise cost and suppress demand in the core categories. The company’s reformulation agenda (reducing sugar, sodium and saturated fat and removing artificial colors and flavors) is both a mitigant and an admission of the exposure.
Governance. Governance risk is comparatively contained but not zero. There is no controlling shareholder and no evidence of insider value extraction; board members with vendor/customer overlaps are stated to recuse from relevant decisions, and the only substantive affiliate exposure (the TBG equity investee) is captured as a risk above. Cybersecurity is overseen directly by the full Board under a NIST-aligned program led by the Chief Information Security Officer, with third-party testing and mandatory training, and management states incidents to date have not been material. Two governance watch items warrant flagging. First, management disclosed that the ongoing ERP migration materially affected internal control over financial reporting during the year — management concluded controls remained effective and the auditor issued a clean opinion on internal control, but a material change to financial-reporting systems concurrent with a new CFO is a control-environment item to monitor, not to dismiss. Second, the auditor’s single critical audit matter is the evaluation of the company’s unrecognized tax benefits — corroborating the tax-durability concern (the reliance on low-tax jurisdictions and the coming OECD 15% global minimum tax) that is carried into Section 3, where the reserve figure is quantified.
Section 3 — Financial Analysis & Historical Performance
sources Three-Statement Linkage Confirmation: - Net Income ties (Income Statement → Cash Flow Statement): Confirmed. Reported net income of $8,240.0M is the opening line of the operating-cash-flow reconciliation; the statements articulate. - Cash ties (Balance Sheet → Cash Flow Statement): Confirmed. The balance-sheet cash position moved from $8,505.0M to $9,159.0M, consistent with the net change in cash reported on the cash-flow statement. - Retained Earnings reconciliation (Beg RE + NI - Dividends = End RE): Confirmed within an immaterial residual. Opening retained earnings of $72,266.0M plus net income of $8,240.0M less dividends of $7,638.0M reconciles to closing retained earnings of $72,788.0M, with the small residual attributable to the timing difference between dividends declared and dividends paid, and to other equity movements. No linkage break was identified.
3.1A Income Statement
Source: Company SEC filings (10-K); figures per the FL model — see Appendix A.1–A.2.
CAGR Summary
| Metric | 3Y CAGR | 5Y CAGR | 10Y CAGR |
|---|---|---|---|
| Revenue | 2.8% | 5.9% | — |
| EBITDA | 1.5% | 3.4% | — |
| Net Income | -2.6% | 3.0% | — |
| Diluted EPS | -2.2% | 3.2% | — |
| FCF | 11.0% | 3.8% | — |
The ten-year column is not computable from the primary-source set: the earliest Form 10-K available for this analysis presents FY2016 as its oldest fiscal year, so no FY2015 base exists that can be traced to a filing. [Rating and price target withdrawn — see the note at the top.] See Appendix A.1 for the full source inventory.
Source: Company SEC filings (10-K); figures per the FL model — see Appendix A.1–A.2.
3.1B Income Statement — Analysis
sources The revenue story is one of deceleration masked by pricing. PepsiCo has compounded revenue in every year of the window, but the slope is flattening unmistakably: from double-digit growth of 12.9% in FY2021, the top line stepped down to 5.9% in FY2023 and to a near-stall of 0.4% in FY2024 before printing a modest 2.3% in FY2025. [Rating and price target withdrawn — see the note at the top.] The composition is the more important point. As established in Sections 1 and 2, the incremental revenue this year was carried by effective net pricing, not by volume: organic volume turned negative in both North American segments simultaneously. This is the distinction that matters for durability — price-led growth in a cost-of-living-pressured, trade-down environment has a ceiling and can reverse, whereas the volume that would compound is precisely what is missing. The top line is being defended, not grown.
FY2025 is a down year on a GAAP basis, and the reason sits above the operating-profit line. This is the single most important thing to understand about the FY2025 income statement, because a casual read of the margins will lead to the wrong conclusion. Reported EBIT fell from $12,887.0M to $11,498.0M, net income fell from $9,578.0M to $8,240.0M (-14.0%), and reported diluted EPS fell to $6.00 (-13.7%). EBIT margin compressed from 14.0% to 12.2%. The instinct is to attribute that operating-margin fall to operating deterioration — but the gross margin barely moved, from 54.6% to 54.1%. If the problem were cost-of-sales inflation or price/volume mix at the product level, it would show up in gross margin; it does not. The margin fall is almost entirely below gross profit, in a large intangible-impairment charge — overwhelmingly the Rockstar energy brand — that sits above the operating-profit subtotal and is therefore inside reported EBIT and inside every reported operating margin. Read the FY2025 margin decline as a discrete write-down, not as an erosion of underlying operating performance. Stripped of that charge, the underlying operating picture is roughly stable-to-modestly-positive — which is exactly the gap management points to when it reports Core operating profit as up while GAAP operating profit fell.
Major movers. (1) The intangible impairment (RED forensic flag). The dominant swing item is the Rockstar-led write-down of indefinite-lived intangibles, spread across the PBNA, EMEA and IB Franchise segments. This is the largest single driver of the EBIT decline from $12,887.0M to $11,498.0M and of the EBIT-margin fall to 12.2%. The charge itself is non-recurring, but what it signals is not: a brand acquired roughly five years ago was written down by the great majority of its value and then handed to Celsius in the same year for a fraction of the purchase price — an acknowledged destruction of acquired-brand value that, together with the repeat impairment of Be & Cheery and the near-total write-down of the retained TBG stake, marks a structural pattern of acquired-brand risk rather than a one-off event. (2) Gross-margin resilience versus operating deterioration. Cost of sales grew slightly faster than revenue, nudging gross margin down to 54.1% from 54.6%, but the movement is small and cyclical (commodity, tariff and FX cost) rather than structural — the operating line, not the gross line, is where the year was lost. [Rating and price target withdrawn — see the note at the top.] The auditor’s sole critical audit matter is the evaluation of PepsiCo’s unrecognized tax benefits, corroborating exactly where the tax structure is most judgmental. (4) Below-the-line pension volatility and sale-leaseback gains. Two smaller movers cut in opposite directions on earnings quality: recurring pension-settlement charges and a sharply higher below-operating-profit “other pension” expense reduced net income (a genuine annual feature de-risking the plans, yet excluded from Core), while a rising stream of sale-leaseback gains — up sharply over two years — sits inside reported and Core operating profit and flatters it. Both are watch items for anyone trying to read underlying operating performance.
Quality of earnings — the heart of the section (RED forensic flags). Management frames FY2025 as a “Core EPS roughly flat” year, and the figures bear that out on its own measure: Core diluted EPS of $8.14 against $8.16 the year before — essentially unchanged — versus reported diluted EPS that fell from $6.95 to $6.00. Two things follow. The first is the sheer size of the wedge: the Core figure stands well above the GAAP one, and that gap is the single most important number to interrogate in this filing. The second is easily missed and matters more — even on the basis management prefers, and after every add-back it chooses to make, earnings did not grow this year. The Core measure rescues the level of earnings from the impairment; it does not produce growth. The bridge from GAAP to Core is built from add-backs for the intangible impairment, restructuring, acquisition and divestiture charges, and pension items. Two of those categories are not, in substance, one-time. First, the “2019 Productivity Plan” restructuring has been charged in every year since 2019, was extended to run through 2030, and is added back to Core every single year. A charge that has recurred for seven consecutive years and is scheduled to recur for eleven — roughly half of it cash severance — is a permanent cost of doing business, not a non-recurring item; treating it as excludable overstates the durability of Core EPS. Second, pension-settlement charges have appeared in each of the last three years on the same de-risking program and are excluded on the same basis. The honest read is that true sustainable earnings power sits below the $8.14 Core figure and above the $6.00 GAAP figure. This is a presentation problem, not fraud — the auditor’s opinion is clean — but an investor anchoring to Core will overstate both the level and the durability of earnings. Layered on top, the acquisition-related add-backs (including the upward mark on the poppi earn-out) and the growing sale-leaseback gains left inside operating profit both widen the wedge in management’s favor.
⚠ Items to Watch. If gross margin were to fall materially below the 54.1% printed this year, the FY2025 diagnosis would change — it would signal that input-cost and pricing pressure had migrated from a discrete impairment story into genuine product-level operating erosion, and the “reset” thesis would require re-underwriting. [Rating and price target withdrawn — see the note at the top.] Finally, a second consecutive year in which “one-time” restructuring is again excluded from Core would confirm the recurring-exclusion problem rather than resolve it.
3.2A Balance Sheet
Source: Company SEC filings (10-K); figures per the FL model — see Appendix A.1–A.2.
3.2B Balance Sheet — Analysis
sources Asset composition: an acquisition-built, intangible-heavy balance sheet. PepsiCo carries a physically substantial asset base — the PP&E of its manufacturing and direct-store-delivery network — but the balance sheet is dominated by acquired intangible assets. Goodwill alone reached $18,916.0M at year-end, with a substantial further balance of amortisable and indefinite-lived intangibles carried separately on the face of the balance sheet. This is the defining structural feature and the reason the FY2025 impairment matters beyond the income statement: goodwill and indefinite-lived intangibles together exceed the company’s entire book equity of $20,406.0M. In plain terms, more than the whole of shareholders’ equity is represented by acquired brand and franchise value whose carrying amount rests on management’s cash-flow forecasts. With one reporting unit (SodaStream) explicitly disclosed as sitting at “low coverage” — its fair value only narrowly above carrying value — a further write-down cluster would fall directly through reported equity and earnings (a RED forensic flag carried in full in Section 2). Cash rose to $9,159.0M, but as noted below and in Section 2 a disproportionate and rising share of that cash is trapped in Russia under currency controls, so reported consolidated cash overstates freely deployable liquidity.
Leverage is rising, and FY2025 marks the inflection. For most of the window PepsiCo deleveraged gently: net debt/EBITDA drifted down from 2.5x toward 2.2x by FY2024. FY2025 reversed that, with the ratio jumping to 2.7x — the highest in the five-year window and a deterioration driven from both directions at once: total debt rose from $44,306.0M to $49,182.0M (long-term debt alone from $37,224.0M to $42,321.0M), while EBITDA fell. Debt-to-equity was steadier at 2.4x, flattered by the year’s equity increase to $20,406.0M. This trajectory is consistent with management’s stated priority of an unbroken, rising dividend rather than deleveraging — but, as the cash-flow analysis makes explicit, it means the capital-return program is now part-funded by incremental borrowing. There are no covenant-headroom concerns flagged: the forensic review confirms PepsiCo retains investment-grade access, undrawn committed revolving facilities backstopping its commercial paper, and a laddered maturity profile. The concern is direction, not level — leverage is rising into a year of falling operating cash flow.
Working capital is loosening in the wrong direction (YELLOW forensic flag). The cash-conversion cycle is lengthening on both the receivables and inventory legs. Receivables grew from $10,333.0M to $11,506.0M and inventory from $5,306.0M to $5,845.0M — increases that clearly outpaced net revenue growth of only 2.3% and the slower growth in cost of sales. Receivables and inventory outpacing sales is a classic earnings-quality caution: it can reflect channel loading, slower collections, or slower-moving stock, and it consumes cash relative to reported profit. Part of the build reflects the poppi and Siete acquisitions and FX, which softens the signal from red flag to watch item — but the direction is unhelpful given organic volume is declining, not growing. The current ratio of 0.9x sits below 1.0x, which is normal for a DSD staples business that runs on negative working capital and stretched trade payables; but that payables cushion is itself increasingly supported by a growing reverse-factoring program (discussed in 3.3B), which flatters days-payable relative to the company’s true trade terms.
⚠ Items to Watch. If net debt/EBITDA rises beyond the 2.7x reached this year, PepsiCo would be moving further above its recent operating range at exactly the point operating cash flow is softening — a combination that would begin to constrain the dividend capacity that anchors the equity. Equally, any further impairment of the “low coverage” SodaStream unit or the freshly acquired brands would reduce the $20,406.0M equity base directly; because goodwill and intangibles already exceed book equity, the balance sheet has limited absorptive cushion for a write-down cluster.
3.3A Cash Flow Statement
| FY2021 | FY2022 | FY2023 | FY2024 | FY2025 | |
|---|---|---|---|---|---|
| Cash from Operations ($M) | $11,616.0M | $10,811.0M | $13,442.0M | $12,507.0M | $12,087.0M |
| — Depreciation & Amortization ($M) | $2,710.0M | $2,763.0M | $2,948.0M | $3,160.0M | $3,451.0M |
| Capital Expenditures ($M) | $4,625.0M | $5,207.0M | $5,518.0M | $5,318.0M | $4,415.0M |
| Free Cash Flow ($M) | $6,991.0M | $5,604.0M | $7,924.0M | $7,189.0M | $7,672.0M |
| FCF Margin | 8.8% | 6.5% | 8.7% | 7.8% | 8.2% |
| FCF / Share | $5.03 | $4.04 | $5.73 | $5.22 | $5.59 |
| FCF Conversion (FCF/NI) | 91.8% | 62.9% | 87.3% | 75.1% | 93.1% |
| CapEx / Revenue | 5.8% | 6.0% | 6.0% | 5.8% | 4.7% |
| CapEx / D&A | 1.7x | 1.9x | 1.9x | 1.7x | 1.3x |
| Dividends Paid ($M) | $5,815.0M | $6,172.0M | $6,682.0M | $7,229.0M | $7,638.0M |
| Share Repurchases ($M) | $106.0M | $1,500.0M | $1,000.0M | $1,000.0M | $1,000.0M |
Source: Company SEC filings (10-K); figures per the FL model — see Appendix A.1–A.2.
3.3B Cash Flow — Analysis
sources Operating cash flow fell, and its quality is flattered on two fronts (YELLOW forensic flags). Operating cash flow declined from $12,507.0M to $12,087.0M — a modest fall, but a fall nonetheless, and it undercuts the “Core roughly flat” narrative. Two disclosed features make even that reported figure look better than the underlying cash generation. First, a voluntary supplier-finance (reverse-factoring) program lets suppliers sell their PepsiCo receivables to banks; the confirmed obligation is growing and remains classified inside accounts payable rather than as debt, which extends days-payable and holds cash longer than PepsiCo’s underlying trade terms would otherwise allow — flattering both reported operating cash flow and DPO. A withdrawal of bank appetite in a stress scenario would force faster supplier payment and compress operating cash flow. Second, the working-capital build in receivables and inventory (3.2B) was a genuine drag on the operating line this year. Neither is a red flag on its own, but together they mean the $12,087.0M of reported operating cash flow overstates the cash the business organically threw off.
Free cash flow rose only because capital expenditure was cut. Reported free cash flow edged up to $7,672.0M from $7,189.0M, and FCF conversion optically improved to 93.1% from 75.1%. Neither improvement reflects better cash generation. Operating cash flow fell; the conversion ratio rose partly because its denominator (net income) fell on the impairment, and free cash flow rose only because capital expenditure was cut sharply, from $5,318.0M to $4,415.0M. Capital intensity dropped correspondingly: capex/revenue fell to 4.7% from 5.8%, and capex/D&A fell to 1.3x from 1.7x. [Rating and price target withdrawn — see the note at the top.]
Capital allocation — the single most important fact in this section (YELLOW forensic flag). In FY2025, dividends of $7,638.0M plus share repurchases of $1,000.0M together exceeded free cash flow of $7,672.0M. The dividend alone absorbed essentially all of free cash flow; the buyback pushed total returns above it. On top of that, PepsiCo funded net acquisition spend on poppi and Siete. The gap was bridged by borrowing: total debt rose from $44,306.0M to $49,182.0M. Over the five-year window the allocation mix has been overwhelmingly dividend-led — the payout rose in every year, from $5,815.0M to $7,638.0M, while buybacks were held to a token $1,000.0M and are shrinking in relative importance. This is a dividend company, and the dividend has been paid without interruption for decades and raised for decades — a record management will defend. The measured conclusion is this: a payout funded partly by debt is a categorically different proposition from one funded by internal cash generation. PepsiCo is investment grade with ample access to capital, and one year of returns modestly exceeding free cash flow is not a solvency question. But it is a durability question — the dividend now consumes the whole of free cash flow, the cushion has thinned, and if operating cash flow (already down this year) weakens further, the flexible variable is the dividend itself.
⚠ Items to Watch. If capital expenditure is cut again below the $4,415.0M floor set this year, “free-cash-flow growth” would be a signal of underinvestment rather than strength, and the network deleveraging risk flagged in Section 2 would intensify. If dividends plus buybacks exceed free cash flow of $7,672.0M for a second consecutive year while debt continues to climb, the payout would be structurally, not incidentally, debt-supported — the point at which dividend-growth durability warrants formal re-underwriting.
3.4 Returns Analysis
| FY2021 | FY2022 | FY2023 | FY2024 | FY2025 | |
|---|---|---|---|---|---|
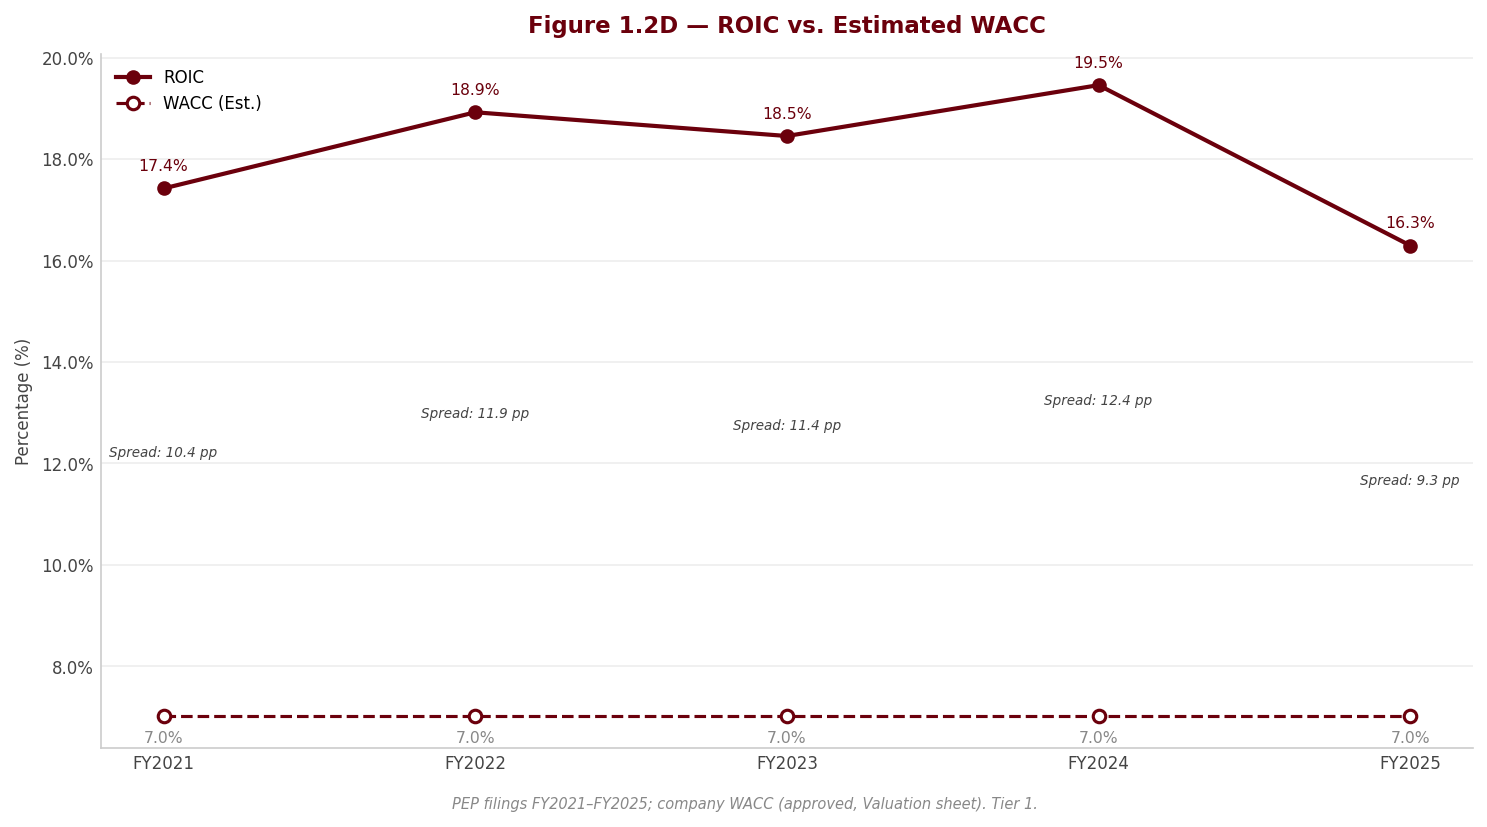
| ROIC | 17.4% | 18.9% | 18.5% | 19.5% | 16.3% |
| ROE | 51.7% | 53.7% | 50.9% | 52.4% | 42.9% |
| ROA | 8.2% | 9.7% | 9.4% | 9.6% | 8.0% |
| Interest Coverage | 6.0x | 12.3x | 14.6x | 14.0x | 10.3x |
Source: Company SEC filings (10-K); figures per the FL model — see Appendix A.1–A.2.
ROIC remains high in absolute terms but fell materially this year, and both causes are informative. Return on invested capital slipped from 19.5% to 16.3% — a meaningful step down, driven by the same two forces that shaped the whole year: the impairment depressed the numerator (NOPAT), and the debt-funded increase in invested capital enlarged the denominator. Even after the fall, 16.3% remains far above any plausible cost of capital — the WACC sits well below it, so PepsiCo continues to earn a wide positive spread on invested capital and remains, on this most important long-run metric, a genuine value creator. The message is one of a high-return franchise giving back some ground in a difficult year, not of a business whose returns have structurally broken. Interest coverage tells the same story: it fell to 10.3x from 14.0x as EBIT declined and debt rose, but it remains comfortably in investment-grade territory.
DuPont decomposition — the swing factor is margin, the level driver is leverage. ROE fell from 52.4% to 42.9%. Decomposing the FY2025 figure into its three levers — net margin of 8.8%, asset turnover of 0.91x (revenue over average total assets, the basis the DuPont identity requires; Section 5 quotes 0.87x on period-end assets for peer comparability), and an equity multiplier of 5.38x — shows what is really happening. Asset turnover is unremarkable for a capital- and intangible-heavy staples business, and it was broadly stable. What drove the level of ROE to its still-elevated print is the equity multiplier of 5.38x: PepsiCo’s headline ROE is structurally inflated by a relatively thin equity base and substantial financial leverage. And what swung ROE down this year was the net-margin leg, compressed by the impairment. This is the analytically important nuance: an ROE at this level looks exceptional, but it is a leverage-amplified number, not evidence of superior asset productivity — and the swing factor that took it lower was the same discrete write-down that shaped the entire income statement. As leverage rises further, the equity multiplier will keep the reported ROE optically high even if underlying returns soften — a reason to weight ROIC over ROE when judging this business.
3.5 Altman Z-Score (Most Recent FY)
| Component | FY2023 | FY2024 | FY2025 |
|---|---|---|---|
| X1 (Working Capital / Total Assets) | -0.047 | -0.057 | -0.045 |
| X2 (Retained Earnings / Total Assets) | 0.697 | 0.727 | 0.678 |
| X3 (EBIT / Total Assets) | 0.119 | 0.130 | 0.107 |
| X4 (Equity / Total Liabilities) | 0.226 | 0.222 | 0.235 |
| X5 (Revenue / Total Assets) | 0.910 | 0.923 | 0.875 |
| Z-Score | 1.93 | 1.99 | 1.85 |
| Zone | Gray | Gray | Gray |
Source: Company SEC filings (10-K); figures per the FL model — see Appendix A.1–A.2.
The Z-Score sits in the gray zone, but the model understates a company of this credit quality — read it as a nuance, not an alarm. PepsiCo’s Z-Score eased to 1.85 in FY2025 from 1.99, keeping it inside the “gray” band for all three years shown. Two structural features of the business pull the score down mechanically rather than for reasons of genuine distress. The working-capital ratio (X1) is negative — PepsiCo, like most DSD staples, deliberately runs on negative net working capital, stretching trade payables against fast-turning inventory, which the Altman model penalizes even though it is a sign of supplier bargaining power, not weakness. And the EBIT-to-assets ratio (X3) fell this year on the impairment, mechanically nudging the score lower for a one-off reason already dissected above. [Rating and price target withdrawn — see the note at the top.] The honest takeaway is neither to dismiss the slight downtrend nor to over-read it: the direction is consistent with the year’s rising leverage and impairment, and both are worth monitoring, but the credit risk implied for PepsiCo specifically is low.
4. Valuation withdrawn
This section stated what the shares were worth and what to do about them. It rested on an exit multiple set by hand — across the coverage it averaged 24% below where each company actually traded — so the conclusion largely restated that assumption instead of testing it. Rather than leave it standing, it has been withdrawn while the method is rebuilt.
Nothing else in this report depends on it: the financial analysis above and below is drawn from the company's own filings, and every figure links to the page it was verified against.
Section 5 — Financial Metrics & Peer Benchmarking
5.1 Peer Selection
sources PepsiCo has no single clean comparable. It is two businesses under one roof — a global beverage franchise and the world’s largest convenient-foods and snacking operation — and no listed peer spans both halves. The peer set is therefore built deliberately to bracket each half with two names, so that no single caveat can distort the read: The Coca-Cola Company and Keurig Dr Pepper bracket the beverage side, and Mondelez International and General Mills bracket the convenient-foods and snacking side. Every hard figure in the tables below is taken directly from each peer’s own SEC Form 10-K — the Coca-Cola and Mondelez filings held in the research folder, the Keurig Dr Pepper and General Mills FY2025 10-Ks retrieved from SEC EDGAR — page- and exhibit-cited, not sourced from a data aggregator. The only market-sourced inputs anywhere in this section are the peer share prices used to compute the valuation multiples in 5.5, and those are flagged as such.
The addition of Keurig Dr Pepper is the single most important upgrade to this peer set, because it supplies the like-for-like margin comparator the beverage half previously lacked. Coca-Cola sells concentrate, not finished beverages: it has refranchised the great majority of its bottling, so its margins are structurally inflated and its revenue base structurally shrunk relative to an integrated operator — which is exactly why a naive PepsiCo-versus-Coca-Cola margin comparison is misleading, and why the previous two-peer version of this section had to spend a long passage warning the reader off it. Keurig Dr Pepper closes that gap. KDP is an integrated beverage company — it owns its manufacturing, bottling and distribution, precisely as PepsiCo Beverages North America does — and its FY2025 gross margin comes out almost identical to PepsiCo’s. That single fact lets this section make a stronger, cleaner claim than before: PepsiCo’s margins are in line with the genuinely comparable integrated operator, and the entire gap to Coca-Cola is a business-model artefact, not something the reader has to take on trust. On the foods side, Mondelez remains the closest structural read-across for PepsiCo’s snacking and confectionery business, and General Mills adds a second, broader packaged-foods read that reduces reliance on Mondelez’s one distorted fiscal year.
The set is unusually clean on the dimensions that most often corrupt a peer table: all four peers report under US GAAP, in US dollars, so there is no accounting-standard mismatch and no currency-translation artefact to unwind. The material comparability problems here are therefore not accounting problems — they are business-model, one-off and period problems, and they are significant. Five are disclosed in full in 5.7: Coca-Cola’s concentrate model; Mondelez’s cocoa-cost-depressed FY2025; Coca-Cola’s one-off free-cash-flow distortion; Keurig Dr Pepper’s valuation multiples (distorted by its 2026 JDE Peet’s coffee acquisition and pending split) and its merger-inflated invested capital; and General Mills’ May fiscal year-end, which lags PepsiCo’s December year by roughly six months. A reader who compares the raw lines naively will reach the wrong conclusion on every one of them.
| Peer | Ticker | Exchange | Filing Type | Accounting Standard | Fiscal Year End | Comparability Note |
|---|---|---|---|---|---|---|
| The Coca-Cola Company | KO | NYSE | 10-K | US GAAP | December | Beverage read-across (concentrate model); margins inflated and revenue base shrunk — not margin-comparable (5.7, C001). |
| Mondelez International, Inc. | MDLZ | Nasdaq | 10-K | US GAAP | December | Snacking/foods read-across; FY2025 margins, returns and multiples cocoa-cost-depressed — FY2024 is the normalised read (5.7, C002). |
| Keurig Dr Pepper Inc. | KDP | Nasdaq | 10-K | US GAAP | December | Beverage read-across (integrated model) — the clean, like-for-like margin comparator for PBNA; only its multiples and ROIC carry caveats (5.7, C007–C008). |
| General Mills, Inc. | GIS | NYSE | 10-K | US GAAP | May | Packaged-foods read-across for PFNA; May year-end lags PEP ~6 months, and FY2025 (not the FY2026 impairment/loss year) is used (5.7, C009). |
Source: Peer-company SEC filings; comparability notes in 5.7 — see Appendix A.1.
5.2 Profitability Comparison
sources Comparative: Most Recent Full Fiscal Year
| Metric | PepsiCo, Inc. | The Coca-Cola Company | Mondelez International, Inc. | Keurig Dr Pepper Inc. | General Mills, Inc. |
|---|---|---|---|---|---|
| Revenue ($M) | $93,925.0M | $47,941.0M | $38,537.0M | $16,603.0M | $19,486.6M¶ |
| Gross Margin | 54.1% | 61.6%† | 28.4%‡ | 54.2% | 34.5%ᶜ¶ |
| EBITDA Margin | 15.9% | 30.9%† | 12.7%ᶜ‡ | 25.1% | 19.7%ᶜ¶ |
| EBIT Margin | 12.2% | 28.7%† | 9.2%‡ | 21.5% | 17.0%¶ |
| Net Margin | 8.8% | 27.3%† | 6.4%‡ | 12.5% | 11.8%¶ |
| FCF Margin | 8.2% | 11.1%§ | 8.4%ᶜ | 9.1% | 11.8%ᶜ¶ |
Source: Peer-company SEC filings; comparability notes in 5.7 — see Appendix A.1.
Flag legend: ᶜ = computed from filing components; ᵐ = market-sourced. Comparability markers: † = Coca-Cola concentrate-model distortion (5.7, C001/C006); ‡ = Mondelez FY2025 cocoa-cost distortion (5.7, C002); § = Coca-Cola FY2025 free cash flow depressed by the fairlife contingent-consideration payment (5.7, C003); ◊ = Keurig Dr Pepper valuation/ROIC distortion — 2026 JDE Peet’s acquisition & pending split (multiples), 2018-merger goodwill (ROIC) (5.7, C008); ¶ = General Mills May fiscal year-end, ~6-month period lag, and current multiples reflect post-FY2026 impairment pessimism against FY2025 earnings (5.7, C009).
Start with the comparison that now anchors the whole section: PepsiCo and Keurig Dr Pepper earn essentially the same gross margin, and that retires the old caveat rather than merely restating it. PepsiCo’s gross margin of 54.1% sits within a fraction of a point of KDP’s 54.2%. This matters because KDP is the true structural twin of PepsiCo’s beverage business — an integrated operator that owns its manufacturing, bottling and direct-distribution assets, not a concentrate seller. When the genuinely comparable integrated beverage company earns essentially the same gross margin PepsiCo earns, PepsiCo’s margin can no longer be characterised as structurally deficient. The previous version of this section could only assert that Coca-Cola’s margins were not comparable and leave the reader without a valid comparator; KDP supplies that comparator, and the verdict it delivers is that PepsiCo’s product-level economics are exactly where an integrated beverage peer’s are. Read against KDP, PepsiCo’s margin is in line, full stop.
Coca-Cola’s margins screen far higher across every line, and that gap is now demonstrably a model artefact, not a performance gap. Coca-Cola’s gross margin of 61.6%, EBITDA margin of 30.9%, EBIT margin of 28.7% and net margin of 27.3% tower over PepsiCo’s — and over KDP’s. But the two integrated operators (PepsiCo and KDP) cluster together, and the one concentrate seller (Coca-Cola) stands apart; that pattern is the proof. Coca-Cola sells concentrate rather than finished beverages, so the low-margin, capital-intensive activities of manufacturing, bottling and direct-store delivery sit outside its reporting entity, which mechanically inflates every margin and shrinks its revenue base — its $47,941.0M of FY2025 revenue is barely half PepsiCo’s $93,925.0M for broadly comparable global consumption. PepsiCo’s lower margins are the cost of owning the trucks and the plants, and the KDP comparison confirms it. Every Coca-Cola margin line carries the † marker and should be read as structurally non-comparable to an integrated peer.
On the foods side the comparison is legitimate but must be dated carefully, because Mondelez’s FY2025 is a cocoa-cost trough and General Mills sits half a year out of phase. Mondelez is the closest structural read-across for PepsiCo’s snacking and confectionery half, but record cocoa and commodity costs roughly halved its FY2025 operating margin and collapsed its gross margin to 28.4%; every Mondelez profitability line therefore carries the ‡ marker and should be read as a one-off trough, not a through-cycle level — on a normalised FY2024 basis its gross margin sat far higher and closer to PepsiCo’s foods economics. General Mills adds a second packaged-foods read at a 34.5% gross margin, lower than PepsiCo’s on a different product mix, but its fiscal year ends in May: its FY2025 figures lead PepsiCo’s December year by roughly six months and carry the ¶ marker throughout. The two foods peers are most useful in combination — Mondelez for structural snacking economics (read on FY2024), General Mills for a broader, less distorted current read (adjusted for the period lag).
PepsiCo’s own five-year progression is the cleaner anchor, and it is consistent with Section 3. Gross margin has been strikingly stable across the window — product-level economics are intact — while the erosion sits below the gross line: EBITDA margin and EBIT margin both stepped down to their five-year lows in FY2025, and net margin fell with them. As Section 3 established, that FY2025 operating-margin fall is overwhelmingly a discrete intangible-impairment charge sitting above the operating-profit subtotal, not product-level cost inflation — which is precisely why gross margin barely moved while EBIT margin dropped. FCF margin held roughly steady, but Section 3 showed that stability was engineered by a sharp capital-expenditure cut rather than by stronger cash generation. The honest read is a high-quality margin structure that gave back ground in FY2025 for a specific, largely non-operating reason.
Historical: PepsiCo, Inc. Own 5-Year Progression
| Metric | FY2021 | FY2022 | FY2023 | FY2024 | FY2025 |
|---|---|---|---|---|---|
| Gross Margin | 53.3% | 53.0% | 54.2% | 54.6% | 54.1% |
| EBITDA Margin | 17.5% | 16.5% | 16.3% | 17.5% | 15.9% |
| EBIT Margin | 14.0% | 13.3% | 13.1% | 14.0% | 12.2% |
| Net Margin | 9.6% | 10.3% | 9.9% | 10.4% | 8.8% |
| FCF Margin | 8.8% | 6.5% | 8.7% | 7.8% | 8.2% |
Source: Peer-company SEC filings; comparability notes in 5.7 — see Appendix A.1.
5.3 Returns Comparison
sources Comparative: Most Recent Full Fiscal Year
| Metric | PepsiCo, Inc. | The Coca-Cola Company | Mondelez International, Inc. | Keurig Dr Pepper Inc. | General Mills, Inc. |
|---|---|---|---|---|---|
| ROIC | 16.3% | 17.9%ᶜ | 6.0%ᶜ‡ | 6.9%ᶜ◊ | 11.6%ᶜ¶ |
| ROE | 42.9% | 46.0%ᶜ | 9.3%ᶜ‡ | 8.4%ᶜ | 24.7%ᶜ¶ |
| ROA | 8.0% | 12.8%ᶜ | 3.5%ᶜ‡ | 3.8%ᶜ | 7.1%ᶜ¶ |
| Asset Turnover (period-end assets) | 0.87x | 0.47xᶜ | 0.55xᶜ | 0.30xᶜ | 0.60xᶜ¶ |
Source: Peer-company SEC filings; comparability notes in 5.7 — see Appendix A.1.
On the return that matters most — ROIC — PepsiCo ranks second only to Coca-Cola, and the peers that screen below it do so for reasons that have nothing to do with operating quality. PepsiCo’s FY2025 ROIC of 16.3% sits a little below Coca-Cola’s 17.9%, and that small gap flatters Coca-Cola less than it appears: Coca-Cola’s operating income excludes roughly two billion dollars of equity income earned from its bottler stakes, which depresses its computed ROIC numerator, so the true gap on invested-capital returns is narrower still. The two peers that screen well below PepsiCo are both explained away by their denominators, not their businesses. Keurig Dr Pepper’s 6.9% carries the ◊ marker because it is structurally depressed by roughly forty billion dollars of goodwill and intangibles from the 2018 Keurig/Dr Pepper Snapple merger inflating its invested-capital base — this is merger accounting, not weak operating economics, and it sits directly alongside KDP’s healthy operating margins from 5.2. Mondelez’s 6.0% is the cocoa trough: its FY2025 operating profit collapsed, crushing the numerator, and on normalised FY2024 economics its ROIC would screen far higher. The defensible conclusion is that PepsiCo remains a genuinely high-return franchise; its return over a cost of capital of roughly 7.02% is wide and intact, consistent with Section 3’s finding that PepsiCo earns a large positive spread on invested capital even after FY2025’s step-down.
ROE and ROA say more about balance-sheet structure than about productivity, and must be read that way. PepsiCo’s ROE of 42.9% and Coca-Cola’s 46.0% both look extraordinary, but Section 3’s DuPont work showed PepsiCo’s headline ROE is leverage-amplified — driven by a thin equity base and a high equity multiplier rather than by superior asset productivity. General Mills’ 24.7% is respectable but on a period lag; Mondelez’s 9.3% and KDP’s 8.4% are both depressed — Mondelez by the cocoa year, KDP by the same enormous merger-built equity base that depresses its ROIC. The asset-turnover row makes the structural point explicit: PepsiCo turns its assets at 0.87x, well above every peer — nearly double Coca-Cola’s 0.47x and almost triple KDP’s 0.30x — precisely because it owns the manufacturing and distribution assets that generate its far larger revenue base, whereas KDP’s balance sheet is loaded with merger intangibles and Coca-Cola’s is asset-light by design. The correct emphasis, as in Section 3, is to weight ROIC over ROE for this business.
Historical: PepsiCo, Inc. Own 5-Year Progression
| Metric | FY2021 | FY2022 | FY2023 | FY2024 | FY2025 |
|---|---|---|---|---|---|
| ROIC | 17.4% | 18.9% | 18.5% | 19.5% | 16.3% |
| ROE | 51.7% | 53.7% | 50.9% | 52.4% | 42.9% |
| ROA | 8.2% | 9.7% | 9.4% | 9.6% | 8.0% |
Source: Peer-company SEC filings; comparability notes in 5.7 — see Appendix A.1.
5.4 Leverage & Liquidity Comparison
sources Comparative: Most Recent Full Fiscal Year
| Metric | PepsiCo, Inc. | The Coca-Cola Company | Mondelez International, Inc. | Keurig Dr Pepper Inc. | General Mills, Inc. |
|---|---|---|---|---|---|
| Net Debt / EBITDA | 2.7x | 2.4xᶜ | 3.9xᶜ‡ | 3.6xᶜ | 3.8xᶜ¶ |
| Total Debt / Equity | 2.4x | 1.4x | 0.8x | 0.6x | 1.6x¶ |
| Interest Coverage | 10.3x | 8.3x | 5.9x | 4.7x | 6.3x¶ |
| Current Ratio | 0.9x | 1.5x | 0.6x | 0.6x | 0.7x¶ |
| FCF Margin | 8.2% | 11.1%§ | 8.4%ᶜ | 9.1% | 11.8%ᶜ¶ |
Source: Peer-company SEC filings; comparability notes in 5.7 — see Appendix A.1.
Widening the peer set changes the leverage verdict: PepsiCo is no longer the most-levered name in the group — it sits second-lowest, and the concern is direction, not level. PepsiCo’s net debt/EBITDA of 2.7x is above only Coca-Cola’s 2.4x and below all three of the others — Keurig Dr Pepper’s 3.6x, General Mills’ 3.8x and Mondelez’s cocoa-inflated 3.9x. Against the smaller, more-levered integrated and packaged-foods peers, PepsiCo’s balance sheet is comfortably mid-pack for an investment-grade staples issuer. The real issue is the one Section 3 identified — trajectory, not static level: PepsiCo’s leverage rose to its own five-year high in FY2025, moving the wrong way exactly as operating cash flow softened. Total debt-to-equity of 2.4x is the highest in the group, but that is partly an artefact of PepsiCo’s structurally thin equity base — the same feature that inflates its ROE — rather than an unusually large debt load. Interest coverage of 10.3x is the strongest of all five, comfortably ahead of Coca-Cola’s 8.3x and well clear of KDP’s 4.7x, so this is a question of financial-flexibility direction, not of solvency.
The current ratio below 1.0x is a design feature, not a liquidity warning — but read the FCF line with real care. PepsiCo’s current ratio of 0.9x, Mondelez’s 0.6x, KDP’s 0.6x and General Mills’ 0.7x all sit below one — normal for consumer-staples businesses that run on negative working capital and stretched trade payables; only Coca-Cola’s higher 1.5x stands out, reflecting its larger cash and short-term-investment balances. The FCF-margin row is where the comparison is most treacherous. Coca-Cola’s 11.1% looks only modestly ahead of PepsiCo’s 8.2%, but that Coca-Cola figure is depressed — its FY2025 operating and free cash flow were cut by roughly six billion dollars by the one-off payment of the fairlife contingent-consideration liability (the § marker). Normalised, Coca-Cola’s cash conversion screens well above PepsiCo’s. On the other side, PepsiCo’s own FCF margin was flattered by the FY2025 capex cut and by a growing reverse-factoring program that extends days-payable (Section 3). KDP’s 9.1% and Mondelez’s 8.4% are the cleaner cash-conversion reads this year; General Mills’ 11.8% is genuinely strong but carries the period-lag caveat. No single company’s headline FCF margin should be taken fully at face value in FY2025.
5.5 Valuation Multiples Comparison
sources Comparative: Current Price
| Metric | PepsiCo, Inc. | The Coca-Cola Company | Mondelez International, Inc. | Keurig Dr Pepper Inc. | General Mills, Inc. |
|---|---|---|---|---|---|
| EV/EBITDA | 15.5x | 27.7xᵐ† | 20.0xᵐ‡ | 13.5xᵐ◊ | 8.8xᵐ¶ |
| P/E | 23.4x | 28.5xᵐ | 32.2xᵐ‡ | 19.9xᵐ◊ | 8.4xᵐ¶ |
| FCF Yield | 4.0% | 1.4%ᵐ§ | 4.1%ᵐ | 3.6%ᵐ◊ | 11.8%ᵐ¶ |
Source: Peer-company SEC filings; comparability notes in 5.7 — see Appendix A.1.
All peer valuation multiples are market-sourced. Subject to change with price movements.
With four peers the discount question is sharper, not simpler — and the honest answer is that PepsiCo is not obviously cheap. PepsiCo trades at 15.5x EV/EBITDA and 23.4x earnings. Against the two large-cap peers it screens cheaper: Coca-Cola at 27.7x and 28.5x, Mondelez at 20.0x and 32.2x. But against the two we have just added, PepsiCo is more expensive: Keurig Dr Pepper trades at 13.5x EV/EBITDA and 19.9x earnings, and General Mills at 8.8x and 8.4x — both below PepsiCo on both primary multiples. The simple “PepsiCo is cheap versus its peers” reading that a two-name Coca-Cola/Mondelez set produced does not survive the wider group. Work through each leg before drawing a conclusion:
-
The discount to Coca-Cola is real but largely mechanical. Coca-Cola’s 27.7x rests on an asset-light EBITDA base that is structurally small relative to enterprise value and that excludes the roughly two billion dollars of bottler equity income captured in its market capitalisation (the † marker) — it is not apples-to-apples with an integrated peer that consolidates its manufacturing and distribution EBITDA. On P/E, however, Coca-Cola’s earnings are the cleanest in the group this year, which makes it the most reliable P/E anchor of the five.
-
The discount to Mondelez largely evaporates on normalisation. Mondelez’s 20.0x and 32.2x are computed on cocoa-depressed EBITDA and EPS; normalise both toward FY2024 and the multiples compress toward — or below — PepsiCo’s. The headline discount to Mondelez is a denominator artefact, not a relative-cheapness signal.
-
The premium to Keurig Dr Pepper is not a usable signal, because KDP’s multiple mixes a post-deal price with pre-deal fundamentals. KDP’s 13.5x and 19.9x carry the ◊ marker: its current market capitalisation reflects the transformational 2026 JDE Peet’s coffee acquisition and the announced coffee/beverage separation, while its FY2025 EBITDA, EPS and net debt all predate those events. The multiple combines a current equity value with prior-year earnings and is indicative only. KDP is the clean operating and margin comparator (5.2–5.4); it is not a clean valuation comparator.
-
The premium to General Mills is an optical illusion of the calendar. General Mills’ 8.8x and 8.4x look strikingly cheap and its 11.8% FCF yield strikingly high, but the ¶ marker explains why: its current market capitalisation reflects post-FY2026 pessimism — its FY2026 was a GAAP net-loss year on a roughly three-billion-dollar restructuring and impairment charge — while the EBITDA and earnings shown here are the clean FY2025 figures. The price and the earnings are drawn from different periods, so the low multiple is not a genuine value signal.
Netting these: only Coca-Cola offers a clean current-year earnings anchor, and against it PepsiCo trades at a real but moderate discount; against a normalised Mondelez, roughly parity; and the apparent premium to KDP and General Mills is not informative because both peers’ multiples are distorted. The remaining discount to Coca-Cola is defensible on fundamentals rather than excessive. PepsiCo carries the structurally lower margin of a bottling-inclusive model; its North American snacks and beverage volumes are declining, not compounding (Section 3); its reported earnings quality is softer, with a wide Core-versus-GAAP wedge, recurring “one-time” restructuring, a DPO flattered by reverse factoring, and receivables and inventory growing faster than sales; and its shareholder-return program now consumes essentially all of free cash flow and is part-funded by incremental debt. A lower multiple for a business with a lower structural margin, weaker volume trajectory and thinner cash-flow cushion is a rational market judgement, not a mispricing. [Rating and price target withdrawn — see the note at the top.]
[Rating and price target withdrawn — see the note at the top.]
Historical: PepsiCo, Inc. EV/EBITDA (period-end price)
| FY2021 | FY2022 | FY2023 | FY2024 | FY2025 |
|---|---|---|---|---|
| 19.9x | 20.0x | 18.0x | 15.3x | 15.9x |
Source: Peer-company SEC filings; comparability notes in 5.7 — see Appendix A.1.
5.6 Efficiency Comparison
| Metric | PepsiCo, Inc. | The Coca-Cola Company | Mondelez International, Inc. | Keurig Dr Pepper Inc. | General Mills, Inc. |
|---|---|---|---|---|---|
| Days Sales Outstanding | 42 days | 25 days | 37 days | 35 days | 33 days¶ |
| Days Inventory Outstanding | 47 days | 91 days | 54 days | 73 days | 54 days¶ |
| Days Payables Outstanding | 96 days | 110 days† | 129 days | 144 days | 114 days¶ |
| Cash Conversion Cycle | -7 days | 6 days† | -38 days | -36 days | -27 days¶ |
| CapEx / Revenue | 4.7% | 4.4% | 3.3% | 2.9% | 3.2%¶ |
Source: Peer-company SEC filings; comparability notes in 5.7 — see Appendix A.1.
PepsiCo runs a genuinely efficient working-capital cycle, but the negative cash-conversion cycle across the group is partly a financing choice, and PepsiCo’s payables leg deserves the caveat Section 3 attached to it. Four of the five companies operate on a negative cash-conversion cycle — the hallmark of consumer-staples businesses with strong supplier bargaining power, but also, increasingly, of aggressive supplier-finance programs. PepsiCo’s CCC of -7 days is negative and better than Coca-Cola’s positive 6 days, but well short of the deeply negative cycles at Mondelez (-38 days), Keurig Dr Pepper (-36 days) and General Mills (-27 days) — and those three reach their negative cycles largely through very long payables. PepsiCo carries the leanest inventory of the group at 47 days, a real operating strength reflecting fast-turning DSD product; KDP and General Mills both sit heavier at 73 days and 54 days. PepsiCo’s DSO of 42 days is the longest of the five, a function of its larger direct-distribution receivables book. And its DPO of 96 days sits below the deep payables of KDP (144 days) and Mondelez (129 days) — but Section 3 flagged that PepsiCo’s days-payable is increasingly supported by a growing reverse-factoring (supplier-finance) program held inside accounts payable; part of the payables cushion that produces its negative CCC is financed rather than purely commercial, and a withdrawal of bank appetite would compress it. The same caution applies to KDP and General Mills, both of which disclose heavy supplier-financing use, so the peer group’s deeply negative cycles are not a straightforward efficiency ranking.
Capital intensity confirms the integrated-versus-concentrate story one last time. PepsiCo’s capex/revenue of 4.7% is the highest of the five, above Coca-Cola’s 4.4%, KDP’s 2.9%, Mondelez’s 3.3% and General Mills’ 3.2% — the direct signature of a company that owns its manufacturing, bottling and distribution assets rather than outsourcing them. It is telling that even KDP, the other integrated beverage operator, runs a lower capex ratio this year, which underscores the Section 3 caution: PepsiCo’s FY2025 capex was already cut to support free cash flow, so this ratio is if anything understated relative to its normalised asset-intensity, and it cannot be trimmed repeatedly without starving the network. This is the reinvestment cost behind PepsiCo’s larger revenue base and lower reported margins — a structural difference, not inefficiency.
5.7 Comparability Caveats
sources The peer set is clean on accounting standard and currency — all four companies report under US GAAP in US dollars, so none of the usual IFRS-versus-GAAP or translation distortions apply. That is a genuine strength of this table. The material comparability problems here are structural, one-off and period problems, not accounting problems; five are material and two further points are informational.
C001 — Coca-Cola is not margin-comparable (MATERIAL; affects revenue and every margin line). Coca-Cola runs a concentrate-led model with most bottling refranchised, so it sells concentrate rather than finished beverages for a comparable volume of product consumed. This structurally shrinks its revenue base — its $47,941.0M of FY2025 revenue is roughly half PepsiCo’s $93,925.0M for broadly comparable global consumption — and inflates its gross, EBITDA, EBIT and net margins, because the low-margin manufacturing and distribution activities that PepsiCo consolidates sit outside Coca-Cola’s reporting entity. Coca-Cola’s operating income additionally excludes roughly two billion dollars of equity income earned on its bottler stakes, understating its operating economics and depressing its computed ROIC. Reader adjustment: do not treat PepsiCo’s lower margins as underperformance, and do not treat Coca-Cola’s revenue as volume-comparable to PepsiCo’s. The C007 KDP comparison is the direct proof of this point.
C002 — Mondelez’s FY2025 is cocoa-distorted (MATERIAL; affects margins, ROIC, ROE, ROA, P/E, EV/EBITDA and EPS). Record cocoa and commodity costs drove Mondelez’s FY2025 cost of sales sharply higher, collapsing its gross margin, roughly halving its operating margin, and cutting diluted EPS by nearly half versus FY2024. Its FY2025 ROIC, ROE, ROA, P/E and EV/EBITDA are consequently not representative of its through-cycle economics — the return metrics are depressed by the profit collapse, and the valuation multiples are inflated by depressed EBITDA and EPS denominators. Reader adjustment: treat FY2024 as the normalised read for Mondelez, whose FY2024 gross and operating margins were far higher; every FY2025 Mondelez profitability, return and valuation figure carries the ‡ marker and should be read as a one-off trough. Mondelez remains the better structural read-across for PepsiCo’s snacking and foods segments.
C003 — Coca-Cola’s FY2025 free cash flow is depressed by a one-off payment (MATERIAL; affects OCF, FCF, FCF margin and FCF yield). Coca-Cola’s FY2025 operating and free cash flow were reduced by roughly six billion dollars by the cash settlement of the fairlife contingent-consideration liability that had been accrued at year-end 2024. Its FY2025 FCF margin and FCF yield therefore understate its normalised cash generation, which would screen well above PepsiCo’s. Reader adjustment: do not compare Coca-Cola’s FY2025 FCF margin or yield to PepsiCo’s without normalising for the fairlife payment; these Coca-Cola figures carry the § marker.
C007 — Keurig Dr Pepper is the clean, integrated-model margin comparator (MATERIAL, and favourable; affects the interpretation of every margin line). Unlike Coca-Cola, KDP owns its manufacturing, bottling and distribution — the same integrated model as PepsiCo Beverages North America. Its FY2025 gross margin of 54.2% is almost identical to PepsiCo’s 54.1%, and its operating margin of 21.5% sits between PepsiCo’s total-company 12.2% and Coca-Cola’s concentrate-inflated 28.7%. KDP therefore directly resolves the C001 problem: PepsiCo’s gross margin is not structurally inferior — an integrated beverage peer earns essentially the same margin, and the gap to Coca-Cola is a business-model artefact, not an operating-quality gap. Reader adjustment: use KDP as the like-for-like margin and operating read-across for PepsiCo’s beverage business; its gross, EBITDA and EBIT margins carry no distortion marker and are the cleanest external validation of PepsiCo’s margin structure in this section.
C008 — Keurig Dr Pepper’s valuation multiples and ROIC are not on a comparable basis (MATERIAL; affects EV/EBITDA, P/E, FCF yield and ROIC). Two distinct points. First, valuation: KDP’s current market capitalisation and leverage reflect the transformational JDE Peet’s coffee acquisition consolidated in 2026 and the announced split into a Beverage Co and a Global Coffee Co, whereas its FY2025 EBITDA, EPS and net debt all predate those events — so its 13.5x EV/EBITDA, 19.9x P/E and 3.6% FCF yield combine a post-deal equity value with pre-deal fundamentals and are indicative only. Second, ROIC: KDP’s 6.9% is structurally depressed by the very large goodwill and intangible balance carried from the 2018 Keurig/Dr Pepper Snapple merger, which inflates its invested capital — it reflects merger accounting, not weak operating economics. Reader adjustment: present KDP’s operating, margin, working-capital and leverage metrics as clean and directly comparable, but do not rank KDP on EV/EBITDA, P/E or FCF yield (the ◊ marker), and attribute its low ROIC to the merger-built denominator rather than to operating quality.
C009 — General Mills carries a material period lag and a price/earnings-period mismatch (MATERIAL; affects every metric, and especially the multiples). General Mills is the packaged-foods read-across for PepsiCo Foods North America. Three points. First, period lag: GIS ends its fiscal year in late May, so the FY2025 figures used here (year ended 25 May 2025) overlap PepsiCo’s FY2025 (ended 27 December 2025) by only about six months and are centred roughly seven months earlier, in a different commodity and pricing environment. Second, why FY2025 and not FY2026: GIS’s latest year, FY2026, is a GAAP net-loss year — a roughly three-billion-dollar restructuring and impairment charge cut operating profit sharply and produced negative diluted EPS — so its FY2026 margins, returns and multiples are meaningless, and the clean prior year (FY2025) is deliberately used as the representative period. Third, valuation mismatch: GIS’s current market capitalisation reflects post-FY2026 pessimism while its EBITDA, EPS and FCF shown here are FY2025, so its optically cheap 8.4x P/E, 8.8x EV/EBITDA and high 11.8% FCF yield draw price and earnings from different periods and are not a genuine value signal. Minor mechanical notes: GIS reports only “Interest, net” on the income-statement face (its interest coverage is marginally overstated versus the gross-interest basis used for the other peers), and its current ratio includes assets held for sale pending divestiture. Reader adjustment: every GIS figure carries the ¶ marker; always disclose the May year-end and the ~6-month lag, and do not treat GIS’s low multiples or high FCF yield as a valuation signal.
C004/C005 — PepsiCo’s own GAAP earnings are depressed, so the P/E comparison is imperfect on the subject side too (informational; affects P/E, net margin, EPS). PepsiCo’s FY2025 GAAP net income and diluted EPS are themselves reduced by the intangible impairment analysed in Section 3, elevating its reported GAAP P/E of 23.4x relative to its underlying earnings power. Both PepsiCo and Mondelez therefore carry depressed FY2025 GAAP EPS, while Coca-Cola’s earnings are comparatively clean. This is why the separate valuation values PepsiCo on management’s Core (non-GAAP) EPS of $8.14 per share rather than on the depressed GAAP figure. Reader adjustment: a like-for-like P/E comparison should reference adjusted/core EPS where available; Coca-Cola is the most reliable GAAP-P/E anchor of the five this year, and KDP the cleanest operating comparator.
C006 — Two mechanical points on Coca-Cola’s multiples and payables (informational; affects EV/EBITDA, DPO, CCC). First, Coca-Cola’s EV/EBITDA screens very high partly because its EBITDA excludes the bottler equity income (roughly two billion dollars) whose value is captured in its market capitalisation — the † marker on the EV/EBITDA line reflects a structural inflation, not a like-for-like premium. Second, Coca-Cola does not disclose trade payables on the balance-sheet face; its DPO and CCC here were built from the trade-payables figure isolated from its Note 8, with the FY2024 fairlife contingent-consideration item excluded, to make the working-capital comparison consistent with PepsiCo’s convention.
A note on the market-sourced inputs. The EV/EBITDA, P/E and FCF-yield lines in 5.5 are the only figures in this section drawn from anything other than a primary filing: they use peer share prices and market capitalisations sourced from an aggregator as of the valuation date, combined with balance-sheet net debt taken from the 10-Ks. They are flagged ᵐ and will move with the peers’ share prices. Every other figure in Sections 5.2 through 5.6 is computed from the peers’ own SEC filings on a basis identical to the subject’s.
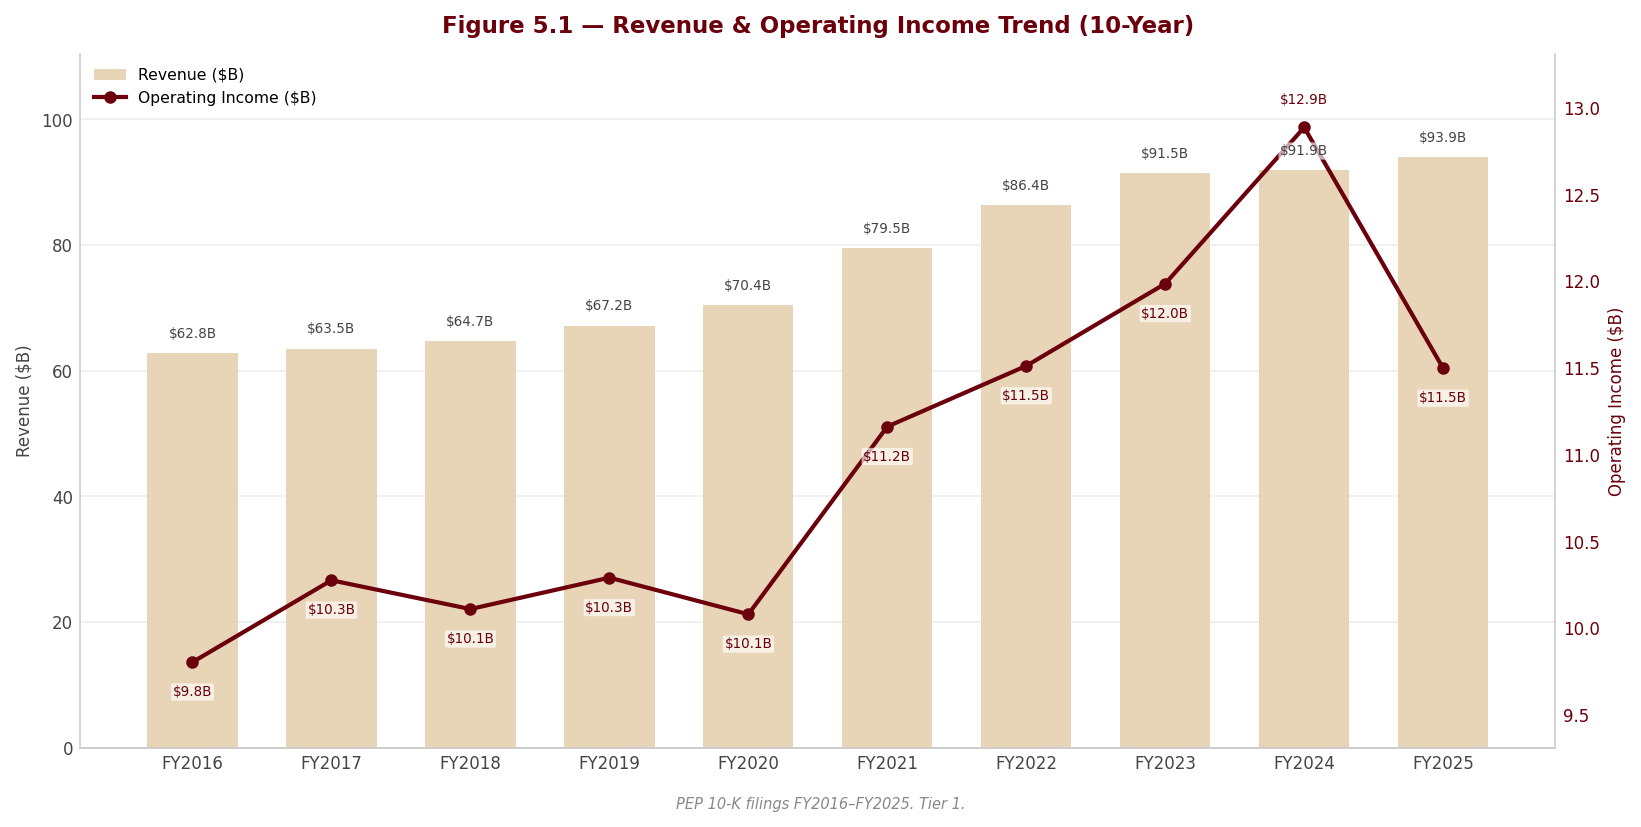
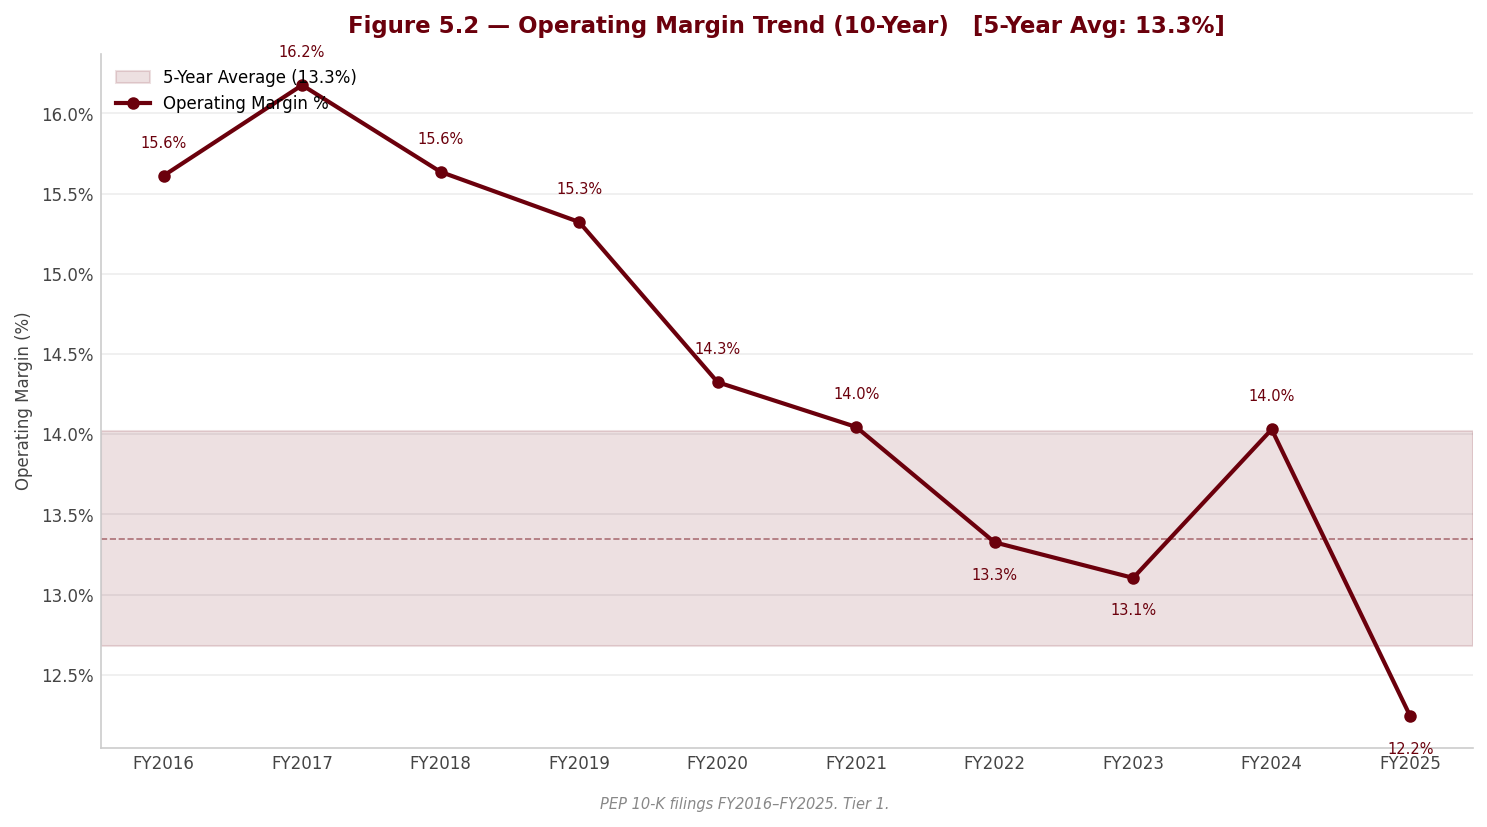
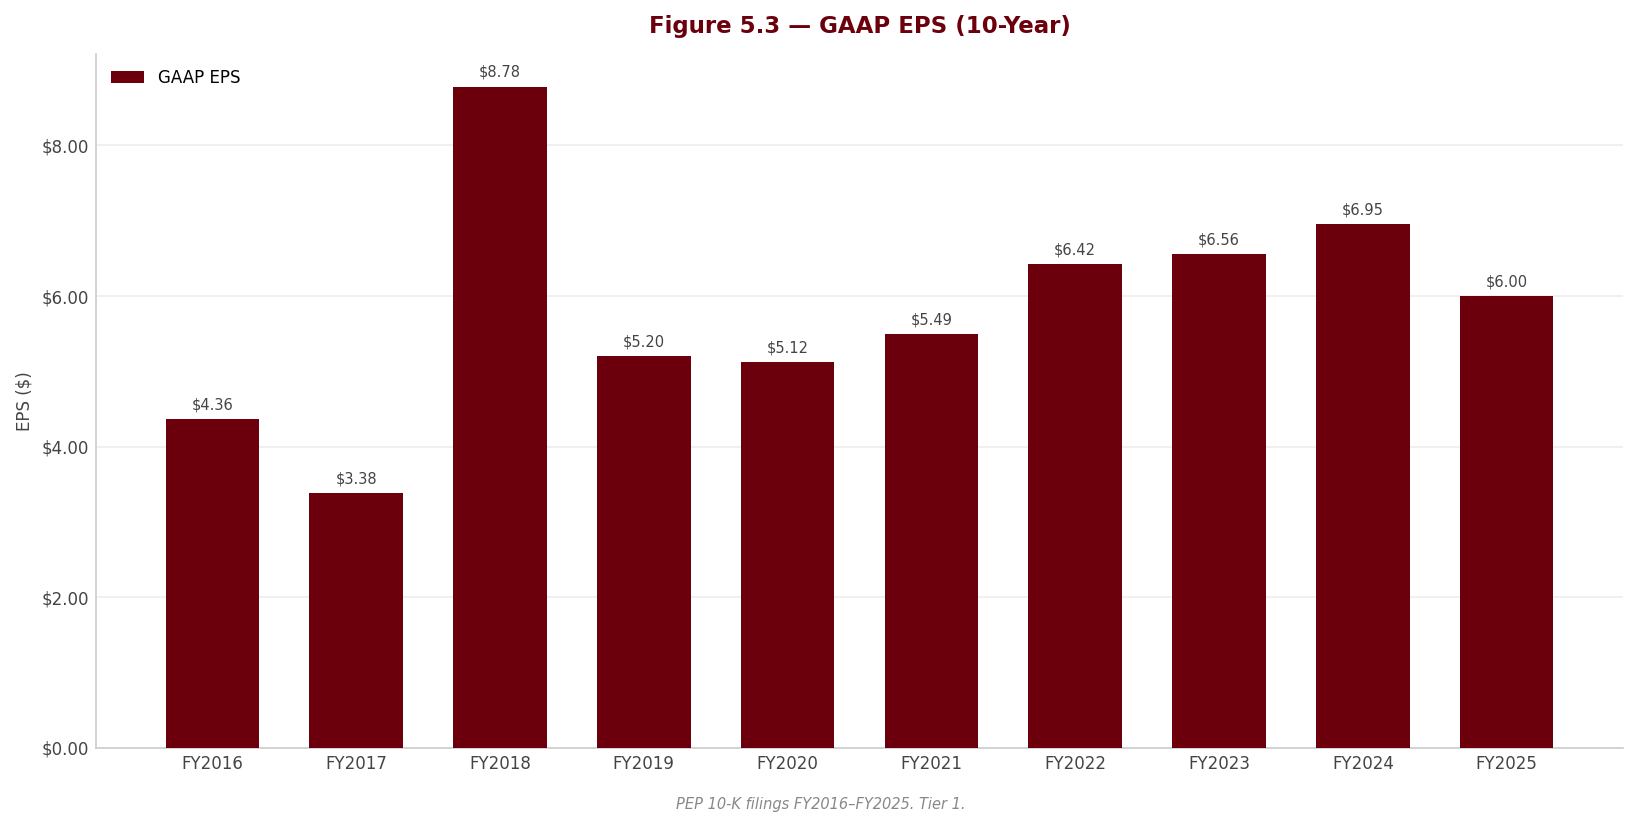
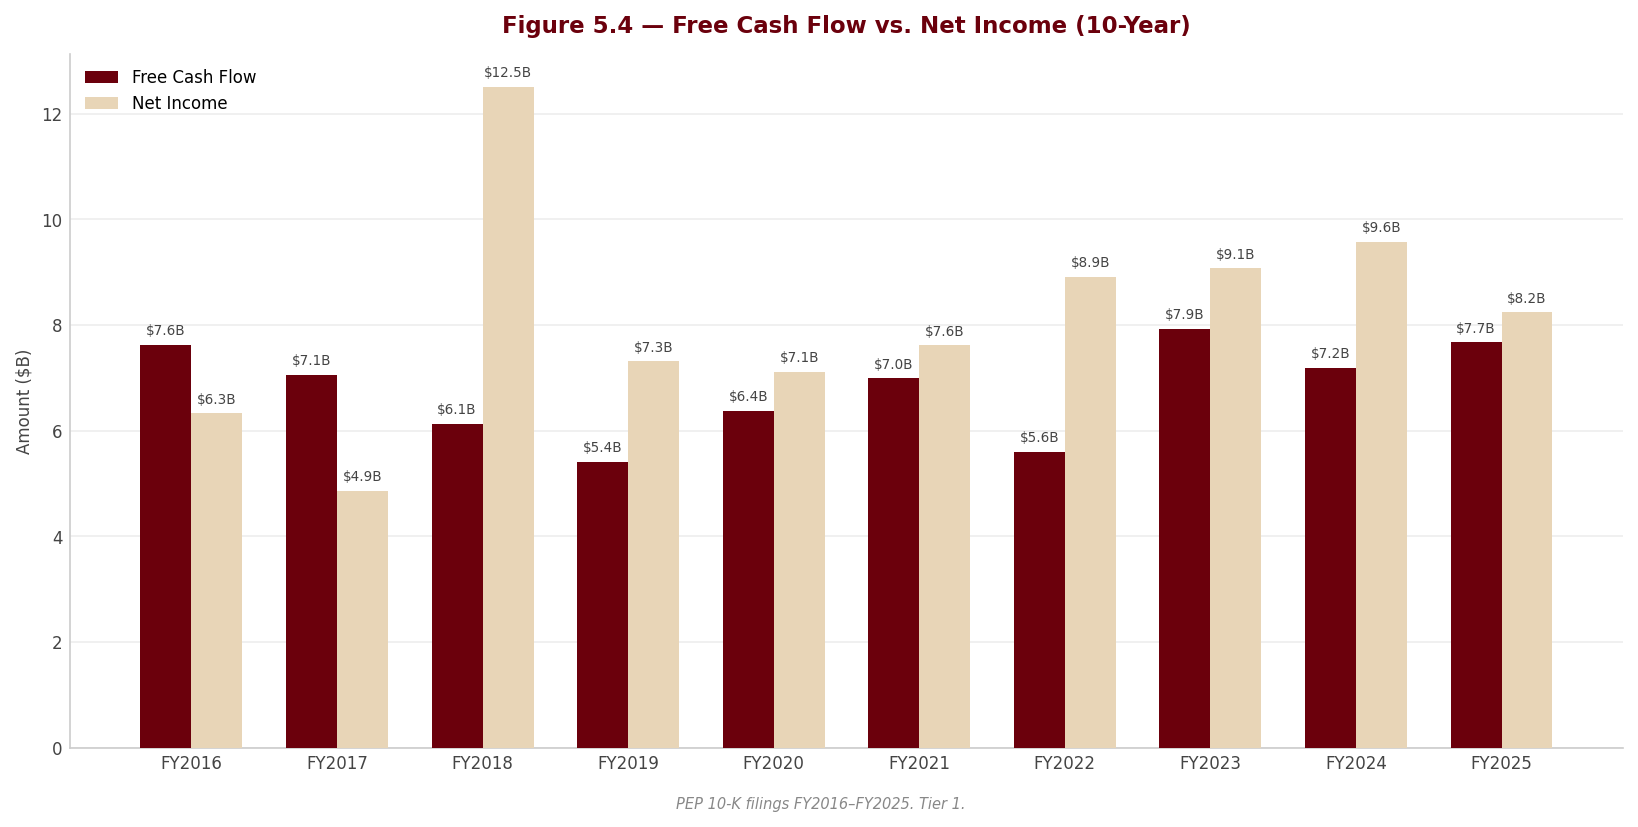
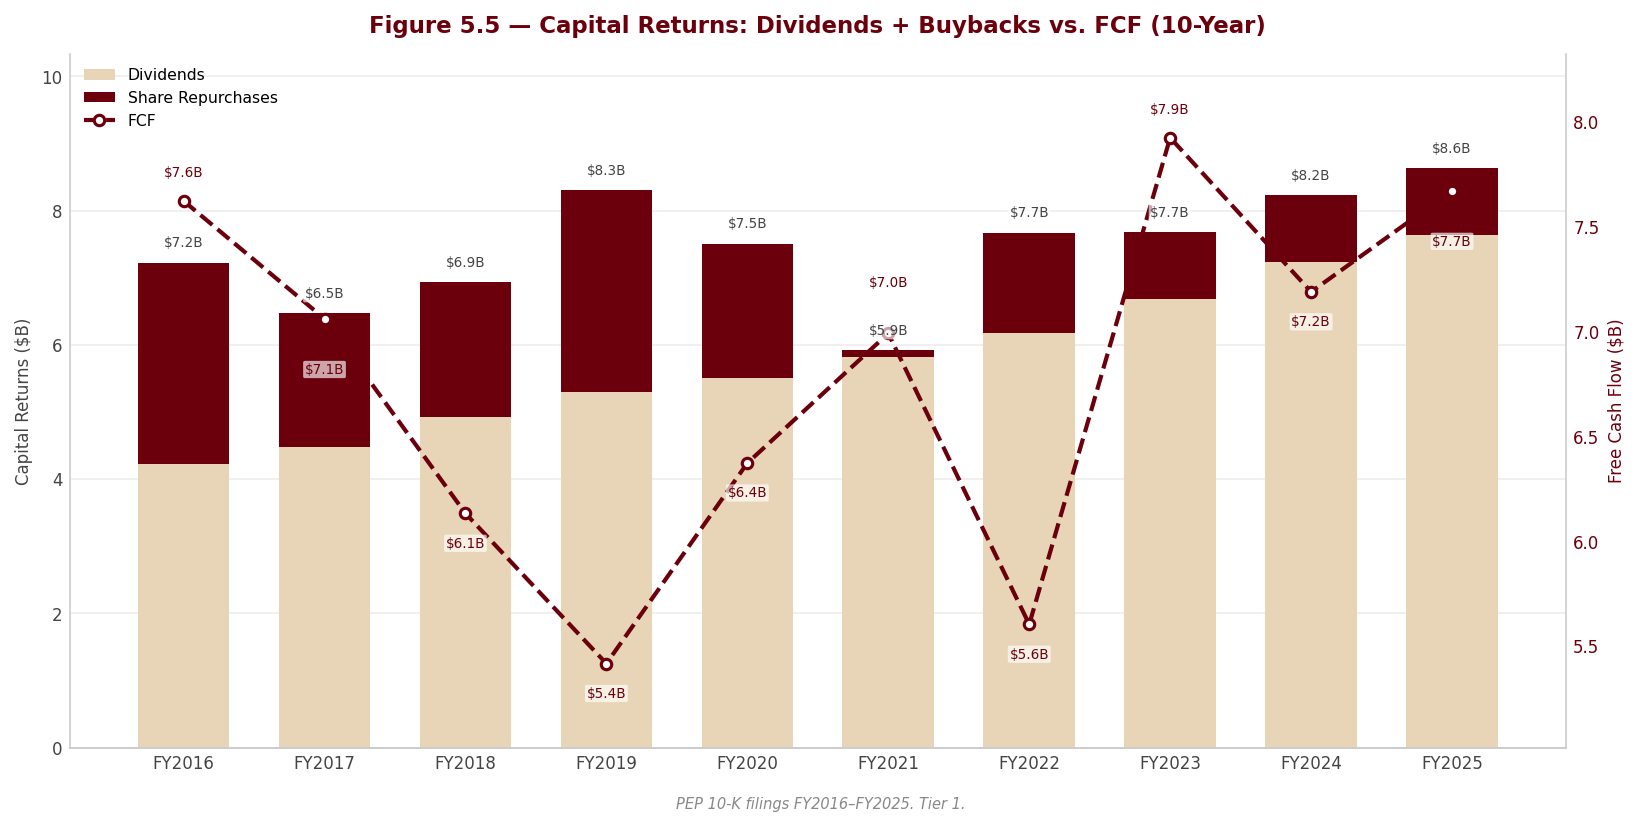
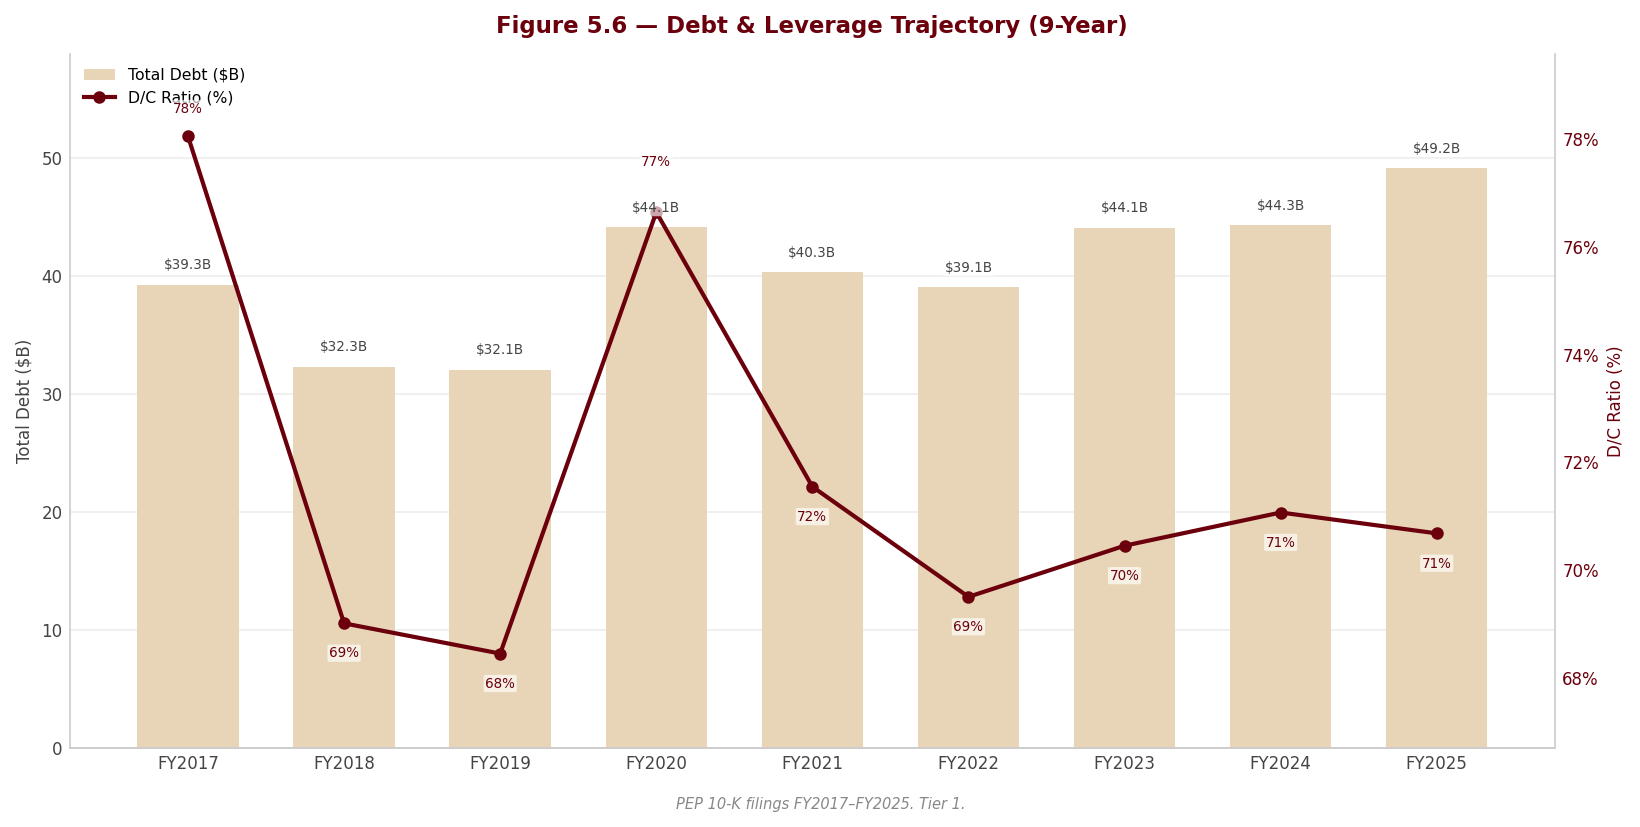
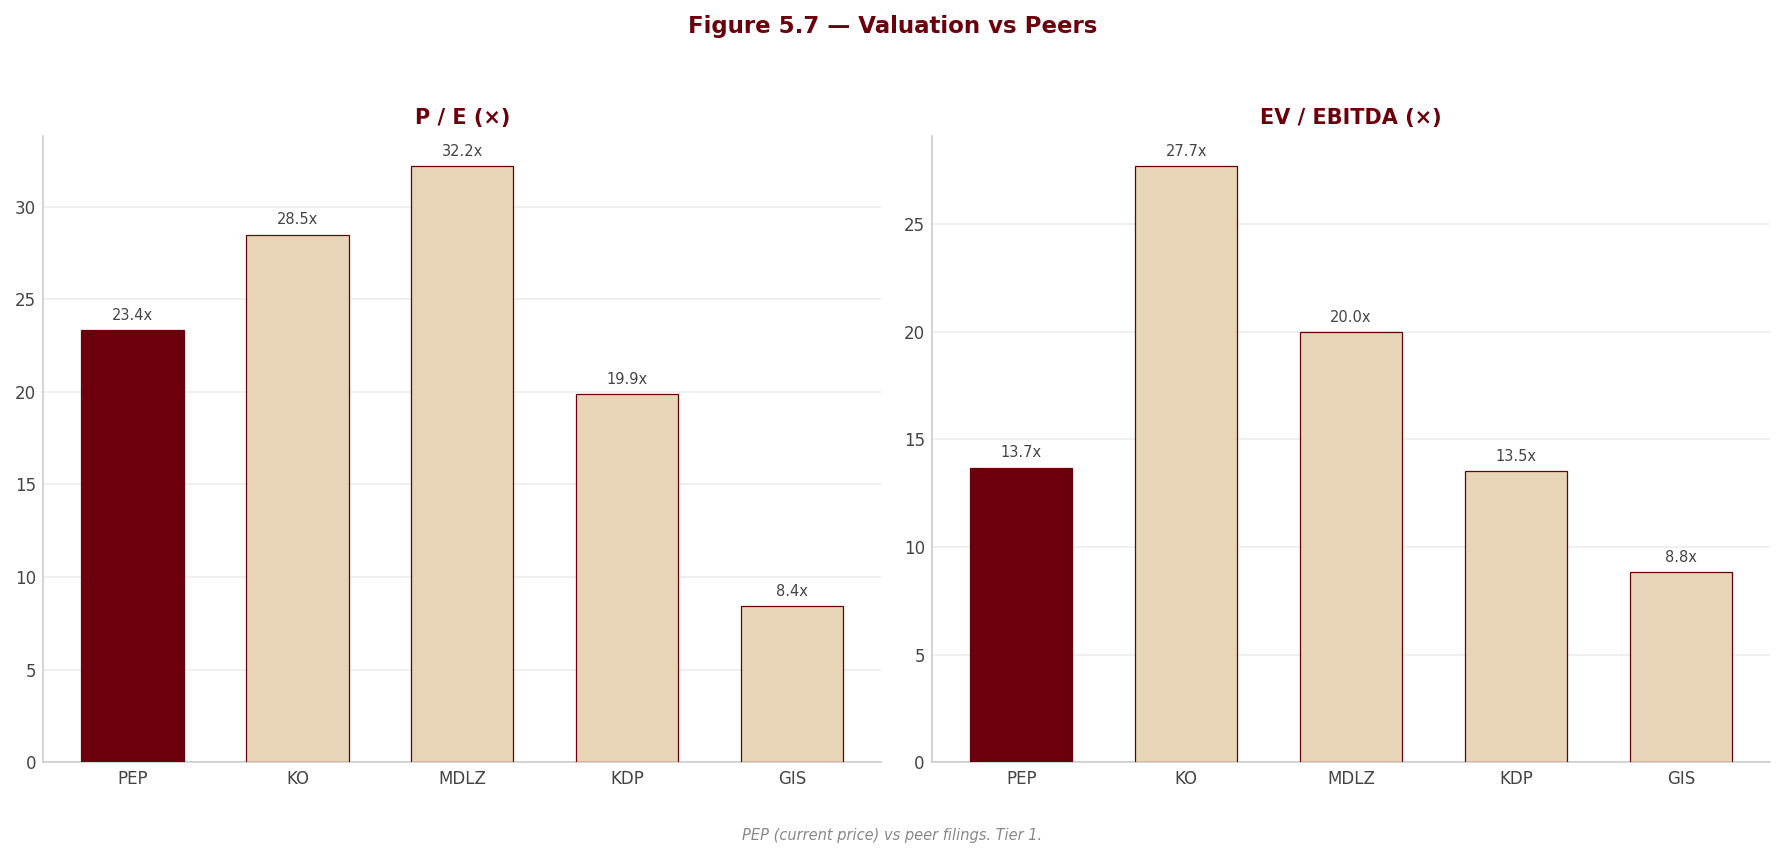
6. Valuation & Price Target withdrawn
This section stated what the shares were worth and what to do about them. It rested on an exit multiple set by hand — across the coverage it averaged 24% below where each company actually traded — so the conclusion largely restated that assumption instead of testing it. Rather than leave it standing, it has been withdrawn while the method is rebuilt.
Nothing else in this report depends on it: the financial analysis above and below is drawn from the company's own filings, and every figure links to the page it was verified against.
Section 7 — Quarterly Update: Q2 2026
Portfolio Action
[Rating and price target withdrawn — see the note at the top.]
| Assessment | |
|---|---|
| Action | [Rating and price target withdrawn — see the note at the top.] |
| Reason | Reported operating profit rose +124.9% only because the Q2 2025 base carried a $1,860M intangible impairment; on the company’s own core basis operating profit rose +4.0% (+1% constant currency) and quarterly free cash flow of $1,505M covered just 77.3% of the $1,948M dividend paid. |
| Thesis intact? | [Rating and price target withdrawn — see the note at the top.] |
| Trigger to revisit | The Q3 2026 annual indefinite-lived intangible impairment assessment (10-Q p. 23) — a SodaStream or further acquired-brand write-down fires the separate valuation’s downgrade trigger #1; conversely, PFNA core operating profit returning to growth alongside positive North American organic volume for two consecutive quarters would support an upgrade. |
7.1 Results at a Glance
| Metric | Q2 2026 | Q2 2025 | YoY Δ | Q1 2026 | QoQ Δ |
|---|---|---|---|---|---|
| Revenue ($M) | $24,181.0M | $22,726.0M | +6.4% | $19,443.0M | +24.4% |
| Gross Profit ($M) | $13,111.0M | $12,422.0M | +5.5% | $10,731.0M | +22.2% |
| Gross Margin | 54.2% | 54.7% | -0.4 pp | 55.2% | -1.0 pp |
| EBITDA ($M) | $4,920.0M | $2,596.0M | +89.5% | $3,955.0M | +24.4% |
| EBITDA Margin | 20.3% | 11.4% | +8.9 pp | 20.3% | +0.0 pp |
| EBIT ($M) | $4,023.0M | $1,789.0M | +124.9% | $3,213.0M | +25.2% |
| EBIT Margin | 16.6% | 7.9% | +8.8 pp | 16.5% | +0.1 pp |
| Net Income ($M) | $2,981.0M | $1,263.0M | +136.0% | $2,327.0M | +28.1% |
| Net Margin | 12.3% | 5.6% | +6.8 pp | 12.0% | +0.4 pp |
| Diluted EPS | $2.18 | $0.92 | +137.0% | $1.70 | +28.2% |
Source: PepsiCo, Inc. Form 10-Q for the quarterly period ended June 13, 2026 — Condensed Consolidated Statement of Income (p. 4); Q1 2026 column from the workbook quarterly series. Percentage changes computed by the analyst.
Formula basis. YoY Δ = (CQ - PYSQ) / |PYSQ| × 100 — e.g. revenue (24,181 - 22,726) / 22,726 × 100 = +6.4%. QoQ Δ = (CQ - PQ) / |PQ| × 100 — e.g. revenue (24,181 - 19,443) / 19,443 × 100 = +24.4%. Margins are the line item divided by revenue — e.g. gross margin 13,111 / 24,181 × 100 = 54.2%; EBITDA margin 4,920 / 24,181 × 100 = 20.3%; EBIT margin 4,023 / 24,181 × 100 = 16.6%; net margin 2,981 / 24,181 × 100 = 12.3%. Margin deltas are stated in percentage points (pp) as CQ margin minus comparative margin.
READ THE YoY PROFIT LINES WITH CARE — THE BASE IS DEPRESSED. The Q2 2025 comparative contains a $1,860M pre-tax impairment of intangible assets ($1,447M after tax, $1.05 per share), chiefly the Rockstar brand in PBNA and EMEA plus $80M on Be & Cheery in Asia Pacific Foods (10-Q p. 4 and pp. 14–15). That single charge is why PBNA’s prior-year segment operating profit was negative $639M and why group EBIT margin in the base quarter was only 7.9%. Adding the charge back to the comparative gives the honest underlying comparison:
Measure Q2 2026 Q2 2025 as reported Q2 2025 ex-impairment Underlying YoY EBITDA ($M) 4,920 2,596 4,456 +10.4% (vs. +89.5% reported) EBIT ($M) 4,023 1,789 3,649 +10.3% (vs. +124.9% reported) EBIT margin 16.6% 7.9% 16.1% +0.6 pp (vs. +8.8 pp reported) Net income ($M) 2,981 1,263 2,710 +10.0% (vs. +136.0% reported) Diluted EPS $2.18 $0.92 $1.97 +10.7% (vs. +137.0% reported) Source: 10-Q p. 4 (income statement), pp. 14–15 (segment note footnote (d)), p. 23 (Note 4). Ex-impairment comparatives computed by the analyst by adding back the $1,860M pre-tax / $1,447M after-tax / $1.05 per-share charge.
Stripping restructuring, acquisition credits and mark-to-market as well — the company’s own “core” basis — the growth is smaller still: core operating profit $4,067M vs. $3,911M, +4.0%, and +1% on a constant-currency basis; core diluted EPS $2.20 vs. $2.12, +3.8%, and +1% constant currency (10-Q pp. 55, 65, 67). The reported +124.9% and +137.0% are arithmetically correct and analytically misleading.
7.2 P&L Drivers
sources Revenue. Net revenue of $24,181.0M was +6.4% YoY, but management’s own bridge attributes 2 percentage points to favourable foreign-exchange translation (mainly the Mexican peso and Russian ruble) and 2 points to net acquisitions and divestitures, leaving organic revenue growth of just +2% — composed of +1% organic volume and +2% effective net pricing (10-Q p. 54, and FX commentary p. 45). The +24.4% QoQ step is calendar, not momentum: Q1 2026 and Q2 2026 are both 12-week periods, but Q1 is the seasonally weakest quarter of PepsiCo’s year. The geographic split is stark — North America organic revenue was flat-to-negative (PFNA organic -2%, PBNA organic +1%) while international organic growth ran +4% to +9% across the four other divisions (p. 54).
Segment detail (current six-division basis). The company reorganised into six reportable segments effective FY2025; the divisional lines below are not comparable to any pre-FY2025 structure.
| Segment | Net revenue Q2 2026 ($M) | Reported revenue YoY | Organic revenue YoY | Reported segment OP Q2 2026 ($M) | Reported segment OP Q2 2025 ($M) | Core OP YoY |
|---|---|---|---|---|---|---|
| PepsiCo Foods North America | 6,368 | -1.7% | -2% | 1,342 | 1,391 | -8% |
| PepsiCo Beverages North America | 7,243 | +6.6% | +1% | 1,053 | (639) | 0% |
| International Beverages Franchise | 1,523 | +11.3% | +9% | 637 | 535 | +19% |
| EMEA | 4,983 | +9.9% | +6% | 751 | 370 | +17% |
| Latin America Foods | 2,940 | +15.4% | +4% | 616 | 533 | +14% |
| Asia Pacific Foods | 1,124 | +12.2% | +9% | 127 | 10 | +44% |
| Corporate unallocated | — | — | — | (503) | (411) | +12% |
| Total | 24,181 | +6.4% | +2% | 4,023 | 1,789 | +4% |
Source: 10-Q segment note, 12 weeks ended 6/13/2026 (p. 13) and 12 weeks ended 6/14/2025 (p. 14); organic revenue bridge p. 54; core operating-profit percentage changes p. 55. Reported revenue YoY computed by the analyst. Corporate unallocated carries no revenue, hence the em dashes.
The two North American segments — roughly 56% of group revenue — are the problem. PFNA, the profit engine, saw revenue fall 2% on unfavourable net pricing with unit volume merely even, and core operating profit fall 8% (p. 57). PBNA’s headline swing from -$639M to +$1,053M is entirely the absent prior-year Rockstar charge: on a core basis PBNA operating profit was flat at 0%, with unit volume down 4% (CSDs -3%, non-carbonated -4%) and a 6-percentage-point drag from higher commodity costs (pp. 55, 57). EMEA’s +103% reported and Asia Pacific Foods’ rebound from $10M are the same impairment artefact ($251M and $80M of prior-year charges respectively, p. 14); their genuine core growth is +17% and +44%. LatAm Foods’ +15.4% reported revenue is 11 points foreign exchange (p. 59, p. 61). §
Cost and margin. COGS of $11,070.0M rose 7.4% against $10,304.0M — faster than the 6.4% revenue line — compressing gross margin by 0.4 pp to 54.2%; PBNA and LatAm commodity inflation are the named causes, partly offset by 9-to-10-point commodity relief in Asia Pacific Foods on potatoes and packaging (pp. 57, 61). D&A of $897.0M vs. $807.0M is +11.2%, tracking the higher PP&E and acquired intangible base rather than any policy change (segment D&A table, p. 17). The offset sits in SG&A, which grew only 3.6% ($9,088M vs. $8,773M) and fell 1.0 pp as a share of revenue to 37.6% — that operating-leverage gain, not gross margin, is what produced the +0.6 pp of underlying EBIT-margin expansion. Note that $45M of the SG&A benefit is a credit from marking down the poppi contingent-consideration liability (p. 32), which is a fair-value gain, not an operating improvement.
[Rating and price target withdrawn — see the note at the top.] Diluted EPS of $2.18 is +$1.26 / +137.0% YoY and +$0.48 / +28.2% QoQ, of which $1.05 of the YoY gain is nothing more than the absence of last year’s impairment charge (p. 67).
7.3 Balance Sheet & Cash Flow
| Metric | Q2 2026 | Q2 2025 | YoY Δ | Q1 2026 | QoQ Δ |
|---|---|---|---|---|---|
| Cash ($M) | $10,251.0M | $7,631.0M | +34.3% | $10,475.0M | -2.1% |
| Net Debt ($M) | $42,963.0M | $43,753.0M | -1.8% | $42,253.0M | +1.7% |
| Net Debt / LTM EBITDA | 2.39× | —ᵃ | —ᵃ | —ᵃ | —ᵃ |
| Total Assets ($M) | $112,189.0M | $105,345.0M | +6.5% | $110,646.0M | +1.4% |
| Equity ($M) | $22,098.0M | $18,418.0M | +20.0% | $21,383.0M | +3.3% |
| OCF ($M) | $2,324.0M | $1,969.0M | +18.0% | $41.0M | +5,568.3%ᵇ |
| CapEx ($M) | $819.0M | $904.0M | -9.4% | $447.0M | +83.2% |
| FCF ($M) | $1,505.0M | $1,065.0M | +41.3% | -$406.0M | +470.7%ᵇ |
| Dividends Paid ($M) | $1,948.0M | $1,861.0M | +4.7% | $1,966.0M | -0.9% |
Formula basis as in 7.1: YoY Δ = (CQ - PYSQ) / |PYSQ| × 100 — e.g. cash (10,251 - 7,631) / 7,631 × 100 = +34.3%; QoQ Δ = (CQ - PQ) / |PQ| × 100 — e.g. net debt (42,963 - 42,253) / 42,253 × 100 = +1.7%.
Net Debt / LTM EBITDA: LTM EBITDA = Q3 2025 4,393 + Q4 2025 4,693 + Q1 2026 3,955 + Q2 2026 4,920 = 17,961; net debt 42,963 / 17,961 = 2.39×. Note that this LTM window begins after Q2 2025, so the $1,860M impairment quarter is already excluded from the denominator — the ratio is not flattered by the add-back.
ᵃ Leverage is presented for the current quarter only; a comparative LTM EBITDA for the prior-year and prior-sequential quarters is not derivable from this filing, which presents cash flow and EBITDA inputs on a 24-week year-to-date basis (p. 6). ᵇ Q1 2026 is PepsiCo’s seasonally weakest quarter and is near-zero on operating cash flow (OCF $41M, FCF -$406M); the QoQ percentages are arithmetically correct but carry no analytical signal.
Source: 10-Q Condensed Consolidated Balance Sheet, June 13, 2026 (p. 8); Condensed Consolidated Statement of Cash Flows, 24 weeks ended June 13, 2026 (pp. 6–7). Standalone-quarter cash-flow figures are derived by differencing the 24-week year-to-date statement against the Q1 2026 12-week statement (24-week OCF 2,365 - Q1 41 = 2,324; capital spending 1,266 - 447 = 819; dividends 3,914 - 1,966 = 1,948), the standard pipeline treatment for a year-to-date-only interim cash-flow statement.
Balance sheet note. The quarter’s balance-sheet movement is a seasonal working-capital build funded with short-term paper: accounts and notes receivable rose to $13,496M from $11,506M at the 27 December 2025 year-end and inventories to $6,734M from $5,845M, while short-term debt obligations jumped to $10,602M from $6,861M — with $6.1 billion of commercial paper outstanding at quarter end (10-Q p. 8, p. 27). Total debt of $53,214M against $10,251M of cash leaves net debt of $42,963.0M, $710M higher than Q1 2026 despite $1,505M of quarterly free cash flow, because shareholder returns exceeded it; equity of $22,098.0M rose 3.3% QoQ on retained earnings of $74,116M less $2,030M of dividends declared and $289M of buybacks (p. 10).
Cash flow note. FCF conversion = FCF / Net Income = 1,505 / 2,981 = 50.5% — cash flow did not track earnings this quarter, and the gap is working capital, not accruals quality: receivables consumed $1,857M and inventories $802M year-to-date, against $313M released from income taxes payable (p. 6). Management’s own year-to-date reconciliation shows free cash flow (its definition, adding back $71M of PP&E sales) of $1,170M versus negative $342M a year ago, attributed to “favorable operating profit performance and favorable working capital comparisons” (pp. 71, 73); the improvement is real, but at 50.5% conversion in the seasonally strongest half-quarter, the FY-level cash-coverage constraint identified in the separate valuation has not eased.
7.4 Footnote Review
sources Page references are the PDF page numbers of the Form 10-Q as filed (the filing’s own printed page numbers run 25 lower from the notes onward). Every note in the filing is addressed below, in order.
Note 1 — Basis of Presentation and Our Segments (10-Q pp. 11, 13–15, 17) Confirms the six-segment “One PepsiCo” structure (PFNA, PBNA, IB Franchise, EMEA, LatAm Foods, Asia Pacific Foods) and the reporting calendar: North America on a 12-week basis, all international operations on a monthly calendar basis capturing March, April and May for this quarter (p. 11). It also states that “certain reclassifications were made to the prior year’s financial statements to conform to the current year presentation” (p. 11) without quantifying them — a comparability caveat the reader should carry. The segment tables (pp. 13–15) are where the analytical content sits, and footnote (d) on p. 15 explicitly quantifies the prior-year charge: “$1,860 million ($1,447 million after-tax or $1.05 per share), of which $1,780 million is related to the impairment of the Rockstar brand in our PBNA and EMEA segments. The remaining $80 million is related to the impairment of the Be & Cheery brand in our Asia Pacific Foods segment.” Changed vs. Q2 2025: yes, materially — this line is $0 in the current quarter. Corporate unallocated expenses rose to $503M from $411M (+22.4%), a genuine cost increase that partly offsets divisional gains. Revenue mix is disclosed at 44% beverages / 56% convenient foods (43% / 57% a year ago), with beverages from company-owned bottlers at 36% of consolidated revenue in both periods (p. 15) — the low-margin bottling share is not shrinking.
Note 2 — Recently Issued Accounting Pronouncements (10-Q pp. 17, 19) One standard adopted in Q1 2026 (a practical expedient for estimating expected credit losses on current receivables), which “did not have a material impact” (p. 17). Two not yet adopted: internal-use software capitalisation (effective Q1 2028), and the FASB’s expense-disaggregation standard requiring tabular disclosure of inventory purchases, employee compensation, depreciation and intangible amortisation within each income-statement caption (2027 annual, Q1 2028 interim) (p. 19). Changed vs. Q2 2025: yes, new content. Analytical significance: the disaggregation standard will, from 2027, force disclosure of exactly the cost-line detail PepsiCo currently does not provide — useful for a future gross-margin bridge, immaterial now.
Note 3 — Restructuring and Impairment Charges (10-Q pp. 19, 21) The 2019 Productivity Plan, extended in 2024 through 2030, with total expected pre-tax charges of approximately $6.15 billion including ~$5.1 billion of cash. Charges this quarter were $49M vs. $213M in Q2 2025 (24 weeks: $182M vs. $426M); after tax $39M vs. $160M, or $(0.03) vs. $(0.12) per share (p. 19). Plan-to-date charges through 13 June 2026 are $3,792M, of which $3.0 billion cash (pp. 21, 69). The restructuring liability fell to $196M from $326M at the year-end on $264M of cash payments (p. 21). Changed vs. [Rating and price target withdrawn — see the note at the top.] The step-down is a real tailwind to reported profit (management names “lower restructuring charges” as a driver, p. 51), but an eleven-year “productivity plan” with $2.4 billion of charges still to come is the recurring-exclusion problem Section 3 flagged — these charges are a cost of doing business, not a one-off, and the majority of the remainder is expected through 2027.
Note 4 — Intangible Assets (10-Q p. 23) Amortisable intangibles net $1,187M (from $1,219M at year-end); goodwill $19,093M (from $18,916M); other indefinite-lived intangibles $13,990M; goodwill plus indefinite-lived intangibles together $33,083M vs. $32,763M (goodwill is not itself an indefinite-lived intangible; the two are combined here because both sit outside the amortisation charge and both are tested annually). The increases are attributed to currency (Russian ruble, South African rand) and to “acquired distribution rights for the Alani Nu brand.” The note then restates the prior-year event in full: the Q2 2025 quantitative assessment found carrying value above fair value on Level 3 discounted-cash-flow inputs “as well as an increase in the weighted-average cost of capital,” producing the $1.9 billion pre-tax charge. Changed vs. Q2 2025: yes — no impairment was recorded this quarter. Analytical significance: this is the single most important forward-looking sentence in the filing — “We continuously monitor the performance of all our indefinite-lived intangible assets and will perform our annual impairment assessment during our third quarter.” the separate valuation’s live SodaStream trigger and the RED forensic flag on acquired-brand value are neither resolved nor refuted by this quarter; they are simply deferred to Q3 2026. $33.1 billion of indefinite-lived intangibles plus goodwill still exceeds total PepsiCo shareholders’ equity of $22,098M by a wide margin.
Note 5 — Share-Based Compensation (10-Q pp. 23, 25) Total share-based compensation expense $71M vs. $46M (+54.3%); 24 weeks $167M vs. $126M. From 2026, RSUs and options vest ratably over three years, and senior executives previously granted 66% PSUs / 34% long-term cash now receive 60% PSUs / 40% RSUs. Grants in the 24 weeks: 0.9M options at a $169.25 weighted-average grant price (1.4M at $153.75 a year ago) and 2.4M RSUs/PSUs at $169.25 (2.1M at $153.71). Changed vs. Q2 2025: yes — both the mix of awards and the expense level. Analytical significance: a $25M quarterly increase is immaterial to a $4,023M operating profit, but the shift from cash to equity awards mildly increases future dilution, and note that options were granted at $169.25 while the stock was repurchased in the quarter at an average of $150.52 (p. 76).
Note 6 — Pension and Retiree Medical Benefits (10-Q p. 26) Total other pension and retiree medical benefits income of $59M vs. $42M (U.S. pension component $52M vs. $33M), with U.S. service cost falling to $54M from $73M. Discretionary contributions in the 24 weeks were $200M to U.S. qualified plans (vs. $250M) and $52M to international plans (vs. $29M). Changed vs. [Rating and price target withdrawn — see the note at the top.] The note’s warning that “lump sum payments may result in settlement charges in future periods” is unchanged in substance and matches the recurring settlement charges Section 3 flagged.
Note 7 — Debt Obligations (10-Q p. 27) In the 24 weeks PepsiCo issued €2.5 billion of notes — €500M floating due 2028, €650M at 3.300% due 2034, €850M at 3.700% due 2038, €500M at 4.150% due 2047 — designated as net investment hedges; $1.6 billion of USD and €0.5 billion of EUR senior notes matured and were repaid. $6.1 billion of commercial paper was outstanding at 13 June 2026. Two new credit agreements were signed in the quarter: a $5.0 billion five-year facility expiring 22 May 2031 and a $5.0 billion 364-day facility expiring 21 May 2027, each expandable to $5.75 billion, both replacing the equivalent May 2025 facilities, and both entirely undrawn at quarter end. Changed vs. Q2 2025: yes — new issuance, new facilities. Analytical significance: no financial covenant, and no covenant ratio, is disclosed anywhere in this filing — the facilities are described only as “subject to customary terms and conditions” (p. 27). Liquidity is unambiguously strong ($10.0 billion of undrawn committed facilities against $6.1 billion of commercial paper), but a reader should not infer a covenant headroom figure that the company has not published. [Rating and price target withdrawn — see the note at the top.]
Note 8 — Financial Instruments (10-Q pp. 27, 29, 31–34) [Rating and price target withdrawn — see the note at the top.] Derivatives in a net liability position with credit-risk contingent features totalled $53M, with no collateral posted and no triggers hit (p. 29). [Rating and price target withdrawn — see the note at the top.] Contingent consideration for the poppi acquisition fell to $117M, generating fair-value credits of $45M in the quarter and $161M year-to-date recorded in SG&A (p. 32). [Rating and price target withdrawn — see the note at the top.] Changed vs. Q2 2025: yes, on every material line. Analytical significance: two flags. [Rating and price target withdrawn — see the note at the top.] Second, the poppi earn-out being written down from $278M to $117M year-to-date is a plain statement that a $2.1 billion acquisition made in May 2025 is tracking below its performance milestones — yet the write-down increases reported operating profit by $45M this quarter and $161M year-to-date, and it lands inside PBNA’s segment result. Bad news presented as a profit credit is exactly the pattern that warrants adjustment.
Note 9 — Net Income Attributable to PepsiCo per Common Share (10-Q p. 35) Basic and diluted EPS both $2.18 (vs. $0.92); weighted-average basic shares 1,366M vs. 1,371M and diluted 1,369M vs. 1,373M; dilutive securities added 3M shares vs. 2M. Antidilutive securities excluded were 9M in both periods. Changed vs. Q2 2025: only marginally — the share count is 0.3% lower. Analytical significance: buybacks contributed roughly 0.3 pp of the EPS growth; essentially all of the increase is earnings, and essentially all of that is the absent impairment.
Note 10 — Accumulated Other Comprehensive Loss (10-Q pp. 36, 38) AOCI improved to $(14,343)M from $(15,024)M at year-end, but was flat within the quarter ($(14,342)M at 21 March 2026). The composition explains why: a $145M currency-translation gain and $41M of cash-flow-hedge gains were almost exactly offset by a $(285)M available-for-sale swing — the Celsius mark. Cumulative currency translation adjustment remains $(12,620)M. The company expects to reclassify net gains of $215M from cash-flow hedges into net income over the next 12 months (p. 33). Changed vs. Q2 2025: yes — the prior-year quarter posted $988M of other comprehensive income versus $(1)M this quarter. Analytical significance: comprehensive income of $3,003M is now essentially equal to net income of $3,004M, whereas a year ago OCI added $988M. The FX tailwind that has been rebuilding book equity has stopped, and $215M of hedge gains already banked in AOCI will support the next four quarters’ cost lines.
Note 11 — Acquisitions and Divestitures (10-Q pp. 39–40) Purchase price allocations for Siete ($1,246M total, PFNA, closed 17 January 2025) and poppi ($2,120M total — $1.9bn cash plus $0.2bn contingent consideration, PBNA, closed 19 May 2025) were finalised in Q1 and Q2 2026 respectively. poppi’s allocation is $1,700M to an indefinite-lived brand, $150M amortisable intangible, $114M inventories and $185M goodwill; Siete’s is $470M brand and $630M goodwill. Acquisition and divestiture-related items were a net credit of $(45)M this quarter vs. a $62M charge a year ago (24 weeks: $(158)M credit vs. $87M charge), worth $0.03 per share this quarter (p. 40). Changed vs. Q2 2025: yes — the line flipped from charge to credit. Analytical significance: $1,700M of poppi’s purchase price sits in an indefinite-lived brand that is never amortised and is tested annually — in Q3. A business whose earn-out has just been marked down 58% year-to-date is carrying a $1.7 billion brand asset into that test. This is the clearest new impairment-risk item created since the FY2025 forensic review.
Note 12 — Supply Chain Financing Arrangements (10-Q p. 40) Accounts payable owed to suppliers participating in the voluntary supply-chain-finance programme were $1.8 billion at 13 June 2026 vs. $1.7 billion at 27 December 2025. Terms are unchanged and described by reference to Note 14 of the 2025 Form 10-K. Changed vs. year-end: yes, up ~$0.1 billion. Analytical significance: Section 3 flagged the growing reverse-factoring balance as a support to reported operating cash flow. It grew again, modestly. At ~7% of the $24,504M accounts-payable balance it is not yet a distortion of the scale that would change the cash-flow read, but the direction is the wrong one and it should be re-checked each quarter.
Note 13 — Legal Contingencies (10-Q p. 40) One paragraph: the company is party to a variety of litigation, claims and regulatory proceedings, and “management believes that the final outcome of the foregoing is not expected to have a material adverse effect.” No amount is quantified and no accrual is disclosed. Confirmed substantively unchanged vs. Q2 2025 in wording and in the absence of any quantification (p. 40). The specifics appear in Part II Item 1 and are treated below.
Related-party transactions (10-Q pp. 8, 10, 39) PepsiCo has no controlling shareholder and this Form 10-Q contains no related-party transactions note — a fact confirmed by reading every note in the filing, not assumed. This is consistent with the FY2025 forensic review, which recorded governance/related-party exposure as low. The related-interest items the filing does disclose, with amounts, are: - Investments in noncontrolled affiliates (equity-method bottling and joint-venture interests): $2,180M at 13 June 2026 vs. $2,038M at 27 December 2025, an increase of $142M (balance sheet, p. 8). No income-statement amount is separately disclosed for these affiliates in this filing. - Noncontrolling interests: carrying value $172M at quarter end vs. $141M a year earlier (p. 10). Net income attributable to noncontrolling interests was $23M in Q2 2026 vs. $16M in Q2 2025 (+43.8%; 24 weeks $34M vs. $25M) (p. 4, p. 10). - Distributions to noncontrolling interests: $(14)M in Q2 2026, identical to $(14)M in Q2 2025 (24 weeks $(15)M vs. $(15)M) (p. 10). - Executive-officer transactions: none. Item 5 confirms that during the 12 weeks ended 13 June 2026 no director or executive officer adopted, modified or terminated a Rule 10b5-1 or non-Rule 10b5-1 trading arrangement (p. 78). Terms: unchanged. Nothing in this quarter’s filing indicates any new related-party arrangement or any change in the terms of an existing one. The amounts involved are immaterial against a $112,189M balance sheet, and the absence of a controlling-shareholder relationship remains a genuine governance positive for this issuer.
Contingencies and litigation (10-Q pp. 40, 76) - Baltimore Matter — filed 20 June 2024 by the Mayor and City Council of Baltimore against PepsiCo, Inc., Frito-Lay, Inc., Frito-Lay North America, Inc. and other unrelated parties. On 21 July 2025 the Circuit Court for Baltimore City dismissed with prejudice all claims except public nuisance; oral argument on the surviving public-nuisance claim is scheduled during the fiscal quarter ending 5 September 2026 (p. 76). Changed vs. prior quarter: yes — the hearing date is newly scheduled. No amount at stake is disclosed; management’s assessment is that no material adverse effect is expected. - NYS Matter, Los Angeles Matter, USVI Matter — carried forward by reference to the 2025 Form 10-K; no development, no amount, and no change in assessment is reported this quarter (p. 76). - General litigation — Note 13 (p. 40) and Item 1 (p. 76) both state management expects no material adverse effect. No accrual, range of reasonably possible loss, or amount at stake is quantified anywhere in the filing. - Risk factors — “There have been no material changes with respect to the risk factors disclosed in our 2025 Form 10-K” (p. 76). Confirmed by reading Item 1A in this filing. Analytical significance: the plastics/public-nuisance litigation is the only matter with a dated forward event, and it lands in Q3 2026. It is unquantified, so it cannot be modelled; it should be monitored, not provisioned.
Subsequent events (10-Q pp. 2, 29) This filing contains no separate subsequent-events note. Three post-quarter facts are nonetheless disclosed and are recorded here for completeness: 1. [Rating and price target withdrawn — see the note at the top.] 2. Share count: common stock outstanding as of 2 July 2026 was 1,364,891,558 shares (cover page, p. 2), 1.1M below the 1,366M at quarter end — buyback activity continued into Q3. 3. Review report date: KPMG’s interim review report is dated 8 July 2026 and contains no material modifications (p. 74). No acquisition, divestiture, financing, impairment or guidance event is disclosed after the quarter end.
Additional disclosure outside the notes — internal control over financial reporting (10-Q p. 75) Item 4 states that during the 12 weeks ended 13 June 2026 the continued ERP migration produced “changes that materially affected our internal control over financial reporting,” while asserting no adverse effect. Changed vs. Q2 2025: this is an explicit affirmative statement of material change, not a boilerplate negative. Analytical significance: disclosure controls are concluded effective and KPMG’s review is clean, so this is a watch item rather than a finding — but a multi-year ERP cutover running concurrently with a new CFO (appointed November 2025) and a new North America CEO is precisely the combination under which control lapses historically surface.
Tariffs (10-Q p. 47) During the 24 weeks the U.S. Supreme Court ruled that many tariffs previously imposed under the IEEPA were invalid; PepsiCo has submitted and expects to continue submitting recovery claims to U.S. Customs and Border Protection and “has begun to receive” refunds, but “the ultimate recoverability, timing and amount of any such refunds remain uncertain.” No amount is quantified. Analytical significance: an unquantified, non-modellable potential recovery against a cost line that has been a named margin headwind — upside optionality that cannot be sized from this filing.
7.5 What Changed This Quarter
sources - The prior-year impairment washed out of the comparative, and it accounts for essentially all of the reported profit growth. Reported EBIT +124.9% and EPS +137.0% collapse to +10.3% and +10.7% ex-impairment, and to +4.0% and +3.8% on the company’s core basis (+1% each in constant currency). [Rating and price target withdrawn — see the note at the top.] - PFNA — the segment Section 1 identified as the profit engine — got worse, not better. Revenue -1.7% on unfavourable net pricing, unit volume merely even, reported operating profit -3.5% and core operating profit -8% (10-Q pp. 13, 55, 57). the separate valuation’s upgrade trigger #1 (North American volume returning to growth) is not met; PBNA unit volume fell 4%. [Rating and price target withdrawn — see the note at the top.] A $2,120M acquisition closed in May 2025 is missing its milestones, and the miss is being reported as a profit credit inside PBNA. The $1,700M indefinite-lived poppi brand faces its first annual impairment test in Q3 2026. [Rating and price target withdrawn — see the note at the top.] It runs through OCI, not EPS — invisible in the headline, real in book value. [Rating and price target withdrawn — see the note at the top.] - Buybacks restarted, but shareholder returns still exceed free cash flow. A new $10 billion authorisation runs to February 2030 with $9,518M remaining; 1.9M shares were repurchased in the quarter at an average $150.52 ($289M), and the annualised dividend was raised 4% to $5.92 from $5.69 (pp. 71, 76, 10). Against $1,505M of quarterly free cash flow, dividends of $1,948M plus buybacks of $289M equal 148.6% of FCF — funded by short-term debt, which is why net debt rose $710M sequentially to $42,963M despite a positive cash-flow quarter. - Leverage is 2.39× LTM EBITDA on a window that already excludes the impairment quarter, with $10.0 billion of newly renewed, entirely undrawn committed facilities and no disclosed financial covenant (pp. 8, 27). Balance-sheet risk is low; the constraint is cash allocation, not solvency. - The impairment question is deferred, not answered. No write-down this quarter, $33,083M of indefinite-lived intangibles plus goodwill on a $22,098M equity base, and the annual test falls in Q3 2026 (p. 23). The RED forensic flags on SodaStream and acquired-brand value survive this quarter intact and untested. - Internal control over financial reporting was materially changed by the ERP migration during the quarter (p. 75) — disclosed affirmatively, asserted non-adverse, and worth carrying as a watch item alongside the recent CFO and North America CEO changes.
7.6 Portfolio Decision
sources [Rating and price target withdrawn — see the note at the top.] This quarter is the clearest possible confirmation of the thesis rather than a challenge to it. Strip the $1,860M prior-year impairment out of the base and the group grew underlying EBIT +10.3%, and strip out restructuring, acquisition credits and mark-to-market as well and core operating profit grew +4.0% — +1% in constant currency — on organic revenue growth of just +2%. [Rating and price target withdrawn — see the note at the top.] Nor does the cash case improve: FCF conversion of 50.5% left $1,505M of free cash flow against $1,948M of dividends and $289M of buybacks, or 148.6% of FCF returned, with net debt up $710M sequentially to $42,963M — the same dividend-coverage constraint the separate valuation flagged, unchanged. The footnote review adds two items that argue against upgrading and one that argues against downgrading: the poppi contingent consideration written down to $117M from $278M year-to-date (a missed-milestone acquisition whose $1,700M brand meets its first impairment test in Q3 2026) and the $289M quarterly Celsius mark-down are new evidence for the acquired-brand-value RED flag; against that, liquidity is unambiguously solid — $10.0 billion of undrawn renewed facilities, debt trading at $49 billion against $53,214M carrying, and leverage of 2.39×. [Rating and price target withdrawn — see the note at the top.]
What would change this view: - Upgrade condition: PFNA core operating profit returning to growth and North American organic volume (PFNA plus PBNA) positive for two consecutive quarters — against this quarter’s PFNA core -8% and PBNA unit volume -4% — accompanied by group free cash flow covering the dividend in full (FCF above $1,948M per quarter at the current payout). [Rating and price target withdrawn — see the note at the top.] - Downgrade condition: Any indefinite-lived intangible or goodwill write-down at the Q3 2026 annual impairment assessment (10-Q p. 23) — SodaStream inside IB Franchise or the $1,700M poppi brand inside PBNA are the two live candidates — or a second consecutive quarter of shareholder returns above 140% of free cash flow with net debt rising and leverage moving above 2.5× LTM EBITDA. [Rating and price target withdrawn — see the note at the top.]
Report Versions
Every published version of this report, newest first — each one kept so a reader can see what changed and when.
| Version date | Files |
|---|---|
| 2026-08-19 Current | Model (Excel) |
| 2026-08-10-2 | Model (Excel) |
| 2026-08-10 | Model (Excel) |
| 2026-08-06 | Model (Excel) |