
Novo Nordisk A/S
Section 1 — Business Overview, Operations & Competitive Positioning
1.1 The Business
sources Novo Nordisk is one half of a global duopoly in metabolic medicine: it discovers, manufactures and sells peptide-based therapies for diabetes and obesity, and monetises them through the price and volume of a single dominant molecule — semaglutide — sold under the Ozempic, Wegovy and Rybelsus brands. In economic terms the business is a scale-advantaged, patent-protected specialty-pharma franchise whose returns are driven by three variables: the number of patients on GLP-1 therapy, the net price realised after very large US rebates, and the company’s ability to physically manufacture enough drug substance and fill-finish capacity to meet demand.
Founded in Denmark more than a century ago and still headquartered there, the company generated revenue of $46,820.3M in FY2025, up from $16,623.9M a decade earlier — a base that was essentially flat through the late 2010s before the GLP-1 franchise drove it from $22,398.5M in FY2021 to $33,717.6M in FY2023 and $46,820.3M in FY2025. That trajectory is the single most important fact about the business: it is not a diversified pharmaceutical company that happens to sell GLP-1s, it is a GLP-1 company with a legacy insulin and rare-disease tail. The shares trade on Nasdaq Copenhagen (NOVO B) and as an ADR on the NYSE under NVO; the workforce is global and manufacturing-heavy, and was cut sharply during the year in the largest workforce reduction in the company’s history as management moved to bring a cost base built for hyper-growth back into line with a slowing top line.
[Rating and price target withdrawn — see the note at the top.]
One framing point belongs at the outset, because it colours every figure that follows. FY2025 is the high-water mark of the reported revenue series, and the headline growth the market will see in FY2026 is largely an accounting artefact rather than a trading result. A favourable administrative ruling on the US 340B drug-pricing dispute became final just after the balance-sheet date; management treated it as a non-adjusting subsequent event, kept the full 340B rebate provision on the FY2025 balance sheet, and will release the entire amount into revenue in the first quarter of FY2026. That release is a one-off, non-cash boost to reported sales, gross profit and net profit that does not reflect underlying demand — and management’s own forward guidance is for a rare sales decline, presented for the first time on new adjusted, non-IFRS measures that strip the release out. A reader who anchors on reported FY2026 growth will badly misjudge the business; the underlying franchise is transitioning from hyper-growth to flat-to-declining even as the reported line jumps.
Key Information
| Item | Value |
|---|---|
| Ticker | NVO |
| Sector / Industry | Health Care / Pharmaceuticals |
| Report Date | 2026-08-18 |
| Most Recent FY Revenue | $46,820.3M |
| EBIT Margin (Most Recent FY) | 41.3% |
| Diluted Weighted-Average Shares | 4,448M |
| Current Price | DKK 294.70 |
Source: Company annual reports (SEC 20-F / 6-K filings); see Appendix A.1.
1.2 Operating Segments
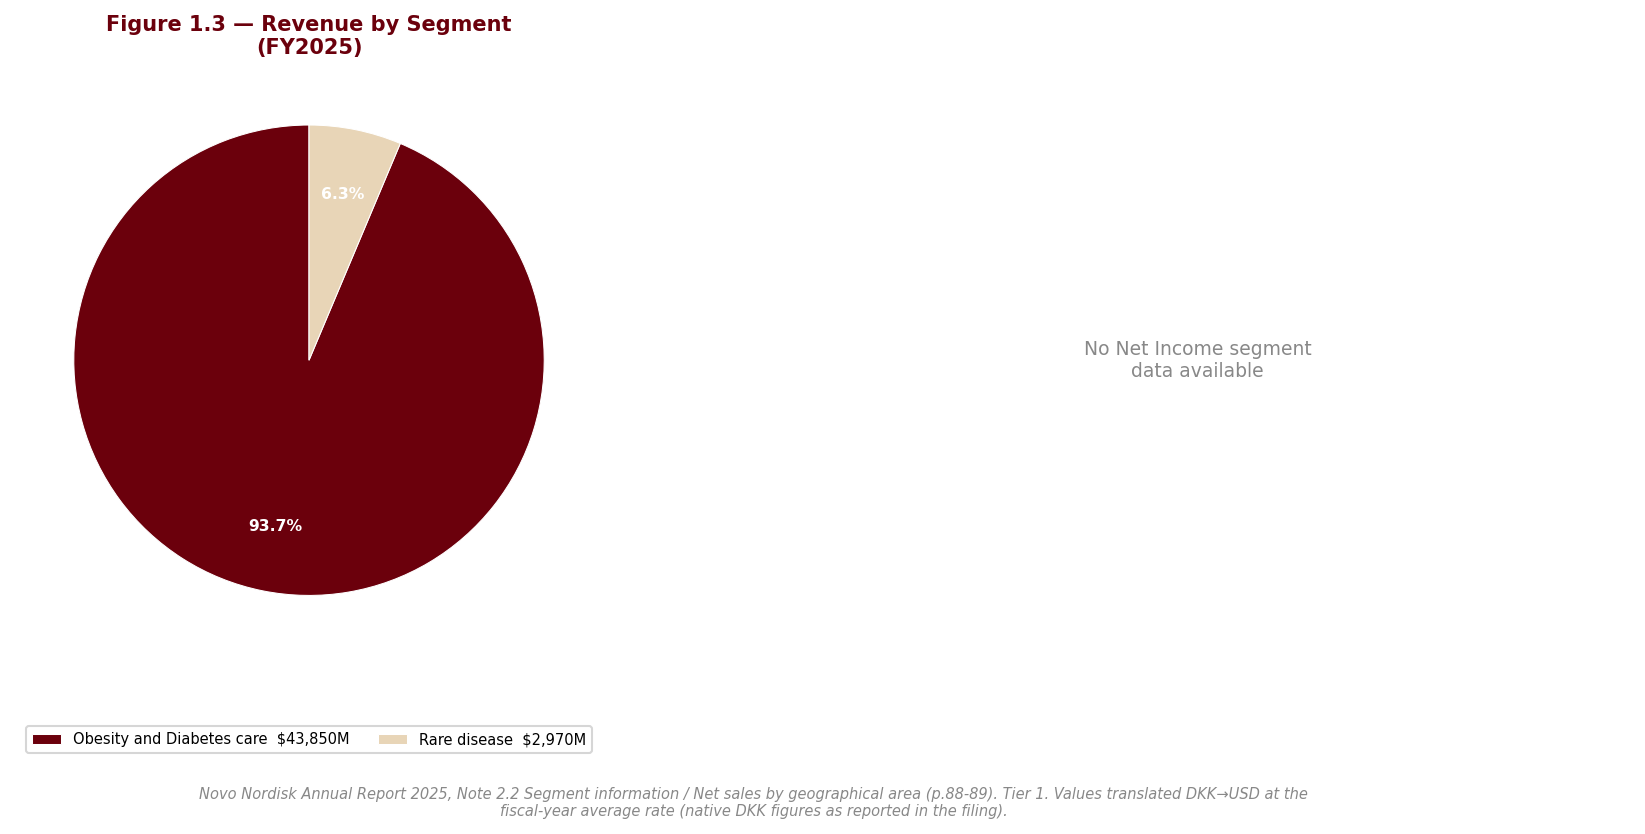
sources Novo Nordisk reports through two therapy-based operating segments that together comprise the entire group, with performance measured on operating profit and no inter-segment transactions.
Obesity and Diabetes care is the business. It spans obesity, diabetes, cardiovascular and emerging therapy areas, and is anchored by Wegovy in obesity and Ozempic and Rybelsus in diabetes, sitting on top of a broad legacy insulin portfolio. This segment represents the overwhelming majority of group sales and effectively all of its growth. The one economic variable that drives it is GLP-1 economics — the interaction of semaglutide prescription volume and the net US price realised after rebates. On the volume side management reports strong obesity growth, with Wegovy roughly doubling its country footprint during the year and gaining a US label extension into metabolic liver disease, while remaining the branded-volume leader in obesity; on the diabetes side global value market share slipped even as GLP-1 diabetes sales grew, as Ozempic strength offset structural decline in older products such as Victoza. The critical nuance is that reported diabetes was broadly flat and the segment’s momentum is now almost entirely an obesity story.
Rare disease covers rare blood disorders, rare endocrine disorders and hormone-replacement therapy — brands such as NovoSeven, Sogroya and Alhemo — with a late-stage pipeline including denecimig and etavopivat. It is a small, higher-margin, slower-moving portfolio that management positions for steady growth and, importantly, as strategic ballast: it is the one part of the company not exposed to the GLP-1 competitive war. Its economic driver is the durability of a handful of specialist franchises rather than a single blockbuster molecule.
The way the segments fit together is best understood as a flywheel with a single point of failure. Semaglutide is the active ingredient behind multiple brands across both obesity and diabetes, in injectable and oral form, and management characterises it as the only molecule demonstrating cardiovascular protection in both diseases — a genuine scientific asset that lets one manufacturing and clinical platform serve several large markets at once. That concentration is the source of the company’s extraordinary margins and its manufacturing leverage. It is also its central fragility: the same molecule dependency that powers the flywheel means a competitive, pricing or safety shock to semaglutide hits the great majority of revenue simultaneously, and management explicitly discloses this portfolio dependency as a key risk. Rare disease provides some diversification, but it is far too small to offset a semaglutide event.
1.3 Geographic Exposure
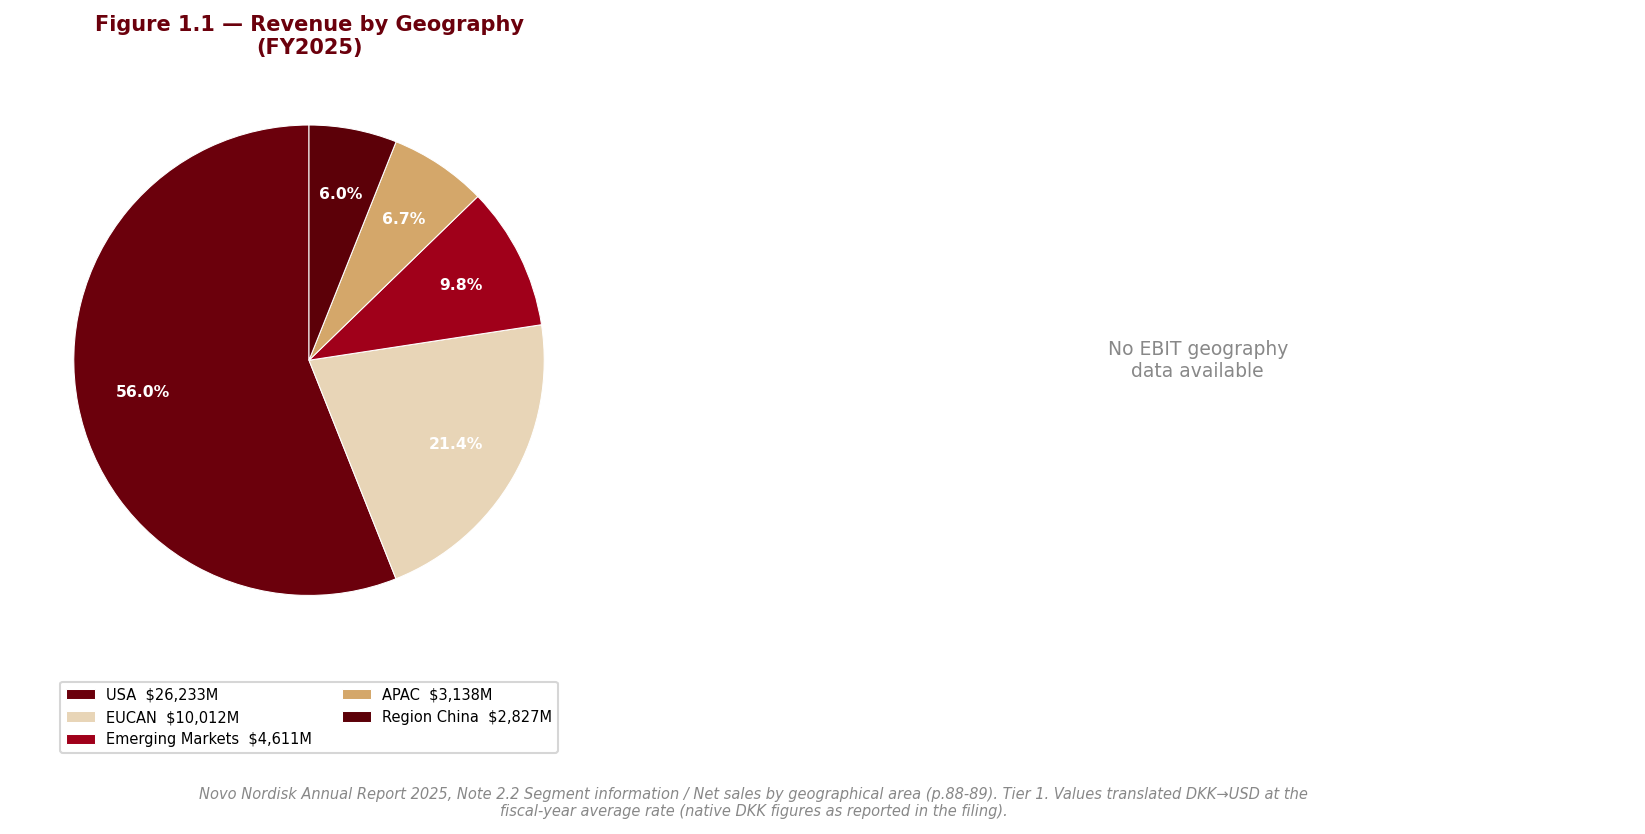
sources Novo Nordisk reports along a US Operations / International Operations split (reorganised during the year from a prior North America / International structure, with comparatives restated). The United States is the company’s single largest market by a wide margin — a majority of group revenue — which makes the business unusually exposed to a single national pricing system. That concentration cuts both ways: the US is where obesity demand and net pricing have been most favourable, but it is also where the gross-to-net rebate machine is most punishing, where compounded semaglutide has eroded authorised volumes, and where the Most Favoured Nations pricing framework and reduced Medicaid obesity coverage now threaten realised prices. Management explicitly guides US Operations to decline in the year ahead. International Operations, by contrast, is guided to grow on continued GLP-1 penetration and further Wegovy roll-outs, though tempered by competition and the loss of exclusivity of semaglutide in certain markets.
Currency exposure follows the geography: the group’s principal transactional and translational exposures are to the US dollar, the Chinese renminbi and the Japanese yen, hedged only for commercial exposures and only on a rolling near-term basis. Because the company earns in dollars and reports in kroner, reported growth in a strong-krone year understates constant-currency performance — management notes that FY2025 constant-currency growth was materially above the reported figure. The detailed pricing, tariff and reimbursement risks attached to the US concentration are developed in Section 2.
1.4 Management Team
sources Leadership is the area where the investment case carries the most idiosyncratic uncertainty right now, and it deserves to be read as a risk as much as a strength. This is the first annual report under President and CEO Maziar Mike Doustdar, who succeeded Lars Fruergaard Jørgensen mid-year after previously running International Operations. His agenda is explicitly a course-correction: a more focused organisation, “sustainable” rather than headline growth, the largest workforce reduction in the company’s history, a merger of the research and development functions, and a strategic retreat from standalone new-therapy-area expansion back onto the obesity and diabetes core. Administration costs during the year absorbed severance tied to the executive changes — a small but telling marker of how abrupt the transition was.
The anchor, for better and worse, is not the management team but the ownership structure behind it. Novo Nordisk is controlled by the Novo Nordisk Foundation through Novo Holdings, which holds unlisted, non-divestible super-voting A shares giving it the majority of votes on a minority of the capital. That structure is designed to enable long-horizon strategy and has historically been a source of stability, but during FY2025 it became a source of open conflict: an Extraordinary General Meeting was convened to reconstitute the Board after the sitting Board and the Foundation disagreed over the pace and extent of board renewal, several directors stepped down, and following the meeting fewer than half of the shareholder-elected directors were considered independent. For a holder of the listed B shares or the ADR, the practical reality is that the new CEO arrives with a thin independent-board buffer and a controlling shareholder that has just demonstrated its willingness to force change directly. The bench question — whether a management team reshaped mid-crisis, under a new leader, can execute both a cost transformation and a competitive counter-attack simultaneously — is the key management risk, and its detailed governance dimension is developed in Sections 2 and 5.
1.5 Capital Allocation Track Record
| Year | Dividends Paid ($M) | Share Repurchases ($M) | CapEx ($M) |
|---|---|---|---|
| FY2021 | $3,422.9M | $3,093.6M | $1,007.8M |
| FY2022 | $3,582.5M | $3,410.2M | $1,719.7M |
| FY2023 | $4,611.6M | $4,344.1M | $3,746.3M |
| FY2024 | $6,403.0M | $2,927.5M | $6,841.6M |
| FY2025 | $7,841.6M | $210.3M | $9,110.7M |
Source: Company annual reports (SEC 20-F / 6-K filings); see Appendix A.1.
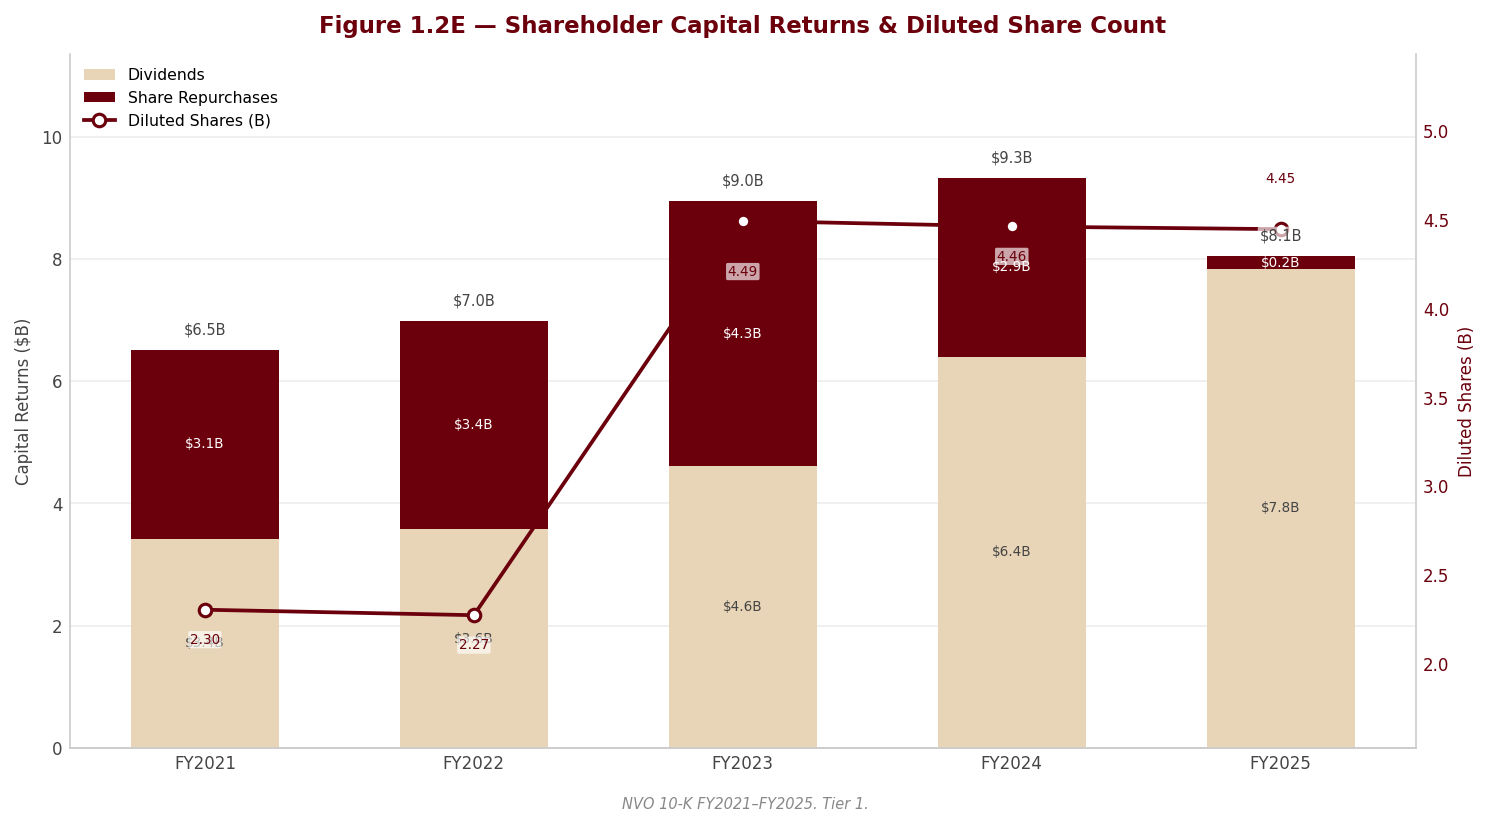
Capital allocation over the past five years tells the story of a company that stopped returning cash and started building factories. The clear hierarchy management has revealed is: dividend first, capacity second, buybacks last. The dividend is treated as a policy commitment, benchmarked to a competitive pharmaceutical payout and split into an interim and a final distribution, with a total-shareholder-return yield of 3.7% and a payout ratio of 50.5% in FY2025. Share repurchases, by contrast, were cut sharply during the year, and the new programme announced for the year ahead comes with an explicit caveat that it may be reduced if business-development opportunities arise — an unusually candid statement that buybacks are the flexible, residual element behind the dividend and M&A.
The dominant use of capital, however, has been the capital-expenditure super-cycle. Capital expenditure has run well ahead of depreciation as the company races to secure active-ingredient, aseptic and fill-finish capacity for current and future injectable and oral products, with major expansions across Denmark, France, Brazil, China and the United States, and US sites run around the clock. This capex-to-D&A gap — outflows several times annual depreciation — is unambiguously growth investment rather than asset replacement, a bet that GLP-1 demand will absorb every unit the company can make. The capacity strategy also drove the largest single deployment of capital in recent history: the acquisition of former Catalent fill-finish sites, purchased from the Foundation-controlled Novo Holdings. That related-party dimension, and the concentration of the purchase price in judgement-heavy intangible and goodwill assets, is a material governance and earnings-quality issue examined in Sections 2 and 3. Two consequences of this allocation shift are worth flagging here: the group has moved from a net-cash to a net-debt position to fund it, and free cash flow converts poorly to earnings during the build, both of which are analysed in Section 3. Management guides capex to moderate in the year ahead and to decline thereafter as the supply-chain expansion matures — the credibility of that moderation is central to the cash-return outlook.
1.6 Competitive Positioning & Moat
sources §1.6.1 Industry structure. The obesity and diabetes GLP-1 market is, for now, a two-player structure dominated by Novo Nordisk and Eli Lilly, sitting on top of one of the largest addressable patient populations in medicine. Returns in this industry are driven by four things: molecule efficacy and breadth of proven indications, patent protection, manufacturing scale (because demand has chronically outrun global supply), and the ability to navigate payer and reimbursement systems — above all the US gross-to-net machine. Winners are the firms that can pair a differentiated, patent-protected molecule with enough physical capacity to convert demand into sales and enough commercial reach to defend net price. It is a high-margin, high-barrier industry, but one where the barriers are eroding as capacity catches up and as generic semaglutide approaches in certain markets.
§1.6.2 Competitive advantages. Novo Nordisk’s moat rests on evidence rather than assertion. First, molecule breadth and clinical depth: semaglutide is, on management’s account, the only GLP-1 molecule with demonstrated cardiovascular protection in both diabetes and obesity, with a widening body of evidence across cardiovascular, kidney and liver disease and real-world STEER data the company cites against Lilly’s tirzepatide — a genuine, if observationally limited, differentiator. Second, delivery-form leadership: the oral semaglutide tablet (the Wegovy pill) is the first and only oral GLP-1 approved for chronic weight management, produced domestically in North Carolina, giving the company a formulation and supply advantage no competitor yet matches. Third, manufacturing scale: the multi-country capacity build-out and the Catalent fill-finish acquisition directly attack the binding constraint of the industry, fill-finish capacity, and are a barrier competitors cannot replicate quickly. Fourth, portfolio breadth and distribution — a strategy of serving obesity the way it serves diabetes, with multiple price points, doses and mechanisms, backed by a century of metabolic-disease commercial infrastructure and, as institutional validation, the World Health Organization’s recognition of GLP-1 benefits.
§1.6.3 Competitive vulnerabilities. The moat is real but visibly narrowing, and management itself concedes it has lost the clear obesity leadership it once held. The first vulnerability is single-molecule concentration: with semaglutide behind the majority of revenue, the impending loss of exclusivity in certain markets is a direct threat, however much management reframes it as an “affordable foundation” opportunity. The second is competition: Lilly’s tirzepatide is taking share, and virtually every major pharmaceutical company is entering the field. The third is US market access — compounded semaglutide has eroded authorised volumes, and the Most Favoured Nations pricing framework, reduced Medicaid obesity coverage and the non-recurrence of favourable gross-to-net adjustments together point to falling US realised prices. The fourth is pipeline binary risk: the strategy leans heavily on next-generation assets (CagriSema, the higher-dose and oral formulations, zenagamtide), and the year’s clinical setbacks — including the termination of the large Alzheimer’s programme — are a reminder that the growth refill is not guaranteed. These pressures are why reported revenue growth has decelerated hard from the FY2021–FY2023 surge and why management guides to an outright sales decline, with the FY2026 reported line further distorted by the one-off 340B revenue release described in Section 1.1.
§1.6.4 Verdict. Novo Nordisk retains a wide but no longer widening moat. The combination of a differentiated, indication-rich molecule, a unique oral formulation and industry-leading capacity supports durably high margins for the medium term, and the duopoly structure is not about to become a commodity market. But the direction of travel is unmistakably toward a more competitive, more price-pressured obesity market in which Novo Nordisk defends a strong position rather than dictates terms. Long-run margin durability therefore hinges less on the current franchise than on two things the company does not yet control: whether the next-generation pipeline can replace semaglutide’s exclusivity before generics and Lilly compress it, and whether US net pricing settles at a level that preserves the franchise’s exceptional profitability. The refocus onto the core is a rational, defensive response to exactly this — a company consolidating around its strongest ground rather than expanding from a position of strength.
Section 2 — Key Risks & Catalysts
2.1 Downside Risks
sources The risk profile at Novo Nordisk is unusual for a company of its quality: the dominant threats are not operational execution or balance-sheet fragility but a concentration of governance, pricing and disclosure-quality issues that sit above an otherwise best-in-class franchise. Three forces define the downside. First, the company is controlled by its founding foundation through a dual-class structure, and in the reporting year it transacted a very large asset purchase directly with that controlling shareholder. Second, the US pricing model — the source of most of the group’s profit — is being reset simultaneously by a Most Favoured Nations framework, Medicaid coverage cuts and the non-recurrence of favourable gross-to-net adjustments, so that reported growth and underlying demand have visibly diverged. Third, and most subtly, the way the business measures its own earnings is drifting away from statutory results in ways that consistently flatter the picture. Each of these is specific to Novo Nordisk today, and several of them compound one another.
Risk 1 — Foundation control and a related-party acquisition from the controlling shareholder (RED)
sources This is the central governance risk, and it has two layers. The structural layer is the dual-class ownership: the founding foundation, through its holding company, controls a large majority of the votes while owning only a minority of the economic capital, held through unlisted super-voting shares that under the foundation’s own articles cannot be sold. Minority holders of the listed B shares and ADRs therefore cannot outvote the controlling holder on any matter, and the year demonstrated that this is not a dormant risk: an Extraordinary General Meeting was required to reconstitute the Board after the company’s directors and the foundation disagreed over the pace of board renewal, several sitting directors stepped down, and following the meeting fewer than half of the shareholder-elected directors were considered independent.
The concrete layer — and the reason this rises to a RED flag — is the fill-finish manufacturing acquisition (the former Catalent sites). Novo Nordisk bought those assets from the controlling shareholder, which had itself just acquired the target, in a transaction whose price was overwhelmingly allocated to soft, judgement-heavy assets: internally valued “know-how” measured with unobservable inputs, plus goodwill. The filing discloses closing-mechanism true-ups still owed to the same controlling shareholder that will be booked through profit or loss outside the normal measurement window, and it discloses no independent fairness opinion on the price paid. The plain-language concern is this: when a company buys assets from the shareholder who controls its votes, and most of the purchase price sits in intangibles whose fair value only the parties can observe, value can be shifted from the minority to the controlling holder without any single line being demonstrably wrong. Minority holders now carry the amortisation and impairment risk of a price they had no ability to set or reject. Management’s assertions that group dealings are conducted on arm’s-length terms are not independently evidenced in the notes, and the network of smaller service, dividend and joint-taxation arrangements with other entities in the controlling group is growing.
[Rating and price target withdrawn — see the note at the top.] The tail risk is a future impairment of the related-party intangibles, which would fall entirely on minority holders.
Risk 2 — A US pricing and market-access reset, with underlying demand masked by a one-off revenue release (RED)
sources The United States generates the majority of group profit, and its pricing model is being reset on several fronts at once: a Most Favoured Nations framework agreed with the US Administration to lower semaglutide prices across Medicare, Medicaid and direct-to-patient channels (still being finalised); reduced Medicaid coverage of obesity medicines; the expiry of the grace periods that had permitted large-scale compounding of semaglutide; and, critically, the non-recurrence of the favourable gross-to-net adjustments that flattered US revenue in the reporting year. [Rating and price target withdrawn — see the note at the top.] Management’s own guidance is for US Operations to decline and for the group to post a rare sales decline in the year ahead.
This risk is a RED flag because a large accounting event obscures how bad the underlying trajectory already is. The company held a very large 340B statutory-discount provision on its year-end balance sheet, treated a favourable post-year-end ruling as a non-adjusting subsequent event, and then released the entire provision into first-quarter revenue of the following year. That release is a one-off, non-cash accounting event, yet it drives reported sales and net profit sharply higher precisely as the underlying business turns negative — the interim results already show reported growth diverging from a double-digit constant-currency decline in underlying US sales. Any read of the near-term trajectory that relies on reported figures without stripping the 340B release is materially misleading. What would confirm the risk is a continued fall in underlying (ex-340B) US sales once the accounting noise clears; what would dispel it is stabilising realised prices and a benign final MFN settlement. What could re-open it further is an appeal of the underlying 340B ruling, which the filing notes remains possible.
Probability: High | Timeframe: Immediate (already in guidance and interim results) | Impact: This is the primary driver of the modelled near-term revenue decline and of the margin normalisation in the valuation. The 340B release itself is excluded from the earnings base, so it flatters reported optics without adding to intrinsic value.
Risk 3 — Earnings and disclosure quality: recurring pipeline write-offs and an ever-more-favourable adjusted framework (RED)
sources Two related earnings-quality problems justify a RED flag. The first is a recurring pattern of large impairments on acquired and in-licensed pipeline assets. For a company that has increasingly built its pipeline by acquisition and licensing, these write-offs are not one-off accidents but a structural, recurring economic cost of the strategy — a business that repeatedly buys assets and repeatedly writes them off is paying a real, recurring price that “adjusted” earnings then strip out as though it were exceptional. The pattern has continued into the subsequent interim periods with a further large impairment and a late-stage trial failure, and it sits against a balance sheet that still carries very large single-asset intangibles, tested only annually, that represent concentrated binary clinical risk: a single trial miss on one of them could trigger a very large write-down, exactly as prior programme failures already have.
The second problem is the adjusted-earnings framework itself. Adjusted net profit runs meaningfully above statutory IFRS profit, principally by adding back all intangible amortisation and impairment — and because Novo Nordisk is a serial acquirer, that add-back is structurally rising, so adjusted EPS drifts progressively further above statutory EPS the more the company buys. From the coming year management introduces further adjusted measures that additionally exclude the 340B release (a positive item), any “major” legal charge and any “major” impairment (negative items), and that redefine free cash flow more favourably by deducting only property-plant-and-equipment spend. This gives management latitude to exclude precisely the items an analyst most needs to see, while reducing comparability with prior years. This report anchors on IFRS throughout and treats the widening IFRS-to-adjusted gap as a quality signal rather than accepting the adjusted bridge at face value.
Probability: High (both patterns are established and continuing) | Timeframe: Immediate and ongoing | Impact: Addressed in the valuation by anchoring on IFRS earnings, keeping amortisation and impairment inside NOPAT rather than adding them back, and treating the large single-asset intangibles as an impairment sensitivity to the asset base.
Risk 4 — Patent cliff, intensifying competition and clinical-pipeline dependence
sources Novo Nordisk’s economics rest overwhelmingly on a single molecule, semaglutide, which faces loss of exclusivity in the early 2030s. Because that cliff falls just beyond a standard explicit forecast horizon, it lands squarely in the terminal value — which is where most of the intrinsic value sits — making it the structural long-term risk to the equity even though it is years away. Management frames the loss of exclusivity as an opportunity, arguing that generic competition establishes an affordable base on which it can layer differentiated innovation (the oral formulation, higher-strength versions and novel mechanisms); that framing is plausible but self-serving, and the risk is that the next-generation portfolio does not replace the cash flows the flagship loses.
Compounding this is a competitive position that management itself concedes has weakened: the company has lost the clear obesity leadership it once held, tirzepatide is a formidable and growing competitor, and virtually every major pharmaceutical company is now entering the category. The pipeline that is meant to defend the franchise carries its own clinical risk — the company terminated a large Alzheimer’s programme after it failed to show benefit, and later-stage assets have failed elsewhere — so the very readouts that could be catalysts are equally capable of being negative surprises.
[Rating and price target withdrawn — see the note at the top.]
Risk 5 — A broad and executive-named US litigation stack (YELLOW watch item)
sources The company carries a wide docket of US litigation, each matter described in near-identical language as not expected to be material, against comparatively small provisions. Three strands warrant monitoring. The GLP-1 product-liability multi-district litigation, alleging gastrointestinal and other injuries, is the one matter that could in principle scale well beyond the current provision given the sheer volume of patients exposed, if causation were ever established. Two separate securities class actions — one concerning the CagriSema trial disclosures that accompanied the late-2024 share-price collapse, the other concerning claims about the compounding market — name current and former senior executives, and therefore carry governance and reputational weight independent of any monetary quantum. Tellingly, management’s own new adjusted framework simultaneously creates a bucket for “major legal matters,” implicitly conceding that legal charges of a size it currently calls immaterial are foreseeable. The uniform “not material” language paired with a shrinking provision is soft rather than reassuring.
Probability: Medium | Timeframe: 1–3 years | Impact: Currently provisioned at a level small relative to the docket; a move from “not material” to a quantified provision, particularly in the product-liability MDL, would be the trigger to reassess. Carried in the bear case.
2.2 Upside Catalysts
sources The balance here is honestly asymmetric: the risks clearly outnumber and outweigh the catalysts. [Rating and price target withdrawn — see the note at the top.] The catalysts below are presented on that understanding, and they are fewer than the risks by design, not for lack of effort to find them.
Catalyst 1 — Pipeline readouts and next-generation launches
sources The clearest source of positive surprise is the pipeline. The oral semaglutide tablet is a genuine first-of-its-kind launch with efficacy management characterises as on par with the injection; CagriSema has completed its pivotal trials and has been filed for first approval in obesity; a higher-dose semaglutide and the next-generation unimolecular agonist (amycretin/zenagamtide) are advancing. A clean approval and strong launch curve for any of these would demonstrate that the franchise can be defended and extended past the semaglutide cliff, which is precisely the question the terminal value hangs on. The same events are two-sided — a disappointing readout is a risk, as the pattern of pipeline failures shows — so they are catalysts only conditionally.
Probability: Medium | Timeframe: 1–2 years | Monitoring trigger: Regulatory decisions on CagriSema and the higher-dose formulation, oral-semaglutide launch uptake, and phase-3 readouts for the next-generation agonists.
Catalyst 2 — A benign final Most Favoured Nations settlement
The MFN framework is a pricing headwind, but its unfinished state is itself an overhang: the market cannot size the US price reset until the terms are fixed. [Rating and price target withdrawn — see the note at the top.] This is the clearest example of a catalyst that is really the removal of a risk.
Probability: Medium | Timeframe: 1–2 years | Monitoring trigger: Finalisation of the MFN terms and any accompanying Medicare obesity-coverage expansion; management commentary on realised US net prices.
Catalyst 3 — An inflection in the underlying US trajectory once the accounting noise clears
sources Because reported near-term results are inflated by the one-off 340B release while underlying US sales are falling, the single most informative signal over the coming quarters will be the underlying (ex-340B, constant-currency) US trajectory. Evidence that underlying US sales have stopped declining — stabilising realised prices, gross-to-net normalising, compounding volumes receding as enforcement bites, and the new commercial channels (direct-to-patient, telehealth and retail-pharmacy agreements) gaining traction — would be the operational confirmation that the trough has passed. Rising capacity utilisation as the manufacturing build matures would reinforce it.
[Rating and price target withdrawn — see the note at the top.]
Catalyst 4 — Capital-return normalisation and a discount-rate re-rating
sources Share repurchases were cut back sharply during the capital-expenditure super-cycle, with buybacks treated as the flexible, residual element of capital allocation behind the dividend and business development. As capex is guided to moderate and then decline, free cash flow should recover, allowing a resumption of a fuller repurchase programme — a visible signal that the balance sheet has absorbed the build-out. [Rating and price target withdrawn — see the note at the top.] If the stock re-establishes that lower-beta, defensive character as the pricing and governance overhangs clear, its intrinsic value would be materially higher than the base case — the same assumption that makes the stock look fairly valued today makes it cheap if the old regime returns. [Rating and price target withdrawn — see the note at the top.]
Probability: Low–Medium | Timeframe: 1–3 years | Monitoring trigger: Capex declining toward the guided trajectory, free-cash-flow recovery, a formally enlarged buyback authorisation, and a sustained fall in the stock’s realised beta.
2.3 Risk & Catalyst Summary
| # | Item | Type | Probability | Timeframe | Status | Monitoring Trigger |
|---|---|---|---|---|---|---|
| 1 | Foundation control & related-party Catalent acquisition | Risk | H | Immediate/ongoing | Active | Related-party true-ups; board independence; future intangible impairment |
| 2 | US pricing reset with 340B release masking underlying decline | Risk | H | Immediate | Active | [Rating and price target withdrawn — see the note at the top.] |
| 3 | Earnings/disclosure quality — recurring impairments & adjusted framework | Risk | H | Immediate/ongoing | Active | IFRS-vs-adjusted gap; single-asset intangible carrying values; new adjusted exclusions |
| 4 | Patent cliff, competition & clinical-pipeline dependence | Risk | M near / H long | 3–5 yrs+ | Monitoring | Semaglutide LOE timing; tirzepatide share; pipeline readouts |
| 5 | Executive-named US litigation stack | Risk | M | 1–3 yrs | Latent | Move from “not material” to a quantified provision; product-liability MDL |
| 6 | Pipeline readouts & next-gen launches | Catalyst | M | 1–2 yrs | Monitoring | CagriSema/oral-sema/amycretin decisions and launch uptake |
| 7 | Benign final MFN settlement | Catalyst | M | 1–2 yrs | Monitoring | Finalised MFN terms; Medicare obesity-coverage pilot |
| 8 | [Rating and price target withdrawn — see the note at the top.] | Catalyst | L–M | 2 qtrs–3 yrs | Monitoring | Ex-340B US growth; capex decline; buyback resumption; falling realised beta |
Source: Company annual reports (SEC 20-F / 6-K filings) and forensic footnote review; see Appendix A.1.
2.4 Risk Interdependencies
sources The risks here are dangerous less individually than as clusters that reinforce one another. The most damaging combination is the compounding of US pricing pressure, competitive erosion and the patent cliff: MFN and Medicaid cuts lower realised prices today, tirzepatide and compounders take volume today, and the loss of exclusivity removes pricing power tomorrow — three separate forces all pushing on the same US cash flows that dominate the valuation, and all landing before or around the point where the terminal value assumes a stable, mature franchise. [Rating and price target withdrawn — see the note at the top.]
A second, distinct cluster is one of trust rather than trading. Foundation control, the related-party acquisition and the drift in earnings measurement are individually manageable but collectively corrosive: a controlled company that transacts with its controller, writes off acquired assets at scale, and simultaneously moves its headline earnings definition away from statutory results while carving out both a large one-off gain and future “major” charges, gives minority holders progressively less independent basis on which to verify the numbers. None of these is an accounting failure — the auditor issued a clean opinion — but together they raise the burden of proof the reader must apply, and they are the reason this report anchors relentlessly on IFRS.
A third interaction runs through the balance sheet: the capital-expenditure super-cycle is compressing free cash flow at the very moment revenue is guided to decline and inventory is building into a falling-price environment. If launch volumes or realised prices disappoint, the working-capital release the base case assumes may instead become a further net-realisable-value write-down, so a demand shortfall would hit both the numerator (sales) and the cash conversion at once. [Rating and price target withdrawn — see the note at the top.]
2.5 ESG & Regulatory Exposure
sources The most material ESG exposure is governance, and it is the same issue that leads the risk section: control resides with the founding foundation through non-divestible super-voting shares, minority holders cannot outvote it, the year required an Extraordinary General Meeting to reconstitute a divided Board, and management has itself acknowledged that fewer than half of shareholder-elected directors were independent after that meeting, with only an intention to improve. Layered on top is the related-party acquisition from the controlling shareholder discussed above and a widening web of intra-group service, dividend and joint-taxation arrangements. For an investor, the governance “G” here is not a checklist item — it is the defining feature of the equity.
On the environmental side, the company is candid that its rapid, capacity-driven production scale-up has increased greenhouse-gas emissions year on year, working against its own Circular for Zero strategy and its net-zero-by-mid-century ambition; the decarbonisation levers it cites (supplier renewable-electricity commitments, bio-ammonia sourcing, lower-carbon plastics) sit largely in a scope-3 value chain it does not directly control. The sustainability statement is prepared under the European Sustainability Reporting Standards with a double-materiality assessment, but it was subject only to a limited-assurance engagement — explicitly a substantially lower level of assurance than the financial audit — and certain prior metrics were restated for methodology changes and error corrections, so the non-financial data carries more measurement uncertainty than the audited accounts. On the social side, access and affordability is both a stated responsibility and a disclosed pressure point: the number of vulnerable patients reached with diabetes products fell during the year as portfolio consolidation reduced lower-priced insulin tender sales — a reminder that the same commercial refocus that supports margins can narrow access.
The regulatory exposure is dominated by US pricing policy. The Most Favoured Nations framework, reduced Medicaid obesity coverage, the complex Medicare/Medicaid and pharmacy-benefit-manager rebate system, and potential pharmaceutical tariffs together represent the single largest external policy risk to the group’s economics, and all of it bears on the market that generates most of the profit. Underpinning the financial-statement risk, the auditor identified US sales rebates — including the 340B provisions — as its sole Key Audit Matter, citing significant measurement uncertainty resting on contested legal interpretations, and disclosed that it consulted accounting specialists on the subsequent-event judgement that shifted the 340B release across the year-end. That an area this central to reported revenue is the auditor’s only critical matter is itself the clearest signal of where regulatory and accounting risk converge.
Section 3 — Financial Analysis & Historical Performance
sources Three-Statement Linkage Confirmation (complete before writing begins): - Net Income ties (Income Statement → Cash Flow Statement): Confirmed. FY2025 net income of $15,517.8Mm is the opening line of the consolidated cash-flow statement; no reconciling difference between the reported profit and the cash-flow starting point. - Cash ties (Balance Sheet → Cash Flow Statement): Confirmed. Year-end cash and equivalents of $4,158.4Mm on the balance sheet equal the closing cash position in the cash-flow statement, with immaterial restricted-cash and FX-translation reconciling items. - Retained Earnings reconciliation (Beg RE + NI - Dividends = End RE): Confirmed within expected reserve movements. Opening retained earnings of $20,049.4Mm plus FY2025 net income of $15,517.8Mm less dividends of $7,841.6Mm approximates closing retained earnings of $30,687.9Mm; the small residual reflects share-based payment, treasury-share movements and currency translation, none individually material.
3.1A Income Statement
Source: Novo Nordisk A/S Annual Report 2025 (consolidated income statement and notes 2.1–2.6, 4.1); figures per the FL model — see Appendix A.1–A.2.
Currency convention (applies to every table in this section). Novo Nordisk reports in Danish kroner. [Rating and price target withdrawn — see the note at the top.]
CAGR Summary
| Metric | 3Y CAGR | 5Y CAGR | 10Y CAGR |
|---|---|---|---|
| Revenue | 20.4% | 19.5% | - |
| EBITDA | 22.1% | 20.1% | - |
| Net Income | 22.6% | 19.4% | - |
| Diluted EPS | 23.5% | 20.7% | - |
| FCF | -4.0% | 5.0% | - |
Source: Company annual reports (SEC 20-F / 6-K filings); figures per the FL model — see Appendix A.1–A.2.
3.1B Income Statement — Analysis
sources Revenue story. The five years to FY2025 capture a decade-long compounding machine at its steepest — and the year it began to flatten. Revenue compounded at 20.4% over three years and 19.5% over five, a pace almost unheard of at Novo Nordisk’s scale, driven overwhelmingly by semaglutide across the Obesity and Diabetes care franchise (Wegovy, Ozempic, Rybelsus). The trajectory was not linear: growth ran at 31.3% in FY2023 and 25.0% in FY2024 as GLP-1 obesity demand inflected, then decelerated sharply to 6.4% in FY2025 — the first visible crack in the narrative. [Rating and price target withdrawn — see the note at the top.] Critically, FY2025 US net sales were flattered by favourable gross-to-net adjustments that management has explicitly guided will not recur — so the reported top line overstates underlying US momentum.
A forward caveat that belongs here even though it lands in FY2026: the very large 340B statutory-discount provision that Novo Nordisk kept on its 31 December 2025 balance sheet — by treating a favourable 20 January 2026 administrative ruling as a non-adjusting subsequent event — will be released in full to revenue in Q1 FY2026. That release is a one-off, non-cash accounting event, not trading. Any read of FY2026 reported growth (management’s own interims show reported sales and profit stepping up sharply on the release while adjusted sales decline at constant currency) must strip it out. It is the single most important earnings-quality item in the file, and it sits directly on top of a business whose FY2025 revenue growth had already decelerated to single digits.
Margin trajectory. Gross margin is the pharma hallmark — it expanded steadily from 83.2% in FY2021 to 84.7% in FY2024 on favourable GLP-1 product mix, then fell sharply to 81.0% in FY2025, a decline of roughly three-and-a-half points and the most important single line-item move in the income statement. This is not a demand or pricing-power signal; management attributes it to amortisation and depreciation on the acquired former Catalent fill-finish sites, one-off restructuring costs from the company-wide transformation, ongoing capacity-expansion costs and adverse currency, partly offset by positive GLP-1 mix. The distinction matters for valuation: the Catalent-related depreciation is structural and recurring, while the restructuring charge is not — so a normalised gross margin sits below the FY2024 peak but above the FY2025 trough.
EBIT margin tells the same story in compressed form: it climbed to a peak of 44.2% in FY2024 before falling to 41.3% in FY2025 — essentially back to the 41.7% level of FY2021. Whether the peak operating margin is the right normalised base is the central valuation question for this name: the FY2025 print absorbs restructuring and capacity drag, but it also loses the non-recurring gross-to-net tailwind, so the two partly offset. EBITDA margin, on the impairment-inclusive cash-flow D&A basis that matches the company’s own EBITDA definition, eased from 50.8% to 48.4%.
Major movers (FY2024 → FY2025). 1. Gross-margin compression (structural + one-off). The move from 84.7% to 81.0% is the dominant driver of the flat profit year. The Catalent D&A component is recurring; the restructuring and capacity-ramp components are transitional. Net: gross profit of $37,914.5Mm grew far slower than in prior years despite higher volumes. 2. Company-wide restructuring (temporary, but large). The 10 September 2025 transformation plan — the largest workforce reduction in company history under new CEO Maziar Mike Doustdar — carried major restructuring costs that depressed FY2025 operating profit and gross margin. The cost is one-off; the promised savings are prospective and unproven, and the company excludes the charge from its “Adjusted” profit (see Quality of earnings). 3. Impairments now embedded in D&A (recurring). The D&A line rose to $3,330.1Mm (from $2,771.7Mm) and deliberately uses the impairment-inclusive cash-flow basis. This is not incidental: Novo Nordisk books large write-offs of acquired and in-licensed pipeline assets with regularity (ocedurenone in FY2024; intangible and assets-under-construction impairments in FY2025; and, post year-end, a further impairment including monlunabant alongside the ziltivekimab ZEUS trial failure). For a company built increasingly on acquisition and in-licensing, these impairments are a recurring economic cost of the strategy, not one-offs — they should be normalised into, not excluded from, earnings. 4. Interest expense (new and structural). Interest expense stepped up as the balance sheet swung from near-net-cash to net debt to fund Catalent and Akero — a genuinely new cost line for a company that historically carried none of note. It is modest against operating profit today but is now a permanent feature of the P&L. 5. [Rating and price target withdrawn — see the note at the top.]
Net income of $15,517.8Mm grew just 1.4% and diluted EPS 1.8% — the first near-flat bottom line after years of double-digit compounding (net income compounded 22.6% over the prior three years). The per-share history in the tables is split-adjusted: the September 2023 2-for-1 share split is applied retroactively to the pre-split years, so the diluted-EPS and FCF-per-share series — and every multi-year CAGR built on them — are on a consistent basis throughout. On that basis FY2023 EPS grew 52.4%, in line with the earnings surge of that year, and the FY2025 reading of 1.8% tracks net income.
Quality of earnings. Three items warrant weight. First, the 340B revenue release (RED) discussed above: a very large, non-cash, non-recurring benefit that management shifted across the year-end by judgement, landing in FY2026 rather than FY2025 — defensible under IFRS, but discretionary, and it was the auditor’s sole Key Audit Matter. Second, the “Adjusted net profit” bridge (RED): adjusted profit sits well above IFRS profit, and the gap is widening because the adjustment adds back all intangible amortisation and impairment — the amortisation add-back has jumped as Catalent know-how and acquired IP begin to amortise. For a serial acquirer, this is a recurring cost being progressively excluded; the widening IFRS-to-adjusted gap is itself a quality signal, and from FY2026 a new framework additionally strips the 340B reversal, “major legal matters” and “major impairments,” and redefines free cash flow to flatter it. The right anchor is IFRS, with the adjusted bridge treated as reconciliation, not truth. Third, the restructuring charge (YELLOW) is excluded from adjusted profit while its savings are only prospective. [Rating and price target withdrawn — see the note at the top.]
⚠ Items to Watch. If EBIT margin falls durably below the FY2025 41.3% level — as opposed to the one-year restructuring dip — it would signal that US price erosion and the loss of the gross-to-net tailwind are outrunning cost savings, and would force a lower normalised operating-margin assumption. If the IFRS-to-adjusted net-profit gap keeps widening on a rising amortisation add-back, treat “adjusted” EPS as increasingly detached from cash economics. And any FY2026 headline that leans on reported (rather than adjusted, ex-340B) growth should be discounted on sight.
3.2A Balance Sheet
Source: Novo Nordisk A/S Annual Report 2025 (consolidated balance sheet and notes 3.1–3.6, 4.6); FY2024 comparatives are the restated figures in the FY2025 report — see below; figures per the FL model.
3.2B Balance Sheet — Analysis
sources A note on comparability before the analysis. Effective 1 January 2025, Novo Nordisk made several presentation changes at once: goodwill was split out of intangible assets onto its own line; a new “sales deductions and product returns” line was created, pulling amounts previously held in provisions, other liabilities and trade payables; the related cash-flow movements were reclassified into working capital; the US/International geographic segmentation was reorganised with comparatives restated; and the Catalent purchase-price allocation was finalised, retrospectively restating FY2024 intangibles, PP&E, deferred tax and goodwill. No single change is improper, but together they make several FY2024-as-originally-reported lines non-comparable. The figures above use the restated comparatives in the FY2025 report, which is the correct basis for trend analysis.
Asset composition — a balance sheet transformed. Total assets expanded from $46,668.0Mm in FY2023 to $85,308.3Mm in FY2025, and the character of the balance sheet changed as much as its size. This was historically a cash-rich, asset-light pharma; it is now capital- and intangible-heavy. Net PP&E rose from $13,498.1Mm to $32,743.2Mm as the GLP-1 capacity build-out accelerated, while goodwill and intangibles jumped from $8,963.9Mm to $20,435.7Mm — the step-change concentrated in FY2024 on the Catalent acquisition and extended in FY2025 by the Akero/efruxifermin asset purchase. This is the balance-sheet expression of the two defining strategic moves of the period, and it carries a specific quality caveat: a large share of the acquired intangible value is level-3, judgement-heavy fair value.
That caveat is sharpest on Catalent (RED, related-party). The multi-billion-krone fill-finish acquisition was bought from Novo Holdings A/S — the controlling shareholder that holds a minority of the capital but a controlling majority of the votes — with the large majority of the price landing in level-3 “know-how” and goodwill, and no independent fairness opinion on the price disclosed in the notes. The know-how amortises (feeding the very D&A that compressed FY2025 gross margin) and the goodwill is now a permanent carrying value; both sit on assets whose fair value was set with, not independently of, the controlling holder. Minority holders bear the amortisation and impairment risk of a price they did not set, and an open closing-mechanism true-up keeps a live P&L link to Novo Holdings. Compounding the intangible-quality question, the balance sheet also carries very large single-asset intangibles not yet amortising and tested only annually — efruxifermin (MASH) and an RNAi platform among them — representing concentrated binary clinical risk, exactly the profile that produced the ocedurenone and monlunabant write-offs.
Leverage trajectory — from net cash to net debt in two years. The most consequential balance-sheet change is the funding side. Net debt swung from $1,871.8Mm in FY2023 to $12,093.9Mm in FY2024 and $16,419.5Mm in FY2025, as total debt rose from $4,007.5Mm to $20,577.9Mm — a EUR-denominated bond programme raised largely to fund Catalent and Akero. In absolute terms the shift is dramatic; in credit terms it remains modest. Net debt/EBITDA sits at 0.7x (from 0.6x), debt/equity at 0.7x, and the company retains its strong investment-grade credit standing with an undrawn committed facility. Leverage is a monitoring item, not a solvency one — but the direction (net cash to a modest positive net-debt multiple in two years, alongside large off-balance-sheet contract-manufacturer purchase obligations) has changed the company’s financial character and, as buyback cuts show, its capital-allocation flexibility.
Working capital. Two forensic-relevant strands run here. Inventory rose to $7,797.5Mm (from $5,669.8Mm), a build running ahead of sales growth into an environment where, on management’s own subsequent disclosures, US realised prices are falling; write-downs also rose year-on-year, and the policy of capitalising then immediately writing down prelaunch inventory adds a recurring net-realisable-value risk if launch volumes or prices disappoint. Receivables, at $11,133.9Mm versus $9,986.5Mm, were broadly stable, but they sit atop an unusually large US gross-to-net machine: net sales are struck after gross-to-net deductions of well over half of gross sales, with US rebates, discounts and returns alone representing the large majority of US gross sales, and the rollforward shows recurring favourable prior-year true-ups. [Rating and price target withdrawn — see the note at the top.] This is an estimation-quality feature of the revenue base, and it was the auditor’s sole Key Audit Matter.
⚠ Items to Watch. If net debt/EBITDA exceeds the FY2025 0.7x on a sustained basis — whether from further business development or from EBITDA erosion as the underlying business softens — it would begin to constrain the dividend/buyback envelope, which the company has already flexed by cutting repurchases. A rising inventory balance paired with continued US price erosion is the specific combination that would presage larger write-downs. And any impairment of the efruxifermin or RNAi carrying values would be a direct, potentially large hit to the intangible base built through the acquisition strategy.
3.3A Cash Flow Statement
| FY2021 | FY2022 | FY2023 | FY2024 | FY2025 | |
|---|---|---|---|---|---|
| Cash from Operations ($M) | $8,749.4M | $11,169.1M | $15,810.3M | $17,547.6M | $18,042.8M |
| — Depreciation & Amortization ($M) | $958.5M | $1,042.3M | $1,366.5M | $2,771.7M | $3,330.1M |
| Capital Expenditures ($M) | $1,007.8M | $1,719.7M | $3,746.3M | $6,841.6M | $9,110.7M |
| Free Cash Flow ($M) | $7,741.6M | $9,449.4M | $12,064.0M | $10,706.0M | $8,932.2M |
| FCF Margin | 34.6% | 37.7% | 35.8% | 25.4% | 19.1% |
| FCF / Share | $1.68 | $2.08 | $2.68 | $2.40 | $2.01 |
| FCF Conversion (FCF/NI) | 101.9% | 120.2% | 99.3% | 73.1% | 57.6% |
| CapEx / Revenue | 4.5% | 6.9% | 11.1% | 16.2% | 19.5% |
| CapEx / D&A | 1.1x | 1.6x | 2.7x | 2.5x | 2.7x |
| Dividends Paid ($M) | $3,422.9M | $3,582.5M | $4,611.6M | $6,403.0M | $7,841.6M |
| Share Repurchases ($M) | $3,093.6M | $3,410.2M | $4,344.1M | $2,927.5M | $210.3M |
Source: Novo Nordisk A/S Annual Report 2025 (consolidated cash-flow statement, notes 4.7 and 5.2, and the non-IFRS free-cash-flow reconciliation); figures per the FL model.
3.3B Cash Flow — Analysis
sources Quality of operating cash flow. Operating cash flow held up well through the period — $15,810.3Mm, $17,547.6Mm and $18,042.8Mm across FY2023–FY2025 — essentially flat at a high level even as reported profit growth stalled, confirming that the earnings are cash-backed at the operating line. The deterioration is entirely below OCF, in the investment line. Free cash flow (operating cash flow less capital expenditure) fell from $12,064.0Mm in FY2023 to $10,706.0Mm in FY2024 and $8,932.2Mm in FY2025, and FCF conversion (FCF/net income) compressed from 99.3% to 73.1% to 57.6%. [Rating and price target withdrawn — see the note at the top.] On the company’s own broader free-cash-flow definition (which also nets intangible and acquisition outflows), FY2024 free cash flow turned negative under the weight of the Catalent purchase; the model’s PP&E-based FCF above smooths that one-time outlay but shows the same underlying trend.
CapEx analysis. This is a capex super-cycle. [Rating and price target withdrawn — see the note at the top.] Management guides that capex will moderate in FY2026 and decline thereafter as the build matures — which, if delivered, mechanically restores free cash flow and conversion without any improvement in the underlying business. The watch item is whether the spend actually rolls over on schedule or whether softening demand leaves newly built capacity underutilised.
Capital allocation. The mix shifted decisively during the period. The dividend has become the dominant and protected claim on cash, at $7,841.6Mm in FY2025, while share repurchases were slashed to $210.3Mm from $2,927.5Mm the prior year — an explicit signal that buybacks are now the flexible, residual element behind the dividend, reinvestment and business development. Meanwhile reinvestment (capex of $9,110.7Mm plus the debt-funded acquisitions) became the single largest use of capital. The logical read is coherent: with free cash flow compressed by the capacity build and net debt newly on the balance sheet, management is protecting the dividend, funding the growth capex, and using the buyback as the shock absorber. It is a defensible sequencing — but it also means near-term shareholder returns are increasingly debt- and dividend-weighted rather than buyback-driven, and it removes the buyback cushion just as the growth narrative softens.
⚠ Items to Watch. If FCF conversion stays below the FY2025 57.6% into FY2026 without the promised capex moderation, it would indicate the super-cycle is not rolling over on plan — the difference between a temporary investment phase and a structurally lower cash-conversion business. Conversely, delivery of the guided capex decline should restore conversion mechanically and is the cleanest near-term catalyst for reported free cash flow.
3.4 Returns Analysis
| FY2021 | FY2022 | FY2023 | FY2024 | FY2025 | |
|---|---|---|---|---|---|
| ROIC | 64.2% | 65.6% | 76.0% | 58.3% | 37.9% |
| ROE | 71.2% | 72.0% | 88.1% | 80.8% | 60.7% |
| ROA | 28.1% | 25.5% | 30.1% | 25.9% | 20.3% |
| Interest Coverage | 202.9x | 197.9x | 189.3x | 78.3x | 30.3x |
Source: Company annual reports (SEC 20-F / 6-K filings); figures per the FL model — see Appendix A.1–A.2.
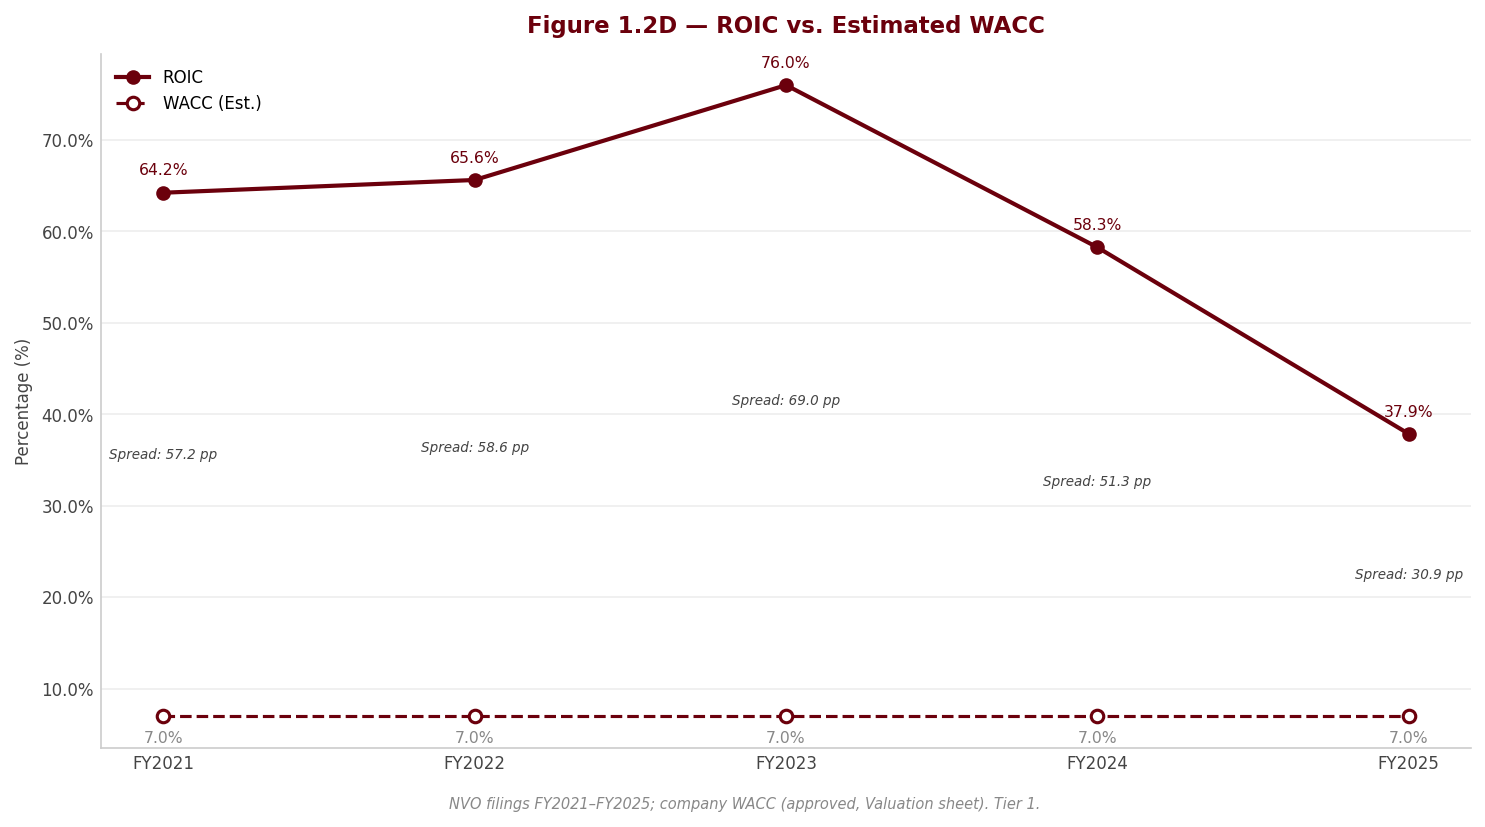
ROIC analysis. Return on invested capital is the single most important long-run metric for this business, and it tells a two-part story: still extraordinary, but decisively off its own peak. ROIC ran at 76.0% in FY2023 — a figure that sits multiples above any plausible cost of capital (the WACC sits far below it) — then fell to 58.3% in FY2024 and 37.9% in FY2025. Even at the FY2025 level the spread over WACC is vast, and the business remains one of the most capital-efficient in global pharma. But the compression is real and it is mechanical: NOPAT was roughly flat while the invested-capital denominator ballooned on the Catalent and Akero deals and the capacity build. In other words, ROIC fell not because the core franchise got worse but because the company deployed a very large slug of new capital — capital that is not yet earning at the legacy franchise’s returns. The forward question is whether that newly acquired and built capital ever earns the incremental returns implied by the multiple; until it does, ROIC drifts down toward (though still far above) the cost of capital, and the impairment risk on the level-3 Catalent and pipeline intangibles is the tail that could impair the denominator’s earning power outright.
DuPont decomposition. Decomposing FY2025 ROE of 60.7% into its drivers: net margin of 33.1% × asset turnover of 0.61x (computed on average assets so the decomposition ties, marginally above the ending-asset asset-turnover shown in Section 5) × equity multiplier of 2.99x. The level of ROE is set by the exceptional net margin — a pharma with a semaglutide monopoly-economics core throws off profitability few businesses can match. The swing factors, and the reason ROE fell from 80.8% in FY2024, are the other two terms moving in opposite directions: asset turnover has fallen as the balance sheet ballooned with Catalent goodwill/know-how and half-built capacity that does not yet generate proportionate sales, while the equity multiplier has risen as the company took on net debt. The rising leverage is now supporting ROE even as the falling asset productivity drags it — a lower-quality composition than the FY2023 peak, when high returns rested on margin and turnover rather than on financial gearing. Interest coverage of 30.3x remains very comfortable, but note how far it has fallen from the near-net-cash FY2023 level as the debt-funded strategy took hold.
3.5 Altman Z-Score (Most Recent FY)
| Component | FY2023 | FY2024 | FY2025 |
|---|---|---|---|
| X1 (Working Capital / Total Assets) | -0.095 | -0.122 | -0.080 |
| X2 (Retained Earnings / Total Assets) | 0.333 | 0.310 | 0.360 |
| X3 (EBIT / Total Assets) | 0.326 | 0.276 | 0.235 |
| X4 (Equity / Total Liabilities) | 0.512 | 0.445 | 0.556 |
| X5 (Revenue / Total Assets) | 0.739 | 0.623 | 0.569 |
| Z-Score | 2.18 | 1.84 | 1.78 |
| Zone | Grey | Grey | Grey |
Source: Company annual reports (SEC 20-F / 6-K filings); figures per the FL model — see Appendix A.1–A.2.
Interpretation — read this score with heavy caveats. The printed score is the private-firm Z′ variant (book-value equity in the X4 term), and it must be scored on that model’s own bands (>2.90 Safe; 1.23–2.90 Grey; <1.23 Distress) — not the public-firm cutoffs. On that basis the Z′ score drifts down from 2.18 in FY2023 to 1.84 in FY2024 and 1.78 in FY2025, but stays in the Grey zone throughout — it does not cross into distress. Even the grey reading is a model artefact rather than a credit signal. The Z′ model was fitted on industrial manufacturers, and it systematically misreads an intangible-heavy pharma financed for a large acquisition: the X1 working-capital term is negative because current liabilities (swollen by the very sales-deduction/340B provisions discussed above) exceed current assets, and the enlarged, goodwill-heavy asset base from Catalent depresses the X3 and X5 asset-productivity terms. None of that reflects an inability to service obligations. The reassuring counterpoint sits in the same family: the market-equity original variant, which credits Novo Nordisk’s large equity value, resolves to the Safe zone. [Rating and price target withdrawn — see the note at the top.] The accruals and earnings-manipulation screens likewise read clean. The honest conclusion is that the downward drift in the Z′ score is worth noting as a directional signal of a balance sheet that has taken on leverage and intangibles — but the Grey label is an artefact of applying an industrial model to a high-return, investment-grade pharmaceutical company, and should not be read as genuine bankruptcy risk.
4. Valuation withdrawn
This section stated what the shares were worth and what to do about them. It rested on an exit multiple set by hand — across the coverage it averaged 24% below where each company actually traded — so the conclusion largely restated that assumption instead of testing it. Rather than leave it standing, it has been withdrawn while the method is rebuilt.
Nothing else in this report depends on it: the financial analysis above and below is drawn from the company's own filings, and every figure links to the page it was verified against.
Section 5 — Financial Metrics & Peer Benchmarking
5.1 Peer Selection
sources Novo Nordisk does not have a clean set of comparables: no other listed company derives the bulk of its revenue from the GLP-1/incretin franchise that now defines Novo’s economics. The peer set is therefore built in two tiers. Eli Lilly is the essential comparable — the other half of the incretin duopoly and the single most important read-across for the investment case. Sanofi, AstraZeneca and Merck round out the group as large-cap innovative pharma peers of broadly similar scale and portfolio breadth, chosen so that Novo’s margins, returns and multiples can be judged against the wider branded-pharma cost of capital rather than against Lilly alone.
The set has three structural limitations that must be held in mind throughout this section, and which are documented in full in 5.7. First, this is the pipeline’s first genuinely multi-currency peer table: Novo reports in Danish kroner, Lilly, AstraZeneca and Merck in US dollars, and Sanofi in euros, and none of the figures are translated to a common currency. Absolute figures — revenue, EBIT, net income, debt — are therefore not cross-comparable and must never be ranked or summed across the table. Only dimensionless measures (margins, returns, leverage, turnover and valuation multiples) are comparable, and those are what this section ranks on. Second, the group straddles the IFRS/US GAAP line: Novo, Sanofi and AstraZeneca report under IFRS, Lilly and Merck under US GAAP — a split that materially affects operating-margin and return comparisons through intangible amortisation, acquired-IPR&D treatment and inventory accounting. Third, two peers carry FY2025-specific distortions (Lilly a large acquired-IPR&D charge, Sanofi a discontinued-operations gain plus intangible impairments) that flatter or depress the headline comparison and require explicit adjustment before any judgement is drawn.
| Peer | Ticker | Exchange | Filing Type | Accounting Standard | Fiscal Year End | Comparability Note |
|---|---|---|---|---|---|---|
| Eli Lilly and Company | LLY | NYSE | 10-K | US GAAP | December | The essential comparable — the other half of the GLP-1 duopoly; FY2025 EBIT absorbs a large acquired-IPR&D charge (directional margin gap). |
| Sanofi | SNY | Euronext Paris | 20-F | IFRS | December | EUR-reporting IFRS peer; FY2025 returns distorted by a discontinued-operations gain and intangible impairment — directional only. |
| AstraZeneca PLC | AZN | Nasdaq/LSE | 20-F | IFRS | December | USD-reporting IFRS peer; working-capital-cycle metrics not comparable (lumped payables) and shown as not-meaningful. |
| Merck & Co., Inc. | MRK | NYSE | 10-K | US GAAP | December | Clean FY2025 print with no large IPR&D charge; low multiple reflects the Keytruda 2028 patent cliff, not an earnings distortion. |
Source: Peer-company SEC filings; comparability notes in 5.7 — see Appendix A.1.
5.2 Profitability Comparison
sources Comparative: Most Recent Full Fiscal Year
| Metric | Novo Nordisk | Eli Lilly and Company | Sanofi | AstraZeneca PLC | Merck & Co., Inc. |
|---|---|---|---|---|---|
| Revenue (M, own currency) | $46,820.3M | $65,179.0M | EUR 43,626.0M | $58,739.0M | $65,011.0M |
| Gross Margin | 81.0% | 83.0% | 70.1%ᶠ | 81.9%ᶠ | 74.8% |
| EBITDA Margin | 48.4% | 43.4% | 27.6%ᶠ | 33.2%ᶠ | 41.6% |
| EBIT Margin | 41.3% | 40.4% | 14.5%ᶠ | 23.4%ᶠ | 32.6% |
| Net Margin | 33.1% | 31.7% | 11.3%ᶠ | 17.4%ᶠ | 28.1% |
| FCF Margin | 19.1% | 13.8% | 16.1% | 20.0% | 19.0% |
Source: Peer-company SEC filings; comparability notes in 5.7 — see Appendix A.1.
Flag legend: ᶠ = IFRS reporter — margin/return directional across the GAAP–IFRS line; ᵐ = market-sourced (Tier 2), current price over FY2025 fundamentals; ᶜ = computed from filing components.
The revenue row is the one line in this table that cannot be read across. Novo’s figure is in DKK, Lilly, AstraZeneca and Merck’s in USD, and Sanofi’s in EUR — the apparent 5-to-7x gap between Novo and its dollar peers is almost entirely a currency artefact. Translated to a common currency, Novo’s revenue is broadly comparable in size to Lilly, AstraZeneca and Merck (all in the mid-USD-40s to mid-USD-60s billions); it is not the outlier the raw number suggests. Every judgement below is drawn only from the margin, return and multiple rows.
On reported margins, Novo screens at or near the top of the group: its gross margin sits alongside Lilly and AstraZeneca in the low-80s, and its EBIT and EBITDA margins lead the peer set on the reported figures. This lead is genuine in part — it reflects a concentrated, high-price GLP-1/insulin portfolio, scale manufacturing, and the absence of the heavy acquired-intangible amortisation that weighs on the IFRS peers. But the headline gap flatters Novo and must be read with two adjustments. First, Lilly’s reported EBIT margin is held down roughly four to five percentage points by a large acquired-IPR&D charge that runs through its FY2025 operating line; on a like-for-like ex-IPR&D basis Lilly’s operating margin actually edges ahead of Novo’s, so the reported gap to the most important peer is an accounting artefact, not an operating advantage. Second, Sanofi’s and AstraZeneca’s much lower IFRS EBIT margins are depressed by acquired-intangible amortisation and, in Sanofi’s case, a large FY2025 impairment — the true operating difference is far narrower than the reported figures imply. Merck, a clean FY2025 print with no large IPR&D charge, is the fairest unadjusted margin comparison and sits meaningfully below Novo.
Historical: Novo Nordisk Own 5-Year Progression
| Metric | FY2021 | FY2022 | FY2023 | FY2024 | FY2025 |
|---|---|---|---|---|---|
| Gross Margin | 83.2% | 83.9% | 84.6% | 84.7% | 81.0% |
| EBITDA Margin | 45.9% | 46.4% | 48.2% | 50.8% | 48.4% |
| EBIT Margin | 41.7% | 42.3% | 44.2% | 44.2% | 41.3% |
| Net Margin | 33.9% | 31.4% | 36.0% | 34.8% | 33.1% |
| FCF Margin | 34.6% | 37.7% | 35.8% | 25.4% | 19.1% |
Source: Peer-company SEC filings; comparability notes in 5.7 — see Appendix A.1.
Novo’s own progression shows a franchise whose profitability is coming off its peak rather than expanding. Operating margins compressed into FY2025 as US gross-to-net pressure, restructuring and rising acquired-intangible amortisation (following the Catalent purchase) began to bite, and the FCF margin sits well below the operating margin — a direct consequence of the GLP-1 capacity super-cycle discussed in 5.4 and Section 3. The point for the peer comparison is that Novo is being benchmarked against peers at a moment when its own margins are normalising down from extraordinary levels, not at a steady-state high.
5.3 Returns Comparison
sources Comparative: Most Recent Full Fiscal Year
| Metric | Novo Nordisk | Eli Lilly and Company | Sanofi | AstraZeneca PLC | Merck & Co., Inc. |
|---|---|---|---|---|---|
| ROIC | 37.9% | 34.2% | 6.4%ᶠ | 16.0%ᶠ | 21.0% |
| ROE | 60.7% | 77.8% | 6.9%ᶠ | 21.0%ᶠ | 34.7% |
| ROA | 20.3% | 18.4% | 3.9%ᶠ | 9.0%ᶠ | 13.3% |
| Asset Turnover | 0.57x | 0.58x | 0.34x | 0.51x | 0.47x |
Source: Peer-company SEC filings; comparability notes in 5.7 — see Appendix A.1.
Historical: Novo Nordisk Own 5-Year Progression
| Metric | FY2021 | FY2022 | FY2023 | FY2024 | FY2025 |
|---|---|---|---|---|---|
| ROIC | 64.2% | 65.6% | 76.0% | 58.3% | 37.9% |
| ROE | 71.2% | 72.0% | 88.1% | 80.8% | 60.7% |
| ROA | 28.1% | 25.5% | 30.1% | 25.9% | 20.3% |
Source: Peer-company SEC filings; comparability notes in 5.7 — see Appendix A.1.
Returns are where the Novo-versus-Lilly comparison is most decision-relevant, and where the choice of metric matters. ROIC is the cleaner cross-comparable return because it adds debt back into the capital base and is therefore insensitive to the buyback-depleted equity that distorts ROE. On ROIC, Novo and Lilly sit together at the very top of the group — both comfortably ahead of Merck, and multiples above the two IFRS peers. This is the single most important line in the section for the thesis: the two incretin leaders earn essentially the same, elite return on capital, so the enormous valuation gap between them (5.5) is not explained by a difference in return quality.
ROE tells a noisier story and should be read with care. Lilly’s ROE screens far above Novo’s, but that is largely an artefact of a thin, buyback-depleted equity base rather than superior economics — the same distortion, to a lesser degree, lifts Merck’s ROE. Sanofi’s and AstraZeneca’s returns are depressed by goodwill-inflated invested capital and, for Sanofi specifically, by the intangible impairment and discontinued-operations accounting detailed in 5.7; their ROIC and ROE understate underlying operating returns and should be treated as directional only. Novo’s own five-year progression makes the broader point plain: its returns, while still exceptional, have come off their peak as the capital base has ballooned with the Catalent acquisition and the capacity build-out, and as margins have normalised.
Both Novo and Lilly earn ROIC far in excess of Novo’s cost of capital (), so both remain durable value creators. The question this section raises — and routes to the separate valuation — is not whether Novo creates value, but why the market prices near-identical returns on capital so differently across the two names.
5.4 Leverage & Liquidity Comparison
sources Comparative: Most Recent Full Fiscal Year
| Metric | Novo Nordisk | Eli Lilly and Company | Sanofi | AstraZeneca PLC | Merck & Co., Inc. |
|---|---|---|---|---|---|
| Net Debt / EBITDA | 0.7x | 1.2x | 0.9x | 1.1x | 1.3x |
| Total Debt / Equity | 0.7x | 1.6x | 0.3xᶠ | 0.6xᶠ | 0.9x |
| Interest Coverage | 30.3x | 29.4x | 11.3x | 8.1x | 15.6x |
| Current Ratio | 0.8x | 1.6x | 1.1x | 0.9x | 1.5x |
| FCF Margin | 19.1% | 13.8% | 16.1% | 20.0% | 19.0% |
Source: Peer-company SEC filings; comparability notes in 5.7 — see Appendix A.1.
Novo carries the lowest net-debt-to-EBITDA in the group and the lowest debt-to-equity of the four peers reporting on a comparable basis — a conservative balance sheet consistent with its AA/Aa3 credit and its history of running net cash. Interest coverage of 30.3x leaves ample headroom. The important nuance for the trend, developed in Section 3, is direction: Novo has moved from net cash two years ago to modest net leverage today, funding the large Catalent acquisition and the capacity build with eurobond issuance. The leverage is still comfortably the lowest in the peer set, but the trajectory — not the level — is the watch item, and it sits alongside a substantial book of off-balance-sheet contract-manufacturer purchase obligations.
Two comparability points bound the reading. Leverage for the IFRS reporters (Novo, Sanofi, AstraZeneca) excludes separately-stated IFRS-16 lease liabilities; including them would raise their net-debt/EBITDA modestly and does not change the ranking. And Novo’s current ratio, at 0.8x, sits below every peer — which for most companies would flag a liquidity concern but here reflects the large US sales-deduction liability sitting in current liabilities (including the 340B provision discussed in 5.7 and Section 3) rather than a funding gap; with net-debt/EBITDA well under one turn and coverage above 30.3x, this is a balance-sheet-structure feature, not a solvency signal.
5.5 Valuation Multiples Comparison
sources Comparative: Current Price
| Metric | Novo Nordisk | Eli Lilly and Company | Sanofi | AstraZeneca PLC | Merck & Co., Inc. |
|---|---|---|---|---|---|
| EV/EBITDA | 9.4x | 39.8xᵐ | 10.1xᵐ | 14.6xᵐ | 13.7xᵐ |
| P/E | 12.8x | 52.8xᵐ | 22.3xᵐ | 25.7xᵐ | 18.4xᵐ |
| FCF Yield | 4.5% | 0.8%ᵐ | 6.4%ᵐ | 4.5%ᵐ | 3.7%ᵐ |
Source: Peer-company SEC filings; comparability notes in 5.7 — see Appendix A.1.
All peer valuation multiples are market-sourced (Tier 2): current (August 2026) market capitalisation over FY2025 fiscal-year fundamentals — not audited trailing-twelve-month multiples. Each peer’s multiple uses its own listing currency consistently, so no cross-currency effect enters the ratio.
Historical: Novo Nordisk EV/EBITDA (period-end price)
| FY2021 | FY2022 | FY2023 | FY2024 | FY2025 |
|---|---|---|---|---|
| 26.5x | 26.2x | 28.1x | 19.3x | 10.3x |
Source: Peer-company SEC filings; comparability notes in 5.7 — see Appendix A.1.
This is the section’s headline. Novo trades at a low-teens P/E and single-digit EV/EBITDA — not merely a discount to Lilly, whose multiples sit at roughly four times Novo’s on both measures, but below every other peer in the group, including Sanofi, AstraZeneca and Merck. A company earning top-of-group ROIC, alongside the co-leader of a structurally attractive duopoly, is being priced more cheaply than a peer facing a 2028 Keytruda patent cliff (Merck) and than two peers whose returns are a fraction of Novo’s (Sanofi, AstraZeneca). On the reported metrics, nothing in Novo’s current profitability or returns justifies the discount.
The multiple is best understood as the market’s verdict on terminal risk rather than current economics. [Rating and price target withdrawn — see the note at the top.] The Lilly-versus-Novo gap encodes exactly this: near-identical returns on capital today, but the market paying a large premium for Lilly’s share momentum, oral-GLP-1 position and next-generation pipeline while assigning Novo a valuation that implies material erosion ahead. [Rating and price target withdrawn — see the note at the top.] This section’s contribution is to establish that the gap is real, large, and not explained by any observable difference in FY2025 profitability or returns.
5.6 Efficiency Comparison
| Metric | Novo Nordisk | Eli Lilly and Company | Sanofi | AstraZeneca PLC | Merck & Co., Inc. |
|---|---|---|---|---|---|
| Days Sales Outstanding | 84 days | 99 days | 70 days | 94 daysᶠ | 66 days |
| Days Inventory Outstanding | 281 days | 454 days | 286 days | 225 days | 148 days |
| Days Payables Outstanding | 151 days | 178 days | 206 days | n/mᶠ | 98 days |
| Cash Conversion Cycle | 214 days | 376 days | 150 days | n/mᶠ | 116 days |
| CapEx / Revenue | 19.5% | 12.0% | 8.1% | 4.8% | 6.3% |
Source: Peer-company SEC filings; comparability notes in 5.7 — see Appendix A.1. AstraZeneca DPO and cash-conversion cycle are shown as not-meaningful (n/m): its balance sheet lumps trade payables with non-trade items, so a comparable figure cannot be derived — see 5.7.
Novo’s working-capital cycle is long in absolute terms but sits in the middle of the comparable group, not at an extreme: its inventory days and cash-conversion cycle are shorter than Lilly’s — which carries an unusually long cycle — and longer than Merck’s and Sanofi’s. This is characteristic of a manufacturer holding large finished-goods and pre-launch inventory across a global cold-chain biologics network. AstraZeneca’s payables and cash-conversion cycle are deliberately shown as not-meaningful rather than as a misleading number, because its combined-payables disclosure would produce an economically nonsensical figure; the working-capital-days comparison is therefore limited to Novo, Lilly, Merck and Sanofi.
The one efficiency line that stands out is CapEx/Revenue: Novo spends the most of the group on capital investment relative to sales, by a wide margin — roughly double Lilly’s ratio and several times that of Sanofi, AstraZeneca and Merck. This is the GLP-1 capacity super-cycle in a single number: a deliberate, growth-driven build-out of fill-finish and API capacity (the Catalent sites among it) to meet incretin demand. It depresses near-term free cash flow relative to peers — visible in the gap between Novo’s operating and FCF margins in 5.2 — and management guides the ratio to decline as the build normalises. Read correctly, it is an investment choice rather than an efficiency deficiency, but it is the reason Novo’s cash conversion currently lags its reported profitability.
5.7 Comparability Caveats
sources Every material comparability issue below shapes how the tables above should be read; none is cosmetic.
Multi-currency table (all peers; revenue and every absolute figure). Each company’s figures remain in its own reporting currency and are not translated — Novo in DKK, Lilly, AstraZeneca and Merck in USD, Sanofi in EUR. Absolute revenue, EBIT, net income and debt are therefore not cross-comparable and were never ranked across the table. Adjusting for currency, the four are broadly similar in revenue scale; only margins, returns, leverage and multiples are used for comparison.
IFRS versus US GAAP split (Sanofi, AstraZeneca vs Lilly, Merck). Novo, Sanofi and AstraZeneca report under IFRS; Lilly and Merck under US GAAP. Three differences matter for pharma: IFRS carries large acquired-intangible amortisation through operating profit (depressing IFRS margins); US GAAP expenses acquired IPR&D immediately while IFRS may capitalise it; and LIFO inventory is permitted under US GAAP (Lilly uses it for most US inventory) but prohibited under IFRS. All margin and return comparisons across this line — flagged ᶠ in the tables — are directional, not precise.
Lilly’s acquired-IPR&D charge (EBIT margin, EBITDA margin, R&D intensity). Lilly’s FY2025 operating income absorbs a separate acquired-IPR&D charge on top of its R&D line, which depresses its reported EBIT and EBITDA margins by roughly four to five percentage points relative to Novo, which has no equivalent recurring line. Excluding it, Lilly’s operating margin exceeds Novo’s — so the reported margin gap flatters Novo and does not reflect an operating advantage over its most important peer. The same charge means Lilly’s headline R&D-to-sales understates its true innovation spend; including acquired IPR&D, Lilly’s R&D intensity is broadly in line with AstraZeneca and Merck.
R&D intensity (Novo). Novo’s R&D-to-sales is the lowest of the five companies. Part of this is a genuine scale advantage — a concentrated, high-volume franchise spreads a given research base over more revenue — but the light R&D intensity, set against a pipeline that has produced recurring large impairments (ocedurenone, monlunabant, ziltivekimab), also raises the question of whether Novo is under-investing in the next generation of assets relative to Lilly. That pipeline-adequacy question is a risk item and is developed in Section 2, not resolved here.
Sanofi discontinued operations and impairment (net margin, ROE, ROA, ROIC, P/E, EBIT/EBITDA margin). Sanofi’s FY2025 carries two large distortions. Its total net income includes a sizeable gain from discontinued operations (the Opella consumer-health deconsolidation); to keep net margin, ROE and P/E comparable, this analysis uses continuing-operations net income — so Sanofi’s returns and P/E here are lower (and its ROE would rise, its P/E fall, on a total-net-income basis). Separately, Sanofi’s operating income is struck after a large intangible impairment plus heavy acquired-intangible amortisation, which crush its IFRS EBIT margin and ROIC far below the group. Sanofi’s low margins and returns are therefore artefacts of these charges, not underlying operating weakness, and the Novo-versus-Sanofi gap overstates the true operating difference.
Sanofi revenue basis (gross margin, EV/Revenue, EBIT margin). Sanofi revenue here is net sales — the product-sales line comparable to Novo, Lilly and Merck — and excludes a separate “other revenues” line (royalties/distribution). Because that other-revenue amount sits in Sanofi’s reported operating income but not in the margin denominator used here, Sanofi’s EBIT and EBITDA margins carry a small upward bias relative to a strict product-only basis.
AstraZeneca working-capital lines not split (DPO, cash-conversion cycle, DSO). AstraZeneca reports trade payables and trade receivables combined with non-trade items. A DPO computed on the combined line produces an economically meaningless figure (hundreds of days and a large negative cash-conversion cycle), so AstraZeneca’s DPO and CCC are reported as not-meaningful rather than as a misleading number, and its DSO is shown but flagged (receivables include non-trade items). The clean working-capital comparison is limited to Novo, Lilly, Merck and Sanofi. Separately, Merck’s inventory days use current inventory only and exclude long-term inventory classified in other assets.
Valuation multiples market-sourced (all peers; P/E, EV/EBITDA, FCF yield). All P/E, EV/EBITDA and FCF-yield figures — flagged ᵐ — combine current (August 2026) market capitalisation from public aggregators with FY2025 primary-filing fundamentals; they are not strict trailing-twelve-month multiples, and the equity value is not a primary-filing figure. Each peer’s multiple uses its own listing currency consistently, so no cross-currency effect enters the ratio. These are the least “audited” numbers in the section and move with price.
Lilly as the essential comparable (ROIC, ROE, P/E, EV/EBITDA). Lilly and Novo together dominate the GLP-1/incretin market, making each the primary read-across for the other. [Rating and price target withdrawn — see the note at the top.] The four-fold valuation gap encodes the market’s view that Lilly is winning share with the stronger oral and next-generation pipeline — even though the two earn near-identical ROIC. For the return comparison, ROIC is preferred over ROE because Lilly’s (and to a lesser extent Merck’s) equity base is heavily depleted by buybacks, inflating ROE and debt-to-equity relative to Novo and the IFRS peers.
Merck a clean FY2025 print (EBIT/net margin, R&D intensity, P/E). Unlike its recent IPR&D-charged years, Merck’s FY2025 carries no large acquired-IPR&D expense, so its margins are representative of underlying operations and its low P/E reflects the Keytruda 2028 loss-of-exclusivity overhang rather than a distorted earnings denominator. Merck is thus the fairest unadjusted margin comparison in the set.
Leverage excludes IFRS-16 leases (Sanofi, AstraZeneca, Novo). Total debt for all companies is short-term plus long-term interest-bearing borrowings; for the IFRS reporters, separately-stated lease liabilities are excluded. Including them would raise net-debt/EBITDA modestly for Sanofi and AstraZeneca and does not change the ranking, with Novo remaining the least-levered.
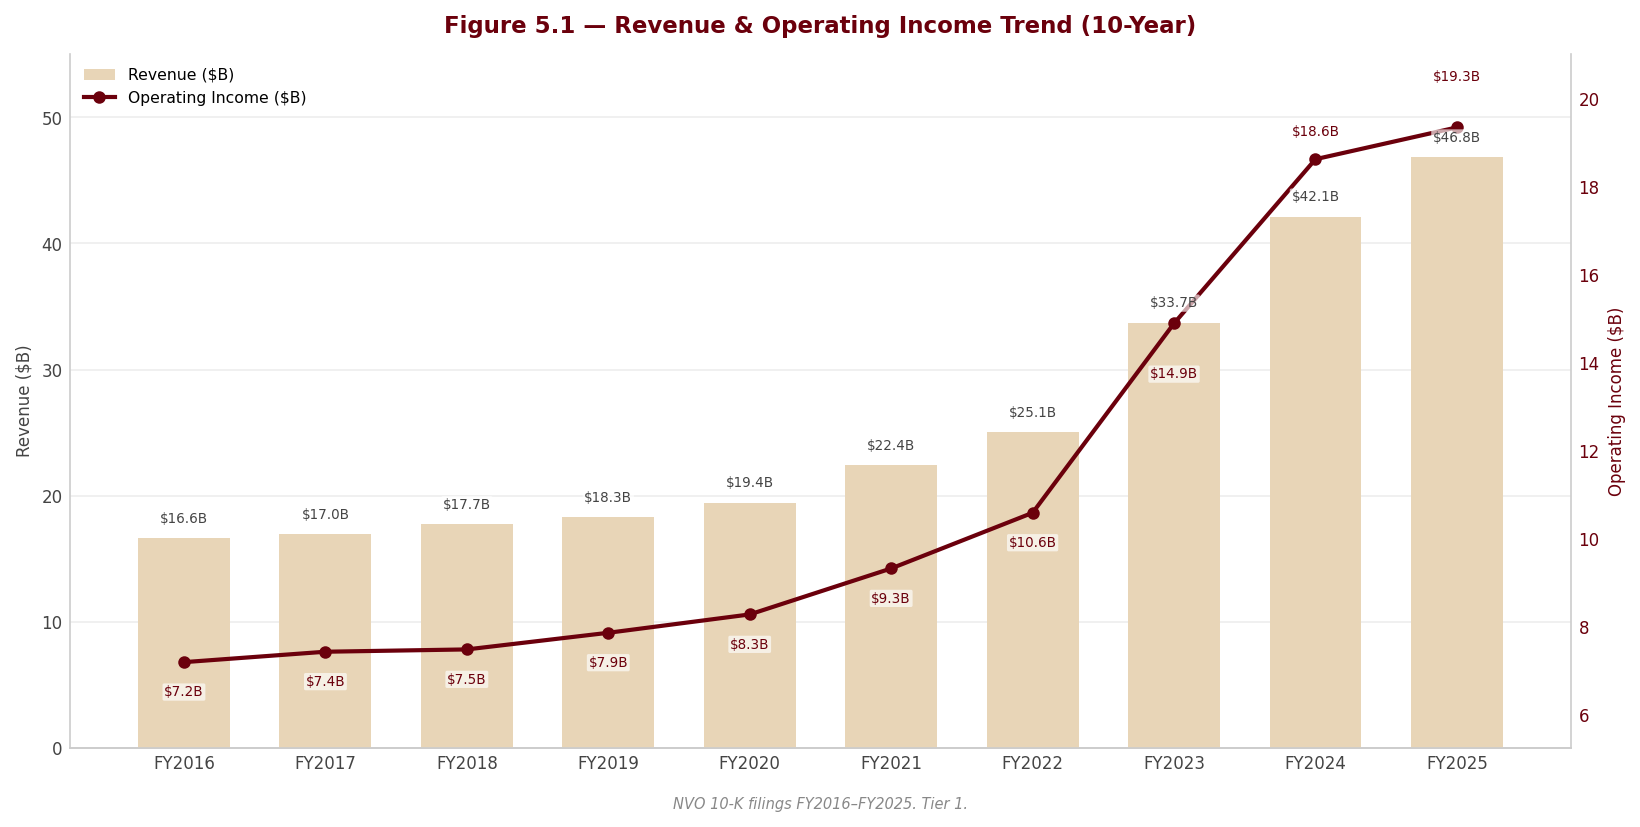
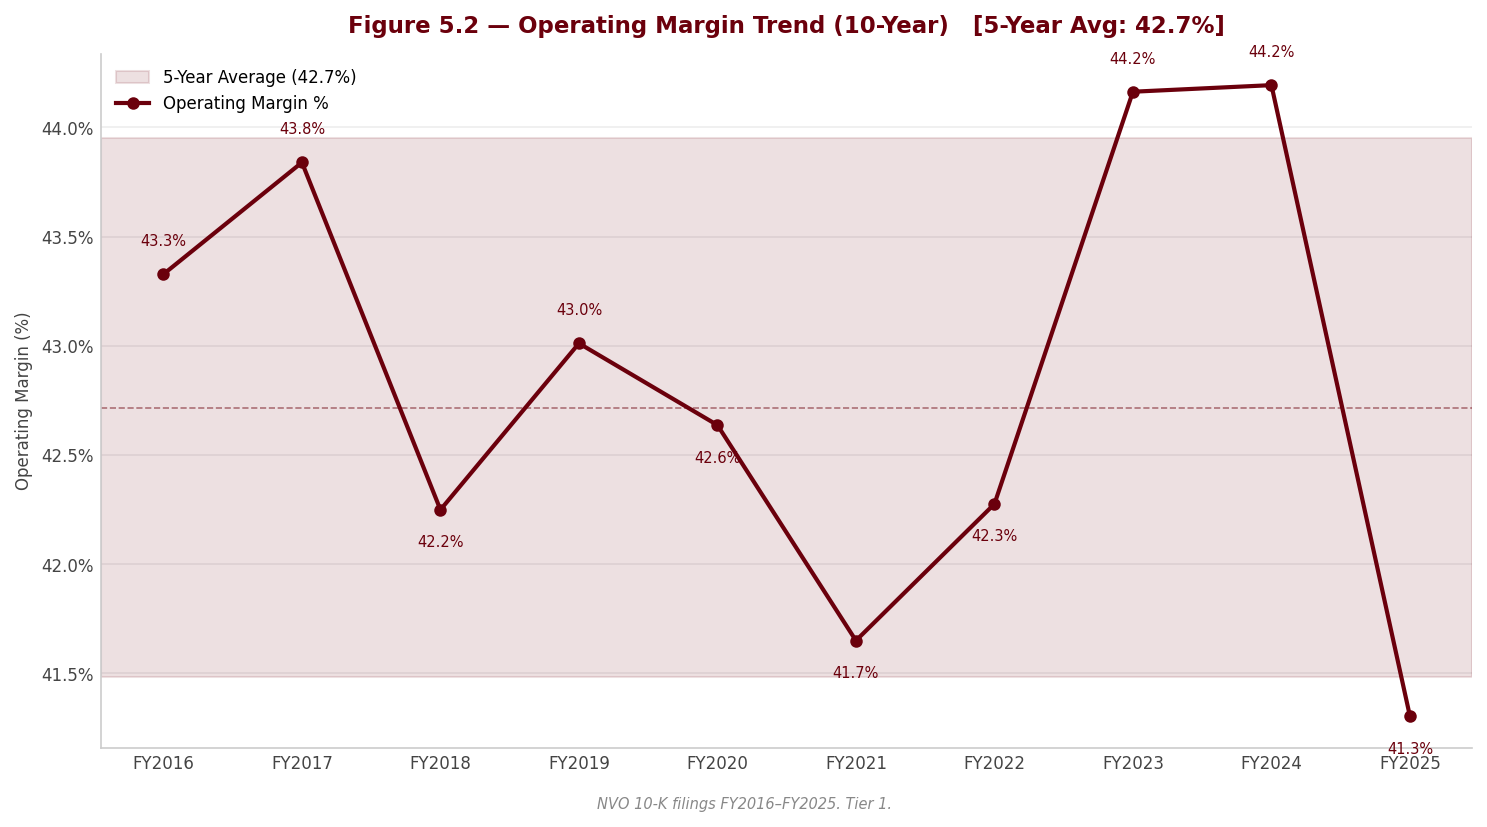
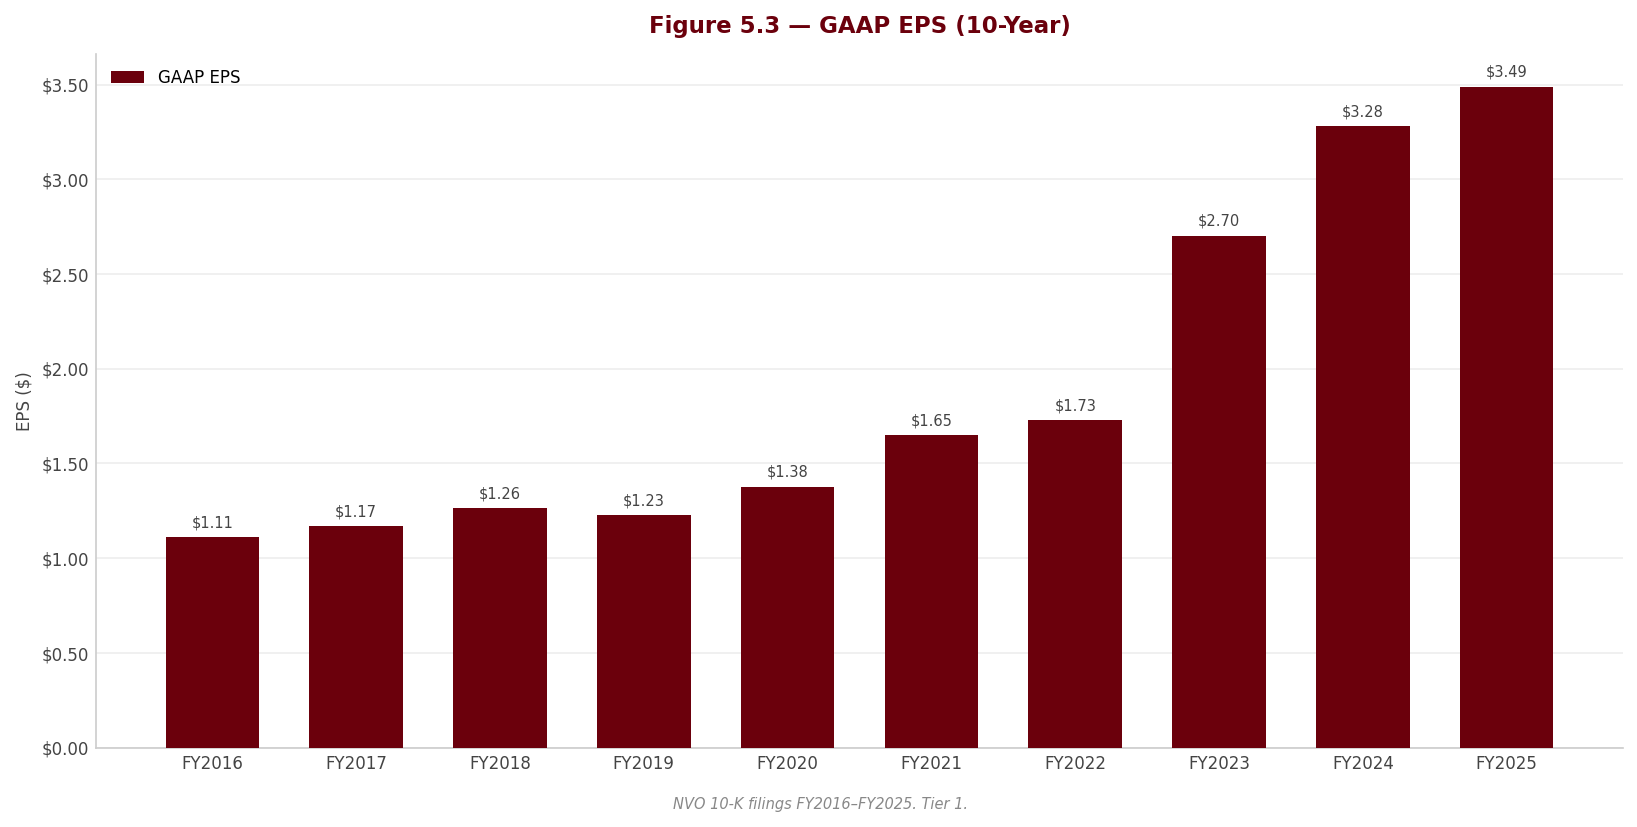
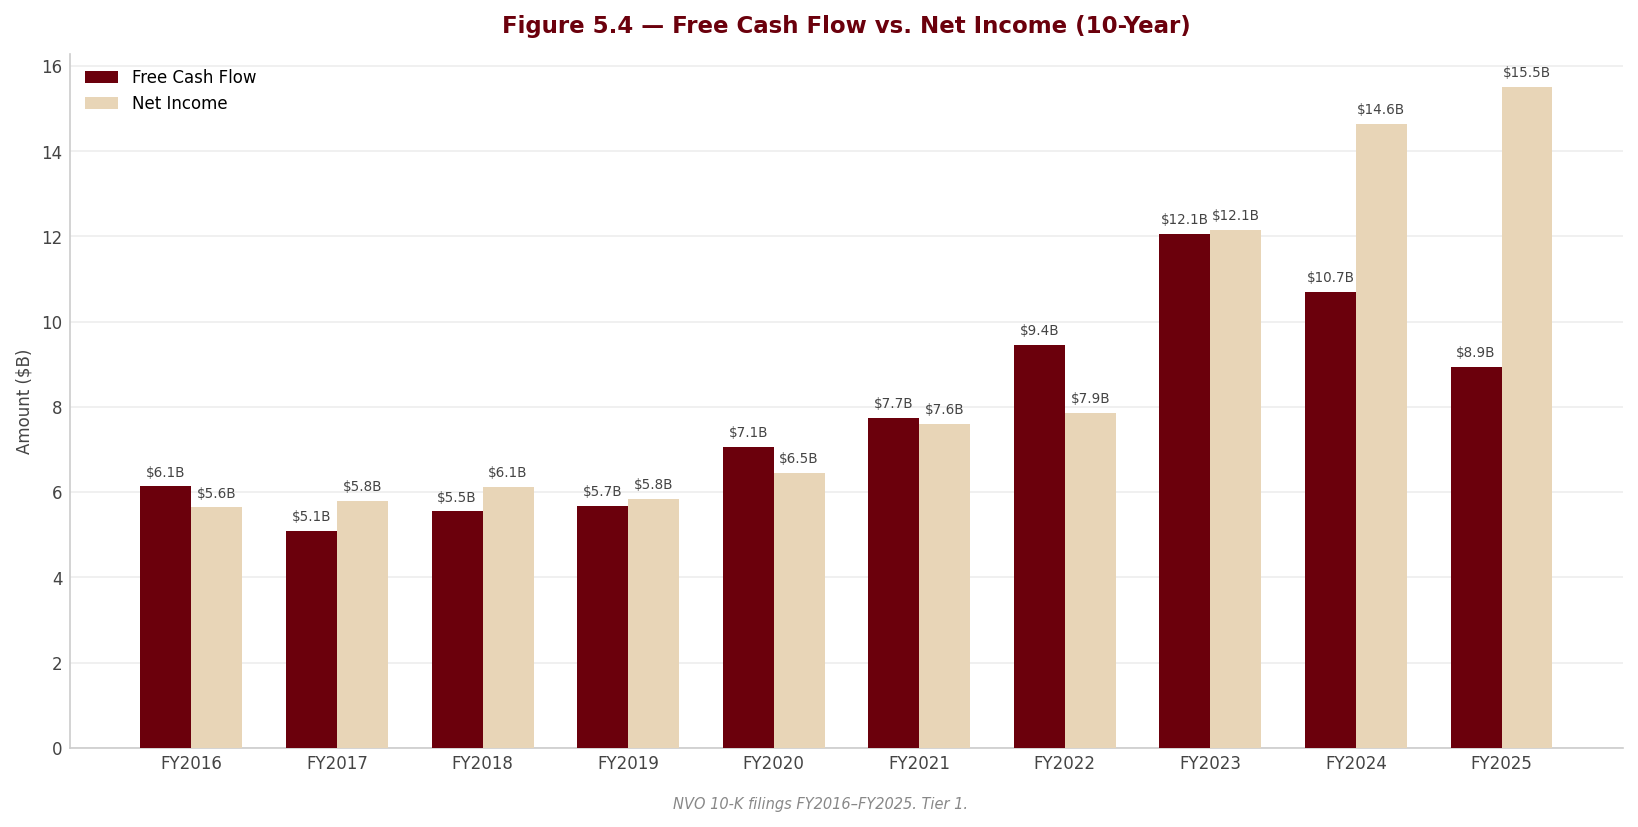
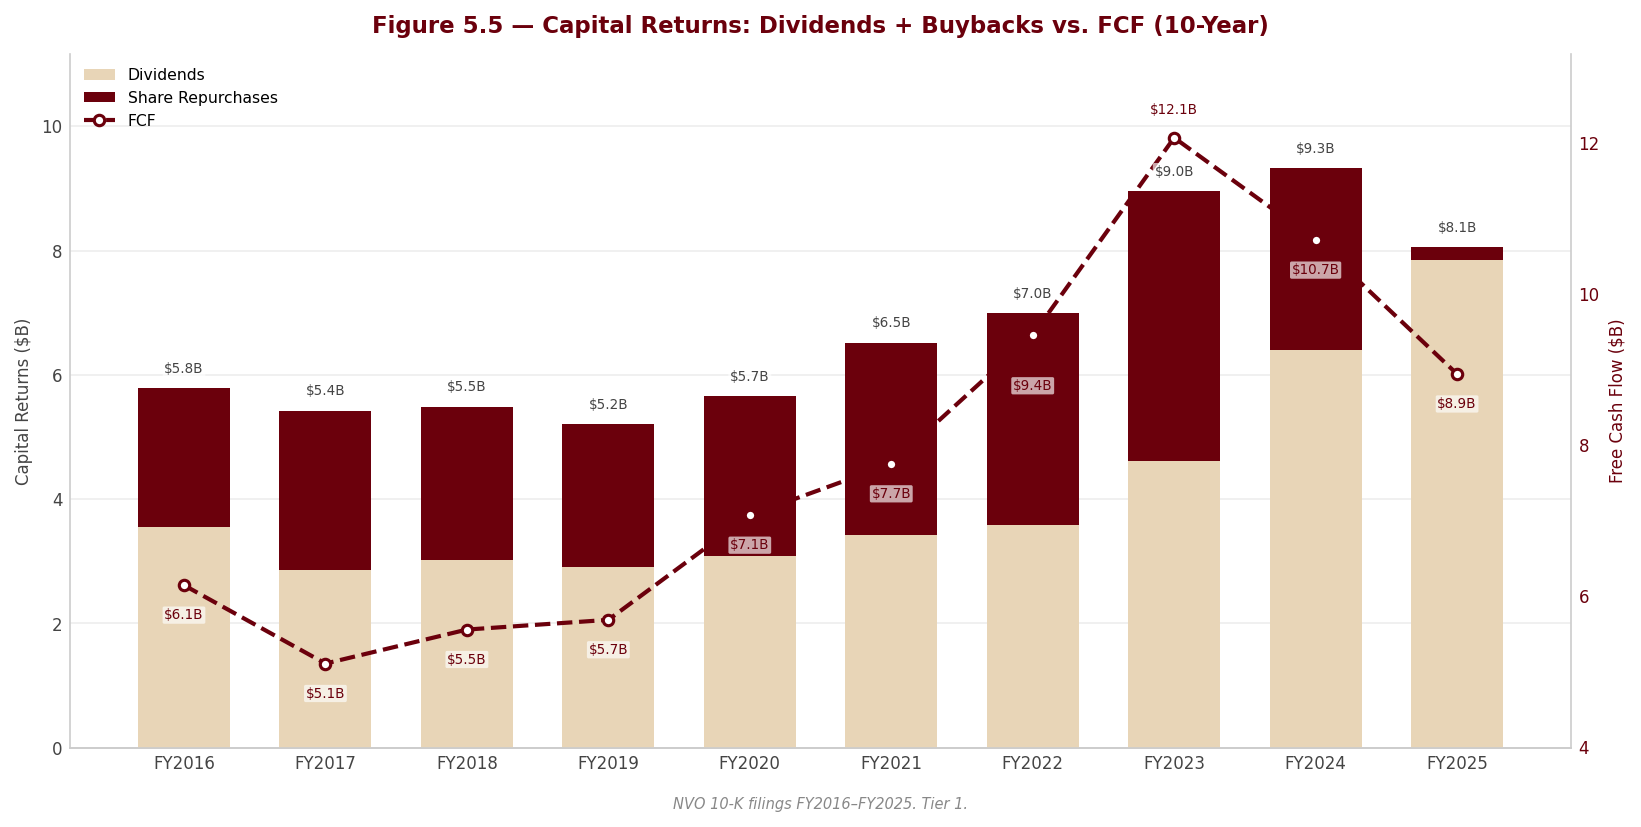
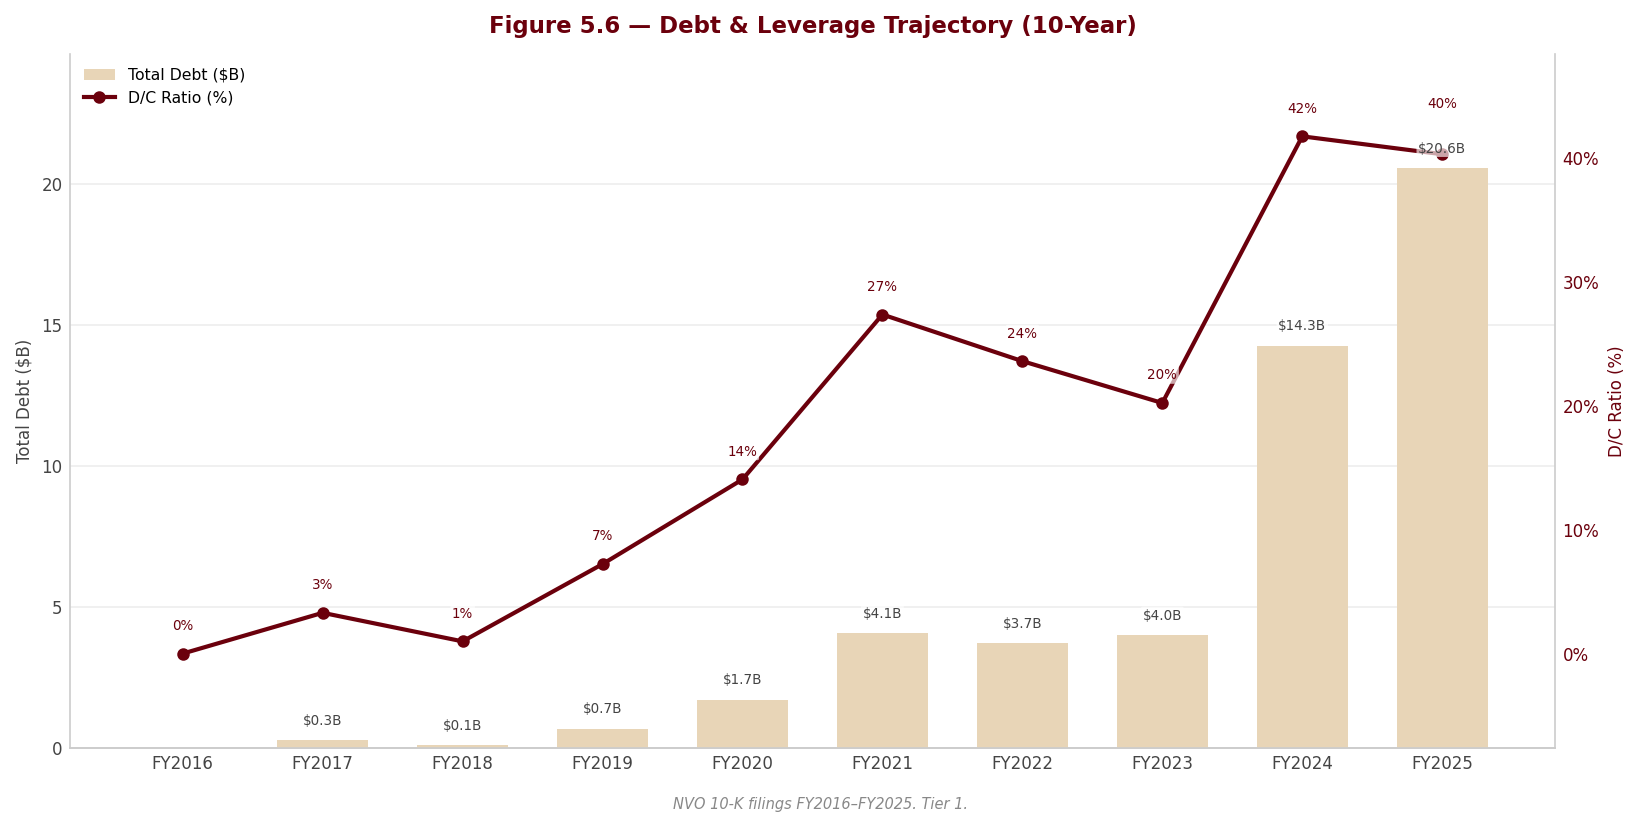
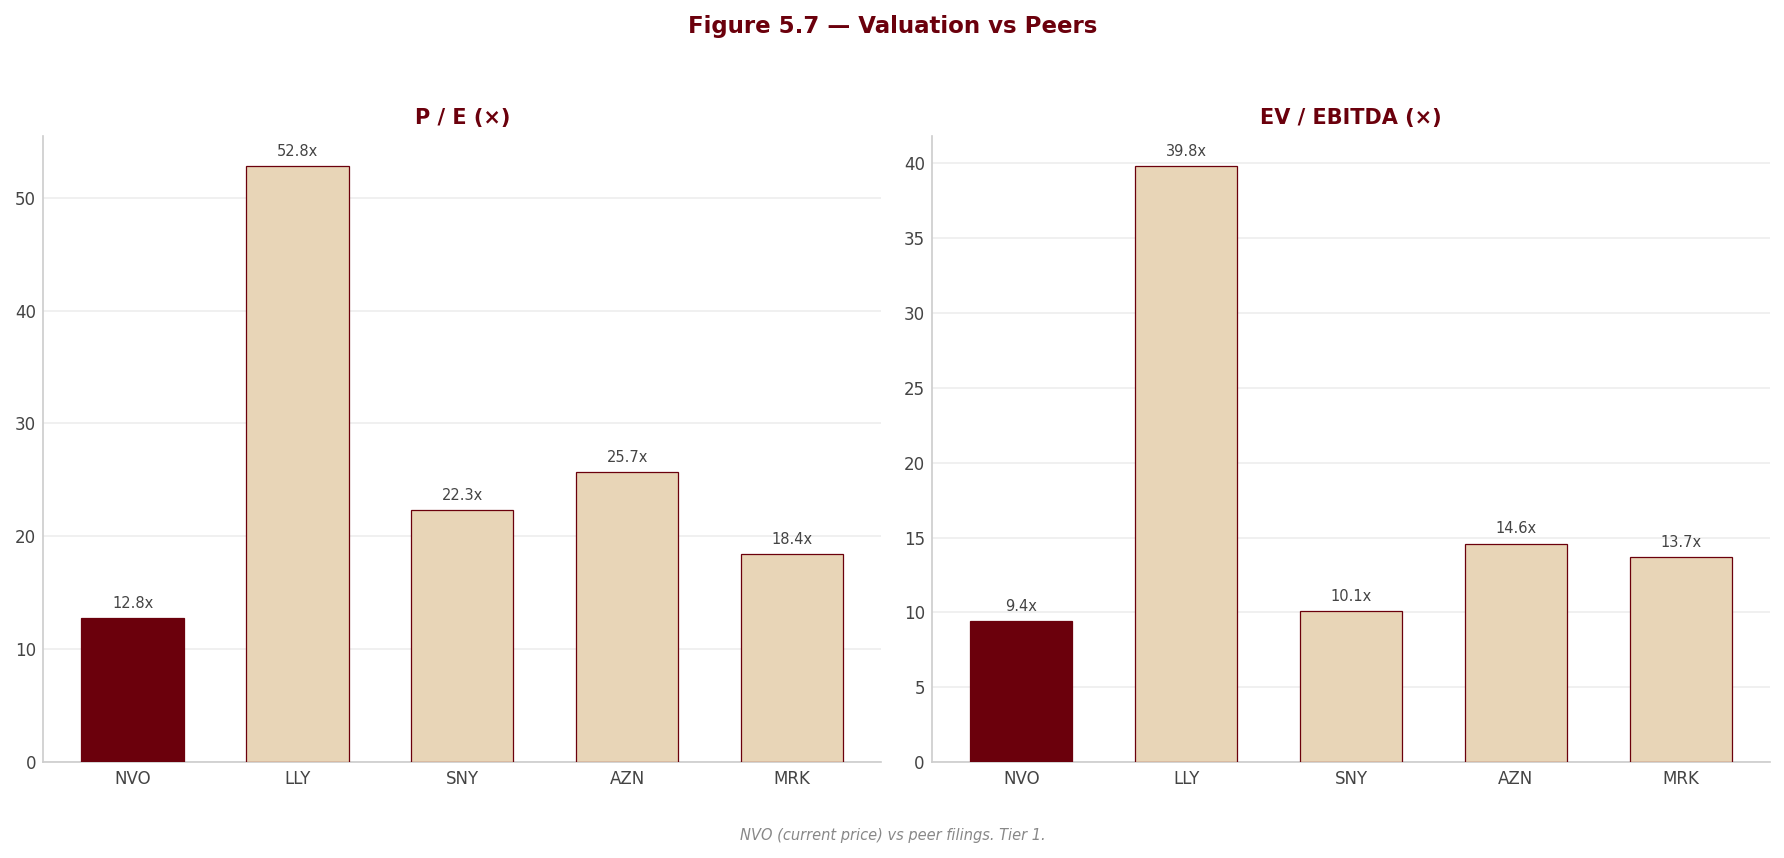
6. Valuation & Price Target withdrawn
This section stated what the shares were worth and what to do about them. It rested on an exit multiple set by hand — across the coverage it averaged 24% below where each company actually traded — so the conclusion largely restated that assumption instead of testing it. Rather than leave it standing, it has been withdrawn while the method is rebuilt.
Nothing else in this report depends on it: the financial analysis above and below is drawn from the company's own filings, and every figure links to the page it was verified against.
Section 7 — Quarterly Update: Q2 2026
Portfolio Action
[Rating and price target withdrawn — see the note at the top.]
| Assessment | |
|---|---|
| Action | [Rating and price target withdrawn — see the note at the top.] |
| Reason | [Rating and price target withdrawn — see the note at the top.] |
| Thesis intact? | PARTIALLY — the volume franchise (Wegovy pill >265,000 weekly US prescriptions; International Operations +10% at CER) is confirmed, but US price erosion (Wegovy injectable US -22% at CER) and the recurring-impairment pattern (F003) both continued exactly as the thesis’s risk case described. |
| Trigger to revisit | [Rating and price target withdrawn — see the note at the top.] |
7.1 Results at a Glance
| Metric | Q2 2026 | Q2 2025 | YoY Δ | Q1 2026 | QoQ Δ |
|---|---|---|---|---|---|
| Revenue ($M) | $12,159.4M | $11,906.8M | +2.1% | $14,999.9M | -18.9% |
| Gross Profit ($M) | $9,510.3M | $9,916.7M | -4.1% | $12,893.3M | -26.2% |
| Gross Margin | 78.2% | 83.3% | -5.1 pp | 86.0% | -7.7 pp |
| EBITDA ($M) | $5,788.6M | $5,930.7M | -2.4% | $9,783.9M | -40.8% |
| EBITDA Margin | 47.6% | 49.8% | -2.2 pp | 65.2% | -17.6 pp |
| EBIT ($M) | $4,192.3M | $5,182.0M | -19.1% | $9,236.1M | -54.6% |
| EBIT Margin | 34.5% | 43.5% | -9.0 pp | 61.6% | -27.1 pp |
| Net Income ($M) | $3,251.6M | $4,105.9M | -20.8% | $7,522.5M | -56.8% |
| Net Margin | 26.7% | 34.5% | -7.7 pp | 50.2% | -23.4 pp |
| Diluted EPS | $0.74 | $0.92 | -20.3% | $1.69 | -56.5% |
Computation basis: YoY Δ = (CQ - PYSQ) / |PYSQ| × 100 — e.g. revenue (78,488 - 76,857) / 76,857 = +2.1% on the native-DKK workbook values, so the percentages are currency-invariant. QoQ Δ = (CQ - PQ) / |PQ| × 100 — e.g. revenue (78,488 - 96,823) / 96,823 = -18.9%. Gross Margin = Gross Profit / Revenue × 100 (61,388 / 78,488 = 78.2% in CQ); EBITDA, EBIT and Net margins computed identically on their respective numerators. Margin Δ in percentage points (pp) = CQ margin - comparison-quarter margin.
The QoQ column is not a clean read. Q1 2026 revenue included the entire DKK 26,760m non-cash 340B rebate-provision reversal (Q2 2026 interim, Appendix 6, p. 33; balance-sheet note 1, p. 28); the company’s own reconciliation puts Q1 2026 adjusted sales at DKK 70,063m (H1 adjusted 148,551 less Q2 78,488, pp. 32–33). On that adjusted base, the underlying sequence is +12.0% QoQ ((78,488 - 70,063) / 70,063), not the -18.9% the reported base shows — the sequential “decline” is overwhelmingly the Q1 one-off washing out. The YoY comparison is the honest read, and even it is depressed: Q2 2025 revenue carried its own DKK 2,649m 340B reversal, so adjusted sales grew +6% in DKK and +7% at CER (interim p. 3, p. 12).
Source: Novo Nordisk Q2 2026 interim report (Form 6-K, 4 August 2026), Appendix 1 condensed income statement, p. 26; Appendix 7 EBITDA reconciliation, p. 36.
7.2 P&L Drivers
sources Revenue: Reported Q2 2026 sales of DKK 78,488m rose +2% in DKK and +3% at CER; on the adjusted basis (stripping the DKK 2.6bn 340B reversal from the Q2 2025 base) growth was +7% at CER, driven by GLP-1 volume growth in both operating units and favourable US rebate adjustments, partly offset by lower realised prices (interim p. 4). The split is stark: US Operations reported sales fell -5% in DKK (-2% at CER; +4% at CER adjusted, and that +4% was itself flattered by rebate adjustments — H1 US adjusted sales are -4% at CER), while International Operations grew +11% in DKK / +10% at CER on volumes, led by EUCAN +17% at CER (interim pp. 4–5). Within US obesity, Wegovy pill contributed DKK 3,141m of new sales, but Wegovy injectable US sales fell -22% at CER on lower realised prices (interim p. 9) — the US franchise is trading price for volume.
Cost and margin: COGS of $$2,649.2M in CQ vs $$1,990.1M in PYSQ rose +33% in DKK against +2% reported sales growth, cutting gross margin -5.1 pp YoY to 78.2%; management attributes the decline to lower realised prices, one-time costs of around DKK 3bn for right-sizing manufacturing-capacity agreements, and negative currency, partly countered by productivity gains and GLP-1 mix (interim p. 12) — the price component is structural, the capacity charge is not. D&A of $$1,596.3M in CQ vs $$748.7M in PYSQ more than doubled because the workbook line carries impairments: DKK 6,699m of impairment losses in Q2 2026 vs DKK 1,089m in Q2 2025, alongside stable underlying depreciation and amortisation of DKK 3,605m vs DKK 3,744m (interim, Appendix 7, p. 36). That is why EBITDA (which adds the impairment back) fell only -2.4% while EBIT fell -19.1%: the DKK 6.3bn non-cash impairment of intangible pipeline assets — including DKK 4.0bn for the terminated monlunabant programme — sits in the R&D cost line (interim p. 12). SG&A of $$2,526.1M in CQ vs $$2,920.1M in PYSQ fell -13% (sales & distribution, at CER) on restructuring savings (interim p. 12). Segment note: the Rare disease segment swung to an operating loss of DKK 1,295m (-26.4% margin) from a DKK 518m profit (+10.5%) in Q2 2025, and Obesity/Diabetes segment margin fell to 38.5% from 45.8% (Appendix 1, p. 26); the interim does not attribute the impairment charge by segment, but the swing lands in the impairment quarter — the recurring acquired-pipeline write-off pattern (forensic flag F003) extended into a third consecutive year.
[Rating and price target withdrawn — see the note at the top.]
7.3 Balance Sheet & Cash Flow
| Metric | Q2 2026 | Q2 2025 | YoY Δ | Q1 2026 | QoQ Δ |
|---|---|---|---|---|---|
| Cash ($M) | $6,891.2M | $2,856.0M | +141.3% | $3,273.0M | +110.5% |
| Net Debt ($M)ᵃ | $14,817.4M | $12,522.7M | +18.3% | $19,404.6M | -23.6% |
| Net Debt / LTM EBITDA | 0.57× | — | — | — | — |
| Total Assets ($M) | $92,168.9M | $74,695.7M | +23.4% | $86,635.1M | +6.4% |
| Equity ($M) | $34,280.5M | $26,037.0M | +31.7% | $31,459.0M | +9.0% |
| OCF ($M)ᵇ | $8,551.5M | $6,318.5M | +35.3% | $3,731.1M | +129.2% |
| CapEx ($M) | $1,963.6M | $2,271.3M | -13.5% | $1,752.3M | +12.1% |
| FCF ($M)ᵇ | $6,587.9M | $4,047.2M | +62.8% | $1,978.8M | +232.9% |
| Dividends Paid ($M)ᶜ | $0.0M | $4,122.1M | -100.0% | $5,470.6M | -100.0% |
Computation basis: YoY Δ = (CQ - PYSQ) / |PYSQ| × 100 — e.g. OCF (55,199 - 40,785) / 40,785 = +35.3% on the native-DKK workbook values; QoQ Δ = (CQ - PQ) / |PQ| × 100 — e.g. OCF (55,199 - 24,084) / 24,084 = +129.2%.
Net Debt / LTM EBITDA: LTM EBITDA = Q3 2025 (31,439) + Q4 2025 (37,298) + Q1 2026 (63,154) + Q2 2026 (37,365) = 169,256 (DKK m, workbook quarterly EBITDA series); Net Debt CQ 95,645 / 169,256 = 0.57×. Caveat: the Q1 2026 EBITDA inside the LTM window includes the DKK 26,760m non-cash 340B release; on an ex-340B LTM EBITDA of 142,496 the ratio is 0.67× — the truer leverage read.
ᵃ Workbook net debt = total borrowings (121,794 + 18,333) - cash (44,482) = 95,645 (DKK m), which includes DKK 8,622m of lease liabilities and does not net DKK 500m of marketable securities; the company’s own definition (excl. leases, net of securities) gives net debt of DKK 86,523m at 30 June 2026 vs DKK 95,424m at year-end 2025 (Appendix 7, p. 37). ᵇ Effective 1 January 2026, interest received is presented in investing and interest paid in financing (previously both in operating), with comparatives restated (Appendix 2, note 1, p. 27), and FCF was redefined as OCF less PP&E purchases only (Appendix 7, p. 37). The workbook’s Q2 2025 comparatives (OCF 40,785; FCF 26,124) were differenced from the pre-restatement 2025 YTD statements; the interim’s restated Q2 2025 standalone figures are OCF 41,774 and FCF 27,113 (Appendix 7, p. 37) — a DKK ~1.0bn presentational (not economic) gap. The filing itself prints standalone Q2 2026 OCF of 55,199 and FCF of 42,524 (p. 37), confirming our YTD-differenced figures exactly. ᶜ Timing, not a cut: the full FY2025 final dividend (DKK 35,312m) was paid in Q1 2026, versus a 2025 cadence that placed DKK 26,608m of payments in Q2; H1 dividends paid were DKK 35,312m vs DKK 35,100m in H1 2025 (Appendix 2, p. 27; Appendix 4, p. 29). The 2026 interim dividend of DKK 3.75/share was declared with this report for payment in August (p. 14).
Source: Q2 2026 interim report, Appendix 3 condensed balance sheet, p. 28; Appendix 2 condensed cash flow statement, p. 27; Appendix 7 free-cash-flow and net-debt reconciliations, p. 37.
[Rating and price target withdrawn — see the note at the top.] Trade receivables have built to DKK 88,949m from DKK 70,856m at year-end (+DKK 18.1bn), the main driver of the DKK -19,912m H1 working-capital outflow (Appendix 3, p. 28; Appendix 2, p. 27) — a line to watch given falling US realised prices.
Cash flow note: FCF conversion = FCF / Net Income = 42,524 / 20,989 = 202.6% in Q2 2026 — cash far outran earnings because DKK 6,699m of the P&L charge was non-cash impairment and because of favourable timing of US rebate and tax payments plus expense phasing that management itself flags as timing (interim p. 14; Appendix 7, p. 36). CapEx of DKK 12,675m (-13.5% YoY) confirms the capacity super-cycle is past peak, consistent with full-year guidance of around DKK 55bn versus DKK 60bn in 2025 (interim p. 16).
7.4 Footnote Review
sources The Q2 2026 filing is a Form 6-K interim report under IAS 34 (condensed statements in Appendices 1–4, non-IFRS notes in Appendices 5–7), not a 10-Q; the note review below covers every note and appendix disclosure in the filing. Internal report page numbers are cited. §
Basis of preparation and accounting policies (interim pp. 3, 24) Prepared under IAS 34 as adopted by the EU; accounting policies are consistent with the Annual Report 2025 except the presentation changes described in note 1 to Appendix 2. Confirmed unchanged vs. Q2 2025 in recognition and measurement (interim p. 24). Two caveats: the statements are explicitly unaudited and not reviewed by the independent auditors (p. 24), and the sole change is presentational (below).
Cash-flow presentation change — interest reclassification (Appendix 2, note 1, interim p. 27) Effective 1 January 2026, interest received (DKK 342m in H1 2026) is presented in investing activities and interest paid (DKK 2,759m) in financing activities; both previously sat in operating cash flow, and comparatives are restated. Changed vs. Q2 2025 presentation. Analytical significance: the reclass mechanically lifts reported OCF by the net interest paid (~DKK 2.4bn in H1) relative to the old basis — a small but permanent flattering of the OCF line that compounds with the 2026 FCF redefinition (below).
340B provision reversal (Appendix 3, note 1, p. 28; Appendix 6, pp. 32–33; Appendix 7, pp. 34–35) The balance-sheet note confirms the USD 4.2bn (DKK 26.8bn) 340B provision inside ‘Sales deductions and product returns’ was fully reversed in Q1 2026. Appendix 6 reconciles reported to adjusted sales line-by-line: the DKK 26,760m H1 release sat mostly in Injectable GLP-1 diabetes (DKK 15,401m, of which Ozempic 12,655m), insulin (7,139m), obesity (2,431m) and rare endocrine (1,246m). Q2 2026 itself carried zero 340B benefit, while Q2 2025 carried DKK 2,649m — so this quarter is the first clean reported quarter since the saga began, and its YoY comparison is penalised, not helped, by 340B. Changed vs. PYSQ (realisation of forensic flag F001). [Rating and price target withdrawn — see the note at the top.]
Segment information (Appendix 1, interim p. 26) Obesity & Diabetes care: Q2 sales DKK 73,581m (+2% reported), operating profit DKK 28,356m, margin 38.5% vs 45.8% in Q2 2025. Rare disease: sales DKK 4,907m (0% in DKK), operating loss of DKK 1,295m (-26.4% margin) vs a DKK 518m profit (+10.5%) a year ago. Changed materially vs. PYSQ. Significance: the interim does not split the DKK 6.3bn impairment by segment, but both segments’ margin deterioration lands in the impairment quarter; a segment of the group is loss-making at the operating line for the first time in the covered quarterly history, and the EBITDA/D&A lines carry the charge (Appendix 7, p. 36).
Impairments and adjusted-measure definitions (interim p. 12; Appendix 7, pp. 34–36) Q2 2026 impairment losses of DKK 6,699m (vs 1,089m in Q2 2025), of which DKK 6,519m on intangible assets — the DKK 6.3bn “major impairments” adjustment includes DKK 4.0bn for monlunabant, whose development was terminated “due to portfolio considerations” (p. 19). The new 2026 adjusted framework excludes “major impairments” and “major legal matters” above DKK 1bn (pp. 34–35). Changed vs. PYSQ — escalation of forensic flag F003. Significance: this is the third consecutive year of >DKK 4bn acquired/in-licensed pipeline write-offs (ocedurenone 5.65bn in 2024; 7.3bn total in 2025; 6.3bn+ in 2026); these are a recurring cost of the in-licensing strategy and should not be treated as one-offs, yet the adjusted measures now exclude them by construction. The ZEUS readout (below) makes a further Q3 charge plausible.
Equity statement, dividends and buybacks (Appendix 4, p. 29; interim p. 14) Equity rose to DKK 221,277m (37.2% of assets vs 35.7% at year-end 2025). H1 returns: dividends DKK 35,312m + buybacks DKK 5,899m = DKK 41.2bn. An interim dividend of DKK 3.75/share was declared (payment 18/25 August 2026). Under the DKK 15bn 2026 buyback programme, 27,064,179 B shares had been repurchased for DKK 7,533m as of 3 August; treasury shares total 44,249,480 B shares. Changed vs. PYSQ: buybacks restarted at scale (H1 2025: DKK 1,388m). Significance: capital returns are running again while leverage falls — consistent with the post-Catalent balance-sheet normalisation.
Borrowings and net debt (interim p. 14; Appendix 7, p. 37) [Rating and price target withdrawn — see the note at the top.] Company-defined net debt fell to DKK 86,523m from DKK 95,424m at year-end. Changed vs. PYSQ (deleveraging). No covenant disclosures appear in the interim; none were flagged in the FY2025 annual report either.
Free-cash-flow definition change (interim p. 3, footnote 2; Appendix 7, p. 37) FCF is now OCF less PP&E purchases only — intangible purchases (DKK 854m in H1) and acquisitions no longer reduce FCF — with comparatives restated. Changed vs. the 2025 definition (forensic flag F004). Significance: the redefinition raises reported FCF by construction; in a quarter with modest intangible spend the distortion is small, but in an Akero-style quarter (DKK ~30bn of intangible purchases in FY2025) it would be enormous. The filing transparently prints the standalone quarterly reconciliation (Q2 2026 OCF 55,199 → FCF 42,524), which we use.
FX and hedging (interim p. 16) Average H1 USD/DKK fell -6% YoY (640 vs 684); a 5% USD move impacts 12-month adjusted operating profit by DKK 4,970m; USD, CNY and JPY hedged 12 months, CAD and GBP unhedged. Changed vs. PYSQ in level (weaker USD is the main reason DKK growth trails CER growth by ~1–2 pp across the P&L). Standard hedging policy otherwise confirmed unchanged vs. Q2 2025 (p. 16).
Income taxes (interim p. 12) [Rating and price target withdrawn — see the note at the top.] Marginal change only; the drift remains upward (F011). No new uncertain-tax-position disclosure in the interim.
Related-party transactions (no note in this filing; interim pp. 24, 26–37 reviewed) The condensed interim contains no related-party note — IAS 34 does not compel one absent material new transactions, but the reader should know the standing exposures from the Annual Report 2025 (note 5.4, pp. 111–112): Novo Nordisk is controlled by Novo Holdings A/S (28.1% of capital, 77.3% of votes; ultimate parent the Novo Nordisk Foundation), bought the three Catalent fill-finish sites from that controlling shareholder for DKK 82,146m in December 2024 with closing-mechanism true-ups still open and to be booked through P&L, and transacts recurringly with Novo Holdings’ other arms (FY2025: Catalent services DKK 743m; Novonesis DKK 280m; Altasciences DKK 103m; NNIT DKK 237m; dividends to Novo Holdings DKK 14,591m). This quarter’s filing discloses no new related-party transaction and no update on the Catalent true-up; the H1 dividend of DKK 35,312m was paid pro-rata to all shareholders including Novo Holdings, and no direct buyback from Novo Holdings is disclosed (the buyback runs under MAR safe-harbour rules, p. 14). Terms of existing arrangements: no change disclosed. The absence of an update on the open Catalent closing mechanism (forensic flag F002) means that P&L exposure remains live and unquantified.
Contingencies and litigation (interim p. 23) Five matters are disclosed, four of them new or changed this quarter: (1) IRA pricing litigation — CLOSED: on 18 May 2026 the US Supreme Court denied certiorari; no further appeals possible. (2) Ozempic ANDA (new): Cipla filed an ANDA with Paragraph IV certifications for generic Ozempic; Novo Nordisk has sued for patent infringement in D.N.J. — the first direct US challenge to semaglutide exclusivity, no trial date or amount stated. (3) Data breach class actions (new): multiple US putative class actions following the IT-security incident disclosed 11 June 2026; no amount stated. (4) UPC semaglutide revocation (new): on 30 June 2026 Sandoz filed to revoke the Unitary Patent covering the 1mg diabetes dose in 18 EU countries. (5) Novo v. Lilly (new, offensive): false-advertising suit filed 21 July 2026 in D.N.J. The interim provides no provision amounts and no update on the GLP-1 product-liability MDL or the two securities class actions described in the Annual Report 2025 (note 3.6, p. 99) — those matters stand as last disclosed (F008). Significance: the patent-attack matters (Cipla, Sandoz) open a new front on the core molecule; none is quantified.
Subsequent events (interim pp. 2, 14, 16, 18–20, 23; no separate subsequent-events note) Events after 30 June 2026 disclosed in the filing: EMA approvals of Wegovy pill and Wegovy 7.2 mg single-dose pen (both July, p. 18); Wegovy pill UK launch (early July, p. 7); ZEUS phase-3 failure announced in July with an explicit warning that it “may result in a non-cash impairment charge in Q3 2026” (p. 20); US Bridge programme (Medicare Part D obesity coverage) effective 1 July with encouraging early uptake (p. 5); Novo v. Lilly suit filed 21 July (p. 23); interim dividend DKK 3.75/share declared 4 August for August payment and buyback progress through 3 August (p. 14); and the pre-announced ~50%/35% WAC list-price cuts on Wegovy/Ozempic effective 1 January 2027, with cash-flow impact expected in 2027 (p. 16).
7.5 What Changed This Quarter
sources - Guidance was raised, not cut, for the first time in the 2026 cycle: adjusted sales and adjusted operating profit growth are now both guided at 0% to -6% at CER, from -4% to -12% on 6 May, on stronger GLP-1 momentum; FCF guidance rose to DKK 45–55bn from 36–46bn (interim p. 15). Thesis implication: the underlying year is still flat-to-down — the report’s core “ex-340B the business is not growing” framing survives — but the tail scenario of an accelerating collapse got smaller. - The underlying growth mix improved but stayed price-poisoned in the US: Q2 adjusted sales +7% at CER, with International +10% on volume, but US Wegovy injectable -22% at CER on realised price and the US +4% print itself boosted by rebate adjustments; Wegovy pill added DKK 3,141m US sales on 2.9 million Q2 prescriptions (interim pp. 4–5, 9). Thesis implication: volume leadership is intact; US price per unit is the battleground, and the 1 January 2027 WAC cuts (~50% Wegovy) plus MFN keep it so. - The recurring-impairment pattern escalated (F003): DKK 6.3bn of non-cash intangible impairments in the quarter (monlunabant DKK 4.0bn), the Rare disease segment swung to a DKK 1,295m operating loss (-26.4% margin), and the July ZEUS failure was explicitly flagged as a possible Q3 2026 impairment trigger (interim pp. 12, 26, 20). Thesis implication: pipeline write-offs are a recurring economic cost of the in-licensing strategy — reported EBIT -19.1% YoY is the honest P&L; the adjusted +11% CER excludes precisely this cost. - Gross margin broke below 80%: 78.2% vs 83.3% reported (82.7% adjusted) in Q2 2025 — lower realised prices, ~DKK 3bn one-time capacity right-sizing costs, and FX (interim p. 12). Thesis implication: even after the one-off, price erosion is now visible in gross margin, not just in revenue growth. - Cash generation and the balance sheet turned decisively better: standalone Q2 FCF DKK 42,524m (+62.8% YoY, conversion 202.6% of net income, partly timing), CapEx -13.5% YoY past the super-cycle peak, company-defined net debt down to DKK 86,523m, buybacks restarted (DKK 7.5bn executed by 3 August under the DKK 15bn programme) (interim pp. 14, 37). Thesis implication: the F007 leverage/FCF concern is easing on schedule.
7.6 Portfolio Decision
sources [Rating and price target withdrawn — see the note at the top.] [Rating and price target withdrawn — see the note at the top.] On the negative side, reported EBIT fell -19.1% YoY to $4,192.3M, gross margin lost -5.1 pp, the Rare disease segment posted a DKK 1,295m operating loss, and the impairment engine (DKK 6.3bn this quarter, ZEUS queued for Q3) keeps converting acquired pipeline into write-offs — confirming the earnings-quality core of the thesis (F001/F003/F004). On the positive side, the underlying business returned to growth (+7% adjusted CER, +12.0% underlying QoQ), management raised full-year guidance for the first time in the cycle, FCF conversion hit 202.6%, and net leverage at 0.57× (0.67× ex-340B) with buybacks restarted removes the balance-sheet worry. The footnote review adds two cautions that argue against upgrading on this print: the new Cipla ANDA and Sandoz UPC actions open the first direct patent attacks on semaglutide, and the ~50% Wegovy WAC cut effective January 2027 means the US price reset is not finished. A quarter that is better than feared but structurally unchanged supports holding the position, not adding to it.
What would change this view: - Upgrade condition: two consecutive quarters of positive US Operations adjusted sales growth at CER with adjusted gross margin held at or above 78%, or FY2026 adjusted growth landing at the top of the 0% to -6% range with no Q3 ZEUS impairment above DKK 2bn — evidence the price reset has bottomed with volume leadership intact. [Rating and price target withdrawn — see the note at the top.]
Report Versions
Every published version of this report, newest first — each one kept so a reader can see what changed and when.
| Version date | Files |
|---|---|
| 2026-08-19 Current | Model (Excel) |
| 2026-08-18 | Model (Excel) |
| 2026-08-17 | Model (Excel) |