
NVIDIA Corporation
Section 1 — Business Overview, Operations & Competitive Positioning
sources
1.1 The Business
sources NVIDIA sells the compute engine of the artificial-intelligence build-out: it designs the accelerated-computing processors — and, increasingly, the complete rack-scale systems, networking, and software that surround them — on which the world’s largest cloud and enterprise customers train and run AI models, and it captures the economics of that shift through hardware sold at extraordinary gross margins wrapped in a proprietary software platform (CUDA) that keeps developers, and therefore customers, on NVIDIA silicon.
That is the whole of the economic model, and it is worth stating plainly because the marketing language (“a data-center-scale AI infrastructure company reshaping all industries”) obscures a simpler truth: the overwhelming majority of NVIDIA’s $215,938.0M of FY2026 revenue is the sale of data-center accelerators and the systems built around them to a small number of very large buyers. The company operates a fabless model — it designs the chips and outsources fabrication, assembly, test, and packaging to a concentrated set of Asian partners led by TSMC — so its capital intensity is modest relative to its revenue and its returns are driven by design leadership and pricing power rather than by owning factories. Revenue is generated worldwide, billed predominantly in U.S. dollars, and the workforce is globally distributed, heavily technical, and weighted toward employees holding advanced degrees, with management citing low turnover and equity-heavy compensation designed to align staff with shareholders; more than half of NVIDIA’s engineers work on software, which is the mechanism by which the hardware franchise is defended. The shares trade under the ticker NVDA. What makes the business distinctive as an investment is the combination of a genuine software moat with a demand base that is, as later sections show, unusually concentrated and unusually exposed to policy risk — a combination that produces best-in-class margins today and an unusually wide range of outcomes tomorrow.
Key Information
| Item | Value |
|---|---|
| Ticker | NVDA |
| Sector / Industry | Semiconductors |
| Report Date | 2026-08-01 |
| Most Recent FY Revenue | $215,938.0M |
| EBIT Margin (Most Recent FY) | 60.4% |
| Diluted Shares Outstanding | 24,514M |
| Current Price | $200.75 |
Source: Company SEC filings (10-K); see Appendix A.1.
1.2 Operating Segments
sources NVIDIA reports two operating segments — Compute & Networking, and Graphics — and management notes it does not identify or allocate assets by segment, which limits the balance-sheet granularity available to an analyst.
Compute & Networking is the business. It houses the Data Center accelerated-computing and networking platforms, the AI software and solutions, and the Automotive (autonomous- and electric-vehicle) platforms. The economic variable that drives it is data-center capital spending by hyperscalers and AI model builders — the pace at which a handful of very large customers commit capital to building AI infrastructure. Within this segment, Data Center compute is powered by the Blackwell architecture family (Blackwell and, scaled during FY2026, Blackwell Ultra), which management states represented the majority of Data Center revenue, with the next-generation Rubin platform unveiled and production shipments guided to the second half of the following fiscal year. Networking — NVLink interconnects and switches, InfiniBand, and Ethernet — is increasingly inseparable from the compute story, reflecting management’s framing that the data center, not the chip, has become “the new unit of computing.” The single most important interpretive point about this segment is that its growth is a leveraged bet on the continuation of an unprecedented AI capital-spending cycle among a few counterparties.
Graphics is the legacy franchise and the origin of the company: GeForce GPUs for PC gaming and the GeForce NOW cloud-gaming service, plus Quadro/NVIDIA RTX GPUs for professional workstation visualization. Its driver is consumer and professional PC demand, seasonally stronger in the second half of the fiscal year for desktop gaming. Graphics is now a small fraction of the whole, and management has flagged supply constraints as a Gaming headwind into the next fiscal year — a reminder that even the “consumer” business is now subordinated to the allocation of scarce Blackwell wafers toward the far more lucrative data-center demand.
The way the two segments fit together is the source of both the flywheel and the fragility. The flywheel is real: a single unified architecture and the CUDA software layer let NVIDIA amortize its R&D across gaming, professional visualization, automotive, and data center simultaneously, so each new architecture generation reaches multiple end markets at once, and the RTX GPUs that sell into workstations run the same Tensor Core technology as the data-center parts, deepening the developer base that reinforces the platform. The fragility is that this diversification is now largely nominal — the economics are overwhelmingly concentrated in one segment, one product family (Blackwell), and, as Section 2 details, a very small number of customers. A business that looks diversified across four end markets is, in cash-flow terms, a concentrated wager on data-center AI.
1.3 Geographic Exposure
sources NVIDIA is a global business whose reported geographic mix should be read with care. Management assigns revenue to a geographic region based on the headquarters location of its direct customers — a basis it changed mid-year in FY2026, recasting prior periods — which frequently differs from where the end customer sits or where product ships. Under this basis the United States is by far the largest region, a substantial share of revenue still comes from customers headquartered outside the U.S. (a share that declined year over year), and large “geographies” such as Taiwan function substantially as billing and assembly pass-throughs rather than end markets. The practical implication is that the geographic revenue table cannot be used, unadjusted, to infer true end-market demand — a point Section 3 develops.
Currency exposure at the transaction level is muted because revenue is billed predominantly in U.S. dollars; the more consequential geographic exposures are political and regulatory rather than translational. Two stand out and are treated in full in Section 2: the effective foreclosure of NVIDIA from China’s data-center compute market under U.S. export controls — which has already shrunk what was a major region and, in management’s own words, is helping competitors build larger ecosystems worldwide — and the concentration of critical operations, finished-goods inventory, and key suppliers in Asia, including geographies carrying geopolitical tension (China, Taiwan, Korea, Israel). NVIDIA is expanding manufacturing into the U.S. and Latin America to add resilience, but that expansion is nascent and its own execution risk is noted below.
1.4 Management Team
sources The defining feature of NVIDIA’s leadership is continuity anchored on its founder. Jensen (Jen-Hsun) Huang has served as President, CEO, and a director since he co-founded the company, and the senior team around him — including a long-tenured CFO, and EVPs of Worldwide Field Operations, Operations, and General Counsel — has extensive tenure with no CEO change or succession event disclosed. For an investor, this is genuinely double-edged. On the credit side, the team that built the CUDA ecosystem and made the early, non-consensus bet on GPU computing for AI is still in place and executing an aggressive one-year product cadence; the strategic clarity and speed that leadership has demonstrated are a real asset in a market defined by rapid technological change.
On the risk side, the same continuity concentrates institutional knowledge and strategic vision in a founder-CEO, and the filing itself acknowledges heavy dependence on the longstanding executive team and the importance — but not the specifics — of effective succession planning and knowledge transfer. This is a classic key-person exposure: the market’s confidence in NVIDIA’s ability to sustain its cadence and its ecosystem advantage is inseparable from confidence in Huang personally, and no clear succession framework is disclosed to mitigate it. Investors should treat management quality as a current strength and succession as an unquantified, under-disclosed tail risk rather than a resolved question.
1.5 Capital Allocation Track Record
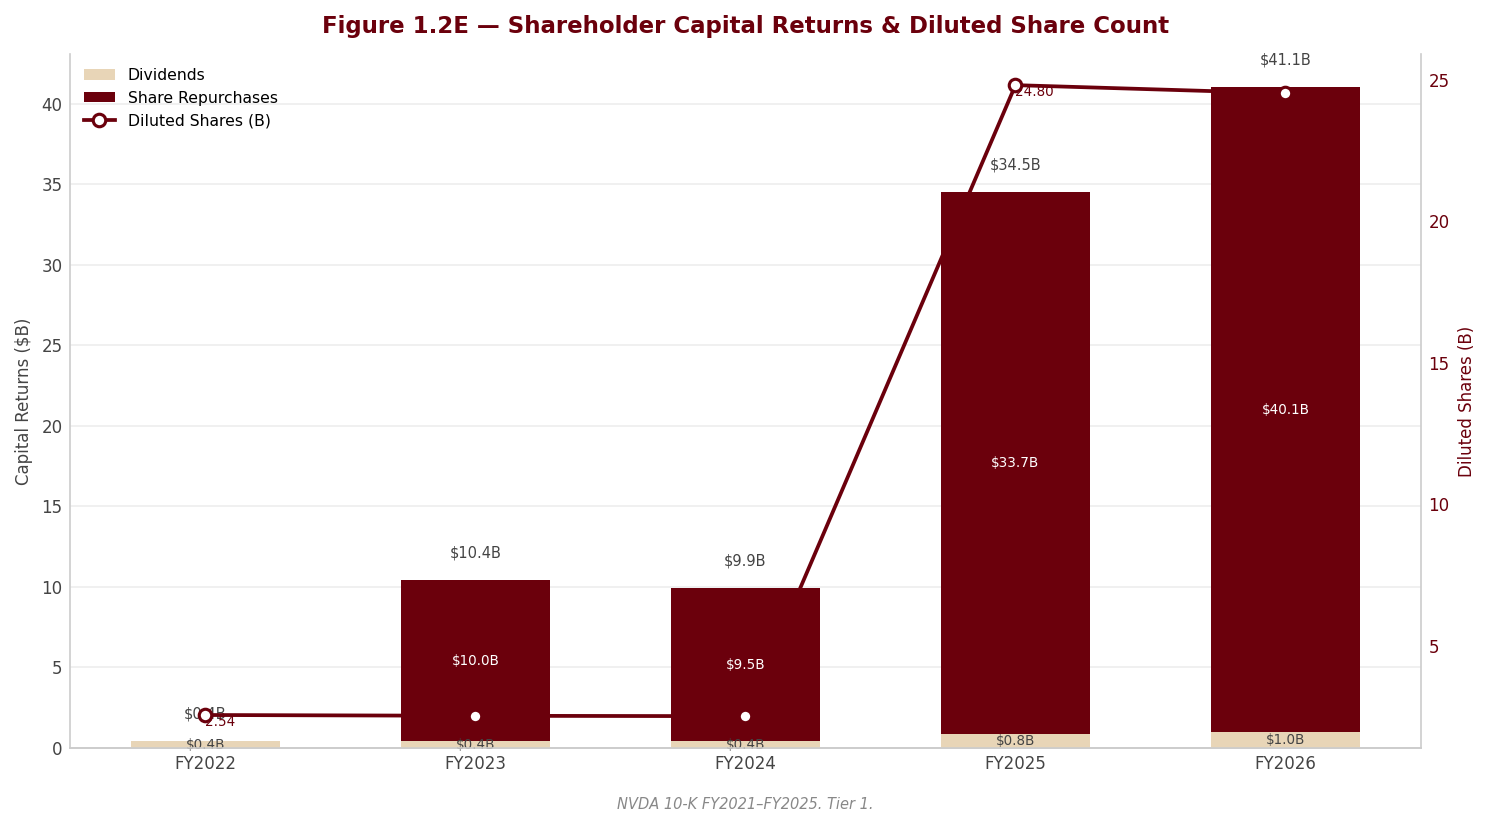
| Year | Dividends Paid ($M) | Share Repurchases ($M) | CapEx ($M) |
|---|---|---|---|
| FY2022 | $399.0M | — | $976.0M |
| FY2023 | $398.0M | $10,039.0M | $1,833.0M |
| FY2024 | $395.0M | $9,533.0M | $1,069.0M |
| FY2025 | $834.0M | $33,706.0M | $3,236.0M |
| FY2026 | $974.0M | $40,086.0M | $6,042.0M |
Source: Company SEC filings (10-K); see Appendix A.1.
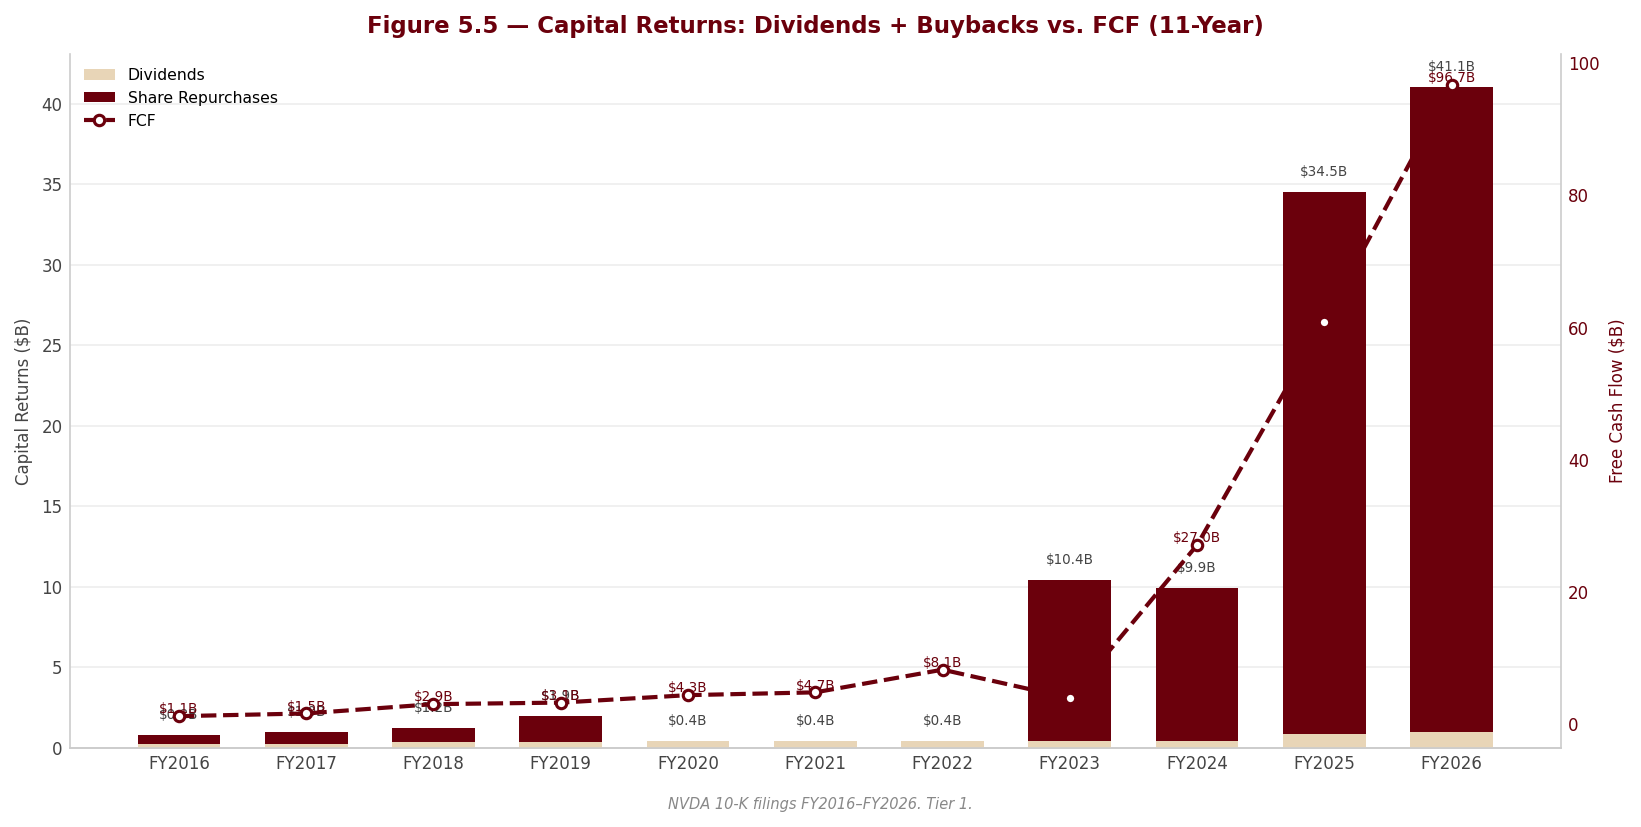
Management’s capital-allocation priorities are clear from the mix. First, the fabless model keeps direct capital expenditure modest relative to revenue — NVIDIA does not fund fabs, so its physical asset base is light and its cash generation converts to distributable cash rather than being reinvested in plant; management has nonetheless guided to higher capital expenditure in the following fiscal year to support growth, so the CapEx line is rising off a low base rather than signalling a shift to a capital-heavy model. Second, shareholder returns are overwhelmingly skewed to buybacks rather than dividends: the dividend is token in the context of the cash the business throws off, while repurchases dwarf it by more than an order of magnitude, and the Board added a further large, no-expiration authorization during the year. The signal is one of confidence — management is retiring shares aggressively and the buybacks have more than offset the dilution from stock-based compensation, so the share count has drifted lower — but it is also a signal about capital-return philosophy: NVIDIA treats the buyback, not the dividend, as its primary return lever, which gives it flexibility to throttle returns if the cycle turns.
The more important qualification, developed in Sections 2 and 3, is that the on-balance-sheet CapEx line materially understates how NVIDIA is actually deploying capital to support demand. Alongside the buyback, the company has been directing very large sums into ecosystem investments, long-term supply and capacity commitments, and off-balance-sheet guarantees to early-stage partners. For the purpose of Section 1 it is enough to note that the visible capital-allocation record — light CapEx, heavy buybacks, minimal dividend — tells only part of the story; the fuller picture of how NVIDIA is funding its own demand belongs to the risk analysis.
1.6 Competitive Positioning & Moat
1.6.1 Industry structure and structural dynamics
sources Accelerated computing is an intensely competitive market characterized by rapid technological change, evolving standards, and — critically — winner-take-most dynamics at the leading edge. Returns accrue to whoever can deliver the best performance-per-dollar and performance-per-watt at data-center scale, because the buyers (hyperscalers and model builders) are sophisticated, capital-rich, and ruthlessly focused on the total cost of ownership of training and serving ever-larger models. The economics reward full-stack integration: the firm that can co-design chip, interconnect, system, and software together — so that thousands of GPUs behave as one computer — can extract a performance premium that a merchant chip vendor cannot. NVIDIA has, to date, been that firm, which is why it earns the margins it does. But the same structure means the industry is not a stable oligopoly with protected niches; it is a fast-moving contest in which today’s performance lead is continuously re-contested and in which the largest customers have both the incentive and the resources to build alternatives.
1.6.2 Competitive advantages
sources NVIDIA’s moat is real and rests on three reinforcing pillars. The first and most durable is the CUDA software platform and the developer ecosystem built on it: CUDA runs on every NVIDIA GPU and is surrounded by a deep body of libraries, frameworks, SDKs, and domain-specific software, so a very large installed base of developers has written and optimized their applications for NVIDIA hardware. This is a switching-cost moat — migrating a mature AI software stack to a competitor’s silicon is costly and risky — and it is the reason the hardware commands its pricing. The second is full-stack, “extreme co-design” scale: NVIDIA architects GPU, CPU (Grace), NVLink, DPU, NIC, networking, systems, and software as one integrated platform, an engineering capability that few competitors can match end-to-end and that management leverages across multiple end markets from a single R&D base. The third is demonstrated performance leadership at the frontier, evidenced by NVIDIA powering the large majority of the world’s TOP500 supercomputers and nearly all of the most energy-efficient Green500 systems, together with an aggressive one-year product cadence (Blackwell, Blackwell Ultra, and the unveiled Rubin platform) intended to outpace rivals faster than they can respond. Each pillar is supported by disclosure in the filing, and together they explain how a fabless semiconductor company sustains software-like margins.
1.6.3 Competitive vulnerabilities
sources The moat is wide but not unassailable, and the vulnerabilities are precisely what make the investment case contested. Four matter most. First, customer concentration has intensified sharply: NVIDIA’s largest buyers are a small number of hyperscaler-class customers who account for a strikingly large and rising share of revenue, who buy largely on cancellable purchase orders with little notice and no penalty, and who are simultaneously among the parties designing their own AI accelerators — so NVIDIA’s biggest customers are also its most capable prospective competitors. Second, the rise of high-quality open-source foundation models threatens the software lock-in at the margin: if advanced AI capability becomes broadly accessible and portable across hardware, the CUDA switching cost erodes. Third, export controls have effectively foreclosed NVIDIA from China’s data-center compute market, and management itself warns that this foreclosure is helping competitors build larger developer and customer ecosystems worldwide — a self-inflicted-by-policy erosion of the very ecosystem advantage that underpins the moat. Fourth, the supply chain is concentrated in Asia and dependent on a narrow set of partners — foundry capacity led by TSMC, advanced CoWoS packaging, and a handful of memory and assembly suppliers — so NVIDIA does not fully control the quantity, quality, yield, or delivery of the product on which its entire franchise depends, and a disruption at a single node could constrain revenue broadly. Layered on top are the perennial hazards of complex product transitions and demand that management repeatedly describes as difficult to forecast.
1.6.4 Verdict
sources NVIDIA today possesses one of the widest moats in technology — a genuine, software-anchored competitive advantage in CUDA and full-stack scale that has produced margins few hardware businesses ever achieve. The pivotal question for the investment is not whether that moat exists but whether it is durable at current margins, and here the honest answer is that the durability is more contestable than the headline financials imply. The forces that could erode it — customers with the means and motive to insource, open-source models chipping at software lock-in, policy that has already surrendered a major market and ecosystem to rivals, and a supply chain the company does not own — are structural, not cyclical, and they bear directly on long-run margin durability. Our judgment is that the moat supports premium margins for now but that the probability-weighted path for margins is toward normalization rather than perpetuation, and it is this gap between the market’s implicit assumption of durable, best-in-class economics and the structural pressures on that durability that the rest of this report examines.
Section 2 — Key Risks & Catalysts
2.1 Downside Risks
sources The risks that matter most for NVIDIA are not the operational-execution risks that dominate most semiconductor names — the company executes superbly. They are risks to the durability and quality of demand itself, and to the accounting choices that increasingly sit on top of that demand. Four forces define the downside: a customer base that is both extraordinarily concentrated and, in part, financed by NVIDIA itself; a non-cancellable purchase-commitment book that has grown to a scale without precedent for the company; a China/export-control regime that has already stranded billions and shows no sign of stabilising; and a large, freshly-recognised goodwill balance resting on an aggressive acquisition characterisation. [Rating and price target withdrawn — see the note at the top.]
Risk 1 — Self-referential, self-funded demand (“Neocloud” circularity and the OpenAI arrangement)
sources [Rating and price target withdrawn — see the note at the top.] The company has moved well beyond selling chips at arm’s length: it now invests substantial sums in private companies and infrastructure funds — many of them early-stage, illiquid AI model-makers that in turn buy NVIDIA products directly or through cloud providers — carries a large book of remaining investment commitments, and has begun guaranteeing the multi-year land, power, and facility-lease obligations of early-stage “Neocloud” partners in exchange for warrants, largely off the balance sheet and only partially collateralised by partner escrow. Layered on top is an investment-and-partnership agreement with OpenAI that management was still finalising at year-end, with no assurance it closes — the same “AI research and deployment company” that the filing identifies as a meaningful indirect customer. [Rating and price target withdrawn — see the note at the top.] This is a RED flag (forensic F005).
Why it hits the financials: the exposures are correlated. A funding squeeze or shakeout among capital-hungry AI labs and Neocloud builders would simultaneously (i) crystallise losses on the lease guarantees, (ii) force impairments across the non-marketable and publicly-held equity portfolio — a portfolio the filing itself describes as carrying industry-sector concentration risk — and (iii) remove the chip demand those same entities represent. The recent surge in largely non-cash, non-operating investment gains that flattered pre-tax income this year (forensic F006, a YELLOW watch item) is the upside expression of exactly this exposure; it reverses in a downturn.
What would trigger it: a tightening of private-capital markets for AI infrastructure, a high-profile AI-lab or Neocloud failure, or the OpenAI arrangement either failing to close or closing on terms that deepen the circularity.
Probability: Medium | Timeframe: 1–2 years | Quantified potential impact: Not cleanly quantifiable, because the exposures are contingent, off-balance-sheet, and mark-to-market; the point is directional — a material share of current demand and of this year’s non-operating gains is vulnerable to a single AI-capex air pocket, and would hit revenue, investment carrying values, and guarantee liabilities at once.
Risk 2 — Extreme and worsening customer concentration, cancellable without penalty
sources Revenue and receivables have become dramatically more concentrated, and the trend is moving the wrong way. Two direct customers each now represent a large share of total revenue — a sharp deterioration versus the prior two years, when no single customer approached today’s level — with essentially all of it in the Compute & Networking segment. Receivables are even more concentrated in a handful of direct customers. Critically, the filing reiterates that most sales are on a purchase-order basis and that customers can cancel, change, or delay commitments with little notice and without penalty. These are hyperscaler-class buyers who are simultaneously disclosed as competitors designing their own accelerators. This is a RED flag (forensic F003). §
Why it hits the financials: a single large customer pulling back would hit revenue and collectability immediately, and — because the orders are cancellable — would strand a portion of the company’s vast supply commitments (Risk 3) at the same time. The concentration has intensified even as absolute revenue grew steeply, so this is a worsening structural dependency, not a temporary artefact of one large build. The overlap with the OpenAI arrangement (Risk 1) further blurs the line between organic and self-financed demand.
What would trigger it: a hyperscaler insourcing its accelerator roadmap, a capex-budget reset at one of the two dominant buyers, or an export action that removes a large customer’s ability to purchase.
Probability: Medium–High | Timeframe: 1–2 years | Quantified potential impact: A pullback by either of the two largest direct customers would be felt across revenue, receivable collectability, and the purchase-commitment book simultaneously; the concentration means the loss of one relationship is a first-order, not marginal, event.
Risk 3 — The purchase-commitment wall and the inventory Critical Audit Matter
sources NVIDIA has committed to purchase inventory and long-term supply/capacity far in excess of what sits on its balance sheet — a commitment book that has expanded to an unprecedented scale and, with multi-year cloud-service agreements, investment commitments, and other obligations, now represents an enormous contractual overhang, much of it non-cancellable and concentrated in the near term. On-balance-sheet inventory has itself built far faster than revenue, weighted toward work-in-process and finished goods, even as gross margin declined. The auditor identified the valuation of inventories and excess product purchase commitments as its sole Critical Audit Matter, explicitly citing the impact of regulatory export restrictions on demand assumptions. This is a RED flag (forensic F002), reinforced by the clean-but-pointed auditor opinion (forensic F014).
Why it hits the financials: the company has effectively pre-committed to demand that management itself repeatedly describes as hard to forecast, exposed to export policy (Risk 4), and placed with customers who can cancel without penalty (Risk 2). The realised H20 charge is the proof of concept — a single policy shift stranded billions in inventory and obligations overnight; with the commitment book now far larger, the tail exposure has grown commensurately. This is the most important single sensitivity for gross margin and free cash flow in a demand-air-pocket scenario. The gross-margin decline this year, split between the one-off H20 charge and the structural shift from selling GPUs to selling full rack-scale systems (forensic F008, a YELLOW watch item), and the growing role of estimate-based customer advances and program accruals (forensic F010, YELLOW), are the earnings-quality context around this wall.
What would trigger it: any softening of AI-infrastructure demand, a further export shift, or a Neocloud/AI-lab shakeout (Risk 1) that leaves committed capacity without a buyer — each of which converts commitments into provisions.
Probability: Medium | Timeframe: Immediate to 1–2 years | Quantified potential impact: In a demand-air-pocket or export-shift scenario, elevated inventory write-downs and excess-purchase-obligation charges would flow straight through gross margin and cash flow; the scale of the commitment book means the potential provision is large relative to a year’s operating profit.
Risk 4 — China and export controls: a binary, exogenous overhang
sources Export policy has already inflicted a large, realised charge this year tied to H20 excess inventory and purchase obligations, and management now states plainly that NVIDIA is effectively foreclosed from China’s data-center compute market. Partial H20 licences generated only modest revenue; a narrow H200 licence permits only small shipments to specific customers, conditioned on a U.S. inspection process and an import tariff, and had generated no revenue at year-end. China revenue fell year over year, and — a new, concrete escalation — China’s antitrust regulators published a preliminary finding that NVIDIA’s export-control compliance breached the terms of China’s approval of the Mellanox acquisition, which could bring penalties or restrictions on the networking business. The prior worldwide-tiered “AI Diffusion” rule was slated for rescission, but its replacement’s scope and timing remain uncertain, and the proposed GAIN AI Act could constrain licensing further. This is a RED flag (forensic F004). §
Why it hits the financials: this is a binary, exogenous risk that can strand inventory and commitments (feeding directly into Risk 3), permanently shrink the addressable market, and accelerate the “design-out” of U.S. semiconductors by customers outside China. Management itself warns that its foreclosure from China is helping competitors build larger developer and customer ecosystems worldwide — the long-term competitive cost of the overhang, distinct from the near-term revenue loss.
What would trigger it: any new U.S. rule, an adverse outcome to China’s Mellanox-antitrust finding, retaliatory Chinese measures, or an unfavourable replacement to the AI Diffusion framework.
Probability: High (that the overhang persists) | Timeframe: Immediate and ongoing | Quantified potential impact: The realised H20 charge already demonstrated the magnitude a single action can carry; a further escalation would combine lost revenue with fresh inventory/commitment provisions.
Risk 5 — Groq goodwill: an aggressive acquisition characterisation and a live impairment exposure
sources NVIDIA booked what it describes as a non-exclusive technology licence plus a hiring of certain employees — explicitly stating no customer contracts, existing products, or equity interests were purchased — as a business combination, recognising a very large slug of goodwill attributed primarily to “workforce and future development,” alongside a developed-technology intangible valued not by an income or market approach but by a cost-to-recreate method. This single transaction drove total goodwill up several-fold and left a significant unpaid consideration as a near-term payable. This is a RED flag (forensic F001).
Why it hits the financials: recognising goodwill of this size from what is functionally a non-exclusive licence plus an acqui-hire — with no acquired revenue, products, or equity — is an aggressive characterisation. An assembled workforce is not separable and is normally the softest, most impairment-prone component of goodwill; the entire balance rests on management’s belief that it can turn licensed technology and hired engineers into commercial products, a belief the company’s own risk factors flag as uncertain. This is a live future-impairment exposure that would flow straight through the income statement, and it has materially changed the composition of the balance sheet. The near-term unpaid consideration is also a cash obligation.
What would trigger it: failure to commercialise the licensed technology on the expected timeline, attrition of the hired engineering talent, or any annual impairment test that concludes the “future development” thesis has not been realised.
Probability: Medium (over the useful life) | Timeframe: 1–2 years and beyond | Quantified potential impact: A write-down would be a non-cash but real charge to earnings and equity; the exposure is the full carrying value of the goodwill and the related intangible.
2.2 Upside Catalysts
sources [Rating and price target withdrawn — see the note at the top.] The catalysts that exist are real, but they are mostly extensions of an already fully-appreciated growth story rather than new, under-priced sources of value; we present three, and note that they are outweighed by the five risks. We do not manufacture a fourth for symmetry.
Catalyst 1 — Rubin ramp and the sustained one-year product cadence
sources NVIDIA continues to execute an aggressive one-year data-center product cadence — Blackwell, Blackwell Ultra (now shipping), and the Rubin platform unveiled for agentic and reasoning workloads, with production shipments expected in the second half of the next fiscal year. If Rubin ramps cleanly, it would extend the performance-and-ecosystem lead, support pricing, and lengthen the runway of the current cycle. [Rating and price target withdrawn — see the note at the top.]
[Rating and price target withdrawn — see the note at the top.]
Catalyst 2 — Demand broadening beyond hyperscalers (sovereign, enterprise, physical AI)
sources The most valuable catalyst for de-risking the thesis would be a genuine broadening of demand — sovereign AI programmes, on-premises enterprise AI on RTX PRO-class hardware, and physical AI/robotics — that dilutes the extreme customer concentration in Risk 2 and reduces reliance on a handful of hyperscalers and self-funded Neoclouds. [Rating and price target withdrawn — see the note at the top.] §
Probability: Medium | Timeframe: 1–3 years | Monitoring trigger: A declining share of revenue from the two largest direct customers, and disclosed growth in enterprise/sovereign/robotics demand that is not itself NVIDIA-financed.
Catalyst 3 — A favourable resolution of the China/export overhang
sources A stable, workable replacement to the AI Diffusion framework, durable H200 (or successor) licensing into China on economics NVIDIA can actually capture, and a benign resolution of China’s Mellanox-antitrust finding would reopen a foreclosed market and remove a persistent multiple-compressing overhang. This is a binary, largely exogenous upside — the mirror image of Risk 4.
Probability: Low–Medium | Timeframe: Uncertain | Monitoring trigger: Publication of a workable replacement export rule, first meaningful licensed China revenue actually recognised (net of the tariff and any revenue-share expectation), and closure of the Mellanox-antitrust matter without material penalty.
2.3 Risk & Catalyst Summary
| # | Item | Type | Probability | Timeframe | Status | Monitoring Trigger |
|---|---|---|---|---|---|---|
| 1 | Self-referential / self-funded demand (Neocloud investments, lease guarantees, OpenAI) | Risk | M | 1–2 years | Active | AI-capital tightening; an AI-lab/Neocloud failure; OpenAI deal terms or non-closure |
| 2 | Extreme, worsening customer concentration (cancellable without penalty) | Risk | M–H | 1–2 years | Active | Hyperscaler insourcing; capex reset at a top-two customer; export loss of a large buyer |
| 3 | Purchase-commitment wall and inventory Critical Audit Matter | Risk | M | Immediate–2 years | Active | Demand softening; an export shift; committed capacity left without a buyer |
| 4 | China / export-control overhang and Mellanox-antitrust finding | Risk | H | Immediate/ongoing | Active | New U.S. rule; adverse China ruling; unfavourable AI Diffusion replacement |
| 5 | Groq goodwill — aggressive characterisation and impairment exposure | Risk | M | 1–2 years+ | Monitoring | Failure to commercialise licensed tech; talent attrition; annual impairment test |
| 6 | Rubin ramp / one-year product cadence | Catalyst | H (launch) | 1–2 years | Monitoring | On-time Rubin production shipments without transition/yield problems |
| 7 | Demand broadening beyond hyperscalers (sovereign, enterprise, physical AI) | Catalyst | M | 1–3 years | Monitoring | Falling top-two-customer share; disclosed non-financed enterprise/sovereign demand |
| 8 | Favourable China / export resolution | Catalyst | L–M | Uncertain | Latent | Workable replacement rule; real licensed China revenue; benign Mellanox outcome |
Source: Company SEC filings (10-K) and forensic footnote review; see Appendix A.1.
2.4 Risk Interdependencies
sources [Rating and price target withdrawn — see the note at the top.] In that scenario, the self-funded-demand web (Risk 1), the customer concentration (Risk 2), and the commitment wall (Risk 3) do not merely coincide — they amplify one another. A pullback by one or both of the two dominant direct customers, or distress among the early-stage AI labs and Neocloud partners NVIDIA has invested in and whose leases it has guaranteed, would at the same moment reduce chip orders, strand a portion of the non-cancellable purchase and capacity commitments (converting them into inventory write-downs and excess-obligation charges), crystallise losses on the off-balance-sheet lease guarantees, and force impairments across the illiquid investment portfolio — the same portfolio whose mark-to-market gains flattered this year’s pre-tax income and would reverse. The export regime (Risk 4) is the exogenous trigger most capable of setting this chain in motion, because a single policy action can strand committed inventory and remove a large buyer simultaneously, exactly as the realised H20 charge demonstrated on a smaller scale. Sitting alongside, the Groq goodwill (Risk 5) is a slower-fuse, largely independent accounting exposure — but a general AI-demand downturn is precisely the environment in which a “future development” impairment thesis would be tested and fail. [Rating and price target withdrawn — see the note at the top.]
2.5 ESG & Regulatory Exposure
sources Governance and accounting quality. The most company-specific governance concern is not a conventional ESG metric but the pattern captured in the RED flags above: the aggressive characterisation of the Groq licence-and-hire as a goodwill-generating business combination (Risk 5), and the widening circle in which NVIDIA invests in, commits capital to, and guarantees the obligations of its own customers (Risk 1). A related-party transactions footnote is not presented in the 10-K itself (incorporated by reference to the proxy, which is outside this filing), so the substantive related-commercial exposures are the ecosystem and OpenAI arrangements. A change-of-control feature also exists: under NVIDIA’s long-standing Xbox agreement with Microsoft, if a third party offers to purchase at least a specified portion of NVIDIA’s stock, Microsoft may hold first and last rights of refusal — a governance/change-of-control consideration rather than a value-transfer arrangement (forensic F015).
Litigation. A putative securities class action alleging that NVIDIA and certain executives made false or misleading statements about channel inventory and the impact of cryptocurrency mining on GPU demand in prior years has been remanded to the district court and is actively litigating, with related derivative suits stayed. No contingent liability is accrued — the company regards a loss as reasonably possible but not probable and not estimable — so any adverse development or settlement would be an unreserved hit. The subject matter (alleged misstatements about channel inventory and demand) is thematically pointed given today’s inventory and demand-forecasting judgments (Risk 3), and sharpens the scrutiny that attaches to management’s demand disclosures (forensic F012). Broad competition inquiries are also ongoing across the EU, U.S., UK, China, South Korea, and Japan, plus the French Competition Authority — a regulatory-attention risk that scales with NVIDIA’s market position.
Regulatory / geopolitical. Beyond the China/export overhang (Risk 4), the company faces emerging AI-specific regulation (the EU AI Act and new U.S. state AI laws), stringent and divergent data-privacy regimes (GDPR, CCPA and state laws, NIS2, China’s data laws), and responsible-AI reputational and legal exposure. A presentation point worth flagging for any regulatory or geographic analysis: NVIDIA changed its geographic-revenue basis mid-year to customers’ headquarters location and disclosed that the bulk of revenue attributed to one large “geography” actually serves end customers elsewhere — so the geographic table cannot be read as end-market demand, and in particular cannot be used to size true China exposure without adjustment (forensic F011).
Environmental. Environmental exposure is real but indirect and centres on energy and water. Management states compliance costs have not been material and it does not anticipate material environmental capital expenditure, but it flags climate-related risk to its California facilities (earthquakes, wildfire-driven power shut-offs), the criticality of clean water and predictable energy to data centers, and — most tellingly for the demand thesis — business and reputational risk tied to the high absolute energy requirements of its GPUs. Energy availability is not merely an ESG line item here; management identifies the availability of data centers, energy, and capital to its customers as crucial to future revenue, which makes the environmental constraint a demand constraint. Prospective carbon or energy taxes, sustainability-disclosure and supply-chain-governance requirements, and divergent U.S. state initiatives could raise costs in later periods.
Section 3 — Financial Analysis & Historical Performance
sources Three-Statement Linkage Confirmation (complete before writing begins): - Net Income ties (Income Statement → Cash Flow Statement): Confirmed. Reported net income of $120,067.0M is the starting line of the FY2026 operating-cash-flow reconciliation, from which non-cash charges (D&A, stock-based compensation) are added back and the non-cash investment gains discussed below are reversed out. - Cash ties (Balance Sheet → Cash Flow Statement): Confirmed. The change in the Balance Sheet cash line ($8,589.0M → $10,605.0M) is consistent with the net change in cash produced by the operating, investing and financing sections of the Cash Flow Statement. - Retained Earnings reconciliation (Beg RE + NI - Dividends = End RE): Reconciled once share repurchases charged to retained earnings are included. Opening retained earnings of $68,038.0M plus net income of $120,067.0M, less dividends of $974.0M and the portion of $40,086.0M of buybacks charged against retained earnings, ties to closing retained earnings of $146,973.0M, with a de minimis residual attributable to other equity movements. The simple Beg + NI - Dividends identity does not tie on its own precisely because NVIDIA retires repurchased stock against retained earnings rather than accumulating treasury shares — a mechanical point, not a red flag.
3.1A Income Statement
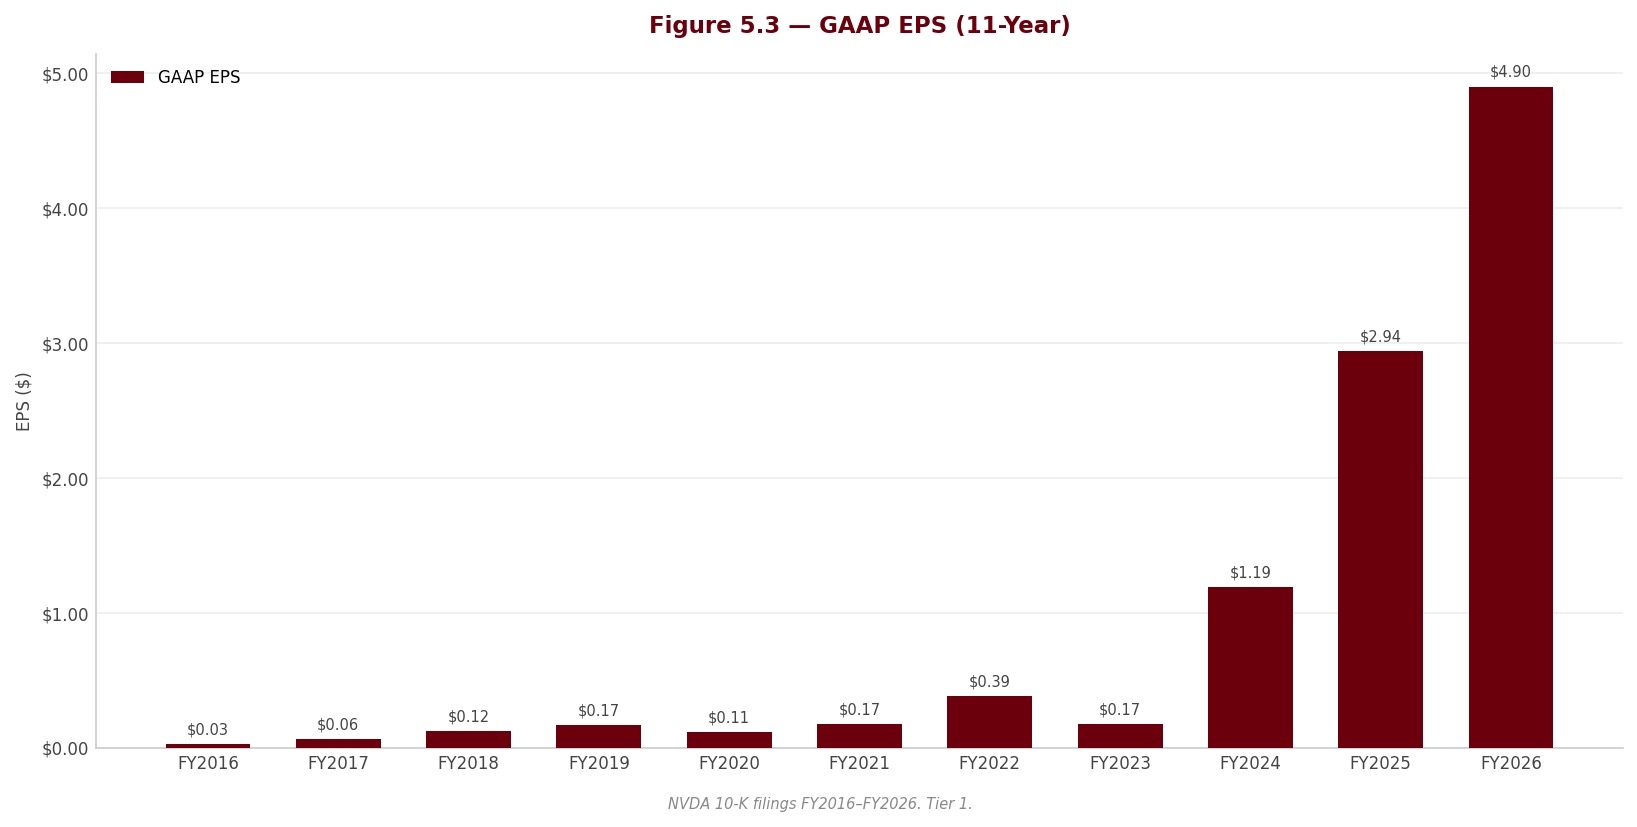
Source: Company SEC filings (10-K), consolidated statements of income; figures per the FL model — see Appendix A.1–A.2. Per-share figures and share counts are split-adjusted to the current basis (NVIDIA executed a 4-for-1 split in July 2021 and a 10-for-1 split in June 2024), so EPS, share count, per-share book value, growth and CAGR are comparable across years; the as-reported FY2026 diluted EPS was $4.90.
CAGR Summary
| Metric | 3Y CAGR | 5Y CAGR | 10Y CAGR |
|---|---|---|---|
| Revenue | 100.0% | 66.9% | 45.7% |
| EBITDA | 184.8% | 88.3% | 64.0% |
| Net Income | 201.8% | 94.3% | 69.5% |
| Diluted EPS | 204.2% | 95.3% | 68.2% |
| FCF | 193.9% | 83.1% | 56.6% |
Source: Company SEC filings (10-K); figures per the FL model — see Appendix A.1–A.2.
3.1B Income Statement — Analysis
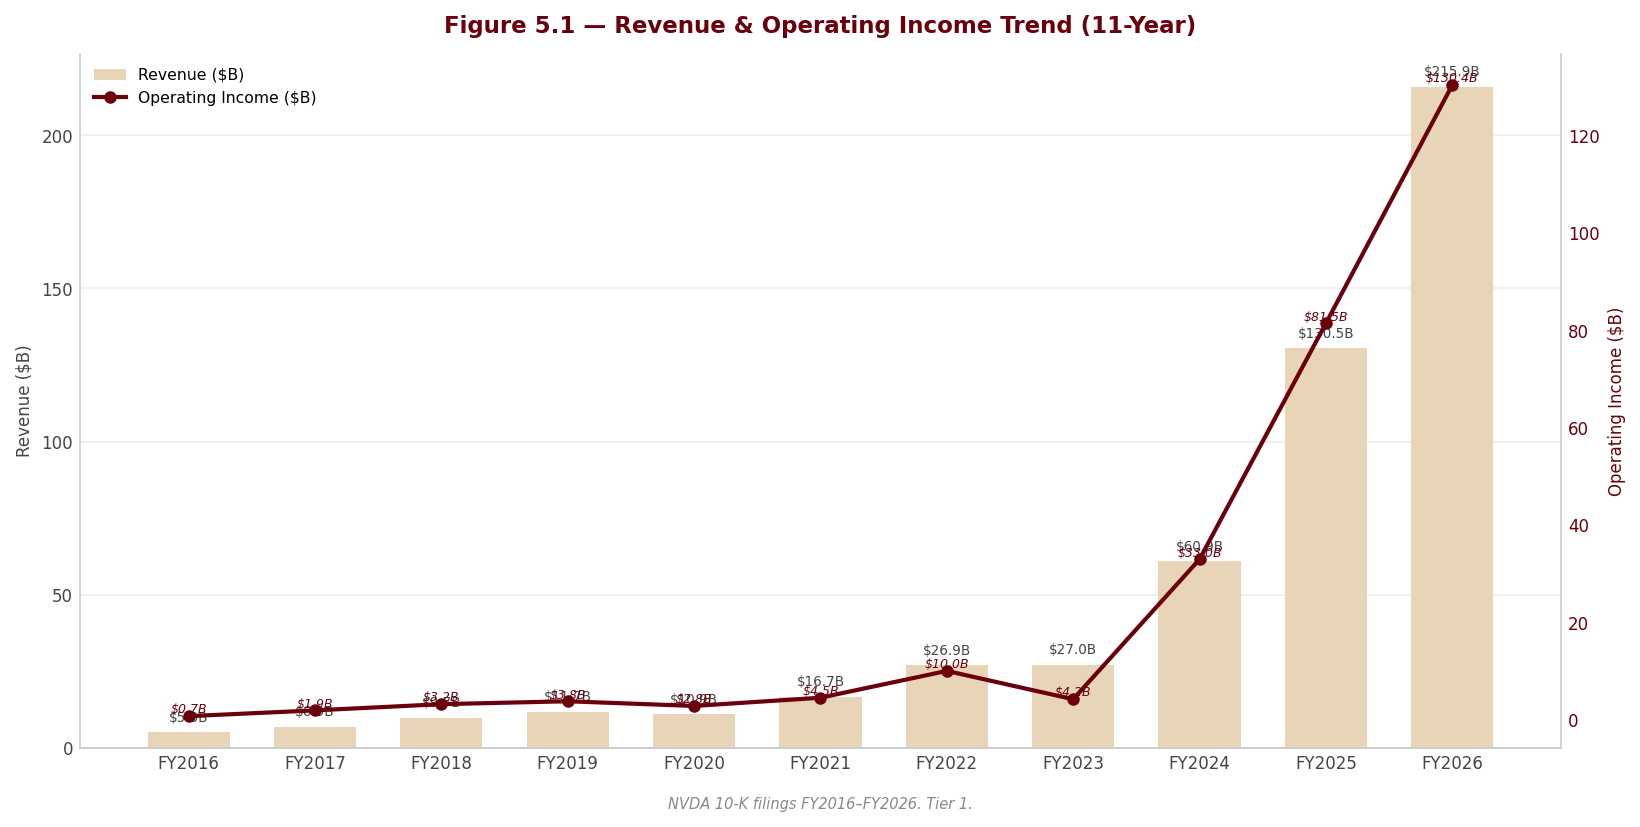
sources Revenue. The top-line trajectory is, in absolute terms, among the most extreme in the history of large-cap equities. After a flat FY2023 (0.2% growth, when the crypto/gaming correction and a data-center digestion phase collided), revenue inflected to 125.9% in FY2024, 114.2% in FY2025, and 65.5% in FY2026, reaching $215,938.0M. The three-year revenue CAGR of 100.0% and five-year CAGR of 66.9% understate the violence of the recent step-change; the ten-year figure of 45.7% is the more sober lens on the through-cycle franchise. Management attributes FY2026 growth to Data Center compute and networking, with the Blackwell architecture representing the majority of Data Center revenue and the NVLink compute fabric (GB200/GB300) plus Ethernet/InfiniBand driving networking. The critical analytical point for a sell-side thesis: this is overwhelmingly a volume/platform-adoption surge tied to a single, capex-cycle-dependent end market (hyperscaler AI infrastructure buildout), not a diversified or annuitised revenue base. Growth of this magnitude cannot compound off a $215.9bn base; the law of large numbers alone guarantees sharp deceleration, and the demand is sourced from a handful of buyers (see 3.2B and Section 2) whose orders are cancellable without penalty.
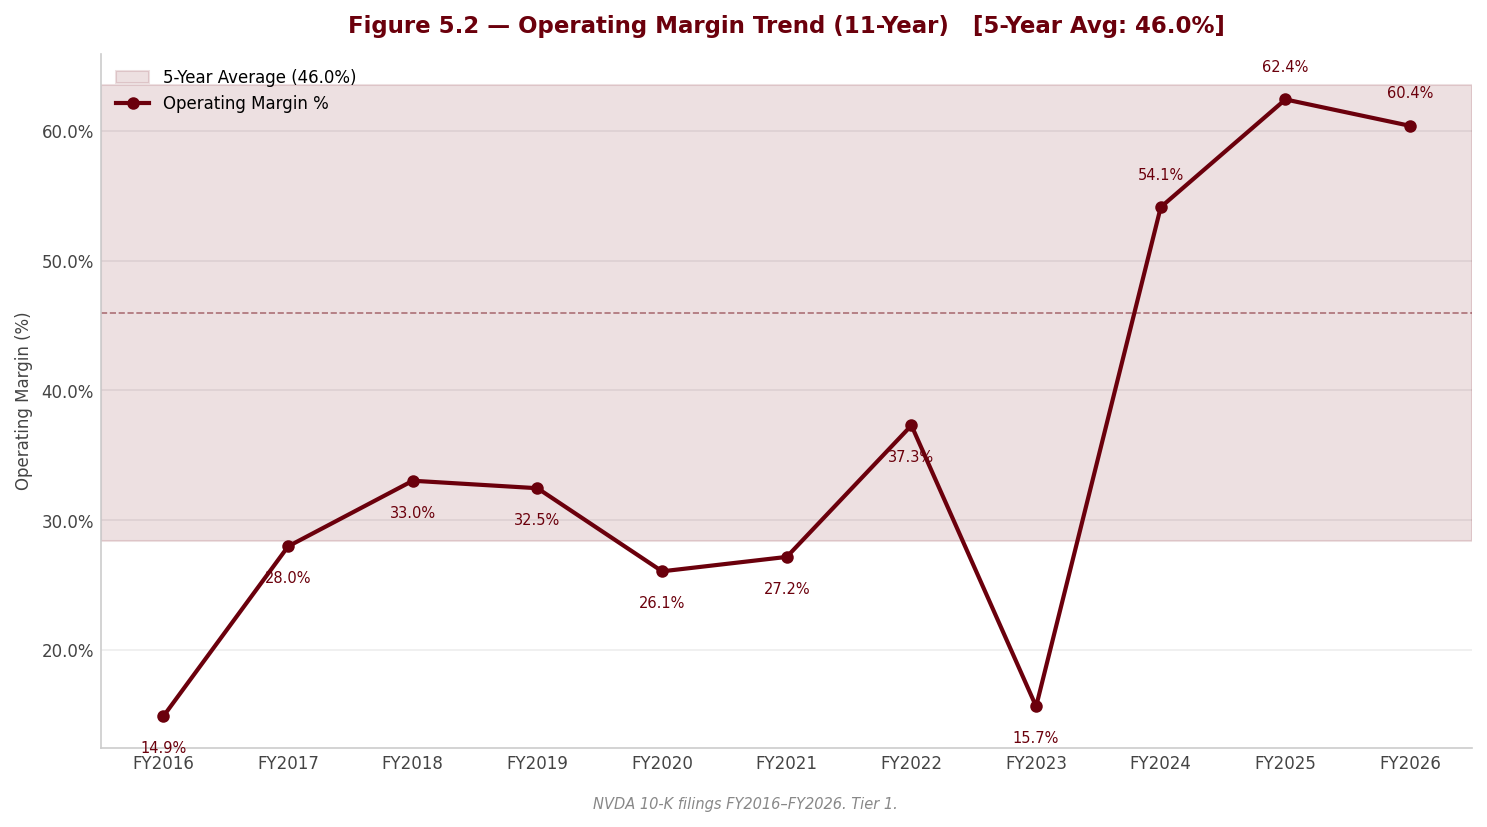
Margin trajectory. Profitability is genuinely exceptional and, at the operating line, structurally so: EBIT margin reached 60.4% and net margin 55.6% in FY2026 — levels essentially unheard of for a hardware-centric business, and a testament to NVIDIA’s pricing power and the software/ecosystem lock-in described in Section 1. But the direction of travel now matters more than the level. Gross margin fell to 71.1% from 75.0%, a decline of roughly 3.9 points. This is the first margin reversal since the FY2023 trough (56.9%) and must be decomposed honestly. Management attributes it to two distinct causes: (i) a structural mix shift as the business model transitions from selling Hopper HGX boards/systems to full rack-scale Blackwell data-center solutions, which carry a lower percentage margin even at higher absolute dollars; and (ii) a one-off $4.5bn charge for excess H20 inventory and purchase obligations stranded by the April 2025 U.S. export-licensing requirement. The net inventory-provision drag on gross margin was 2.6 points in FY2026 (vs 2.3 points in FY2025). The honest read: strip the H20 charge and margin still compresses on mix — the rack-scale transition is a permanent headwind to percentage margin even as it grows the dollar profit pool.
Major movers (FY2026). First, Data Center Blackwell volume is the dominant driver of the 65.5% revenue increase — the single reason EBIT rose to $130,387.0M despite margin compression. Second, the $4.5bn H20 export charge, embedded in cost of revenue, is the largest discrete negative to gross profit and is non-recurring in nature but recurring in type (any future export shift can strand inventory again). Third, operating expenses rose sharply — R&D climbed to $18,497.0M from $12,914.0M on higher compensation and a steep rise in compute/infrastructure spend — yet grew slower than revenue, delivering continued operating leverage; this is a structural positive so long as the revenue base holds. Fourth, “Other income, net” surged on roughly $9.0bn of largely non-cash investment gains (detailed below), flattering the $141,450.0M pre-tax total by close to 6% — a temporary, non-operating tailwind. [Rating and price target withdrawn — see the note at the top.]
Quality of earnings. This is where a disciplined reader must separate the extraordinary operating engine from the cosmetic. Three forensic findings bear directly on reported profit and are flagged here with weight:
- Non-operating investment gains inflating pre-tax income (YELLOW). “Other income, net” jumped to roughly $9.0bn from ~$1.0bn a year earlier, driven by unrealised mark-to-market gains on non-marketable and publicly-held equity securities (including NVIDIA’s Intel stake), of which ~$8.9bn is explicitly non-cash. That is close to 6% of the $141,450.0M pre-tax total. These gains are volatile, reversible, illiquid and partly lock-up-restricted, and a large slice reflects AI-cycle marks on NVIDIA’s own ecosystem investees. [Rating and price target withdrawn — see the note at the top.] [Rating and price target withdrawn — see the note at the top.] FY2026 also included a one-time ~$711m state deferred-tax-asset valuation-allowance release. [Rating and price target withdrawn — see the note at the top.]
- Stock-based compensation (YELLOW). SBC rose to $6,386.0M from $4,737.0M, a real and growing recurring economic cost. NVIDIA more than offsets the dilution through buybacks (diluted shares actually fell), but any cash-flow or “adjusted” metric that adds SBC back is overstating economic earnings.
[Rating and price target withdrawn — see the note at the top.] Both flatter the very P/E on which the bull case rests.
[Rating and price target withdrawn — see the note at the top.] If EBIT margin falls below 54.1%, it would mark a reversal of the operating-leverage story. And if “Other income, net” swings from gain to loss in a market downturn, reported EPS could miss even on in-line operating results, given ~6% of pre-tax income now sits in mark-to-market gains.
3.2A Balance Sheet
Source: Company SEC filings (10-K), consolidated balance sheets; figures per the FL model — see Appendix A.1–A.2.
3.2B Balance Sheet — Analysis
sources Asset composition. NVIDIA runs a cash-rich, asset-light balance sheet by design: it is fabless, so PP&E ($10,383.0M) remains modest relative to a $206,803.0M asset base that ballooned from $111,601.0M in a single year. The composition, however, has changed in two consequential ways. First, working-capital assets have exploded — receivables reached $38,466.0M and inventory $21,403.0M. Second, and more concerning for asset quality, goodwill and intangibles jumped to $20,832.0M from $5,188.0M.
That goodwill leap is a RED forensic flag and deserves prominence. The increase is almost entirely the December 2025 Groq transaction — structured and accounted for as a business combination even though the filing states plainly that no customer contracts, existing products, or equity interests were purchased. NVIDIA recorded roughly $14.4bn of goodwill described as “primarily attributable to the workforce and future development of the licensed technology,” plus a ~$2.5bn developed-technology intangible valued on a cost-to-recreate basis. In substance this is a non-exclusive technology licence plus an acqui-hire; recognising $14.4bn of goodwill from an assembled workforce — the softest, most impairment-prone category of goodwill, tied to future products that do not yet exist — is an aggressive characterisation. The practical consequence: goodwill is now a materially larger share of equity than a year ago, and this balance carries a live future-impairment exposure that would flow straight through the income statement. Approximately $4bn of the consideration is unpaid and sits as a near-term cash obligation in accrued liabilities.
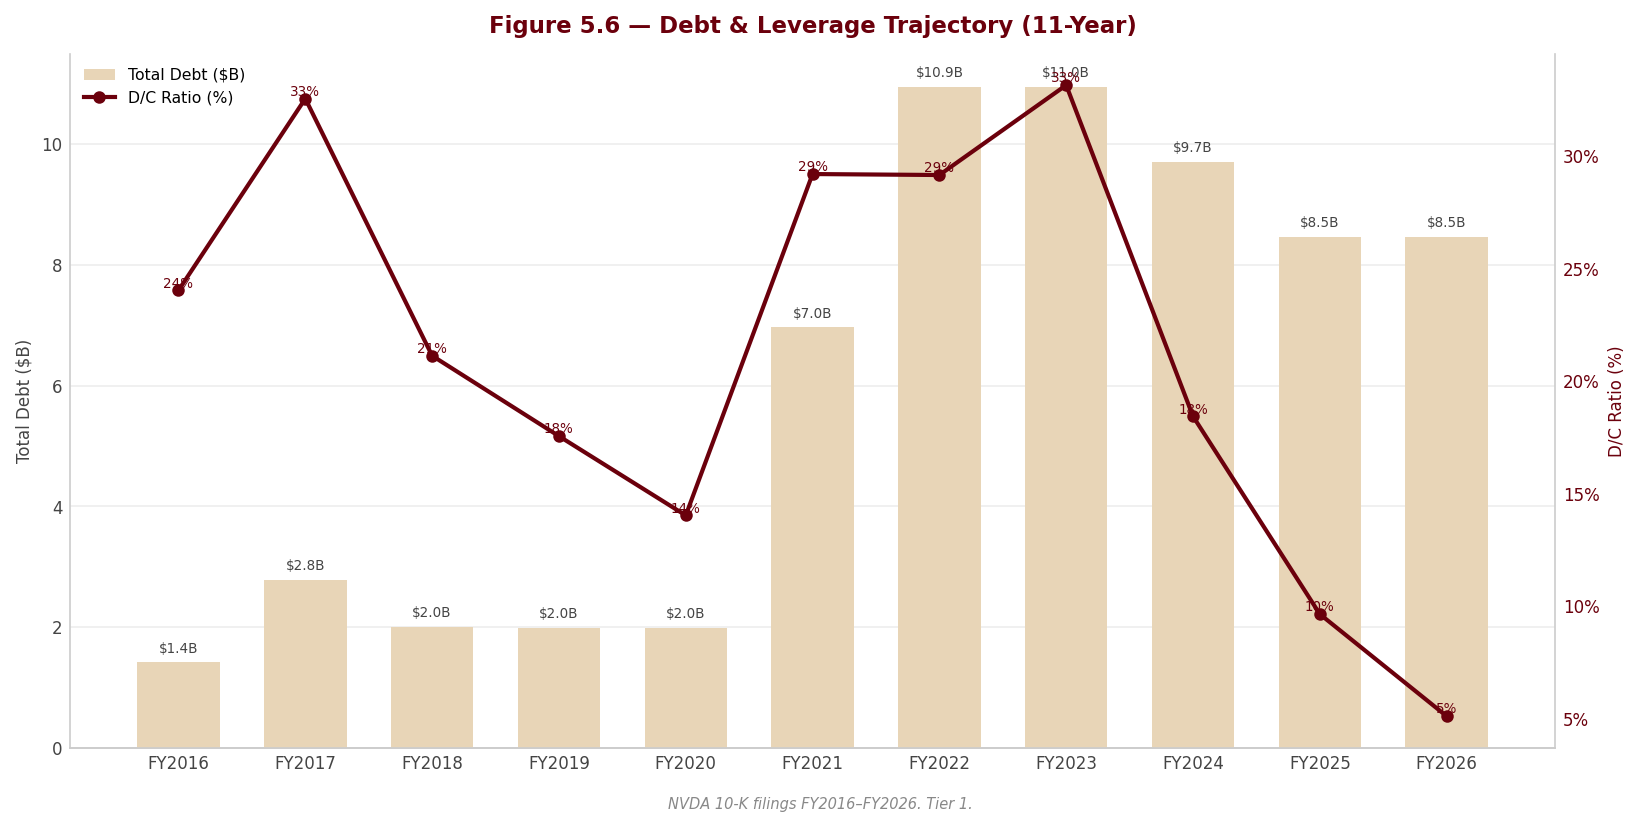
Leverage trajectory. On reported leverage, NVIDIA is a fortress. Total debt is essentially flat at $8,468.0M (senior unsecured notes laddered out to 2060, covenants non-financial), and the company is in a net cash position — net debt of -$2,137.0M and net debt/EBITDA of -0.0x. There is no maturity wall and no covenant constraint on the equity thesis. Two nuances temper the “no leverage” reading, however. First, NVIDIA raised its commercial-paper program from $575m to $25.0bn in January 2026 (undrawn at year-end) — a forward signal that management may fund its commitment wall and elevated FY2027 capex with short-term paper, a departure from its historic self-funding. Second, the true forward obligations are off the reported debt line: roughly $137bn of total contractual commitments, including $95.2bn of manufacturing/supply/capacity commitments (up from $30.8bn) and $3.5bn of off-balance-sheet “Neocloud” lease guarantees — economic leverage the debt ratios do not capture (see Section 2 and 3.3B).
Working capital. Here the balance sheet flags a forward risk. The cash conversion cycle lengthened to 97 days from 82 days, driven by inventory. Days inventory outstanding rose to 92 days from 86 days, and inventory turns slipped to 4.0x. The headline concern is a YELLOW forensic flag: inventory grew to $21,403.0M from $10,080.0M — roughly +112%, nearly double the 65.5% revenue growth — concentrated in work-in-process and finished goods amid rapid architecture transitions (Blackwell Ultra/GB300 shipping, Rubin due in H2 FY2027). [Rating and price target withdrawn — see the note at the top.] In mitigation, receivables of $38,466.0M grew broadly in line with revenue (DSO 52 days vs 46 days), so there is no evidence of channel-stuffing or aggressive revenue-pull on the receivables side — the working-capital stress is concentrated in inventory, not collections.
⚠ Items to watch. With the company in net cash, the leverage threshold to watch is not a debt ratio but the commitment ratio: purchase commitments now stand at roughly 4.5x on-balance-sheet inventory. A watch trigger is any further widening of the inventory-to-revenue growth gap or a rise in the excess-purchase-obligation accrual — either would presage a repeat of the H20-style charge at larger scale. Separately, any impairment testing that writes down the $20,832.0M goodwill (now dominated by the Groq balance) would be a direct hit to reported earnings and book value.
3.3A Cash Flow Statement
| FY2022 | FY2023 | FY2024 | FY2025 | FY2026 | |
|---|---|---|---|---|---|
| Cash from Operations ($M) | $9,108.0M | $5,641.0M | $28,090.0M | $64,089.0M | $102,718.0M |
| — Depreciation & Amortization ($M) | $1,174.0M | $1,544.0M | $1,508.0M | $1,864.0M | $2,843.0M |
| Capital Expenditures ($M) | $976.0M | $1,833.0M | $1,069.0M | $3,236.0M | $6,042.0M |
| Free Cash Flow ($M) | $8,132.0M | $3,808.0M | $27,021.0M | $60,853.0M | $96,676.0M |
| FCF Margin | 30.2% | 14.1% | 44.4% | 46.6% | 44.8% |
| FCF / Share | $0.32 | $0.15 | $1.08 | $2.45 | $3.94 |
| FCF Conversion (FCF/NI) | 83.4% | 87.2% | 90.8% | 83.5% | 80.5% |
| CapEx / Revenue | 3.6% | 6.8% | 1.8% | 2.5% | 2.8% |
| CapEx / D&A | 0.8x | 1.2x | 0.7x | 1.7x | 2.1x |
| Dividends Paid ($M) | $399.0M | $398.0M | $395.0M | $834.0M | $974.0M |
| Share Repurchases ($M) | — | $10,039.0M | $9,533.0M | $33,706.0M | $40,086.0M |
Source: Company SEC filings (10-K), consolidated statements of cash flows; figures per the FL model — see Appendix A.1–A.2.
3.3B Cash Flow — Analysis
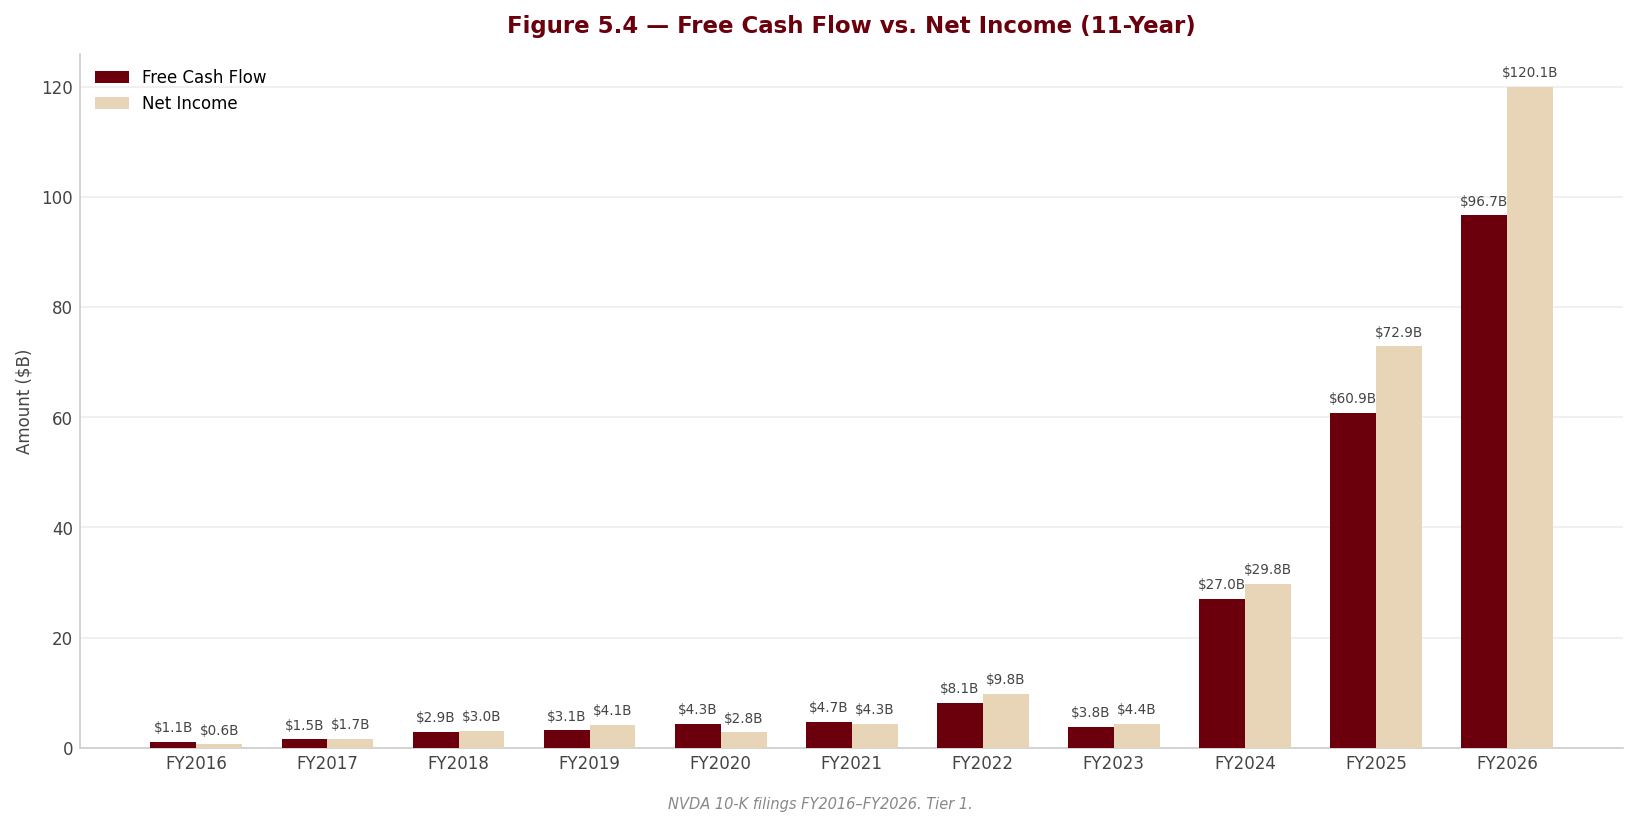
sources Quality of operating cash flow. Operating cash flow of $102,718.0M (up from $64,089.0M) came in below net income of $120,067.0M — the business earned more on the P&L than it converted to cash this year. The composition explains the gap: the roughly $9.0bn of non-cash investment gains that flattered pre-tax income are reversed out in the cash-flow reconciliation, and the working-capital build absorbed further cash, so OCF lands beneath reported net income. That is a quality signal, not a comfort — reported net income is the higher but lower-quality figure here, inflated by the ~$9.0bn of non-cash gains, while OCF is the cleaner read on what the business actually collected. FCF conversion is likewise deteriorating: FCF/NI fell to 80.5% in FY2026 from 83.5% and 90.8%. The drain is working capital — the inventory build discussed in 3.2B is where reported earnings are not fully converting to cash. Free cash flow still reached $96,676.0M at a 44.8% margin, an extraordinary result, but the conversion trend is the correct thing to monitor, not the absolute level.
CapEx analysis. Investment intensity is rising but remains strikingly low for a company scaling this fast: capex of $6,042.0M is just 2.8% of revenue. The capex/D&A ratio climbed to 2.1x (from 1.7x), confirming NVIDIA is in growth-investment mode rather than harvest mode — but the fabless model means the real capacity commitment sits off the capex line, in the $95.2bn of supply/capacity purchase commitments to foundry and component partners. The reported capex line therefore understates NVIDIA’s true forward capital intensity; the binding capacity decision is made through non-cancellable purchase obligations, not owned plant. That is the correct place to look for the growth-investment risk, and it ties directly to the inventory/provision CAM.
Capital allocation waterfall. Over the five years shown, NVIDIA generated a cumulative free-cash-flow pool that it has returned to shareholders overwhelmingly through buybacks rather than dividends or reinvestment. In FY2026 alone, share repurchases of $40,086.0M dwarfed dividends of $974.0M by more than an order of magnitude, and also exceeded capex of $6,042.0M many times over. The buyback in FY2026 also far exceeded the $6,386.0M of stock-based compensation, so repurchases more than offset dilution and diluted share count actually fell. For a business still compounding this fast, returning the bulk of FCF via buyback — rather than reinvesting or building dividend capacity — is a defensible mix only if management’s implicit view is that the incremental internal reinvestment opportunity is already saturated by the purchase-commitment strategy. The more skeptical read for a sell thesis: buying back stock at a peak-cycle valuation, funded by peak-cycle FCF, is the least defensible use of capital if the AI capex cycle mean-reverts.
⚠ Items to watch. Watch FCF conversion: a further decline below 80.5% would confirm that working-capital absorption (inventory) is structurally impairing cash generation. Watch, too, whether NVIDIA begins drawing the newly-enlarged $25bn commercial-paper program to sustain buybacks or fund commitments — a shift from self-funding to short-term borrowing to return capital would be a meaningful change in financial policy.
3.4 Returns Analysis
| FY2022 | FY2023 | FY2024 | FY2025 | FY2026 | |
|---|---|---|---|---|---|
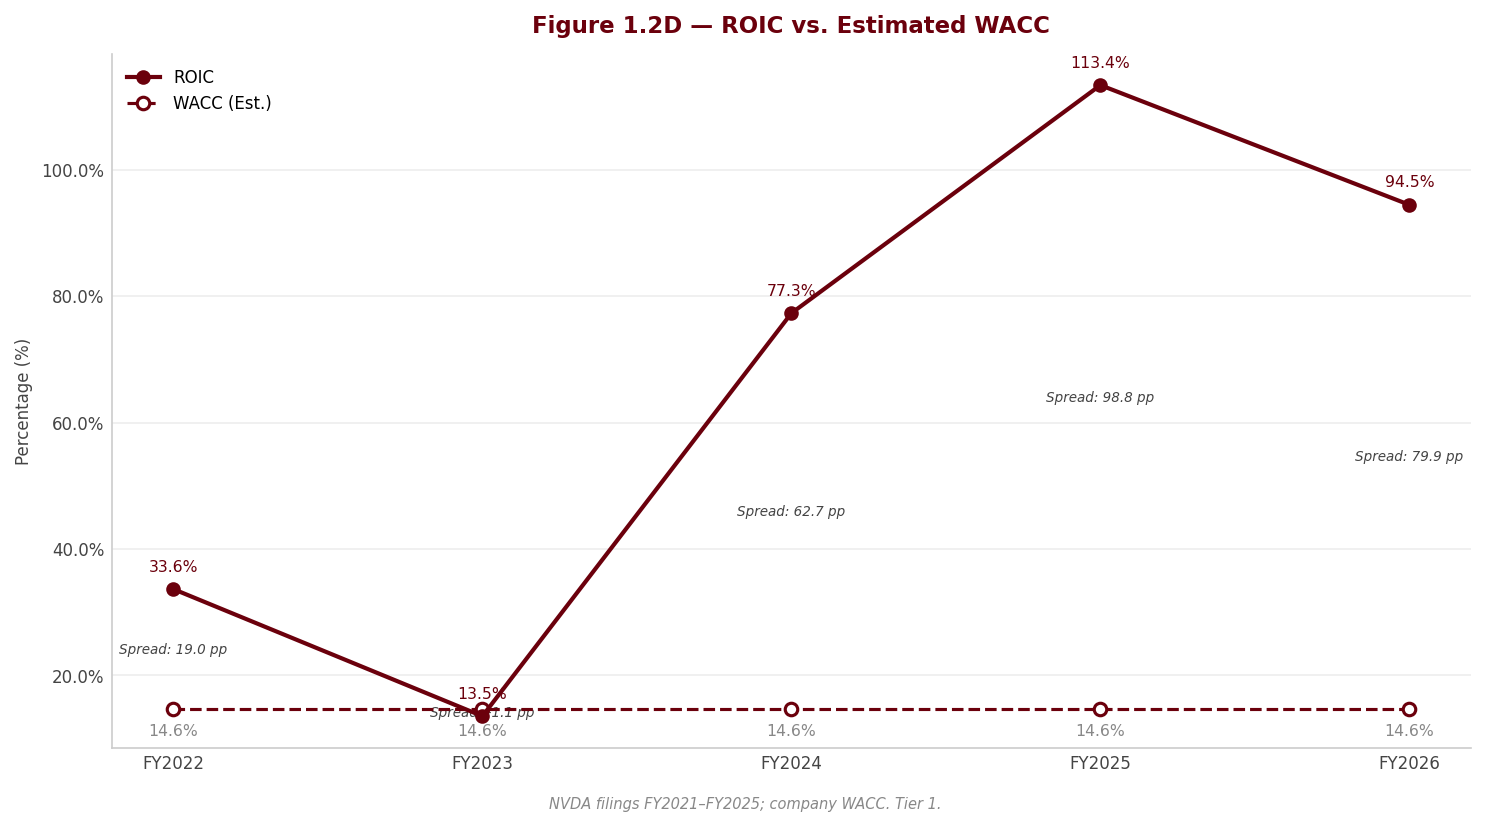
| ROIC | 33.6% | 13.5% | 77.3% | 113.4% | 94.5% |
| ROE | 44.8% | 17.9% | 91.5% | 119.2% | 101.5% |
| ROA | 26.7% | 10.2% | 55.7% | 82.2% | 75.4% |
| Interest Coverage | 42.5x | 16.1x | 128.3x | 329.8x | 503.4x |
Source: Company SEC filings (10-K); figures per the FL model — see Appendix A.1–A.2.
ROIC. Return on invested capital is the single most important long-run metric, and NVIDIA’s is exceptional on any historical benchmark: ROIC of 94.5% in FY2026 sits multiples above any plausible cost of capital (WACC; the spread is enormous by any measure). The critical analytical observation, however, is the direction: ROIC declined from 113.4% in FY2025 — the first contraction of the AI-cycle up-leg — even as the business grew 65%. The drivers of the decline are exactly those isolated above: gross-margin compression narrowing NOPAT margin, and a swelling invested-capital base as inventory built and the ~$14.4bn Groq goodwill landed on the balance sheet. In other words, incremental returns on the newest capital deployed are lower than the trailing average — a subtle but important early signal that returns are being diluted by both mix and capital allocation even while the absolute level remains spectacular. Interest coverage of 503.4x is effectively academic given the net-cash position.
DuPont decomposition. Decomposing FY2026 ROE of 101.5% into its three levers: net margin of 55.6%, asset turnover of 1.36x (measured on average assets, per the DuPont convention), and an equity multiplier of 1.35x. The message is unambiguous: NVIDIA’s extraordinary ROE is driven almost entirely by profitability, not leverage — the equity multiplier of 1.35x is low (this is an unlevered, equity-financed balance sheet), and it has actually fallen versus prior years as retained earnings compounded equity. Asset turnover of 1.36x also eased year over year, dragged by the goodwill and inventory build. The swing factor for ROE going forward is therefore net margin: because leverage is negligible and turnover is drifting down, any erosion in the 55.6% net margin — from mix, tax normalisation, or a reversal of the non-cash investment gains — flows almost one-for-one into the return profile. A high-quality ROE, but a fragile one in the sense that it has no leverage cushion and rests on a margin that is already compressing.
3.5 Altman Z-Score (Most Recent FY)
| Component | FY2024 | FY2025 | FY2026 |
|---|---|---|---|
| X1 (Working Capital / Total Assets) | 0.513 | 0.556 | 0.452 |
| X2 (Retained Earnings / Total Assets) | 0.454 | 0.610 | 0.711 |
| X3 (EBIT / Total Assets) | 0.502 | 0.730 | 0.630 |
| X4 (Equity / Total Liabilities) | 1.889 | 2.458 | 3.177 |
| X5 (Revenue / Total Assets) | 0.927 | 1.169 | 1.044 |
| Z-Score | 4.97 | 6.57 | 6.57 |
| Zone | Safe | Safe | Safe |
Source: Company SEC filings (10-K); figures per the FL model — see Appendix A.1–A.2.
Interpretation. The Altman Z-Score of 6.57 places NVIDIA deep in the “Safe” zone (>2.99) with no meaningful bankruptcy or credit-distress signal — as expected for a net-cash, high-margin, low-leverage franchise. The score is essentially unchanged from 6.57 in FY2025 and well above the 4.97 of FY2024, buttressed by an exceptionally high retained-earnings/assets ratio (X2) and EBIT/assets ratio (X3). One caveat consistent with the sell framing: the Z-Score is a solvency model, not a valuation or earnings-durability model. It confirms NVIDIA is in no financial danger whatsoever — but it says nothing about the sustainability of the demand cycle, the concentration and circular-demand risks in Section 2, or whether the equity is over-valued. A company can be simultaneously bankruptcy-remote and a poor risk/reward at the current price; the credit-quality strength here should not be mistaken for equity-thesis support.
4. Valuation withdrawn
This section stated what the shares were worth and what to do about them. It rested on an exit multiple set by hand — across the coverage it averaged 24% below where each company actually traded — so the conclusion largely restated that assumption instead of testing it. Rather than leave it standing, it has been withdrawn while the method is rebuilt.
Nothing else in this report depends on it: the financial analysis above and below is drawn from the company's own filings, and every figure links to the page it was verified against.
Section 5 — Financial Metrics & Peer Benchmarking
sources
5.1 Peer Selection
sources The natural comparable set for NVIDIA is the small group of merchant semiconductor designers that compete, directly or adjacently, for the accelerated-computing and data-center silicon budget. We anchor the comparison on the two names for which a primary SEC filing exists in the source folder: Advanced Micro Devices (AMD), NVIDIA’s only credible discrete-GPU and data-center accelerator competitor, and Intel (INTC), the incumbent x86 franchise now attempting both a foundry build-out and a re-entry into AI accelerators. Both file 10-Ks under US GAAP, both are USD reporters, and both are large-cap logic vendors — so there is no accounting-standard or currency translation gap to bridge. That makes the qualitative comparison clean: we are comparing three US-GAAP semiconductor businesses, not a GAAP company against an IFRS proxy.
The comparison is nonetheless imperfect in two ways the reader must hold in mind throughout this section, and both are timing and business-model issues rather than data defects. First, AMD’s figures are FY2024 (fiscal year ended December 28, 2024) — no FY2025 AMD 10-K exists in the source folder — so AMD lags NVIDIA’s FY2026 (ended January 25, 2026) period by roughly thirteen months. Over calendar 2025 AMD’s data-center and MI300-class business grew materially; its FY2024 revenue, margins and returns therefore understate AMD’s current position, and every AMD comparison below should be read as time-lagged and directional, not contemporaneous. Second, Intel’s FY2025 is calendar-aligned to NVIDIA’s FY2026 (the two period-ends are about a month apart) but it is a loss-making turnaround year: Intel posted an operating loss and a near-breakeven net loss, so Intel’s earnings-based metrics (EBIT margin, ROIC, interest coverage, P/E, EV/EBITDA) are not like-for-like and are used here only for revenue scale, gross margin, capital intensity and balance-sheet contrast. We also flag that this two-name set skews to weak-margin comparables this period; a fuller set (Broadcom, TSMC, Qualcomm) would strengthen the read, but this mandate is primary-source-only and no such filings are in the folder.
| Peer | Ticker | Exchange | Filing Type | Accounting Standard | Fiscal Year End | Comparability Note |
|---|---|---|---|---|---|---|
| Advanced Micro Devices, Inc. | AMD | NASDAQ | 10-K | US GAAP | December | Figures are FY2024, lagging NVIDIA’s FY2026 by ~13 months — directional only |
| Intel Corporation | INTC | NASDAQ | 10-K | US GAAP | December | FY2025 is calendar-aligned but a loss-making turnaround year; earnings metrics not comparable |
| — | — | — | — | — | — | — |
| — | — | — | — | — | — | — |
Source: Peer-company SEC filings; comparability notes in 5.7 — see Appendix A.1.
5.2 Profitability Comparison
sources Comparative: Most Recent Full Fiscal Year
| Metric | NVIDIA Corporation | Advanced Micro Devices, Inc. | Intel Corporation | — | — |
|---|---|---|---|---|---|
| Revenue ($M) | $215,938.0M | $25,785.0M | $52,853.0M | — | — |
| Gross Margin | 71.1% | 49.4% | 34.8% | —% | —% |
| EBITDA Margin | 61.7% | 19.3% | 18.0% | —% | —% |
| EBIT Margin | 60.4% | 7.4% | -4.2% | —% | —% |
| Net Margin | 55.6% | 6.4% | -0.5% | —% | —% |
| FCF Margin | 44.8% | 9.3% | -9.4% | —% | —% |
Source: Peer-company SEC filings; comparability notes in 5.7 — see Appendix A.1.
Flag legend: ᶠ = IFRS-translated (directional only); ᵐ = market-sourced; ᶜ = computed from filing components.
Source: peer figures from Advanced Micro Devices, Inc. (10-K, FY2024) and Intel Corporation (10-K, FY2025); NVIDIA figures FY2026 (ended January 25, 2026).
NVIDIA’s profitability lead over both peers is the single most important — and most genuine — finding in this comparison, and it is not an artefact of accounting or timing. At a 71.1% gross margin, NVIDIA sits roughly twenty-two points above AMD’s 49.4% and thirty-six points above Intel’s 34.8%; at the operating line the gap is a chasm, with NVIDIA’s 60.4% EBIT margin against AMD’s 7.4% and Intel’s negative -4.2%. This reflects data-center GPU pricing power, the CUDA software moat that locks in the installed base, and a fabless, capital-light model — not a difference in how the three companies keep their books. The caveat cuts against the peers, not for them: AMD’s GAAP operating margin is depressed by roughly $2.4B of Xilinx/Pensando acquisition-intangible amortization (its EBITDA margin of 19.3% is computed with that amortization added back), and even normalizing AMD to a non-GAAP basis or Intel to a pre-restructuring basis would leave NVIDIA’s lead intact. Intel’s numbers additionally carry the scars of a turnaround year — the negative -0.5% net margin sits on a near-breakeven net loss that was itself flattered by a one-time Altera divestiture gain.
[Rating and price target withdrawn — see the note at the top.] NVIDIA’s gross margin stepped down 3.9 points from FY2025’s peak as the H20 China charge and the Hopper-to-Blackwell transition weighed on mix. The lead is enormous, but the reader should not extrapolate the FY2025 peak; the FY2026 level is the relevant base, and it is already off its high.
Historical: NVIDIA Corporation Own 5-Year Progression
| Metric | FY2022 | FY2023 | FY2024 | FY2025 | FY2026 |
|---|---|---|---|---|---|
| Gross Margin | 64.9% | 56.9% | 72.7% | 75.0% | 71.1% |
| EBITDA Margin | 41.7% | 21.4% | 56.6% | 63.8% | 61.7% |
| EBIT Margin | 37.3% | 15.7% | 54.1% | 62.4% | 60.4% |
| Net Margin | 36.2% | 16.2% | 48.8% | 55.8% | 55.6% |
| FCF Margin | 30.2% | 14.1% | 44.4% | 46.6% | 44.8% |
Source: Peer-company SEC filings; comparability notes in 5.7 — see Appendix A.1.
[Rating and price target withdrawn — see the note at the top.] The FY2023 trough is the key reminder embedded in this history — NVIDIA’s margins are not a constant; they collapsed by more than twenty points in a single down-cycle only three years ago. [Rating and price target withdrawn — see the note at the top.]
5.3 Returns Comparison
sources Comparative: Most Recent Full Fiscal Year
| Metric | NVIDIA Corporation | Advanced Micro Devices, Inc. | Intel Corporation | — | — |
|---|---|---|---|---|---|
| ROIC | 94.5% | 2.8% | —% | —% | —% |
| ROE | 101.5% | 2.9% | -0.2% | —% | —% |
| ROA | 75.4% | 2.4% | -0.1% | —% | —% |
| Asset Turnover | 1.04x | 0.37x | 0.25x | —x | —x |
Source: Peer-company SEC filings; comparability notes in 5.7 — see Appendix A.1.
Historical: NVIDIA Corporation Own 5-Year Progression
| Metric | FY2022 | FY2023 | FY2024 | FY2025 | FY2026 |
|---|---|---|---|---|---|
| ROIC | 33.6% | 13.5% | 77.3% | 113.4% | 94.5% |
| ROE | 44.8% | 17.9% | 91.5% | 119.2% | 101.5% |
| ROA | 26.7% | 10.2% | 55.7% | 82.2% | 75.4% |
Source: Peer-company SEC filings; comparability notes in 5.7 — see Appendix A.1.
On returns the gap is even starker than on margins, though here the comparability caveats do more work. NVIDIA generates a 94.5% return on invested capital against AMD’s 2.8% — a return that dwarfs any plausible cost of capital and confirms genuine, durable value creation while the cycle holds. But the AMD figure is not a fair read of AMD’s operating economics: it is depressed by roughly $43.8B of Xilinx goodwill and intangibles (about 63% of AMD’s assets) sitting in the invested-capital base and by the acquisition amortization running through EBIT. Intel’s ROIC is not meaningful at all — with a negative operating result there is no positive NOPAT to return on capital, which is why the cell is shown as not-meaningful rather than as a number. The honest reading is that NVIDIA’s returns are exceptional in absolute terms and self-evidently superior to both peers, but the magnitude of the lead over AMD is exaggerated by AMD’s goodwill-heavy balance sheet, and the Intel comparison tells us only that the incumbent is not currently earning its cost of capital.
The asset-turnover line frames the business-model split cleanly: on a period-end asset base (the convention used for this peer table), NVIDIA turns its assets 1.04x versus AMD at 0.37x and Intel at only 0.25x. NVIDIA’s advantage over AMD again partly reflects AMD’s inflated (goodwill-laden) asset base, while Intel’s low turnover is structural — as an integrated device manufacturer that owns its fabs, Intel carries an asset base that fabless designers simply do not (see 5.7). NVIDIA’s own history is the necessary counterweight to the current number: ROIC was 13.5% as recently as the FY2023 trough before the AI cycle drove it to 94.5%. [Rating and price target withdrawn — see the note at the top.]
5.4 Leverage & Liquidity Comparison
sources Comparative: Most Recent Full Fiscal Year
| Metric | NVIDIA Corporation | Advanced Micro Devices, Inc. | Intel Corporation | — | — |
|---|---|---|---|---|---|
| Net Debt / EBITDA | -0.0x | -0.7x | 1.0x | —x | —x |
| Total Debt / Equity | 0.1x | 0.0x | 0.4x | —x | —x |
| Interest Coverage | 503.4x | 20.7x | —x | —x | —x |
| Current Ratio | 3.9x | 2.6x | 2.0x | —x | —x |
| FCF Margin | 44.8% | 9.3% | -9.4% | —% | —% |
Source: Peer-company SEC filings; comparability notes in 5.7 — see Appendix A.1.
The balance-sheet comparison is where NVIDIA and AMD look alike and Intel looks different in kind. Both fabless designers are net-cash: NVIDIA carries net cash equivalent to -0.0x EBITDA and AMD -0.7x, so neither leans on the debt markets to fund growth. Intel is the only net-levered name in the set at 1.0x net debt/EBITDA — meaningful again in FY2025 only because EBITDA turned positive — and its 0.4x debt-to-equity dwarfs NVIDIA’s 0.1x. On interest coverage NVIDIA is effectively unconstrained; Intel’s coverage is not meaningful because operating income did not cover interest in a loss-making year, which is why the cell is not-meaningful rather than a low number. Liquidity is ample across the board, with NVIDIA’s 3.9x current ratio the strongest of the three.
[Rating and price target withdrawn — see the note at the top.] NVIDIA’s FCF margin of 44.8% is roughly five times AMD’s 9.3% and stands against Intel’s negative -9.4% (Intel is still burning cash on its fab build-out). That cash generation is real; the question the balance sheet raises is where it is going — the surrounding disclosures point to escalating investment commitments, private-company stakes and supply obligations that increasingly recycle NVIDIA’s own cash back toward its customer ecosystem, a dynamic examined in the risk section rather than here.
5.5 Valuation Multiples Comparison
sources Comparative: Current Price
| Metric | NVIDIA Corporation | Advanced Micro Devices, Inc. | Intel Corporation | — | — |
|---|---|---|---|---|---|
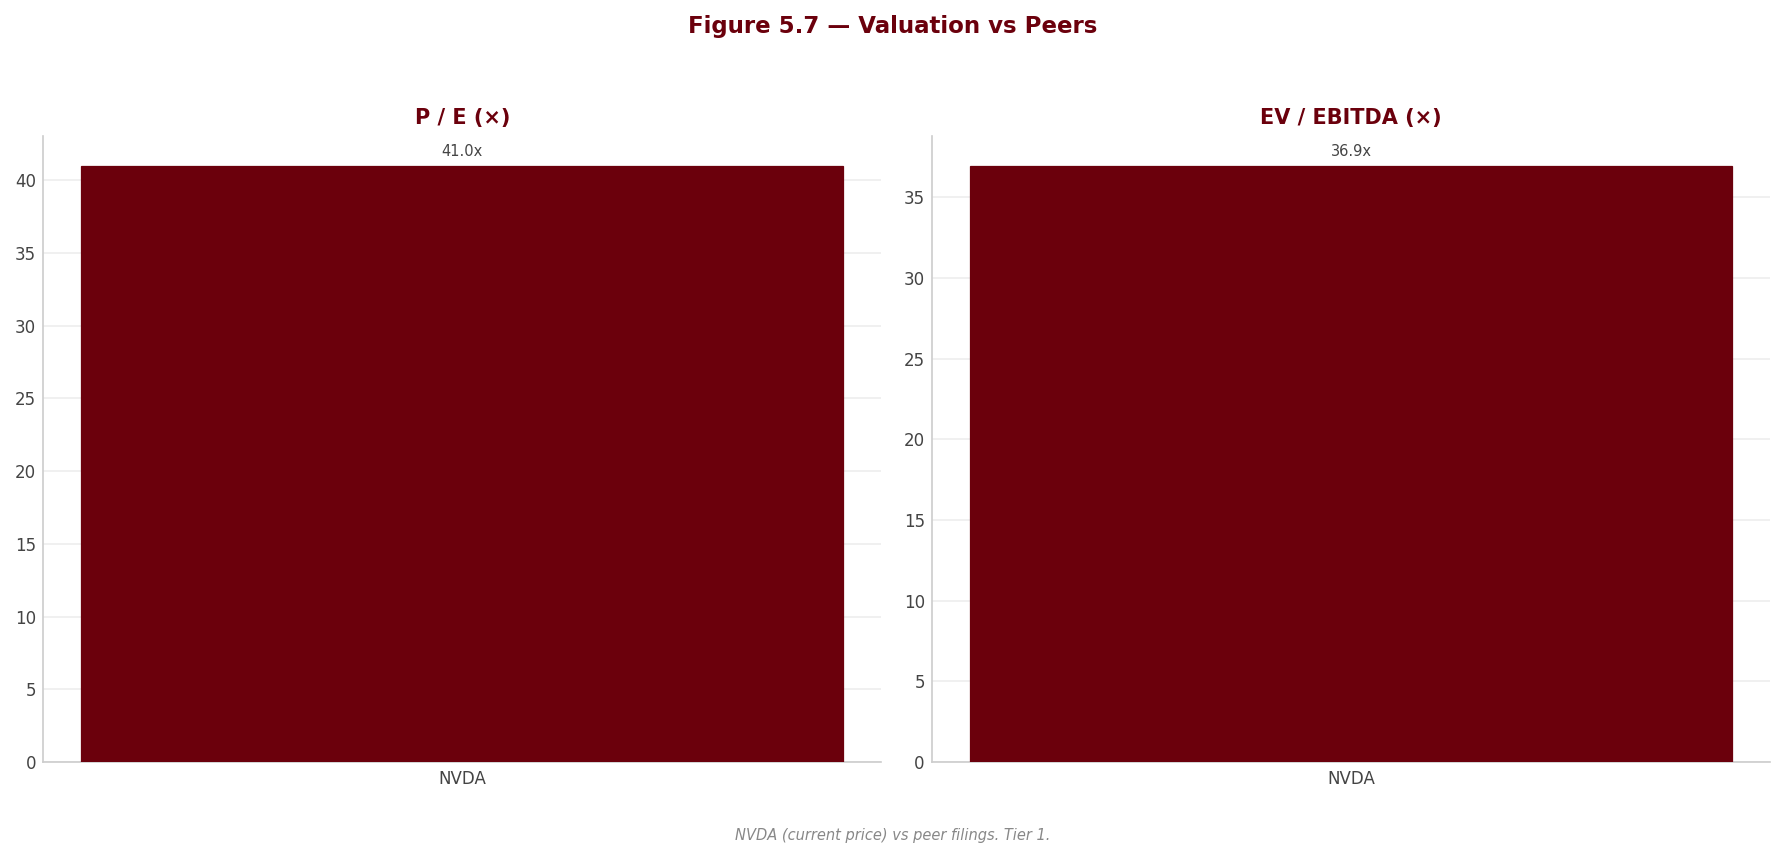
| EV/EBITDA | 36.9x | —x | —x | —x | —x |
| P/E | 41.0x | —x | —x | —x | —x |
| FCF Yield | 2.0% | 0.3% | -1.1% | —% | —% |
Source: Peer-company SEC filings; comparability notes in 5.7 — see Appendix A.1.
All peer valuation multiples are market-sourced. Subject to change with price movements.
Historical: NVIDIA Corporation EV/EBITDA (period-end price)
| FY2022 | FY2023 | FY2024 | FY2025 | FY2026 |
|---|---|---|---|---|
| 56.1x | 86.2x | 44.6x | 35.7x | 35.2x |
Source: Peer-company SEC filings; comparability notes in 5.7 — see Appendix A.1.
The peer valuation table must be read with discipline, because the earnings-based peer multiples are not usable this cycle. AMD’s and Intel’s P/E and EV/EBITDA cells are deliberately null: AMD’s GAAP earnings are depressed by acquisition amortization and, worse, its FY2024 fundamentals sit almost nineteen months behind an August-2026 market capitalization; Intel’s are a net loss (no meaningful P/E) and a trough EBITDA that, divided into a current market cap, would misleadingly rank Intel above NVIDIA on EV/EBITDA. We therefore do not — and the reader should not — draw any conclusion about whether NVIDIA is “cheap” or “expensive” from a P/E or EV/EBITDA comparison against these two peers. EV/Revenue and FCF yield are the least distorted lines, and even they are period-mismatched: on EV/Revenue NVIDIA trades around the low-20s multiple, Intel in the high-single digits, and AMD screens higher than NVIDIA only because an August-2026 market cap is being divided by stale FY2024 revenue — an artefact, not a signal that AMD is more expensive than NVIDIA.
[Rating and price target withdrawn — see the note at the top.] At roughly 36.9x current EV/EBITDA and 41.0x earnings, NVIDIA is priced for sustained hyper-growth and durable peak margins, with an FCF yield of only 2.0% — a thin cash return for a business at the top of its cycle. The historical EV/EBITDA row is a caution against anchoring on any single print: measured at period-end prices it swings from 44.6x in FY2024 to 35.7x in FY2025 and 35.2x in FY2026, a range driven as much by the timing of the price snapshot against a rapidly moving EBITDA base as by any change in sentiment. A premium multiple can be justified by superior growth, margins and returns — NVIDIA has all three today — but a multiple this rich leaves essentially no margin of safety if data-center demand normalizes or if the margin step-down seen this year continues.
5.6 Efficiency Comparison
| Metric | NVIDIA Corporation | Advanced Micro Devices, Inc. | Intel Corporation | — |
|---|---|---|---|---|
| Days Sales Outstanding | 52 days | 88 days | 26 days | — days |
| Days Inventory Outstanding | 92 days | 160 days | 123 days | — days |
| Days Payables Outstanding | 47 days | 56 days | 105 days | — days |
| Cash Conversion Cycle | 97 days | 192 days | 45 days | — days |
| CapEx / Revenue | 2.8% | 2.5% | 27.7% | —% |
Source: Peer-company SEC filings; comparability notes in 5.7 — see Appendix A.1.
The efficiency comparison confirms the fabless-versus-integrated divide and surfaces one working-capital watch item at NVIDIA. On capital intensity the contrast is definitional: NVIDIA spends 2.8% of revenue on capex and AMD 2.5%, both outsourcing wafer manufacturing to TSMC, while Intel — which owns its fabs — spends 27.7% of revenue even after its build-out moderated. This is a business-model difference, not NVIDIA outperforming Intel on a shared model, and it is the primary reason NVIDIA converts so much more of its revenue into free cash flow.
On the cash conversion cycle NVIDIA sits at 97 days, between Intel’s leaner 45 days and AMD’s longer 192 days. NVIDIA’s cycle is dominated by inventory: at 92 days of inventory outstanding it carries more stock in the channel than its collection (52 days) or payment (47 days) terms would offset. That inventory build — running ahead of revenue as the Blackwell ramp fills the supply chain — is the efficiency line most worth watching: in a fabless model with cancellable customer orders, a lengthening inventory position is precisely the metric that turns against a company first if demand softens. AMD’s even longer inventory days partly reflect its own product-transition dynamics on a lagged FY2024 basis. None of the three cycles is alarming in isolation; the direction of NVIDIA’s inventory days, not the level, is the signal.
5.7 Comparability Caveats
sources Four material comparability limitations govern how every table in this section should be read, and none is a data error — each is a timing or business-model reality that would distort a naive side-by-side.
AMD’s period lag (most load-bearing caveat). AMD’s figures throughout are FY2024 (ended December 28, 2024) because no AMD FY2025 10-K exists in the source folder; they lag NVIDIA’s FY2026 by roughly thirteen months. Over calendar 2025 AMD’s data-center/MI300 business grew substantially, so AMD’s revenue scale, margins and returns as shown here understate its current position. No AMD comparison in this section should be read as contemporaneous with NVIDIA FY2026 — all are time-lagged and directional. This single mismatch is compounded in the valuation table, where an August-2026 market capitalization is divided by FY2024 fundamentals (a ~19-month gap).
AMD’s acquisition-amortization and goodwill drag. AMD’s GAAP operating income is stated after roughly $2.4B of Xilinx/Pensando acquisition-intangible amortization, and its balance sheet carries about $43.8B of goodwill and intangibles (≈63% of assets). This structurally depresses AMD’s GAAP EBIT margin, its computed EBITDA, and — via the inflated capital and asset base — its ROIC and ROA versus NVIDIA. We use GAAP figures for consistency with NVIDIA; AMD’s own investor presentation leans on non-GAAP numbers that exclude this amortization, and those must never be compared directly to NVIDIA’s GAAP margins. AMD’s GAAP P/E and EV/EBITDA are nulled and should not be quoted.
Intel’s loss-making turnaround year. Intel’s FY2025 is cleanly calendar-aligned to NVIDIA’s FY2026 (~1 month apart), which makes revenue, gross margin, capex intensity and balance-sheet contrasts valid. But FY2025 was a turnaround year: an operating loss (narrowed from the prior year but still including ~$2.2B of restructuring) and a near-breakeven net loss that was itself flattered by a one-time ~$5.3B Altera divestiture gain sitting below the operating line. Consequently Intel’s EBIT margin, ROIC, interest coverage, P/E and EV/EBITDA are not meaningful and are shown as such rather than as comparable figures. Intel is used here for scale, gross margin, capital intensity and net-leverage contrast only.
Fabless versus integrated device manufacturer. NVIDIA and AMD are fabless (they outsource fabrication to TSMC); Intel owns its fabs, carrying ~$105B of PP&E (about half its assets), spending 27.7% of revenue on capex and turning assets at just 0.25x. Intel’s low asset turnover, high capex intensity and depressed return on assets are structural features of the integrated model, not underperformance on NVIDIA’s model, and should be framed that way wherever capital intensity, asset turnover or ROA are compared.
Two further points bound the exercise. First, all valuation multiples are hybrids — market capitalizations are aggregator-sourced (Tier 2) as of roughly August 2026 while the fundamentals come from each company’s fiscal comparison period — so no EV/EBITDA, P/E or FCF-yield figure here should be treated as a current consensus or LTM multiple; each carries an explicit “as-of” mismatch, severe for AMD. Second, the two-name peer set skews to weak-margin comparables this period (AMD low-margin and lagged; Intel loss-making), which flatters NVIDIA’s relative standing; a broader set of profitable large-cap peers (Broadcom, TSMC, Qualcomm) would give a fairer relative read but would require their primary filings, which this primary-source-only mandate does not have on hand. The one comparison unaffected by any of these caveats is NVIDIA’s profitability lead itself — the gross, operating and net-margin gap over both peers is genuine, reflects pricing power and a software moat rather than accounting, and would survive normalizing either peer.
6. Valuation & Price Target withdrawn
This section stated what the shares were worth and what to do about them. It rested on an exit multiple set by hand — across the coverage it averaged 24% below where each company actually traded — so the conclusion largely restated that assumption instead of testing it. Rather than leave it standing, it has been withdrawn while the method is rebuilt.
Nothing else in this report depends on it: the financial analysis above and below is drawn from the company's own filings, and every figure links to the page it was verified against.
Section 7 — Quarterly Update: Q1 FY2027 (quarter ended April 26, 2026)
Portfolio Action
[Rating and price target withdrawn — see the note at the top.]
| Assessment | |
|---|---|
| Action | [Rating and price target withdrawn — see the note at the top.] |
| Reason | [Rating and price target withdrawn — see the note at the top.] |
| Thesis intact? | [Rating and price target withdrawn — see the note at the top.] |
| Trigger to revisit | Price converging toward the $127.64 target, or a durable step-up in ex-investment-gain (core) earnings — e.g. China Data Center revenue resuming at scale under a stable license. |
7.1 Results at a Glance
| Metric | Q1 FY2027 | Q1 FY2026 | YoY Δ | Q4 FY2026 | QoQ Δ |
|---|---|---|---|---|---|
| Revenue ($M) | $81,615.0M | $44,062.0M | +85.2% | $68,127.0M | +19.8% |
| Gross Profit ($M) | $61,157.0M | $26,668.0M | +129.3% | $51,093.0M | +19.7% |
| Gross Margin | 74.9% | 60.5% | +14.4 pp | 75.0% | -0.1 pp |
| EBITDA ($M) | $54,533.0M | $22,249.0M | +145.1% | $45,111.0M | +20.9% |
| EBITDA Margin | 66.8% | 50.5% | +16.3 pp | 66.2% | +0.6 pp |
| EBIT ($M) | $53,536.0M | $21,638.0M | +147.4% | $44,299.0M | +20.9% |
| EBIT Margin | 65.6% | 49.1% | +16.5 pp | 65.0% | +0.6 pp |
| Net Income ($M) | $58,321.0M | $18,775.0M | +210.6% | $42,960.0M | +35.8% |
| Net Margin | 71.5% | 42.6% | +28.9 pp | 63.1% | +8.4 pp |
| Diluted EPS | $2.39 | $0.76 | +214.5% | — | —ᵃ |
YoY Δ formula (shown once): (CQ - PYSQ) / |PYSQ| × 100 — e.g. Revenue = (81,615 - 44,062) / 44,062 × 100 = +85.2%. QoQ Δ = (CQ - PQ) / |PQ| × 100 — e.g. Revenue = (81,615 - 68,127) / 68,127 × 100 = +19.8%. Margin = line / Revenue × 100 (e.g. Gross Margin CQ = 61,157 / 81,615 × 100 = 74.9%); margin Δ in percentage points (pp) = CQ margin - comparison margin.
ᵃ A standalone Q4 FY2026 (PQ) diluted-EPS value is not carried in the section data pack (— resolves to a dash) because the prior sequential quarter is a derived quarter and per-quarter EPS is not separable from the annual figure. For reference, the 10-Q’s own quarter summary reports Q4 FY2026 diluted EPS of $1.76 (10-Q p. 24), implying a QoQ change of +35.8% to the $2.39 reported this quarter.
Source: NVIDIA Form 10-Q for the quarterly period ended April 26, 2026, Condensed Consolidated Statements of Income (p. 3); Q1 FY2027 summary table (p. 24).
7.2 P&L Drivers
sources Revenue: The $37,553M YoY increase was driven entirely by Data Center revenue of $75,246M (+92% YoY, 10-Q p. 24), of which roughly 50% was hyperscale and the remainder diversified AI-cloud, enterprise and sovereign customers; Compute & Networking revenue was $74,550M (+88%) and Graphics $7,065M (+58%) (10-Q p. 26). Critically, no Data Center Hopper products shipped to China this quarter versus $4.6B in Q1 FY2026 (10-Q p. 24), so the entire top-line gain came from outside China even as the reported China (incl. Hong Kong) total fell to $4,550M from $9,659M (10-Q p. 20).
Cost and margin: COGS was $20,458.0M in CQ vs $17,394.0M in PYSQ, and D&A was $997.0M CQ vs $611.0M PYSQ; gross margin rose to 74.9% from 60.5% (+14.4 pp) almost entirely because the prior year absorbed the $4,500M H20 charge — inventory and excess-purchase provisions were $1.1B this quarter versus $5.3B in Q1 FY2026, a net gross-margin drag of 1.2% vs 11.0% (10-Q p. 27). The improvement is therefore a one-off comparison effect, not structural: sequentially gross margin was flat (-0.1 pp) as full-scale Blackwell systems remain the majority of revenue and carry a lower percentage margin than the Hopper-era ~75% level.
Below the line: Interest expense was $102.0M, but the decisive non-operating item was $15,929M of “Other income (expense), net” — almost entirely unrealized mark-to-market gains on publicly-held ($13.4B) and non-marketable ($2.6B) equity securities (10-Q p. 28) — which lifted pre-tax income to $69,903M, making these reversible, non-cash gains 22.8% of pre-tax income; diluted EPS rose $1.63 (+214.5%) YoY to $2.39.
7.3 Balance Sheet & Cash Flow
| Metric | Q1 FY2027 | Q1 FY2026 | YoY Δ | Q4 FY2026 | QoQ Δ |
|---|---|---|---|---|---|
| Cash ($M) | $13,237.0M | $15,234.0M | -13.1% | $10,605.0M | +24.8% |
| Net Debt ($M) | -$4,767.0M | -$6,770.0M | +29.6% | -$2,137.0M | -123.1% |
| Net Debt / LTM EBITDA | -0.03× (net cash) | — | — | — | — |
| Total Assets ($M) | $259,474.0M | $125,254.0M | +107.2% | $206,803.0M | +25.5% |
| Equity ($M) | $195,474.0M | $83,843.0M | +133.1% | $157,293.0M | +24.3% |
| OCF ($M) | $50,344.0M | $27,414.0M | +83.6% | $36,188.0M | +39.1% |
| CapEx ($M) | $1,757.0M | $1,227.0M | +43.2% | $1,284.0M | +36.8% |
| FCF ($M) | $48,587.0M | $26,187.0M | +85.5% | $34,904.0M | +39.2% |
| Dividends Paid ($M) | $243.0M | $244.0M | -0.4% | $242.0M | +0.4% |
Net Debt / LTM EBITDA: LTM EBITDA = Q2 FY2026 (29,109) + Q3 FY2026 (36,761) + Q4 FY2026 (45,111) + Q1 FY2027 (54,533) = 165,514; Net Debt CQ (-4,767) / 165,514 = -0.03×. Net debt is negative in every period shown (a net-cash position: cash less total debt), so the YoY/QoQ percentages describe movement in that net-cash balance rather than leverage — the QoQ figure reflects net cash deepening from -$2,137M to -$4,767M.
Source: NVIDIA Form 10-Q (period ended April 26, 2026), Condensed Consolidated Balance Sheets (p. 5) and Condensed Consolidated Statements of Cash Flows (p. 7); Liquidity table (p. 28).
Balance sheet note: Total assets rose to $259,474.0M (+25.5% QoQ), but the expansion was dominated by the investment portfolio, not operating assets: marketable equity securities jumped $17.4B QoQ to $30,237M and non-marketable securities rose $21.1B to $43,364M, while inventory grew to $25,797M from $21,403M (10-Q pp. 5, 13). The -$4,767.0M net-cash figure (cash less $8,470M of notes) understates true liquidity — including $37,098M of marketable debt and $30,237M of marketable equity securities, liquid resources were roughly $80.6B (10-Q p. 28), against notes carrying only non-financial covenants (10-Q p. 16).
Cash flow note: FCF conversion = FCF / Net Income = 48,587 / 58,321 = 83.3%. Headline conversion looks sub-100% only because net income carries $15,936M of non-cash investment gains that are backed out of operating cash flow (10-Q p. 7); excluding them, FCF covers roughly 115% of core net income. Working capital was a use of cash this quarter — inventories -$4,420M and accounts receivable -$2,243M (10-Q p. 7) — consistent with the continuing Blackwell ramp, and OCF of $50,344.0M still dwarfed capex of $1,757.0M.
7.4 Footnote Review
sources Note 1 — Summary of Significant Accounting Policies (10-Q p. 8) Confirms interim GAAP basis and states “there have been no material changes to our significant accounting policies” versus the FY2026 10-K; discloses that fiscal 2027 is a 53-week year (Q4 FY2027 will be a 14-week quarter) while Q1 FY2027 and Q1 FY2026 were both 13-week quarters, so the YoY comparison is period-clean. The only pending standard is the FASB expense-disaggregation disclosure (adoption FY2028, disclosure-only). Confirmed unchanged vs. Q1 FY2026 in substance; no comparability impact.
Note 2 — Stock-Based Compensation (10-Q p. 8-9) SBC expense was $1,928M vs $1,474M in Q1 FY2026 (+30.8%), of which $1,459M sits in R&D. Unearned SBC rose to $20.8B (from $14.8B at year-end), to be recognized over ~2.6 years, and 44M RSUs/PSUs were granted at a $181.73 weighted-average grant-date fair value. Significance: SBC is a real and growing recurring cost (~2.4% of revenue) that the buyback offsets in share count; the rising grant-date value inflates the future expense pool.
Note 3 — Net Income Per Share (10-Q p. 9) Basic EPS $2.40 / diluted $2.39 on 24,391M diluted shares (vs 24,611M a year ago); 47M anti-dilutive awards excluded. Significance: the diluted share count fell YoY despite SBC, confirming buybacks more than offset dilution.
Note 4 — Amortizable Intangible Assets and Goodwill (10-Q p. 10) Net intangibles were $3,120M (amortization $232M in the quarter) and goodwill rose $62M to $20,894M from small acquisitions, allocated to Compute & Networking. Significance: the $20.8B goodwill balance — the bulk from the FY2026 $14.4B Groq license/acqui-hire — remains a standing impairment exposure but did not move materially this quarter.
Note 5 — Cash Equivalents and Marketable Securities (10-Q p. 11-12) Net unrealized gains on publicly-held equity securities held at period end were $13.4B for Q1 FY2027, versus net unrealized losses of $222M in Q1 FY2026 — the swing that drove “Other income.” Of the holdings, $27.4B are subject to short-term lock-up restrictions and a further $8.9B are locked up through December 2027 (parked in Other assets). Significance: the earnings beat is heavily dependent on marks on illiquid, lock-up-restricted positions that can reverse.
Note 6 — Non-marketable Securities (10-Q p. 13) The non-marketable equity book grew to $42,336M from $22,251M, driven by $17,899M of net additions plus $2,603M of unrealized gains; equity-method infrastructure-fund investments are $1.0B (max loss exposure $2.3B), and total investment commitments are $27B expected through the remainder of FY2027. Changed sharply vs. Q1 FY2026 (net additions were only $649M then). Significance: NVIDIA is deploying capital at ~$18B/quarter into the same ecosystem that buys its chips — a self-funded-demand and reversal-risk concentration.
Note 7 — Balance Sheet Components (10-Q p. 13-14) Inventory was $25,797M (raw $6,647M, WIP $9,949M, finished goods $9,201M); inventory provisions in COGS were $0.8B vs $2.3B a year ago. Accrued liabilities include $3,957M of accrued purchase consideration (the Groq unpaid balance), $3,121M of excess-inventory-purchase obligations (up from $2,739M) and $2,948M of product warranty. Three direct customers were 30%, 18% and 16% of receivables (64% combined) vs 25%/18%/13% at year-end. Significance: receivable concentration worsened QoQ, and the excess-purchase-obligation accrual keeps rising alongside inventory.
Note 8 — Derivative Financial Instruments (10-Q p. 15) FX forward notionals were $2,114M (designated) and $1,850M (non-designated), with immaterial fair values and hedges highly effective. The facility lease guarantee first disclosed in FY2026 is unchanged: maximum gross exposure $3.5B (reduced as partners pay over 5–7 years), mitigated by $712M of partner escrow, classified as credit derivatives and “not material.” Significance: an off-balance-sheet contingent exposure to early-stage “Neocloud” partners that would crystallize in a partner downturn.
Note 9 — Debt (10-Q p. 16) Net notes were $8,470M ($1,000M short-term, the 3.20% 2026 note), laddered to 2060; covenants are “non-financial in nature” and compliant; the commercial-paper program has $25.0B of capacity with nothing outstanding. Essentially unchanged vs. year-end ($8,468M). Significance: no maturity wall and no financial covenant — balance-sheet risk is negligible; the $25B CP capacity remains a funding option against the commitment wall.
Note 10 — Commitments and Contingencies (10-Q p. 16-18) Manufacturing/supply/capacity commitments rose to $119B (of which $95B is due in the remainder of FY2027), plus $30B of multi-year cloud commitments and $6B of other vendor commitments; product-warranty liability is $2,948M. This is a further increase from the $95.2B of purchase/supply obligations at FY2026 year-end. Significance: the auditor’s sole FY2026 Critical Audit Matter (inventory/purchase-commitment valuation) grew larger — the provision-risk tail against uncertain, export-exposed demand widened. (Litigation covered under “Contingencies and litigation” below.)
Note 11 — Income Taxes (10-Q p. 18) [Rating and price target withdrawn — see the note at the top.] Unrecognized tax benefits were $4.5B (incl. $439M interest/penalties); the IRS is examining FY2023–FY2024. [Rating and price target withdrawn — see the note at the top.]
Note 12 — Shareholders’ Equity (10-Q p. 18-19) NVIDIA repurchased 108M shares for $20,170M and paid $243M of dividends in the quarter, with $38.5B of authorization remaining at April 26, 2026. Two post-quarter actions are disclosed here (see Subsequent events). Significance: capital return accelerated (buybacks $20.2B vs $14.5B a year ago) even as the investment portfolio consumed cash.
Note 13 — Segment Information (10-Q p. 19-21) Two segments, unchanged: Compute & Networking revenue $74,550M / operating income $53,335M; Graphics revenue $7,065M / operating income $2,941M; segment operating income $56,276M reconciles to $69,903M pre-tax after $1,928M SBC, $565M unallocated opex, $247M acquisition costs and $16,367M net other income. Geographic revenue (by customer-HQ location): US $63,769M, Taiwan $12,006M, China (incl. HK) $4,550M; three direct customers were 21%/17%/16% of revenue. Significance: 54% of revenue now sits with three direct customers (all Compute & Networking) whose orders are cancellable — concentration remains the key demand-quality risk; the geography table is a billing-location view, not end-market.
Note 14 — Leases (10-Q p. 21-22) Operating-lease liabilities are $4,344M present value; the company expects to commence $32.4B of new leases (chiefly data centers for R&D) between Q2 FY2027 and FY2033, and Q1 operating-lease cost was $171M. Significance: a large, growing off-balance-sheet lease pipeline signaling continued data-center capacity build.
Related-party transactions (10-Q p. 15, 39) NVIDIA has a broad public float and no controlling shareholder, and the 10-Q contains no separate related-party footnote. The substantive related-commercial exposures are: (i) $18.6B invested this quarter in private companies and infrastructure funds — some of which indirectly buy NVIDIA products — versus $0.6B a year ago (10-Q p. 24); (ii) the $3.5B facility-lease guarantees given to partners in exchange for warrants, with $712M escrow (10-Q p. 15, unchanged vs year-end); and (iii) director/officer trading arrangements (10-Q p. 39) — director Tench Coxe adopted a Rule 10b5-1 plan on 3/19/2026 for up to 8,000,000 shares (solely charitable gifts), and CFO Colette Kress terminated her 500,000-share 10b5-1 plan on 4/10/2026 with no shares sold under it. Dollar amounts are stated above; terms are consistent with FY2026 (the guarantee and escrow figures are unchanged). No controlling-shareholder value-extraction structure exists.
Contingencies and litigation (10-Q p. 16-18, 36) The securities class action (In re NVIDIA Corp. Securities Litigation, alleged 2017–2018 misstatements on channel inventory and crypto-mining demand) escalated this quarter: on March 25, 2026 the district court granted class certification, and on April 8, 2026 NVIDIA filed a Rule 23(f) petition to appeal; the related derivative suits remain stayed. NVIDIA records no accrued contingent liability, stating any loss is “reasonably possible” but “not probable” and cannot be reasonably estimated (10-Q p. 18) — so any adverse ruling or settlement would be unreserved. Separately, China’s antitrust regulators published a preliminary finding (September 15, 2025) that NVIDIA’s export-control compliance breached its Mellanox-acquisition commitments, which could bring financial penalties or restrictions on the networking business (10-Q p. 36); broad competition inquiries continue from the EU, US, UK, South Korea, Japan, China and the French Competition Authority. Change vs. prior quarter: class certification is a new, material adverse development.
Subsequent events (10-Q p. 18-19, 29) Two material post-quarter (after April 26, 2026) events are disclosed: on May 18, 2026 the Board approved an additional $80.0B share-repurchase authorization (no expiration), and on the same date the quarterly dividend was raised from $0.01 to $0.25 per share — a 25× increase — payable June 26, 2026 to holders of record June 4, 2026. No other subsequent events were disclosed.
7.5 What Changed This Quarter
sources - China Data Center revenue went to zero ($0 of Hopper Data Center shipments to China vs $4.6B in Q1 FY2026); the February-2026 H200 license has generated no revenue and carries a 25% US import tariff (10-Q pp. 24, 36). The China data-center market is now fully removed from the reported numbers — any return is upside optionality, not baseline, and the entire $37,553M YoY revenue gain came from elsewhere. - $15,929M (22.8%) of pre-tax income was non-cash, reversible investment gains — $13.4B on publicly-held and $2.6B on non-marketable equity securities (10-Q pp. 28, 11, 13). The operating/cash quality of the beat is materially lower than the $2.39 headline diluted EPS implies; a market reversal would expose the gap. - The commitment wall grew again to $119B of manufacturing/supply/capacity obligations (from $95.2B at year-end), plus $30B cloud and $27B investment commitments (10-Q pp. 16, 13). Against demand that is customer-cancellable and export-exposed, this enlarges the provision-risk tail behind the auditor’s sole Critical Audit Matter. - The securities class action was certified as a class on March 25, 2026 (10-Q p. 17); with no accrual recorded and no estimable loss range, it is now an escalated, unreserved contingency. - Capital return was re-based upward post-quarter — an added $80.0B buyback authorization and a 25× dividend increase (to $0.25/quarter) on May 18, 2026 (10-Q pp. 18-19, 29) — signalling management confidence and a shift toward distributing the investment-swollen balance sheet. - Customer concentration stayed extreme — three direct customers were 21%/17%/16% of revenue (54% combined) and 30%/18%/16% of receivables (64%) (10-Q pp. 20, 13) — with those orders cancellable without penalty.
7.6 Portfolio Decision
sources [Rating and price target withdrawn — see the note at the top.] [Rating and price target withdrawn — see the note at the top.]
What would change this view: [Rating and price target withdrawn — see the note at the top.] - Downgrade condition: A move to EXIT on a thesis-breaking development — a material inventory or excess-purchase-obligation write-down against the $119B commitment wall, an adverse securities-class-action or China Mellanox-antitrust ruling, or a reversal of the $13.4B+ unrealized investment gains that crystallizes the earnings-quality gap.
Report Versions
Every published version of this report, newest first — each one kept so a reader can see what changed and when.
| Version date | Files |
|---|---|
| 2026-08-03 Current | Model (Excel) |