
Microsoft Corporation
Section 1 — Business Overview, Operations & Competitive Positioning
1.1 The Business
sources Microsoft sells mission-critical software and cloud infrastructure to enterprises and consumers on a recurring, subscription- and consumption-based model, monetising one of the largest installed bases in technology through contractually sticky relationships that it is now extending, layer by layer, into artificial intelligence.
The company generates revenue four ways: cloud-based services and content delivered as subscriptions and metered consumption; licensing and support of software; online advertising; and the design and sale of devices. The economic engine is not any single product but the integrated stack — identity, security, data, productivity and compute — sold into corporate IT budgets that renew year after year. Its largest and fastest-growing revenue pools are consumption-based cloud services (Azure) and per-user productivity subscriptions (Microsoft 365 Commercial), both of which management now positions as AI-powered platforms. Management identifies its most significant costs as employee compensation, the operation and expansion of cloud datacentres, the design and marketing of products, and income taxes — a cost structure that has shifted decisively toward capital-intensive datacentre build-out as the AI cycle has accelerated. In FY2026 the company generated revenue of $331,839.0M, capping a decade of near-continuous double-digit growth from $91,154.0M in FY2016. It operates globally, with a large full-time workforce split between the United States and international locations and spread across datacentre operations, product research and development, sales and marketing, and administration; the business trades under the ticker MSFT.
Key Information
| Item | Value |
|---|---|
| Ticker | MSFT |
| Sector / Industry | Information Technology |
| Report Date | 2026-08-19 |
| Most Recent FY Revenue | $331,839.0M |
| EBIT Margin (Most Recent FY) | 46.8% |
| Weighted-Avg Diluted Shares (FY2026) | 7,453M |
| Current Price | $481.63 |
Source: Company SEC filings (10-K); see Appendix A.1.
1.2 Operating Segments
sources Microsoft reports through three segments — Productivity and Business Processes, Intelligent Cloud, and More Personal Computing. The segment structure is unchanged this year, though management renamed several product lines within More Personal Computing (Gaming became XBOX, Search and news advertising became Search advertising) and removed the Microsoft 365 Consumer subscribers disclosure. Segment-level revenue is not reproduced in this section’s data pack; the sizing below is therefore qualitative, with the full recast three-year segment series treated in Section 3.
Productivity and Business Processes is the productivity, communication and information franchise: Microsoft 365 Commercial and Consumer, LinkedIn, and Dynamics. The revenue model is per-user subscription, and the one variable that drives it is seats multiplied by average revenue per user — expanded today by the continued migration from on-premises Office to the cloud, by higher-tier mixes such as Microsoft 365 E5, and by the incremental per-seat pricing of Microsoft 365 Copilot. LinkedIn monetises professional engagement across Talent, Marketing, Premium and Sales Solutions; Dynamics monetises the shift of business applications to the Dynamics 365 cloud. This is the most annuity-like part of the company and the clearest near-term vehicle for AI monetisation, because Copilot attaches directly to an installed base already paying monthly.
Intelligent Cloud is the growth core: Azure and other cloud services, the traditional server products (SQL Server, Windows Server), and enterprise and partner services. Azure is a consumption business — revenue is driven principally by infrastructure- and platform-as-a-service usage across the global datacentre network — so its single most important variable is workload consumption, now increasingly AI training and inference. Management positions Azure AI, custom silicon and the Azure AI Foundry platform as its competitive edge in supplying AI compute at scale. This is where the capital is going and where the AI thesis will be proved or disproved.
More Personal Computing puts the consumer and the device at the centre: Windows and Devices (chiefly Windows OEM licensing plus Surface), XBOX (hardware, content, Game Pass and cloud gaming), and Search advertising (Bing, Copilot, Edge). Its economics are more heterogeneous and more cyclical — Windows OEM revenue tracks PC unit volumes and the emerging AI-PC category, XBOX is driven by subscriptions and first- and third-party content, and Search by query volume and revenue per search. This is the smallest and structurally weakest leg: management reports XBOX revenue declining and Windows exposed to PC-market cyclicality, offset only in part by Search advertising growth.
The three segments function as a single flywheel rather than a portfolio. A common substrate of identity, security and data spans all of them; Microsoft 365 seats pull Azure consumption; Windows sustains engagement with Edge, Bing, Copilot and Teams that feeds the cloud; and Copilot is being layered horizontally across every surface. The synergy is real and is the source of the switching costs discussed below. The fragility is concentration: growth and incremental margin now depend overwhelmingly on the two cloud-facing segments, while More Personal Computing is a mature, partly declining ballast — and the entire system’s forward economics hinge on the returns from an unprecedented datacentre build.
1.3 Geographic Exposure
sources Microsoft’s customers, employees and infrastructure are distributed worldwide, and a significant portion of both revenue and expense is earned and incurred outside the United States, much of it denominated in currencies other than the U.S. dollar. The company reports in dollars and hedges a portion of its international currency exposure; management notes that foreign-exchange movements increased reported revenue in FY2026 and did not have a material impact on reported expenses. The practical consequence for the analyst is that reported top-line growth carries a currency component that flatters or dampens the underlying constant-currency trend and must be read as such. Beyond broad currency sensitivity, the geographic footprint concentrates operational risk in the availability of buildable land, power and permits for datacentres and in an increasingly fragmented cross-border regulatory landscape; the substantive treatment of those exposures — trade and export controls, digital-market regulation and data-localisation — belongs to Section 2.
1.4 Management Team
sources The leadership team is deep, stable and, by the standards of a company this size, unusually long-tenured — a genuine asset for an investor underwriting a multi-year AI transition. Satya Nadella is the anchor: Chairman and Chief Executive Officer, CEO since February 2014 and Chairman since June 2021, and the architect of the cloud-first strategy that now defines the company. Amy Hood remains Executive Vice President and Chief Financial Officer, and Bradford Smith continues as Vice Chair and President, giving the company continuity in its two most important non-CEO seats through a period of very heavy capital commitment. The elevation of Judson Althoff to Chief Executive Officer, Microsoft Commercial Business in October 2025 — from his prior role as Chief Commercial Officer — reads as deliberate bench-building on the commercial side and modestly deepens succession optionality beneath Nadella. Takeshi Numoto (Chief Marketing Officer) and Amy Coleman (Chief Human Resources Officer) round out the senior team. §
The principal governance-relevant caveat is key-person dependence: Nadella’s strategic authority is central, and while the surrounding bench is strong, the company has not signalled a specific CEO succession plan. The second, structural, watch item is talent — management itself stresses that the market for highly skilled AI workers and leaders is extremely competitive and that its ability to execute depends on attracting and retaining that talent; this is a durable operational constraint rather than a near-term concern. §
1.5 Capital Allocation Track Record
| Year | Dividends Paid ($M) | Share Repurchases ($M) | CapEx ($M) |
|---|---|---|---|
| FY2022 | $18,135.0M | $32,696.0M | $23,886.0M |
| FY2023 | $19,800.0M | $22,245.0M | $28,107.0M |
| FY2024 | $21,771.0M | $17,254.0M | $44,477.0M |
| FY2025 | $24,082.0M | $18,420.0M | $64,551.0M |
| FY2026 | $26,445.0M | $22,271.0M | $115,948.0M |
Source: Company SEC filings (10-K); see Appendix A.1.
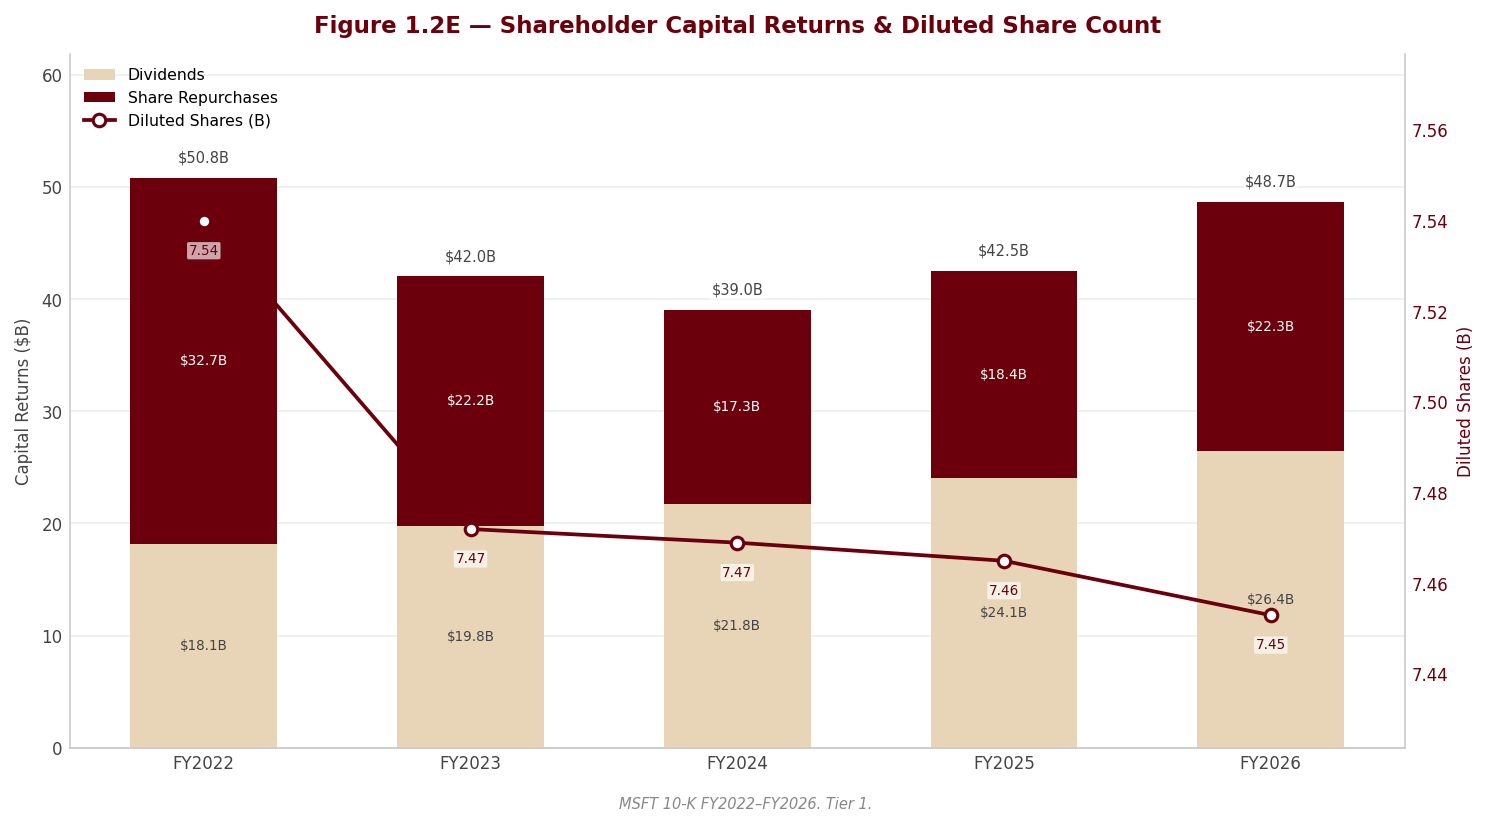
The dominant signal in Microsoft’s capital allocation is the redirection of cash toward the business. [Rating and price target withdrawn — see the note at the top.] Shareholder returns have continued in parallel but have been de-prioritised at the margin: the dividend has been raised steadily, and buybacks have continued under the multi-year authorisation the Board approved in September 2024, but repurchases have been sized only modestly above stock-based compensation, so the share count has been held roughly flat rather than materially reduced. The combined cash yield to shareholders — dividends plus buybacks — is 1.8%, and the dividend payout ratio, dividends as a share of earnings, is 19.8%.
The read-through is a management team investing for growth rather than harvesting a mature franchise: capital expenditure has run well ahead of the pace of asset replacement, marking this as growth investment rather than maintenance. Two qualifications matter for interpreting the CapEx line and are developed in Section 3. First, reported capital expenditure understates the true scale of infrastructure investment, because a material portion of the datacentre build is being funded through finance leases that sit off the capital-expenditure line and through equipment purchases that remain unpaid in payables at year-end; capital intensity is best assessed on an all-in basis. Second, the flat share count means per-share growth is being driven by earnings rather than by buyback accretion — a healthier but more demanding requirement, since it puts the burden of shareholder returns squarely on the success of the investment programme.
1.6 Competitive Positioning & Moat
sources 1.6.1 Industry structure. Enterprise software and cloud infrastructure are among the most attractive structures in the economy: high fixed cost, near-zero marginal cost of an additional software seat, and powerful economies of scale in cloud, where large datacentres deploy compute at a lower cost per unit than smaller ones, aggregate diverse demand to raise utilisation, and spread maintenance labour across multi-tenant infrastructure. Returns accrue to scale players that can fund the fixed-cost base, own distribution, and turn a platform into an ecosystem in which third parties build — generating network effects among users, developers and the platform owner. The AI platform wave is now reshaping the industry’s competitive terms, raising the capital ante for participation and rewarding those with the compute, data and distribution to monetise it. In this structure the winners are few and large; Microsoft is unambiguously one of them.
1.6.2 Competitive advantages. Microsoft’s moat rests on several mutually reinforcing sources, each grounded in a disclosed characteristic of the business rather than asserted. First, switching costs: the integrated productivity, identity, security and data stack embeds Microsoft 365 and Azure into corporate workflows in a way that is costly and disruptive to unwind, and the same integration is what allows Copilot to attach to an existing paying base. Second, scale economies in cloud, which management explicitly cites as a cost-per-unit and utilisation advantage of its global datacentre network. Third, distribution reach — a hybrid of direct enterprise sales, an extensive indirect partner network, OEM pre-installation of Windows, and digital marketplaces — that few competitors can match end to end. Fourth, platform network effects: management frames a core element of the model as building ecosystems on which many participants build, generating beneficial network effects. Fifth, an in-house R&D model that management maintains deliberately to preserve product differentiation and technical control. Sixth, and newest, privileged access to frontier AI through the long-term OpenAI partnership — including rights to models and IP for integration into Microsoft’s own products — layered on top of Azure’s own AI silicon and platform. The financial signature of this moat is pricing power and cost discipline sustained at very large scale, evidenced by an EBIT margin of 46.8% on $331,839.0M of revenue.
1.6.3 Competitive vulnerabilities. The moat is strong but not unassailable. Management itself warns that barriers to entry are low in several of its markets and that those markets evolve rapidly with disruptive technology and shifting user needs. The most distinctive vulnerability is the partner-competitor dynamic that pervades the AI stack: many of the third parties supplying models and technology — and OpenAI itself — are simultaneously competitors and, in some cases, significant Azure customers, so changes in strategic priorities or commercial terms could erode the competitiveness of Microsoft’s AI products. Vertically-integrated rivals that control hardware, software and marketplaces have won adjacent categories and can set marketplace rules that restrict how Microsoft distributes its own services. Within the portfolio, More Personal Computing is the softest flank, exposed to PC-market cyclicality and a declining XBOX. Above all, the AI build itself is the swing factor: it is capital-intensive, made ahead of fully developed revenue, and its returns are unproven — a strategic vulnerability whose financial and contingent dimensions are examined in Sections 2, 3 and 6.
1.6.4 Verdict. Microsoft possesses one of the widest and most durable competitive moats in the market, anchored in enterprise switching costs, cloud scale economies and platform network effects, and now reinforced by a privileged position in AI. Long-run margin durability is high: the recurring, contractually sticky revenue base and the scale of the cost structure support pricing power that has proven resilient across cycles. The one material qualification is near-term rather than structural — the intensive AI-infrastructure investment is pressuring gross margin today, and the ultimate durability of returns depends on that build earning its cost of capital. On competitive positioning alone, this is a best-in-class franchise; the open question, developed in the valuation sections, is not the quality of the business but the price of it.
Section 2 — Key Risks & Catalysts
2.1 Downside Risks
sources The risk that dominates Microsoft today is not competitive displacement or cyclicality — it is capital-allocation risk of an unusual kind: an enormous, front-loaded, and partly off-balance-sheet build-out of AI and cloud infrastructure undertaken ahead of fully developed revenue, concentrated commercially and strategically around a single AI partner, and carried out against a chronic tax and regulatory overhang. [Rating and price target withdrawn — see the note at the top.]
Risk 1 — The AI capital-intensity regime and off-balance-sheet commitments
sources This is the defining balance-sheet story of the year and is treated here as the highest-priority risk. Microsoft’s strategy commits it to a substantial, accelerating and largely irreversible programme of datacenter construction, component procurement and energy contracting, undertaken at scale, on a compressed timeline, and in advance of revenue that may not materialise in the expected timeframe or amount. The reported low-debt profile is misleading: the company’s committed infrastructure obligations are dominated by items that do not appear on the balance sheet at all. Chief among them is a very large stack of signed data-center leases that had not yet commenced at year-end and are therefore excluded from reported liabilities — a figure that dwarfs reported long-term debt and that will convert into fixed finance-lease liabilities and cash outflows over the coming several years, before the associated AI revenue is proven. On-balance-sheet finance-lease liabilities are themselves growing rapidly, and total lease, purchase and construction commitments are many multiples of reported debt. Compounding this, reported cash capital expenditure — already sharply higher — understates the true economic investment, because a meaningful portion of the fleet is being added through non-cash finance leases and through capex that has been incurred but sits unpaid in accounts payable at year-end. The result is that leverage, fixed-charge coverage and free cash flow all look stronger on a headline basis than they are on a lease- and commitment-inclusive basis.
Why it matters to the financials: this is a demand-forecasting bet with asymmetric downside. Management itself warns that overestimating demand or misaligning capacity would leave infrastructure underutilised and expose the fleet to asset impairment, while the cost structure of AI — training and inference costs, component pricing, and energy — remains highly uncertain and could compress margins if costs stay elevated or if competition commoditises pricing. Growth of the fleet is also physically constrained: availability of permitted and buildable land, predictable and affordable power and grid capacity, water, GPUs and other components, and increasingly coordinated community and local-government opposition to datacenter development. Trigger for materialisation: a slower-than-planned ramp in AI consumption, a demand air-pocket, a step-down in Azure growth, or a power/component bottleneck that strands committed capacity — any of which would turn a growth investment into a fixed-cost drag and a candidate for write-down. §
[Rating and price target withdrawn — see the note at the top.]
Risk 2 — Dependence on OpenAI: concentration, circular economics, and earnings-quality distortion
sources Microsoft’s AI strategy is inseparable from its partnership with OpenAI, and this dependence is now disclosed as a formal related-party relationship — OpenAI is an equity-method investee holding a meaningful minority as-converted interest, and is therefore a related party under the accounting standards. Two distinct problems flow from this, and both are material.
First, revenue concentration and circularity. A material and fast-growing slice of Microsoft’s total revenue — the bulk of it Azure consumption inside the Intelligent Cloud segment, the very segment carrying the headline cloud-growth narrative — is sold to OpenAI, an entity Microsoft simultaneously part-funds through large committed capital and carries a substantial year-end receivable against. Because Microsoft funds OpenAI and OpenAI in turn spends on Azure, part of the reported cloud growth is economically self-financed rather than independent third-party demand. [Rating and price target withdrawn — see the note at the top.] Microsoft’s broader AI strategy also depends on strategic relationships with third parties that are, in several cases, both competitors and significant Azure customers — so the expected economic benefits of these arrangements may not be realised or sustained if strategic priorities or contractual terms change.
Second, earnings quality. Reported net income and diluted EPS this year were flattered by a large, non-cash, non-recurring gain arising from the OpenAI investment — chiefly a dilution gain recognised in connection with the OpenAI recapitalisation — reversing what had been a drag in the prior year. The swing in this single non-operating line materially inflated the optics of headline earnings growth; on management’s own newly-introduced adjusted, ex-OpenAI basis, net income and EPS grew materially more slowly. The very fact that management created a non-GAAP measure this year whose sole purpose is to strip OpenAI in and out is itself a signal of how volatile and non-operating this line has become. Worse, the underlying OpenAI carrying value and periodic income are among the least transparent figures in the statements — computed on a hypothetical-liquidation-at-book-value basis, on a reporting lag, using unobservable, judgment-heavy inputs — yet they now swing net income by billions. Notably, the auditor designated revenue recognition and uncertain tax positions as critical audit matters but did not elevate the OpenAI accounting to that status, a gap worth flagging given its earnings impact. [Rating and price target withdrawn — see the note at the top.]
[Rating and price target withdrawn — see the note at the top.]
Risk 3 — The IRS transfer-pricing dispute and fragility of the tax structure
sources Microsoft carries a large, unreserved contingent tax exposure. The IRS has issued Notices of Proposed Adjustment for a long run of earlier tax years, primarily on intercompany transfer pricing, seeking a very substantial additional tax payment plus penalties and interest; the company is also under audit for subsequent years. Management disagrees, intends to contest the adjustments through administrative appeals and, if necessary, the courts, and believes its existing allowances are adequate — meaning it has taken no incremental reserve for the disputed amount, which far exceeds what is reserved. The auditor designated income taxes and uncertain tax positions a critical audit matter, confirming that it viewed the estimate as especially subjective. [Rating and price target withdrawn — see the note at the top.]
Why it matters and what triggers it: the disputed exposure is a discrete, binary tail risk to cash and earnings concentrated in whatever year the matter settles. A materialisation event would be an adverse appeals ruling or court decision, or a negotiated settlement above the amount currently allowed for. A prudent view carries this outside the base case and stress-tests a partial adverse settlement, as done in the separate valuation. §
[Rating and price target withdrawn — see the note at the top.]
Risk 4 — Regulatory, antitrust and legal exposure
sources Microsoft faces intensifying, multi-front regulatory scrutiny that is chronic rather than binary. Competition authorities across the EU, the United Kingdom, the United States and China are actively enforcing competition law and enacting new digital-market regulation; the company has stood up independent compliance functions specifically to satisfy the EU Digital Markets Act and Digital Services Act, and warns that competition actions, court decisions and new market-regulation schemes could result in fines or restrict its ability to deliver the integrated benefits of its software, reducing product attractiveness and revenue. On top of this sits a fast-evolving AI regulatory landscape — the EU AI Act and potential restrictions on the development, deployment and cross-border access to advanced models on safety, security or national-security grounds — that could raise costs or limit opportunity in key markets. Data-protection regulation is a live cost centre: authorities can restrict or block cross-border data transfers, and the company’s own disclosed legal exposure is centred on an Irish Data Protection Commission GDPR decision and fine against LinkedIn, now under appeal following a ruling on the standard of appeal. That specific matter is quantified, reserved and immaterial relative to the company’s scale — a watch item rather than a modelled liability — but the larger antitrust, AI-Act and AI-copyright/IP claims are described as non-estimable and are the ones that matter for the tail. The company also derives substantial revenue from government contracts, which carry audit, debarment and funding-approval risks not present in commercial agreements, and faces ongoing intellectual-property litigation arising from AI training, inference and output. §
Why it matters: individually, most of these are manageable; cumulatively, they could constrain the very AI monetisation that justifies the capital programme in Risk 1, and could impose fines, product-design changes and rising compliance cost. Trigger: an adverse DMA/AI-Act enforcement action, a landmark AI-copyright ruling, or a cross-border data-transfer restriction.
Probability: High (chronic and multi-jurisdictional) | Timeframe: Immediate and ongoing | Impact: Recurring compliance cost and fine risk, with a lower-probability but higher-severity tail from an adverse antitrust or AI-regulation outcome that constrains product distribution.
Risk 5 — Cybersecurity and product-security concentration
sources Because its systems and products are among the most widely deployed in the world, Microsoft is a prime and continuous target for nation-state actors, state-sponsored organisations and cybercriminal groups, and has experienced incidents in which threat actors gained unauthorised access to its systems and data — including a previously disclosed nation-state password-spray attack that compromised a legacy account and led to access to certain source-code repositories and internal systems, with reputational and customer-relationship harm. The security of its products is itself a purchasing criterion, so attacks on Microsoft’s own infrastructure directly affect customers; adversaries concentrate on the most popular systems (many of them Microsoft’s), can exploit zero-day vulnerabilities, and are increasingly using AI to raise the speed, scale and sophistication of attacks, while the company must maintain support for older customer systems that lack the strongest current defences. The Board reviews cybersecurity at least quarterly and management has run a Secure Future Initiative since late 2023 to drive continual improvement, but the structural exposure is unavoidable given the company’s footprint. §
Why it matters and what triggers it: a major breach — of Microsoft’s own environment or via a widely-exploited product vulnerability — would carry reputational damage, customer attrition, remediation cost and potential regulatory liability, and would strike directly at the trust on which the cloud franchise depends. Trigger: a successful large-scale intrusion or a critical, widely-exploited product vulnerability.
Probability: High for attempts / Medium for a materially damaging event | Timeframe: Immediate and ongoing | Impact: Reputational and customer-trust damage plus remediation and potential regulatory cost; not readily quantifiable, but strategically significant given security is positioned as the company’s foremost priority.
2.2 Upside Catalysts
sources The catalyst picture is, honestly, asymmetric to the downside — and deliberately so. The most important catalysts are not independent tailwinds; they are the successful outcomes of the same AI wager whose failure defines Risks 1 and 2. In other words, the bull and bear cases share a single fulcrum: whether the capital committed to AI infrastructure converts into durable, high-return, third-party revenue. The catalysts below are therefore best read as the favourable resolution of the dominant risk, plus the operating leverage that would follow.
Catalyst 1 — Copilot and Microsoft 365 monetisation converting AI into durable ARPU
sources The clearest path by which the AI investment pays off in the near term is Microsoft 365 Commercial: an installed base into which Copilot, agentic capabilities and higher-tier E5 offerings are being sold, driving revenue-per-user expansion on top of continued seat growth (led by small and medium businesses and frontline workers) and the ongoing shift from on-premises Office to the cloud. If AI seats convert into durable, recurring ARPU uplift rather than trial usage, the productivity franchise validates the capex thesis with high-margin, sticky revenue. It would show up in the financials as sustained Productivity & Business Processes revenue growth with expanding cloud ARPU. §
Probability: Medium–High | Timeframe: 1–2 years | Monitoring trigger: Continued Microsoft 365 Commercial cloud revenue-per-user growth attributable to Copilot and E5, alongside sustained seat growth — the clearest read that AI is monetising in productivity.
Catalyst 2 — Azure AI demand converting the infrastructure build into operating leverage
sources This is the direct inverse of Risk 1. If AI consumption on Azure sustains its growth and utilisation rises across the committed fleet, the fixed-cost infrastructure base flips from an impairment and margin risk into powerful operating leverage, and the cloud gross margin — currently pressured by AI-infrastructure investment and rising AI usage — stabilises and re-expands as efficiency gains compound. The distinction that matters is the quality of the demand: growth driven by broad, independent third-party workloads is far more valuable than growth carried by the OpenAI relationship, so the catalyst is specifically Azure demand net of OpenAI consumption.
Probability: Medium | Timeframe: 1–3 years | Monitoring trigger: Sustained Azure growth excluding OpenAI-related consumption, improving Microsoft Cloud gross-margin percentage, and evidence of rising fleet utilisation rather than capacity outrunning demand.
Catalyst 3 — Commercial backlog (RPO) conversion providing revenue visibility
sources Microsoft carries a very large commercial remaining-performance-obligation backlog — contracted revenue not yet recognised — which underpins forward visibility and dampens the demand-uncertainty that sits at the heart of Risk 1. Continued growth in this backlog, particularly through multi-year commercial commitments (which are concentrated in the fiscal fourth quarter), would provide tangible evidence that enterprise demand is being contracted ahead of the infrastructure spend rather than hoped for after it.
Probability: Medium–High | Timeframe: 1–2 years | Monitoring trigger: Growth in commercial RPO and stable-to-lengthening contract duration, signalling that committed demand is keeping pace with committed capacity.
Catalyst 4 — Capex peak and free-cash-flow inflection
The current regime is one of capital expenditure growing far faster than revenue. A catalyst — necessarily further out — is the point at which capex growth decelerates below cloud-revenue growth, the fleet matures, and free cash flow inflects sharply higher, allowing the capital-return programme (currently deprioritised relative to the build) to re-accelerate. This is a genuine catalyst rather than mere mean-reversion because it would confirm the AI investment cycle is transitioning from cash absorption to cash generation.
[Rating and price target withdrawn — see the note at the top.]
2.3 Risk & Catalyst Summary
| # | Item | Type | Probability | Timeframe | Status | Monitoring Trigger |
|---|---|---|---|---|---|---|
| 1 | AI capital-intensity regime & off-balance-sheet commitments | Risk | High | 1–5 years | Active | Capex vs cloud revenue growth; signed-lease commencement; fleet utilisation and impairment signals |
| 2 | OpenAI dependence — concentration, circularity & earnings-quality distortion | Risk | Medium | 1–2 years | Active | Azure growth ex-OpenAI; OpenAI receivable collectibility; recurrence/reversal of the non-cash dilution gain |
| 3 | IRS transfer-pricing dispute & tax-structure fragility | Risk | Medium (binary) | 3–5 years | Monitoring | Appeals/court progress; OECD Pillar Two adoption; U.S./foreign earnings mix |
| 4 | Regulatory, antitrust & legal exposure | Risk | High | Immediate/ongoing | Active | DMA/DSA & AI-Act enforcement; AI-copyright rulings; cross-border data-transfer actions; LinkedIn GDPR appeal |
| 5 | Cybersecurity & product-security concentration | Risk | High (attempts) / Medium (material event) | Immediate/ongoing | Active | Disclosed incidents; critical product vulnerabilities; Secure Future Initiative progress |
| 6 | Copilot / Microsoft 365 AI monetisation (ARPU) | Catalyst | Medium–High | 1–2 years | Monitoring | M365 Commercial cloud ARPU growth from Copilot/E5 with sustained seat growth |
| 7 | Azure AI demand → operating leverage | Catalyst | Medium | 1–3 years | Monitoring | Azure growth ex-OpenAI; Microsoft Cloud gross-margin trajectory; utilisation |
| 8 | Commercial backlog (RPO) conversion | Catalyst | Medium–High | 1–2 years | Monitoring | Commercial RPO growth and contract duration |
| 9 | Capex peak & free-cash-flow inflection | Catalyst | Medium | 2–4 years | Latent | Capex growth falling below cloud-revenue growth; FCF conversion; buyback re-acceleration |
Source: Company SEC filings (10-K) and forensic footnote review; see Appendix A.1.
2.4 Risk Interdependencies
sources The defining feature of Microsoft’s risk profile is that its largest exposures are not independent — they are three faces of a single wager and would move together. The AI capital-intensity regime (Risk 1), the OpenAI relationship (Risk 2) and the earnings-quality distortion within it are tightly coupled: a material, fast-growing share of the Azure demand that justifies the enormous, fixed lease and construction commitments is sold to OpenAI, an entity Microsoft part-funds — so if OpenAI’s trajectory or implied valuation falters, the company would face, simultaneously, a reversal of the non-cash equity-method gains, potential impairment of a concentrated receivable, and the erosion of the third-party demand narrative underpinning the build — all while the signed lease obligations remain fixed and non-cancellable. That is the single most dangerous combination in the profile: the demand side, the earnings side and the balance-sheet-obligation side would deteriorate at once.
A second compounding chain runs through cash and funding. The build is currently self-funded from operating cash and a thinning liquidity cushion, and reported operating cash flow is temporarily flattered by a bonus-depreciation tax deferral that will reverse as capex growth slows. If demand disappoints (Risk 1) at the same time as cash taxes normalise and the liquidity cushion continues to draw down, Microsoft would likely return to the debt markets, adding interest cost precisely when returns on the infrastructure are least certain — converting today’s low reported leverage into real leverage against uncertain revenue.
A third chain is regulatory-into-strategic: an adverse AI-Act, antitrust or AI-copyright outcome (Risk 4) would not merely add cost — it could constrain the AI monetisation (Catalysts 1 and 2) that is the sole justification for the capital programme, turning a strategic asset into a stranded one. [Rating and price target withdrawn — see the note at the top.] The through-line is clear: Microsoft’s risks are correlated to its central AI bet, which means a diversified-looking balance sheet offers less protection than it appears to.
2.5 ESG & Regulatory Exposure
sources Microsoft’s most acute ESG tension is internal and specific: its stated 2020 goals to become carbon negative, water positive and zero waste by 2030 run directly against the reality, which management now acknowledges in the filing, that AI development and deployment have raised and will likely keep raising the company’s energy use and emissions — making those goals materially harder to meet. This is not generic climate exposure; it is a concrete conflict between the growth strategy and the public sustainability commitment, with the risk that a failure or perceived failure to meet the goals invites claims, regulatory action, penalties or reputational damage. The same energy dimension is an operational constraint on the strategy itself: datacenter expansion depends on the availability of permitted and buildable land, predictable and affordable power and grid capacity, and water, and faces increasingly coordinated community and local-government opposition — the environmental and social frictions of the AI build are, in effect, a gating factor on growth.
On the regulatory side, the exposure is broad and jurisdictionally layered. Beyond the competition and digital-markets scrutiny discussed in Risk 4, the company faces expanding ESG-specific regulation — greenhouse-gas and energy-usage requirements, siting and disclosure rules — that may require significant investment or operational change, and evolving data-protection obligations under the EU GDPR and Data Act, including the risk that authorities restrict or block cross-border data transfers. Microsoft has responded by standing up independent compliance functions required under the EU Digital Markets Act and Digital Services Act to oversee and monitor its compliance. §
On governance, the picture is comparatively reassuring but not without watch items. Leadership is stable — the Chairman and CEO, CFO, and Vice Chair and President remain in place, with a commercial-business CEO elevated during the year — and the Board oversees cybersecurity through at-least-quarterly reviews, backed by the Secure Future Initiative and a formal enterprise risk-management function. Human-capital risk is real for an AI-led franchise: management stresses that the market for highly skilled AI talent is extremely competitive, that international recruiting is constrained by immigration rules, and that succession planning matters. Critically for a financial-statement reader, the auditor issued an unqualified opinion on both the financial statements and internal control, with no restatement — a genuine quality positive — but designated two critical audit matters, revenue recognition and uncertain tax positions, reflecting the judgment embedded in each. The notable governance-adjacent gap is that the auditor did not designate the OpenAI equity-method accounting a critical audit matter despite its multi-billion-dollar, judgment-laden and opaque swing on net income (Risk 2) — an omission worth carrying forward as a monitoring item.
Section 3 — Financial Analysis & Historical Performance
sources Three-Statement Linkage Confirmation: - Net Income ties (Income Statement → Cash Flow Statement): Confirmed. Reported net income of $133,749.0M is the opening line of the FY2026 cash-flow statement’s operating section; the same figure carries through the income statement and the equity roll-forward with no reconciling discrepancy. - Cash ties (Balance Sheet → Cash Flow Statement): Confirmed. Year-end cash and equivalents of $20,935.0M on the balance sheet reconciles to the ending cash balance derived on the cash-flow statement. - Retained Earnings reconciliation (Beg RE + NI - Dividends = End RE): Confirmed once share repurchases charged against retained earnings are included. Opening retained earnings of $237,731.0M plus net income of $133,749.0M, less dividends declared and the portion of buybacks charged to retained earnings, ties to the closing balance of $328,265.0M — consistent with Microsoft’s long-standing practice of absorbing repurchases in excess of par against retained earnings rather than through a separate treasury-stock line.
3.1A Income Statement
Source: Microsoft Corporation FY2026 Form 10-K (consolidated income statements) and prior-year 10-Ks; figures per the FL model — see Appendix A.1–A.2.
CAGR Summary
| Metric | 3Y CAGR | 5Y CAGR | 10Y CAGR |
|---|---|---|---|
| Revenue | 16.1% | 14.6% | 13.8% |
| EBITDA | 23.7% | 18.9% | 19.5% |
| Net Income | 22.7% | 16.9% | 20.6% |
| Diluted EPS | 22.9% | 17.4% | 21.5% |
| FCF | 4.0% | 3.6% | 10.4% |
Source: Company SEC filings (10-K); figures per the FL model — see Appendix A.1–A.2.
3.1B Income Statement — Analysis
sources Revenue trajectory. Microsoft’s top line has compounded at 13.8% over ten years and 14.6% over five, but the more important signal is the acceleration: the three-year CAGR of 16.1% sits above the longer averages, and FY2026 growth of 17.8% re-accelerated from 14.9% the prior year. This is unusual for a company of this scale and is almost entirely a Microsoft Cloud story. Management attributes the year’s growth to Intelligent Cloud (Azure and other cloud services) and to Productivity and Business Processes (Microsoft 365 Commercial cloud), with More Personal Computing revenue declining on XBOX weakness and partly offset by Search advertising. A favorable foreign-currency movement added to both reported revenue and operating income during the year, so a portion of the reported growth is FX-driven and non-repeatable rather than organic constant-currency demand. The growth is price/mix- and volume-led within cloud consumption rather than acquisition-led — the Activision Blizzard acquisition that reshaped the gaming portfolio closed in FY2024 and is now a declining contributor, so FY2026’s re-acceleration is organic and cloud-anchored.
A revenue-quality overlay is essential here (RED flag). For the first time, the FY2026 10-K discloses OpenAI as a related party, and records a large and fast-growing amount of revenue from commercial arrangements with OpenAI — a meaningful share of total revenue and a substantial portion of Azure’s incremental growth — the bulk of it Azure consumption booked inside Intelligent Cloud, the very segment whose reported growth is the headline of the AI thesis. Because Microsoft simultaneously funds OpenAI and carries a sizeable year-end receivable from it, a material slice of the cloud growth investors are paying for is economically self-financed rather than independent third-party demand. This is not an accounting error; it is a revenue-quality and concentration issue. The correct analytical posture is to assess Azure/Intelligent Cloud growth net of the OpenAI contribution, and to treat the OpenAI receivable as concentrated counterparty exposure to a cash-burning investee. [Rating and price target withdrawn — see the note at the top.]
Margin trajectory — read the operating line, not EBITDA. Gross margin peaked at 69.8% in FY2024 and has since compressed to 67.9%, a structural (not cyclical) headwind driven by AI-infrastructure investment and rising, lower-incremental-margin AI consumption, partially offset by cloud efficiency gains. Below the gross line, however, operating discipline is exceptional: EBIT margin expanded from 42.1% to 46.8%, a steady climb that reflects genuine operating leverage on the software and cloud franchise. EBIT is the metric to lean on, because it is clean of the OpenAI dilution gain (which sits below operating income in other income). By contrast, EBITDA margin expanded far faster — from 49.3% to 58.4% — but that outperformance is precisely the artefact investors should discount: the widening gap between EBITDA-margin and EBIT-margin expansion is rising depreciation, with D&A climbing from $14,460.0M to $38,534.0M as the capex super-cycle builds out. That depreciation is a real economic cost of the AI fleet, not a value-neutral add-back, which makes EBITDA a lower-quality lens for Microsoft today than it once was. A further comparability caution: Microsoft reclassified its combined “depreciation, amortization, and other” cash-flow line in the FY2026 10-K, so the D&A — and therefore the EBITDA — series here is stated as-originally-reported and crosses a small definitional break between FY2025 and FY2026; this is another reason to anchor the trend on the operating (EBIT) line rather than on EBITDA.
Major movers. 1. Azure / Intelligent Cloud consumption — the primary revenue engine and margin-mix driver. [Rating and price target withdrawn — see the note at the top.] 2. AI-infrastructure cost of revenue — the direct cause of gross-margin compression from 69.8% to 67.9%. Structural: as AI usage scales, cost of revenue rises ahead of the associated monetization. 3. The OpenAI dilution gain (RED flag). GAAP net income grew 31.3% to $133,749.0M and GAAP diluted EPS grew 31.6% to $17.95 — but a large, non-cash net gain from OpenAI, driven primarily by a dilution gain recognized when Microsoft’s proportionate ownership fell at a higher implied valuation in the OpenAI recapitalization, sits in other income and inflates both figures. The prior year carried a net loss from the same source, so the year-over-year swing in this single non-operating item is large and non-recurring. Management introduced brand-new non-GAAP measures — adjusted net income, adjusted diluted EPS and adjusted other income — whose sole adjustment is stripping OpenAI; on that adjusted basis, both net income and EPS grew materially more slowly than the GAAP headline. A meaningful portion of the reported net-income growth is therefore a non-cash, non-recurring accounting gain with no cash flow and no operating substance. This is visible in the statement structure: pre-tax income of $165,934.0M grew markedly faster than EBIT of $155,237.0M, and the wedge is the OpenAI gain sitting in other income. [Rating and price target withdrawn — see the note at the top.] 4. Rising D&A from the capex super-cycle. Depreciation and amortization more than doubled from $14,460.0M to $38,534.0M. This is the mechanical consequence of the infrastructure build and is now a material, and growing, drag that will persist for years regardless of any single-year gain. 5. [Rating and price target withdrawn — see the note at the top.] That single-jurisdiction dependency is simultaneously the subject of the IRS transfer-pricing dispute discussed below and exposed to OECD Pillar Two global-minimum-tax rules — a realistic source of upward tax normalization.
Quality of earnings. Beyond the OpenAI dilution gain (F002) and the related-party revenue circularity (F001) treated above, three items warrant weight. First, a very large IRS Notice of Proposed Adjustment covering earlier tax years, primarily on intercompany transfer pricing (plus penalties and interest, with additional years still under audit), is unreserved beyond existing allowances; gross unrecognized tax benefits are elevated and rising, and Microsoft’s auditor designated this a Critical Audit Matter (RED flag F006). We carry the disputed amount as a discrete, binary contingent liability outside the base case. Second, the OpenAI equity-method position is carried via the hypothetical-liquidation-at-book-value method on a reporting lag of up to three months, making both the carrying value and the periodic P&L among the least transparent, most judgment-laden figures in the statements even as they now swing net income by billions (YELLOW flag F012). Third, recurring “impairment and other related expenses” in the XBOX business are embedded in operating expense and R&D but are not separately quantified, which masks underlying More Personal Computing profitability and — given their repeated appearance — should not be treated as genuinely non-recurring (YELLOW flag F010).
⚠ Items to Watch. If EBIT margin falls below 44.6%, it would reverse the multi-year operating-leverage trend and force a re-evaluation of the cloud-scale economics. A continued slide in gross margin below 67.9% as AI consumption scales would confirm that AI revenue is not yet earning its infrastructure cost. Any shortening of the disclosed server/network useful-life range against faster GPU obsolescence would flow straight into cost of revenue and compress margins materially (YELLOW flag F008). [Rating and price target withdrawn — see the note at the top.]
3.2A Balance Sheet
Source: Microsoft Corporation FY2026 Form 10-K (consolidated balance sheets) and prior-year 10-Ks; figures per the FL model — see Appendix A.1–A.2.
3.2B Balance Sheet — Analysis
sources Asset composition — a business being rebuilt as capital-intensive infrastructure. The defining balance-sheet fact of the period is the transformation of Microsoft from an asset-light software franchise into a capital-intensive infrastructure operator. Net PP&E has roughly quadrupled, from $74,398.0M to $313,076.0M, and now dominates the asset base; total assets expanded from $364,840.0M to $758,376.0M. Goodwill stepped up in FY2024 — from $67,886.0M to $119,220.0M — reflecting the Activision Blizzard acquisition, and has been broadly stable since, so the recent asset growth is organic data-center build, not deal-driven. Cash and equivalents of $20,935.0M is modest relative to the balance sheet because the AI build is being funded from internal resources.
The balance sheet materially understates committed obligations (RED flag). The reported figures are only part of the picture. The 10-K discloses a very large volume of additional leases — primarily data centers — that had not yet commenced at year-end and are therefore excluded from the balance sheet, converting to finance-lease liabilities and fixed cash outflows over the coming years. On-balance-sheet, finance-lease liabilities have already grown sharply. The MD&A contractual-obligations table shows total lease, purchase and construction commitments that dwarf reported long-term debt of $31,067.0M; the not-yet-commenced lease figure alone is many times reported long-term debt. The practical consequence for this analysis is unambiguous: leverage, fixed-charge coverage and effective debt must be assessed on a lease- and commitment-inclusive basis, and the headline low-net-debt profile below is misleading when read in isolation.
Leverage trajectory — deleveraging on the reported numbers, re-leveraging in substance. On reported figures, Microsoft has deleveraged steadily: total debt fell from $49,781.0M to $40,294.0M, net debt is only $19,359.0M, net debt/EBITDA is 0.1x — effectively unlevered — and debt/equity has fallen to 0.1x. Retained earnings compounding to $328,265.0M has driven equity to $442,387.0M. But this fortress reading is precisely what the off-balance-sheet lease commitments (F003) contradict in substance. Reinforcing the caution, the liquidity cushion — cash plus short-term investments — shrank meaningfully as the build is self-funded, no new debt was issued in FY2025 or FY2026, finance-lease interest is rising, and a debt maturity falls due in FY2027 (YELLOW flag F014). With capex now dwarfing internally generated free cash, a return to the debt markets is the likely path, which would add interest cost to a currently pristine profile. Interest coverage remains extremely strong at 50.9x, but that ratio is computed on reported interest expense and does not capture the growing fixed-charge burden embedded in the lease commitments.
Working capital. The cash conversion cycle is negative and widening — from -5 days to -33 days — which is normally an unambiguous positive. Here it warrants a caveat: days payable outstanding extended to 120 days, and part of that extension is a large amount of PP&E purchases sitting unpaid in accounts payable at year-end, i.e., incurred-but-unpaid capex that flatters both working capital and operating cash flow (RED flag F004). Receivables grew broadly with revenue, with DSO stable at approximately 83 days, and inventory is negligible given the software/cloud mix. Separately, “other current assets” ballooned on a sharply increased server-component prepayment/financing balance plus restricted investments pledged under a supplier agreement — Microsoft is effectively pre-financing its GPU/server supply chain, which ties up liquidity and means reported cash-plus-investments overstate freely available liquidity (YELLOW flag F007). The current ratio has declined from 1.8x to 1.2x — still adequate, but tightening.
⚠ Items to Watch. On a lease-inclusive basis, effective leverage is already far above the reported 0.1x; the trigger to watch is the pace at which the large volume of not-yet-commenced leases converts onto the balance sheet ahead of proven AI revenue. Liquidity should be tracked net of the restricted investments, and a renewed slide in the cash-plus-short-term-investments cushion — coupled with fresh debt issuance — would confirm the fortress balance sheet is thinning.
3.3A Cash Flow Statement
| FY2022 | FY2023 | FY2024 | FY2025 | FY2026 | |
|---|---|---|---|---|---|
| Cash from Operations ($M) | $89,035.0M | $87,582.0M | $118,548.0M | $136,162.0M | $182,935.0M |
| — Depreciation & Amortization ($M) | $14,460.0M | $13,861.0M | $22,287.0M | $34,153.0M | $38,534.0M |
| Capital Expenditures ($M) | $23,886.0M | $28,107.0M | $44,477.0M | $64,551.0M | $115,948.0M |
| Free Cash Flow ($M) | $65,149.0M | $59,475.0M | $74,071.0M | $71,611.0M | $66,987.0M |
| FCF Margin | 32.9% | 28.1% | 30.2% | 25.4% | 20.2% |
| FCF / Share | $8.64 | $7.96 | $9.92 | $9.59 | $8.99 |
| FCF Conversion (FCF/NI) | 89.6% | 82.2% | 84.0% | 70.3% | 50.1% |
| CapEx / Revenue | 12.0% | 13.3% | 18.1% | 22.9% | 34.9% |
| CapEx / D&A | 1.7x | 2.0x | 2.0x | 1.9x | 3.0x |
| Dividends Paid ($M) | $18,135.0M | $19,800.0M | $21,771.0M | $24,082.0M | $26,445.0M |
| Share Repurchases ($M) | $32,696.0M | $22,245.0M | $17,254.0M | $18,420.0M | $22,271.0M |
Source: Microsoft Corporation FY2026 Form 10-K (consolidated cash-flow statements) and prior-year 10-Ks; figures per the FL model — see Appendix A.1–A.2.
3.3B Cash Flow — Analysis
sources Quality of operating cash flow — record on the surface, flattered underneath (RED flags). Operating cash flow rose to $182,935.0M from $136,162.0M, an apparently powerful result. But two adjustments materially reduce its quality. First, a meaningful portion of the large year-over-year increase is a temporary cash-tax deferral: restored bonus depreciation / immediate expensing on the $115,948.0M of capex collapsed current U.S. federal tax and swung deferred tax sharply positive, so cash income taxes paid fell year over year. This is a timing benefit, not durable cash generation — as capex growth decelerates and book depreciation catches up, the deferred-tax liability reverses and cash taxes rise again, compressing OCF (RED flag F005). Second, the large amount of capex sitting unpaid in payables (F004) further flatters the operating line. [Rating and price target withdrawn — see the note at the top.]
Free cash flow — the single most important quality signal in this report. Despite record operating cash flow, free cash flow has stalled and is declining: it peaked at $74,071.0M in FY2024 and has since fallen to $66,987.0M. FCF margin has collapsed from 32.9% to 20.2%, and FCF conversion — free cash flow as a share of net income — has fallen from 89.6% to 50.1%. The divergence is stark in the CAGR table: free cash flow compounded at only 4.0% over three years while net income compounded at 22.7%. A company that earns but no longer converts is consuming cash somewhere, and here the location is unambiguous — the capex super-cycle. Worse, even this depressed reported FCF overstates sustainable free cash, because it excludes the finance-lease-funded portion of the build (substantial non-cash finance-lease additions in FY2026 that never touch the capex line), is helped by the payables build, and is helped by the bonus-depreciation tax deferral. On an all-in basis, economic capital deployed into infrastructure was materially higher than the $115,948.0M cash capex figure once finance-lease additions are included — and higher still on an incurred basis. [Rating and price target withdrawn — see the note at the top.]
CapEx analysis — deep growth-investment mode. Cash capital expenditure exploded from $23,886.0M to $115,948.0M, lifting capex/revenue from 12.0% to 34.9% and pushing capex/D&A to 3.0x. A ratio this far above 1.0x signals that essentially all of this is growth investment — AI data centers and compute — rather than maintenance. That is appropriate if the AI revenue materializes at an adequate return on the capital, but it front-loads the spending well ahead of proven demand, which is the central risk in the equity story.
Capital allocation waterfall. The mix has shifted decisively toward reinvestment. [Rating and price target withdrawn — see the note at the top.] Share repurchases were $22,271.0M, but the anti-dilution they provide is now minimal — gross buybacks only modestly exceed the $12,405.0M of stock-based compensation expense, so net share count is essentially flat and per-share accretion from repurchases is small (YELLOW flag F013). Reinvestment — capex of $115,948.0M — now dwarfs the combined dividend and buyback. Given the size of the AI opportunity this prioritization is defensible, but it means EPS growth is now almost entirely earnings-driven (and, per F002, partly a non-cash gain) rather than share-count-driven, and capital return has been deprioritized relative to the build.
⚠ Items to Watch. FCF conversion falling further below the current 50.1% would signal the build is outrunning cash generation for longer than the thesis assumes. The all-in capital-intensity figure (cash capex plus finance-lease additions, relative to revenue) is the truest gauge of the burden and should be tracked in place of the cash-only line. [Rating and price target withdrawn — see the note at the top.]
3.4 Returns Analysis
| FY2022 | FY2023 | FY2024 | FY2025 | FY2026 | |
|---|---|---|---|---|---|
| ROIC | 37.3% | 34.1% | 34.4% | 32.2% | 30.6% |
| ROE | 47.2% | 38.8% | 37.1% | 33.3% | 34.0% |
| ROA | 20.8% | 18.6% | 19.1% | 18.0% | 19.4% |
| Interest Coverage | 40.4x | 45.0x | 37.3x | 53.9x | 50.9x |
Source: Company SEC filings (10-K); figures per the FL model — see Appendix A.1–A.2.
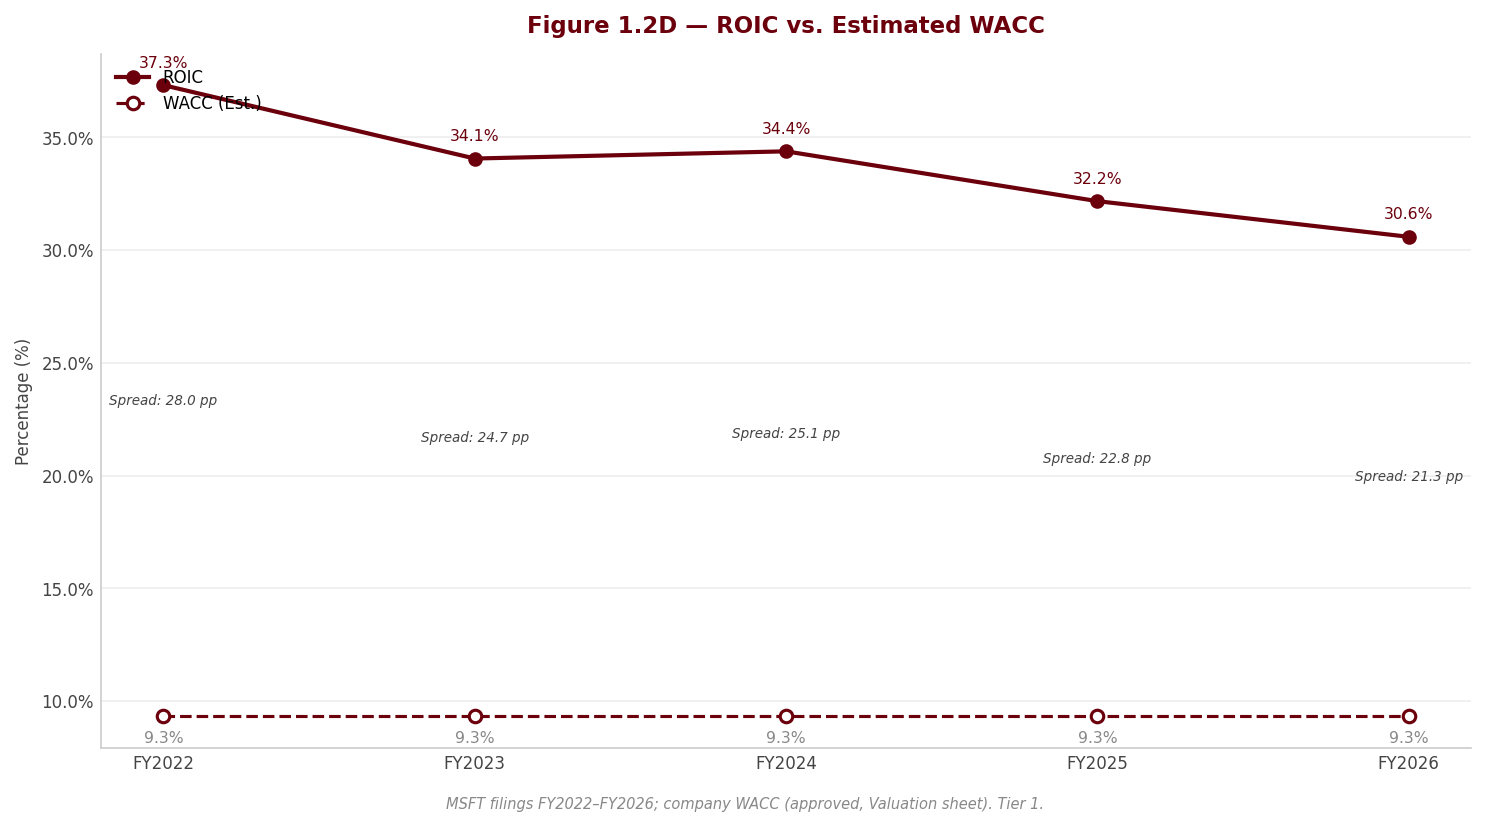
ROIC — exceptional but compressing. Return on invested capital of 30.6% remains one of the widest spreads over cost of capital in the entire large-cap universe, comfortably above any plausible WACC (). But the trend matters as much as the level: ROIC has compressed from 37.3% to 30.6% as the enormous capital deployment — the AI capex super-cycle plus the Activision acquisition — has landed on the invested-capital base ahead of full monetization. [Rating and price target withdrawn — see the note at the top.] This is the single most important metric to monitor over the coming years.
DuPont decomposition. Return on equity declined from 47.2% to 34.0%. Decomposing the FY2026 figure: net margin of 40.3%, asset turnover of 0.48x, and an equity multiplier of 1.75x. The level of ROE is driven by the exceptional net margin — though that margin is itself flattered in FY2026 by the OpenAI dilution gain (F002), so the underlying operating-driven ROE is lower than the reported figure. The swing factors dragging ROE down over the period are the other two components: asset turnover has fallen steadily as the capital-heavy AI build outpaces revenue, and the equity multiplier has declined as the company deleveraged and equity compounded. In other words, ROE has fallen not because profitability deteriorated but because Microsoft has become more capital-intensive and less levered — a structurally different, lower-turnover business than five years ago. Interest coverage of 50.9x remains extremely strong, though rising finance-lease interest (F014) is a growing, and partly off-statement, claim on that coverage.
3.5 Altman Z-Score (Most Recent FY)
| Component | FY2024 | FY2025 | FY2026 |
|---|---|---|---|
| X1 (Working Capital / Total Assets) | 0.067 | 0.081 | 0.051 |
| X2 (Retained Earnings / Total Assets) | 0.338 | 0.384 | 0.433 |
| X3 (EBIT / Total Assets) | 0.214 | 0.208 | 0.205 |
| X4 (Equity / Total Liabilities) | 1.102 | 1.247 | 1.400 |
| X5 (Revenue / Total Assets) | 0.479 | 0.455 | 0.438 |
| Z-Score | 1.94 | 2.01 | 2.06 |
| Zone | Gray | Gray | Gray |
Source: Company SEC filings (10-K); figures per the FL model — see Appendix A.1–A.2.
Interpretation — read the score against the model’s limitations, not at face value. The Z-Score of 2.06 places Microsoft technically in the “gray zone” of the Z′ model used here (1.23–2.90), and it is important to be precise about why that reading materially understates the company’s true credit strength. The Altman framework was calibrated on manufacturers and penalizes exactly the characteristics that now define Microsoft’s balance sheet: a low revenue-to-assets ratio (X5 of 0.438), which reflects the deliberate, high-return capital intensity of the AI build rather than asset inefficiency, and a modest working-capital-to-assets ratio (X1 of 0.051). The model does not capture Microsoft’s near-net-cash position, 50.9x interest coverage, or its dominant cash generation. Reflecting genuine balance-sheet strength, the score is in fact improving — from 1.94 in FY2024 — driven by rising retained-earnings-to-assets (X2 of 0.433) and rising equity-to-liabilities (X4 of 1.400). The gray-zone classification should therefore be read as an artefact of asset intensity, not as evidence of distress; conventional-debt credit risk is negligible. The genuine credit-watch item is the one the Z-Score does not see at all — the very large volume of not-yet-commenced lease commitments and the broader off-balance-sheet obligation stack (RED flag F003), which are where any future balance-sheet pressure would originate.
4. Valuation withdrawn
This section stated what the shares were worth and what to do about them. It rested on an exit multiple set by hand — across the coverage it averaged 24% below where each company actually traded — so the conclusion largely restated that assumption instead of testing it. Rather than leave it standing, it has been withdrawn while the method is rebuilt.
Nothing else in this report depends on it: the financial analysis above and below is drawn from the company's own filings, and every figure links to the page it was verified against.
Section 5 — Financial Metrics & Peer Benchmarking
sources Microsoft is benchmarked against the two large-cap peers that most directly contest its two highest-value franchises: Alphabet (hyperscale cloud and AI infrastructure, the Azure/Google Cloud contest) and Oracle (enterprise software and the fast-emerging OCI datacenter build). The central conclusion of this section is a deliberate paradox: on every measure of business quality — operating margin, free-cash-flow conversion, returns on capital and balance-sheet strength — Microsoft screens at or above the top of this set, yet it does not carry the highest valuation multiple. That gap between quality and price is the analytical spine of the relative-value case and is developed metric by metric below.
Two structural caveats govern the entire comparison and are stated here so the reader carries them through every table. First, the three companies close their books in three different months — Microsoft in June (FY2026), Alphabet in December (FY2025), Oracle in May (FY2025) — so Oracle’s most recent full year is roughly thirteen months stale versus Microsoft’s, and no figure below is a same-period comparison. Second, for the current fiscal year both Microsoft’s and Alphabet’s GAAP bottom-line metrics (net margin, ROE, P/E) are flattered by large non-operating investment gains, so the cleanest cross-company reads are the operating measures — EBIT margin, EBITDA margin and ROIC — not the net-income-based ones. These caveats are catalogued in full in 5.7.
5.1 Peer Selection
sources The peer set is deliberately narrow and defended on franchise overlap rather than index membership. Alphabet is the single most relevant comparator: Google Cloud is Azure’s principal hyperscale competitor, both companies are pouring capital into AI datacenters at a similar cadence, and both are net-cash, US-GAAP filers of comparable scale — making the operating-margin and returns comparison genuinely informative rather than directional. Oracle is included as the pure-play enterprise-software and OCI-datacenter comparator; it competes with Microsoft in databases, enterprise applications and, increasingly, AI-cloud capacity. Oracle is the weaker structural analogue — an order of magnitude smaller, materially levered where Microsoft is net cash, and reporting on the stalest calendar — so Oracle comparisons should be read as directional, and its cash-flow and leverage metrics in particular reflect a company at an earlier, more strained point in the same AI build-out.
Two adjacent mega-caps that might otherwise appear in a Microsoft screen — Amazon (AWS) and Apple — are excluded on comparability grounds: Amazon’s consolidated margins are dominated by low-margin retail and distort every profitability line, and Apple is a hardware-led consumer franchise with a fundamentally different revenue model. Confining the set to Alphabet and Oracle keeps the comparison to businesses whose economics are actually shaped by the same cloud-and-AI dynamics that drive Microsoft.
| Peer | Ticker | Exchange | Filing Type | Accounting Standard | Fiscal Year End | Comparability Note |
|---|---|---|---|---|---|---|
| Alphabet Inc. | GOOG | Nasdaq | 10-K | US GAAP | December | Closest comparator; net-cash hyperscaler, but FY ends roughly half a year behind MSFT and current-year net income is inflated by investment gains. |
| Oracle Corporation | ORCL | NYSE | 10-K | US GAAP | May | Directional only; over a year stale, the sole levered name in the set, and FY2025 free cash flow was negative. |
Source: Peer-company SEC filings; comparability notes in 5.7 — see Appendix A.1.
5.2 Profitability Comparison
sources Comparative: Most Recent Full Fiscal Year
The revenue-scale row from the standard template is omitted here because the subject’s top-line figure is carried in Section 3’s data set rather than this section’s; the comparison below is confined to margins, which is where the quality signal lives. Gross margin is shown for completeness but should be read with caution — the three companies define cost of revenue differently (see 5.7), so the operating margins beneath it are the reliable comparators.
| Metric | Microsoft Corporation | Alphabet Inc. | Oracle Corporation |
|---|---|---|---|
| Gross Margin | 67.9% | 59.7%ᵈ | 70.5%ᵈ |
| EBITDA Margin | 58.4% | 37.3% | 41.6% |
| EBIT Margin | 46.8% | 32.0% | 30.8% |
| Net Margin | 40.3%ⁱ | 32.8%ⁱ | 21.7% |
| FCF Margin | 20.2% | 18.2% | -0.7% |
Source: Peer-company SEC filings; comparability notes in 5.7 — see Appendix A.1.
Flag legend: ᵈ = gross margin not cleanly comparable (definitional cost-of-revenue differences); ⁱ = net margin flattered by non-operating investment gains this period; ᵐ = market-sourced; ᶜ = computed from filing components.
Source: Alphabet Inc. FY2025 10-K and Oracle Corporation FY2025 10-K; subject figures from the Microsoft Corporation FY2026 10-K via the model.
The operating margins settle the quality question decisively. Microsoft’s EBIT margin of 46.8% and EBITDA margin of 58.4% are the highest in the set by a wide margin — roughly fifteen points of EBIT margin ahead of Alphabet’s 32.0% and Oracle’s 30.8%. This is not a rounding advantage; it is a structural one, and it reflects Microsoft’s mix. A larger share of Microsoft’s revenue is high-margin commercial software and cloud (Microsoft 365, Azure platform services, server products) sold at scale on infrastructure Microsoft already owns, whereas Alphabet’s income statement carries the drag of traffic-acquisition costs and a growing hardware/content base, and Oracle carries the amortization and interest load of a debt-funded acquisition history. The EBITDA-margin gap is even starker because Microsoft’s depreciation, though rising fast with the AI build, is still a smaller fraction of a much larger revenue base.
The net-margin line requires the caveat flagged above. Microsoft’s 40.3% and Alphabet’s 32.8% are both inflated this period by sizeable non-operating gains on investments — for Microsoft, principally a non-cash remeasurement gain tied to the OpenAI recapitalization; for Alphabet, mark-to-market gains on its securities portfolio. Oracle’s 21.7% net margin, though the lowest of the three, is the cleanest of operating substance. The reader should therefore rank profitability on EBIT/EBITDA, where Microsoft’s lead is unambiguous and untouched by these one-off items.
Free-cash-flow margin tells the most important story of the current phase. Microsoft’s 20.2% still leads Alphabet’s 18.2%, and both remain firmly positive despite historic levels of AI-datacenter capex — a testament to the sheer cash-generative power of the underlying software franchises. Oracle, by contrast, printed a negative FCF margin of -0.7%: its datacenter capex outran operating cash flow entirely. The distinction matters — Microsoft and Alphabet are funding the AI build out of surplus cash; Oracle is funding it out of the balance sheet.
Historical: Microsoft Corporation Own 5-Year Progression
| Metric | FY2022 | FY2023 | FY2024 | FY2025 | FY2026 |
|---|---|---|---|---|---|
| Gross Margin | 68.4% | 68.9% | 69.8% | 68.8% | 67.9% |
| EBITDA Margin | 49.3% | 48.3% | 53.7% | 57.7% | 58.4% |
| EBIT Margin | 42.1% | 41.8% | 44.6% | 45.6% | 46.8% |
| Net Margin | 36.7% | 34.1% | 36.0% | 36.1% | 40.3% |
| FCF Margin | 32.9% | 28.1% | 30.2% | 25.4% | 20.2% |
Source: Peer-company SEC filings; comparability notes in 5.7 — see Appendix A.1.
Microsoft’s own history reinforces that the peer-leading margins are structural, not a one-year artifact. EBIT margin has climbed steadily from 42.1% in FY2022 to 46.8% in FY2026, and EBITDA margin from 49.3% to 58.4% — a mix shift toward cloud and cost discipline compounding over five years. Two lines within the table, however, diverge and deserve emphasis. Gross margin has drifted down from its FY2024 peak of 69.8% to 67.9%, the visible fingerprint of AI-infrastructure depreciation and lower-margin Azure consumption entering cost of revenue. More striking, FCF margin has compressed sharply from 32.9% in FY2022 to 20.2% in FY2026 — the direct consequence of the capex surge. The message is that the operating franchise is getting more profitable at the EBIT line even as the cash-conversion profile is being reshaped by the scale of the reinvestment; this tension is central to the valuation work in the separate valuation.
5.3 Returns Comparison
sources Comparative: Most Recent Full Fiscal Year
| Metric | Microsoft Corporation | Alphabet Inc. | Oracle Corporation |
|---|---|---|---|
| ROIC | 30.6% | 24.9% | 15.1% |
| ROE | 34.0%ⁱ | 31.8%ⁱ | 60.8%ᵉ |
| ROA | 19.4% | 22.2% | 7.4% |
| Asset Turnover (avg. assets) | 0.48x | 0.68x | 0.34x |
Source: Peer-company SEC filings; comparability notes in 5.7 — see Appendix A.1.
Flag legend: ⁱ = ROE flattered by non-operating investment gains this period; ᵉ = ROE distorted by a buyback-depleted equity base — not comparable as a return measure.
Historical: Microsoft Corporation Own 5-Year Progression
| Metric | FY2022 | FY2023 | FY2024 | FY2025 | FY2026 |
|---|---|---|---|---|---|
| ROIC | 37.3% | 34.1% | 34.4% | 32.2% | 30.6% |
| ROE | 47.2% | 38.8% | 37.1% | 33.3% | 34.0% |
| ROA | 20.8% | 18.6% | 19.1% | 18.0% | 19.4% |
Source: Peer-company SEC filings; comparability notes in 5.7 — see Appendix A.1.
ROIC is the correct lens for ranking capital efficiency across this set, precisely because the ROE line is compromised in two of the three names — inflated by investment gains at Microsoft and Alphabet, and grossly distorted at Oracle, whose 60.8% ROE is a mathematical artifact of an equity base hollowed out by years of buybacks (an accumulated deficit shrinks the denominator) rather than any operating superiority. Read on ROIC, the ranking is clean and consistent with the margin analysis: Microsoft at 30.6% leads Alphabet at 24.9%, with Oracle a distant 15.1% — barely half Microsoft’s return and, notably, the same Oracle whose distorted ROE would otherwise flatter it to the top of the table. Microsoft is the genuine capital-efficiency leader of the group.
The gap between Microsoft’s return and its cost of capital is the value-creation signal that matters most. With a ROIC of 30.6% against an estimated WACC of 9.33%, Microsoft is earning a spread of well over twenty points on invested capital — the hallmark of a durable competitive moat and the economic justification for the aggressive reinvestment now underway. Every incremental dollar deployed at these returns compounds shareholder value, provided the AI build sustains anything close to historical incremental returns.
Two methodology caveats keep this comparison honest. Microsoft’s ROIC, ROE and ROA in the tables above are drawn from the internal model, whose invested-capital and net-debt conventions differ slightly from the like-for-like basis used to compute the peer figures; on a strictly identical basis Microsoft’s ROIC is modestly lower than the 30.6% shown but still comfortably ahead of both peers, so the ranking is unaffected. Microsoft’s own five-year history also shows ROIC easing from a FY2022 peak of 37.3% to 30.6% — not a deterioration in the business, but the arithmetic of a rapidly expanding invested-capital base (the AI datacenters) whose revenue has not yet fully arrived. Whether that spread holds as the capital is put to work is the key monitorable behind the returns story.
5.4 Leverage & Liquidity Comparison
sources Comparative: Most Recent Full Fiscal Year
The comparative leverage table is confined to the two metrics that can be sourced on a consistent basis for the subject and both peers; total debt/equity, interest coverage and the current ratio are discussed in the prose that follows, drawing on the peer figures and on Microsoft’s net-cash position.
| Metric | Microsoft Corporation | Alphabet Inc. | Oracle Corporation |
|---|---|---|---|
| Net Debt / EBITDA | 0.1xᶜ | -0.5x | 3.4x |
| FCF Margin | 20.2% | 18.2% | -0.7% |
Source: Peer-company SEC filings; comparability notes in 5.7 — see Appendix A.1.
Flag legend: ᶜ = subject figure computed on a cash-only net-debt convention (see note below); peer figures treat short-term investments as cash-equivalent.
Microsoft and Alphabet sit at opposite ends of the balance sheet from Oracle. Both hyperscalers are effectively net cash: Alphabet’s Net Debt/EBITDA of -0.5x reflects a securities pile that exceeds all debt, and Microsoft’s reported 0.1x is computed on a conservative cash-only basis — counting only cash and equivalents against debt. Once Microsoft’s short-term investments are included on the same footing as the peers, Microsoft too is net cash. The one genuinely levered name is Oracle, at 3.4x Net Debt/EBITDA — a material leverage load carried into a period in which its free cash flow turned negative, precisely the combination that makes Oracle the structurally weaker balance sheet in the set. Where Microsoft can fund its AI build from surplus cash and still return capital, Oracle is funding an equivalent build with borrowed money and a depleted equity base (its debt-to-equity ratio, distorted by that same accumulated deficit, runs into the multiples).
On liquidity and coverage, the picture is consistent. Interest coverage is not a binding constraint for Microsoft — a company that generates tens of billions of operating cash flow against a modest, net-cash debt position — whereas Oracle’s coverage of 4.9x, while adequate, is a real number that must be serviced (Alphabet, sitting on net investment income, has no meaningful coverage constraint at all). The current-ratio comparison underlines the same divide: Alphabet’s 2.0x signals ample short-term liquidity, while Oracle’s 0.8x — below parity — points to a tighter working-capital position. The important qualification, developed in Section 3 and flagged here, is that Microsoft’s headline net-cash strength understates its true forward obligations: the AI build carries very large lease and purchase commitments, much of it not yet on the balance sheet, so the reader should not read Microsoft’s minimal reported leverage as an absence of fixed forward claims on cash.
5.5 Valuation Multiples Comparison
sources Comparative: Current Price
| Metric | Microsoft Corporation | Alphabet Inc. | Oracle Corporation |
|---|---|---|---|
| EV/EBITDA | 18.6xᵐ | 28.5xᵐ | 20.5xᵐˢ |
| P/E | 26.8xᵐ | 33.0xᵐⁱ | 32.8xᵐˢ |
| FCF Yield | 1.9%ᵐ | 1.7%ᵐ | -0.1%ᵐˢ |
Source: Peer-company SEC filings; comparability notes in 5.7 — see Appendix A.1.
All peer valuation multiples are market-sourced (Tier 2 market capitalizations as of early August 2026) divided by each company’s last full-year filed figures. Because the fiscal years end in different months, these are current-price / different-vintage-earnings multiples, not clean same-period LTM multiples. Subject to change with price movements.
Flag legend: ᵐ = market-sourced; ⁱ = P/E denominator inflated by non-operating investment gains (understates the operating multiple); ˢ = earnings roughly fifteen months stale (Oracle), overstating the trailing multiple relative to current earnings power.
This is where the quality-versus-price paradox becomes explicit, and it is the single most important observation in the section. Microsoft is the highest-quality name in the set — the best operating margins, the best returns, the strongest balance sheet — yet it carries the lowest EV/EBITDA and the lowest P/E of the three. At 18.6x EV/EBITDA, Microsoft trades at a substantial discount to Alphabet’s 28.5x, despite Microsoft earning materially higher EBITDA margins and ROIC. On P/E the same holds: Microsoft’s 26.8x sits below both Alphabet’s 33.0x and Oracle’s 32.8x. On the standard framework — a premium multiple must be earned with superior growth, margins or returns — Microsoft has earned the premium on fundamentals but is not being charged one by the market. That is the relative-value opening.
Two adjustments, however, make Microsoft’s apparent cheapness more nuanced and must be disclosed rather than glossed. First, and most important for this report, Microsoft’s P/E of 26.8x is calculated on GAAP earnings that are inflated by the non-cash OpenAI dilution gain — a one-off, non-operating item with no cash content. Stripping that gain out (as management’s own new adjusted measure does) lowers the earnings denominator and therefore raises the true P/E above the 26.8x headline: Microsoft is not quite as cheap on normalized earnings as the reported multiple suggests. The EV/EBITDA multiple is the cleaner comparator precisely because it is struck on operating EBITDA, above the investment-gain line — and on that clean basis Microsoft’s discount to Alphabet is real. Second, the peer multiples themselves are not pristine: Alphabet’s P/E is likewise flattered by investment gains (so its true operating multiple is higher than 33.0x), and Oracle’s entire multiple set is struck on earnings roughly fifteen months stale, overstating its trailing multiples relative to a company whose earnings have grown sharply since. The FCF-yield line is a useful reality check: at 1.9% Microsoft yields marginally more free cash than Alphabet’s 1.7%, while Oracle’s negative -0.1% confirms it is not generating distributable cash at all in this build phase. All three yields are low by historical standards — the price the market is charging for the AI-capex era.
Historical: Microsoft Corporation EV/EBITDA (period-end price)
| FY2022 | FY2023 | FY2024 | FY2025 | FY2026 |
|---|---|---|---|---|
| 20.2x | 25.0x | 25.6x | 22.9x | 14.4x |
Source: Peer-company SEC filings; comparability notes in 5.7 — see Appendix A.1.
Against its own history, Microsoft’s fiscal-close multiple looks inexpensive — but that reading is distorted by timing and should be treated with care. [Rating and price target withdrawn — see the note at the top.] Two forces drive that drop and only one is fundamental: EBITDA did grow fast enough (margin expansion plus revenue growth) to compress the multiple, but the June 30 close also happened to fall on a sharp, temporary share-price trough — the stock had pulled back materially into the fiscal year-end before rebounding through July and into early August — so the 14.4x period-end figure is struck on a depressed price and understates the through-cycle multiple. The 18.6x current-price reading, after that rebound, is the more representative gauge; the gap between the two is a price round-trip, not steady appreciation. [Rating and price target withdrawn — see the note at the top.]
5.6 Efficiency Comparison
sources The CapEx/Revenue row from the standard template is omitted from this table because the subject’s ratio is carried in Section 3’s capital-intensity analysis rather than this section’s data set; capital intensity across all three names is elevated and is treated at length in Section 3. Inventory-based metrics are shown for Microsoft only — neither Alphabet nor Oracle carries a meaningful inventory line, so Days Inventory Outstanding is not applicable to them.
| Metric | Microsoft Corporation | Alphabet Inc. | Oracle Corporation |
|---|---|---|---|
| Days Sales Outstanding | 83 days | 57 days | 54 days |
| Days Inventory Outstanding | 4 days | — | — |
| Days Payables Outstanding | 120 days | 27 days | 110 daysᵈ |
| Cash Conversion Cycle | -33 days | 30 daysᵈ | -56 daysᵈ |
Source: Peer-company SEC filings; comparability notes in 5.7 — see Appendix A.1.
Flag legend: ᵈ = payables/cash-conversion figures definitional (accounts payable measured against differently-defined cost-of-revenue bases); — = not applicable (peer carries no inventory line).
Microsoft’s working-capital profile is a genuine, if under-discussed, source of quality. Its cash conversion cycle is negative at -33 days — the company collects from customers and turns inventory faster than it pays suppliers, so growth is self-funding at the working-capital level. Days sales outstanding of 83 days runs higher than Alphabet’s 57 days and Oracle’s 54 days, a function of Microsoft’s large enterprise-contract and volume-licensing base with extended billing terms, but this is more than offset by days payables of 120 days, reflecting Microsoft’s considerable purchasing leverage over its supply chain — increasingly its GPU and server-component vendors. Inventory is effectively immaterial at 4 days. The peer cash-conversion figures should be read only directionally: both Alphabet’s and Oracle’s payables and conversion cycles are struck against software cost-of-revenue bases defined differently from Microsoft’s, so the precise day-counts are not strictly comparable even though the qualitative conclusion — that all three run efficient, largely negative or near-zero working-capital cycles typical of asset-heavy software platforms — holds. The efficiency comparison, in short, adds nothing that undermines Microsoft’s quality standing and modestly reinforces it.
5.7 Comparability Caveats
sources The comparisons above rest on figures drawn from three filings with genuinely different vintages, definitions and balance-sheet situations. The following material caveats are not footnotes to be waved past — each changes how a specific comparison should be read, and each has been applied in the tables and prose rather than merely noted.
1. Three different fiscal year-ends (affects every comparison; growth and valuation most). Microsoft’s FY2026 closes in June 2026, Alphabet’s FY2025 in December 2025 (about six months behind), and Oracle’s FY2025 in May 2025 (about thirteen months behind Microsoft and the stalest data in the set). No period was relabelled; each figure is its true last-full-year value. [Rating and price target withdrawn — see the note at the top.] Oracle’s staleness is the most consequential: its earnings have grown materially since May 2025, so its trailing multiples in 5.5 overstate its true forward valuation.
2. Non-operating investment gains inflate net-income metrics at both Microsoft and Alphabet (affects net margin, ROE, P/E). In the current fiscal year both companies recognized large non-operating gains — for Microsoft, chiefly the non-cash OpenAI dilution gain; for Alphabet, mark-to-market gains on its securities portfolio. These flow into net income, so both companies’ net margin, ROE and reported P/E are flattered, while their EBIT/EBITDA margins and ROIC are clean. Oracle’s earnings are relatively free of this effect. This is why the profitability and returns rankings above lead with operating measures, and why Microsoft’s headline P/E of 26.8x should be understood to understate its true operating multiple: normalized for the OpenAI gain, the earnings base is lower and the effective P/E higher.
3. Oracle’s free cash flow is negative and its leverage is real (affects FCF margin, FCF yield, and the leverage comparison). Oracle’s FY2025 capex exceeded its operating cash flow, producing negative free cash flow and, consequently, a negative FCF yield and no meaningful price-to-FCF multiple — which is why Oracle is absent from any FCF-multiple comparison. Oracle is also the only levered name in the set (Net Debt/EBITDA of 3.4x), against net-cash Microsoft and Alphabet. Oracle comparisons on cash generation and balance-sheet strength are therefore not like-for-like and consistently flatter Microsoft.
4. Oracle’s ROE and debt/equity are distorted by a depleted equity base (affects ROE, D/E). Years of buybacks have driven Oracle to an accumulated deficit, shrinking its equity denominator so severely that its 60.8% ROE and its high debt/equity ratio are arithmetic artifacts rather than measures of superior returns or true gearing. Oracle’s ROIC of 15.1% — well below Microsoft and Alphabet — is the honest read on its capital efficiency. The returns table therefore ranks on ROIC, and Oracle’s ROE carries an explicit distortion flag.
5. All valuation multiples are market-sourced and struck on different-vintage earnings (affects EV/EBITDA, P/E, FCF yield). Every multiple in 5.5 uses current (early-August 2026) market capitalizations divided by each company’s last full-year filed figures. Because the fiscal years end in different months, these are current-price / different-vintage-earnings multiples, not clean same-period LTM multiples. They move with the market and should be treated as a snapshot, with Oracle’s roughly fifteen-month earnings vintage the most significant distortion.
6. Gross margin is not cleanly comparable across the three (affects gross margin, payables, cash conversion). Microsoft reports a clean gross-profit subtotal; Alphabet’s cost of revenue includes large traffic-acquisition and content/hardware costs; Oracle presents no gross-profit subtotal at all and states its cost lines exclude amortization of intangibles that Microsoft would include. The gross-margin row in 5.2 is therefore shown with a definitional flag and should not be used to rank the three — the operating margins beneath it are the reliable comparators. For the same reason, the peer payables and cash-conversion figures in 5.6 are definitional and shown as directional only.
7. Subject metrics computed on internal-model conventions (affects ROIC, ROE, ROA, Net Debt/EBITDA). Microsoft’s returns and net-leverage figures in this section are drawn from the internal model, whose invested-capital and net-debt definitions differ slightly from the consistent basis used for the peer figures — most notably a cash-only net-debt convention that makes Microsoft’s reported Net Debt/EBITDA look marginally positive even though, counting short-term investments as the peers do, Microsoft is net cash. These differences are modest and do not change any ranking: Microsoft leads on ROIC and sits alongside Alphabet as net cash under either convention.
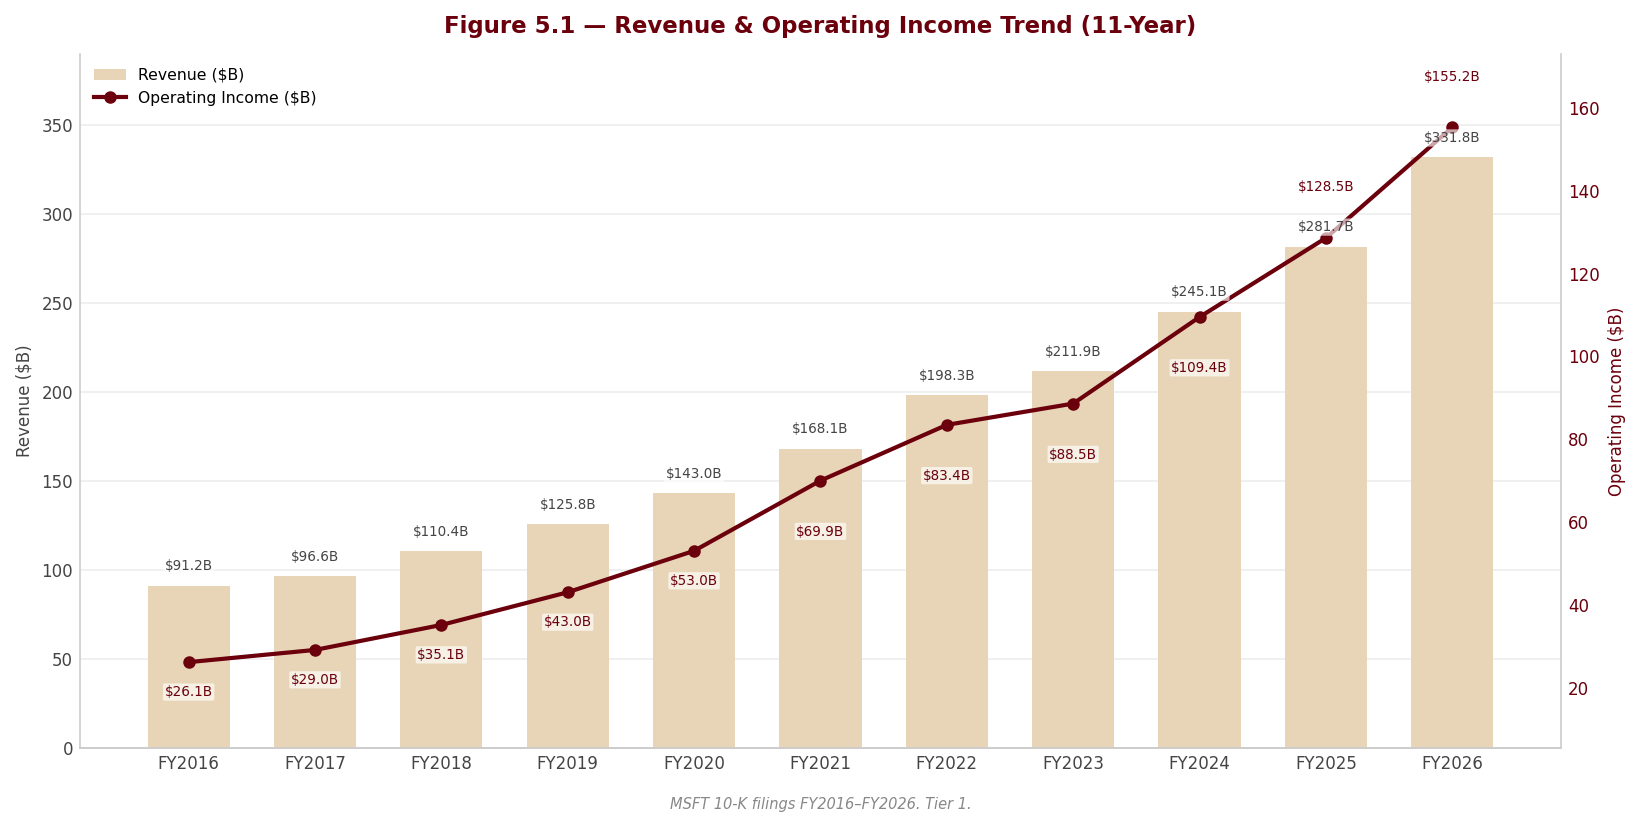
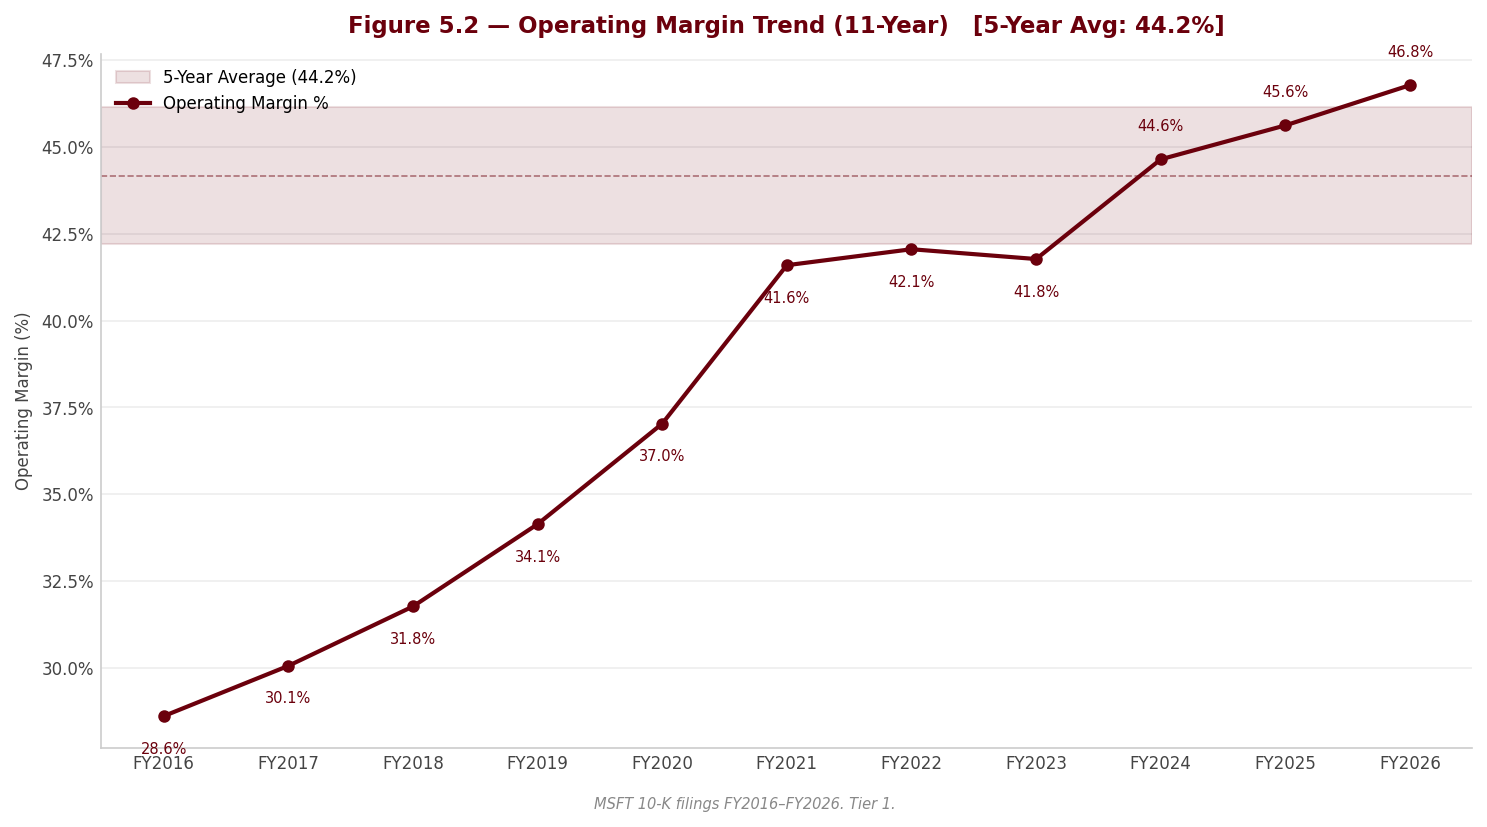
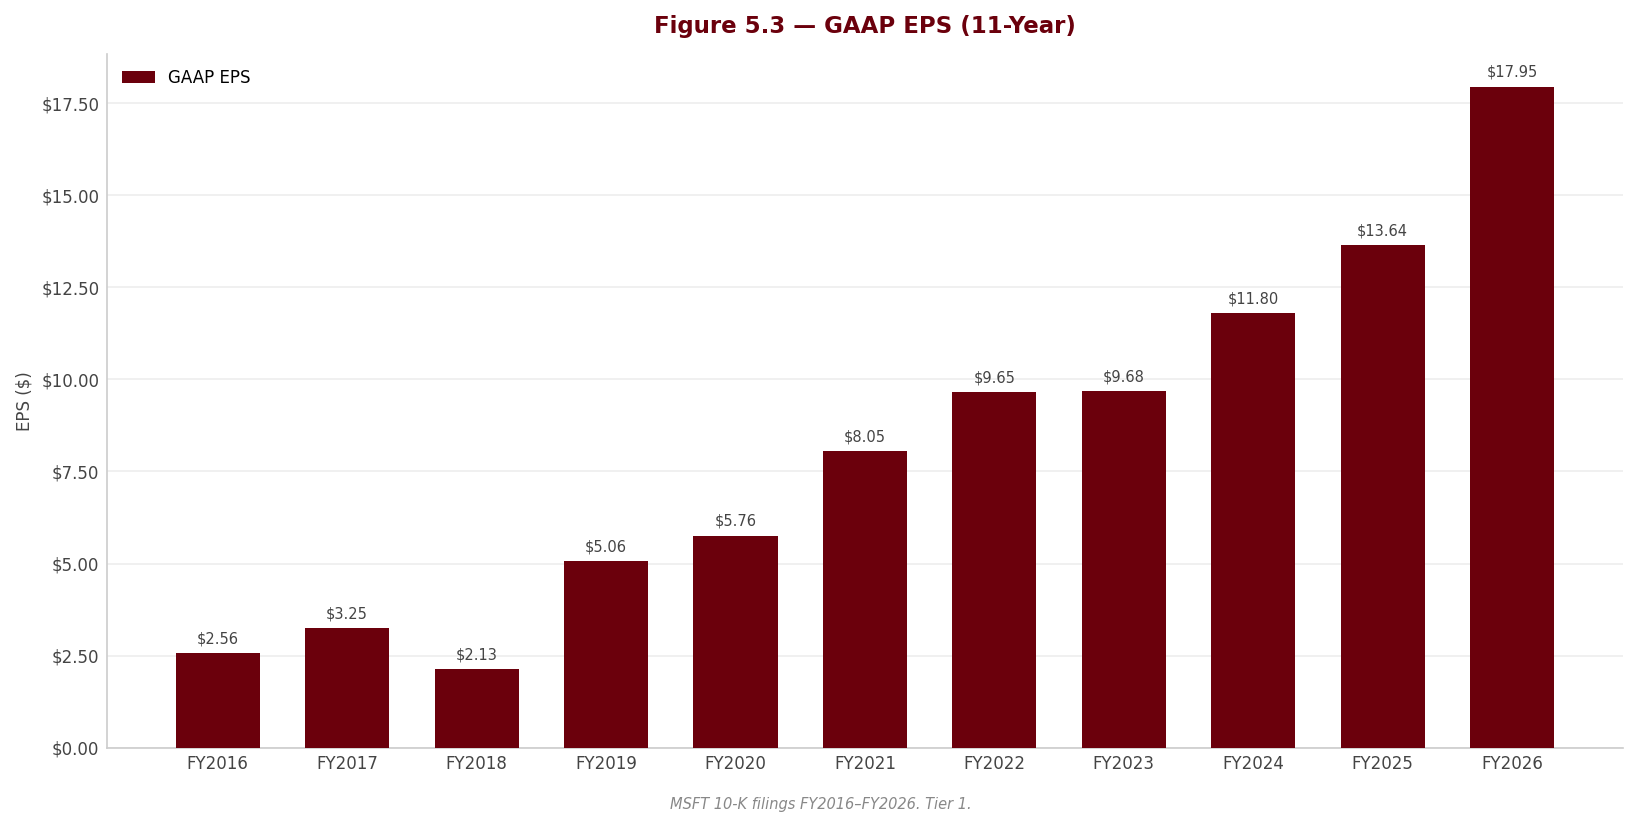
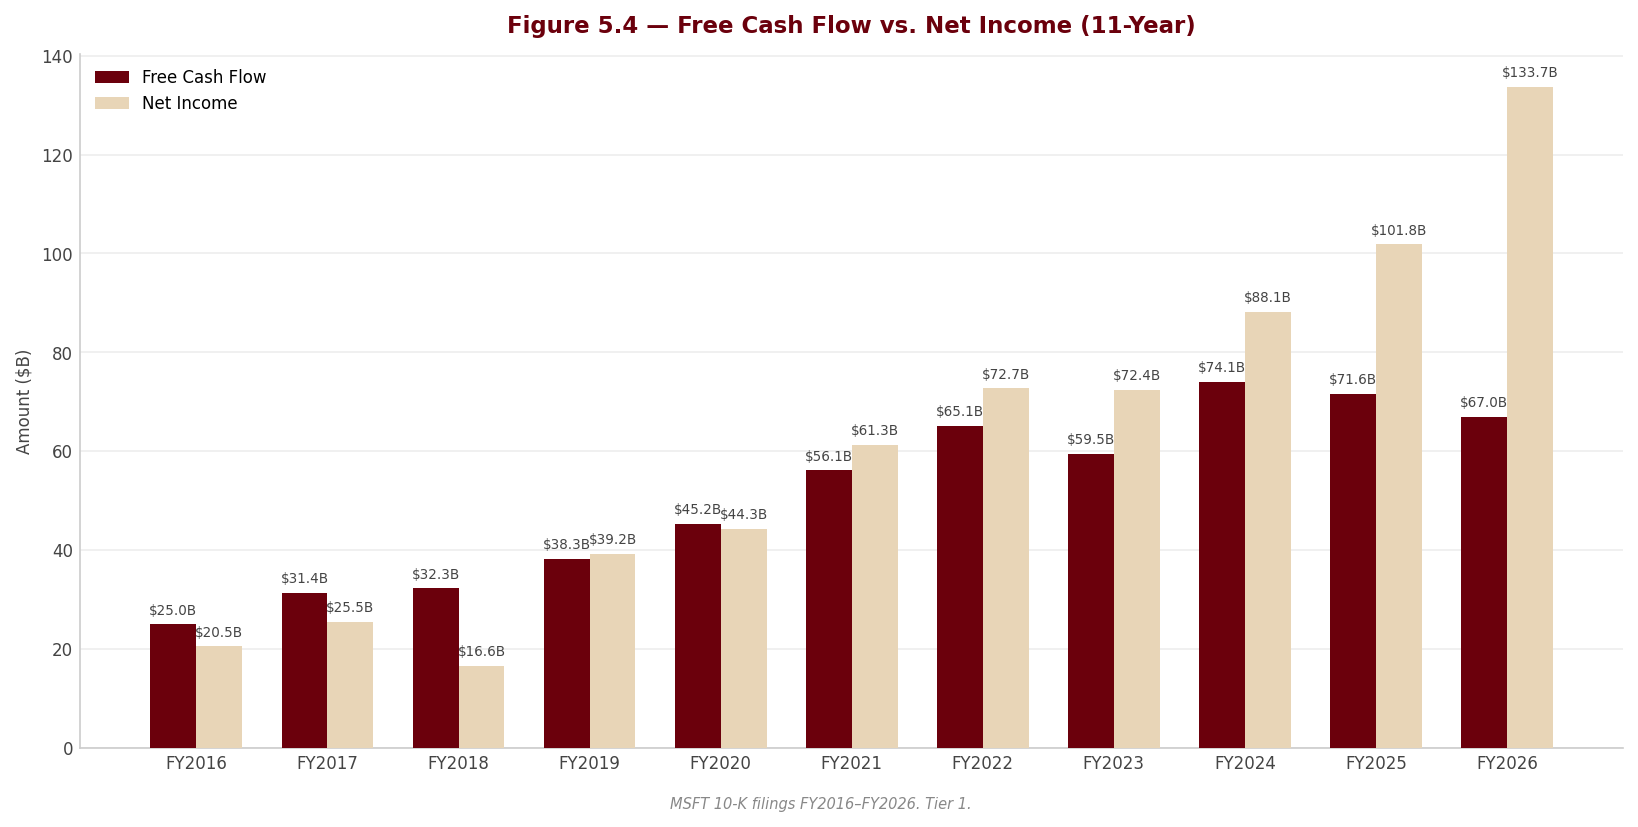
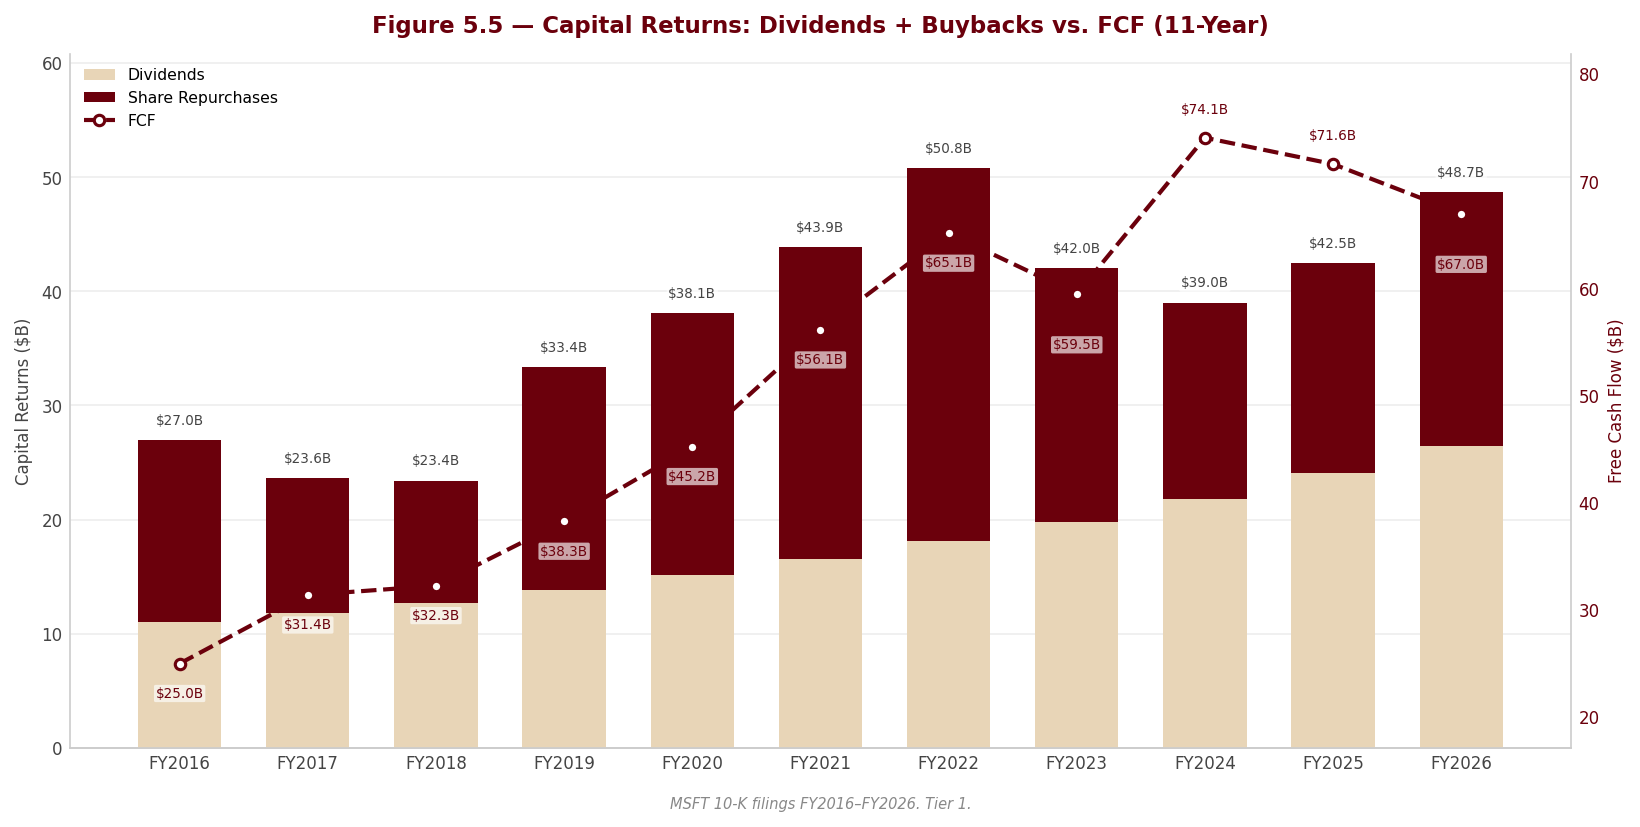
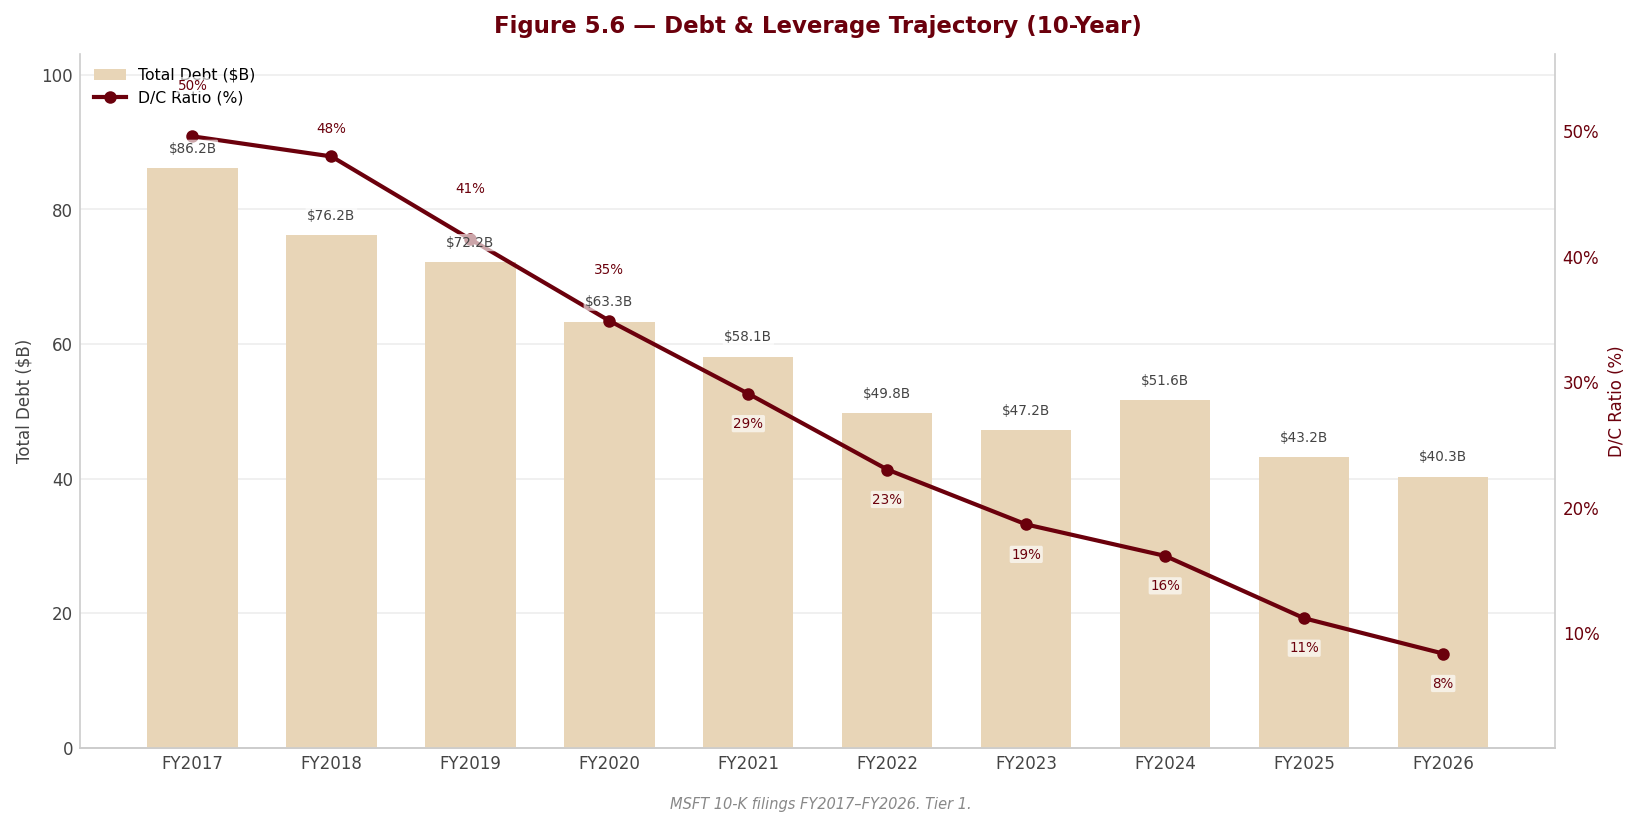
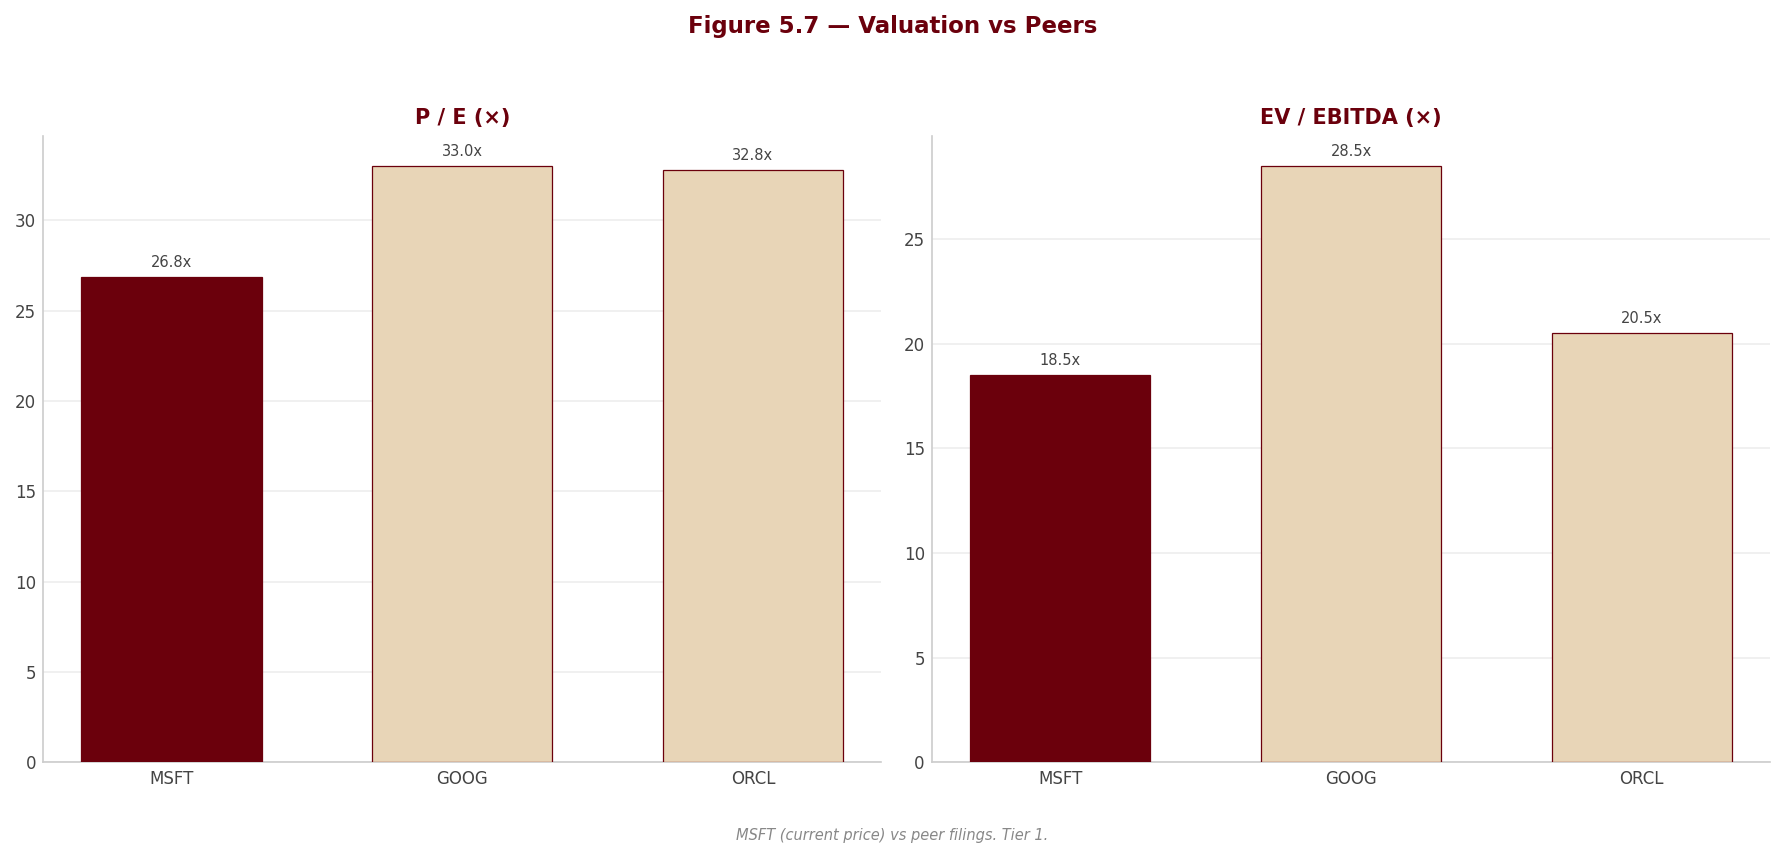
6. Valuation & Price Target withdrawn
This section stated what the shares were worth and what to do about them. It rested on an exit multiple set by hand — across the coverage it averaged 24% below where each company actually traded — so the conclusion largely restated that assumption instead of testing it. Rather than leave it standing, it has been withdrawn while the method is rebuilt.
Nothing else in this report depends on it: the financial analysis above and below is drawn from the company's own filings, and every figure links to the page it was verified against.
Section 7 — Quarterly Update: Q3 FY2026
sources This update covers Q3 FY2026 (three months ended March 31, 2026) — the last 10-Q Microsoft filed before its FY2026 10-K (fiscal year ended June 30, 2026), which underpins Sections 1–6. Because Microsoft’s June fiscal year-end means the annual filing is the more current disclosure, this section is included for the intra-year granularity the full-year statements do not surface: the quarterly trajectory, segment cadence, and the quarter-to-quarter OpenAI-mark volatility. Where the full-year FY2026 figures in earlier sections differ, they are the more up-to-date read.
Portfolio Action
[Rating and price target withdrawn — see the note at the top.]
| Assessment | |
|---|---|
| Action | [Rating and price target withdrawn — see the note at the top.] |
| Reason | A clean operating beat — revenue +18.3% to $82,886.0M, EBIT +20.0% to $38,398.0M, Azure +40%, commercial RPO +99% to $627B — offset by free-cash-flow compression (FCF -22.2% YoY to $15,803.0M; 49.7% conversion) as capex rose +84.4% YoY to $30,876.0M. |
| Thesis intact? | YES — the AI-cloud demand thesis is confirmed (Azure +40%, RPO +99%), and unlike Q1/Q2 the Q3 GAAP result is essentially free of OpenAI marks (OpenAI cut net income by only $14M), so the operating strength is real, not accounting-driven. |
| Trigger to revisit | [Rating and price target withdrawn — see the note at the top.] |
7.1 Results at a Glance
| Metric | Q3 FY2026 | Q3 FY2025 | YoY Δ | Q2 FY2026 | QoQ Δ |
|---|---|---|---|---|---|
| Revenue ($M) | $82,886.0M | $70,066.0M | +18.3% | $81,273.0M | +2.0% |
| Gross Profit ($M) | $56,058.0M | $48,147.0M | +16.4% | $55,295.0M | +1.4% |
| Gross Margin | 67.6% | 68.7% | -1.1 pp | 68.0% | -0.4 pp |
| EBITDA ($M) | $48,565.0M | $40,740.0M | +19.2% | $42,559.0M | +14.1% |
| EBITDA Margin | 58.6% | 58.1% | +0.4 pp | 52.4% | +6.2 pp |
| EBIT ($M) | $38,398.0M | $32,000.0M | +20.0% | $38,275.0M | +0.3% |
| EBIT Margin | 46.3% | 45.7% | +0.7 pp | 47.1% | -0.8 pp |
| Net Income ($M) | $31,778.0M | $25,824.0M | +23.1% | $38,458.0M | -17.4% |
| Net Margin | 38.3% | 36.9% | +1.5 pp | 47.3% | -9.0 pp |
| Diluted EPS | $4.27 | $3.46 | +23.4% | $5.16 | -17.2% |
YoY Δ formula: (CQ - PYSQ) / |PYSQ| × 100 — e.g. revenue (82,886 - 70,066) / 70,066 × 100 = +18.3%. QoQ Δ formula: (CQ - PQ) / |PQ| × 100 — e.g. revenue (82,886 - 81,273) / 81,273 × 100 = +2.0%. Margin formula: line ÷ revenue × 100 — e.g. gross margin CQ 56,058 / 82,886 × 100 = 67.6%. Margin deltas are in percentage points (pp).
Note: the QoQ decline in net income (-17.4%) and net margin (-9.0 pp) is not operating deterioration — Q2 FY2026 (the PQ) carried the OpenAI Recapitalization dilution gain, so its $38,458.0M base was inflated. On a clean operating basis EBIT was flat sequentially (+0.3%). The sequential EBITDA jump (+14.1%) reflects the quarterly split of depreciation in the model (D&A $4,284.0M in the PQ vs $10,167.0M in the CQ) and should be read alongside the flat EBIT.
Source: MSFT Form 10-Q for the quarterly period ended March 31, 2026, Income Statements (p. 3).
7.2 P&L Drivers
sources Revenue: The top line rose +18.3% YoY to $82,886.0M, driven almost entirely by Microsoft Cloud, which grew 29% to $54.5 billion; Intelligent Cloud revenue rose 30% on Azure and other cloud services up 40%, while Productivity & Business Processes grew 17% on Microsoft 365 Commercial cloud up 19% (10-Q MD&A, p. 35, 37). More Personal Computing fell 1% as Devices and Xbox hardware declined, partly offset by Search advertising ex-TAC up 12% (10-Q p. 38). Management flagged a favorable foreign-currency impact of 3% on revenue this quarter (10-Q p. 35), and commercial remaining performance obligation grew 99% to $627 billion — the strongest forward-demand signal in the filing (10-Q p. 31).
Cost and margin: Cost of revenue rose to $26,828.0M from $21,919.0M (+22% YoY), outpacing the +18.3% revenue growth, so gross margin dropped -1.1 pp YoY to 67.6% (56,058 / 82,886 × 100); management attributes the compression to “continued investments in AI infrastructure and growing AI product usage,” with Microsoft Cloud gross margin falling to 66% (10-Q p. 35). Depreciation, amortization and other reached $10,167.0M vs $8,740.0M a year ago, with standalone depreciation expense alone up to $9.0 billion from $5.8 billion as the AI fleet scales (10-Q Note 6, p. 18). Despite gross-margin erosion, EBIT margin rose +0.7 pp YoY to 46.3% because operating expenses grew only 9% (below revenue) with total headcount declining year-over-year (10-Q p. 35) — the margin pressure is structural at the cost-of-revenue line but offset for now by operating-expense discipline.
Below the line: Other income (expense), net was a modest +$942M in the quarter versus $(623)M a year ago (10-Q Note 3, p. 11); critically, OpenAI-related marks cut net income by only $14M this quarter (a $19M pre-tax net loss) versus a $583M drag in Q3 FY2025, so Q3 GAAP earnings are a clean read of operations (10-Q p. 35, 43). Interest expense rose on higher finance-lease interest but is not separable as a standalone-quarter figure in the data pack (—). Diluted EPS of $4.27 was up +$0.81 (+23.4%) YoY and down -$0.89 (-17.2%) versus the dilution-gain-inflated Q2.
7.3 Balance Sheet & Cash Flow
| Metric | Q3 FY2026 | Q3 FY2025 | YoY Δ | Q2 FY2026 | QoQ Δ |
|---|---|---|---|---|---|
| Cash ($M) | $32,105.0M | $28,828.0M | +11.4% | $24,296.0M | +32.1% |
| Net Debt ($M) | $8,157.0M | $14,053.0M | -42.0% | $15,966.0M | -48.9% |
| Net Debt / LTM EBITDA | ≈0.04×ᵃ | — | — | — | — |
| Total Assets ($M) | $694,228.0M | $562,624.0M | +23.4% | $665,302.0M | +4.3% |
| Equity ($M) | $414,367.0M | $321,891.0M | +28.7% | $390,875.0M | +6.0% |
| OCF ($M) | $46,679.0M | $37,044.0M | +26.0% | $35,758.0M | +30.5% |
| CapEx ($M) | $30,876.0M | $16,745.0M | +84.4% | $29,876.0M | +3.3% |
| FCF ($M) | $15,803.0M | $20,299.0M | -22.2% | $5,882.0M | +168.7% |
| Dividends Paid ($M) | $6,756.0M | $6,169.0M | +9.5% | $6,762.0M | -0.1% |
ᵃ A true trailing-twelve-month EBITDA cannot be derived from the Section 7 data pack, which carries only two of the four trailing quarters (Q2 FY2026 EBITDA $42,559.0M and Q3 FY2026 EBITDA $48,565.0M). The ratio shown annualizes the current quarter: Net Debt $8,157.0M / (Q3 FY2026 EBITDA 48,565 × 4 = 194,260) = 0.04×. Leverage is immaterial on any reasonable basis given net debt of only $8,157.0M — but note this excludes $62,932M of on-balance-sheet finance-lease liabilities and $196.6B of signed-but-not-yet-commenced leases (10-Q Note 12, pp. 22–23).
Net Debt / LTM EBITDA: see footnote ᵃ — annualized proxy 0.04× on net debt $8,157.0M.
Source: MSFT Form 10-Q for the quarter ended March 31, 2026, Balance Sheets (p. 5) and Cash Flows Statements (p. 6). Balance-sheet YoY compares to the March 31, 2025 balance in the data pack; the 10-Q itself presents June 30, 2025 as its comparative.
Balance sheet note: The balance sheet is stronger and larger: net debt fell -42.0% YoY to $8,157.0M (total debt of $40,262M against cash of $32,105.0M, 10-Q Note 9, p. 20) and equity rose +28.7% to $414,367.0M, while total assets grew +23.4% to $694,228.0M — the growth concentrated in property and equipment, which reached $283,228M net (from $204,966M at June 30, 2025) as the datacenter build continues (10-Q Note 6, p. 18). The offset is off-balance-sheet: finance-lease liabilities climbed to $62,932M (from $46,172M at June 30, 2025) and $196.6B of datacenter leases are signed but not yet commenced (10-Q Note 12, pp. 22–23).
Cash flow note: FCF conversion was weak at 49.7% (FCF 15,803 / Net Income 31,778 × 100), and FCF fell -22.2% YoY to $15,803.0M even though operating cash flow rose +26.0% to $46,679.0M — the entire gap is capex, which jumped +84.4% YoY to $30,876.0M (10-Q p. 6). This understates true investment intensity: cash capex excludes finance-lease-funded datacenter additions ($4,009M of finance-lease right-of-use assets obtained this quarter) and $22.6B of property-and-equipment purchases still sitting in accounts payable at quarter-end (10-Q Note 6, p. 18; Note 12, p. 22).
7.4 Footnote Review
sources Note 1 — Accounting Policies (10-Q pp. 8–11) Confirms interim statements are prepared on the same basis as the FY2025 10-K, with a prior-period cash-flow recast that had no effect on the balance sheet, income statement, or net cash flows (p. 8). The note carries three items that matter: the OpenAI equity-method/related-party disclosure (p. 9; see Related-party below); server-component purchase receivables of $17.8 billion (up from $8.2 billion at June 30, 2025) plus $11.5 billion of restricted investments under a supplier agreement (p. 10); and no change to accounting policy. Significance: the $17.8B of supply-chain pre-financing and $11.5B of restricted investments tie up liquidity and inflate other current assets — reported cash is not all freely available.
Note 2 — Earnings Per Share (10-Q p. 11) Standard treasury-stock-method reconciliation; diluted shares 7,445M vs 7,461M a year ago, anti-dilutive awards immaterial. Confirmed unchanged in method vs Q3 FY2025 (10-Q p. 11). Significance: share count is broadly flat, so EPS growth is earnings-driven, not buyback-driven.
Note 3 — Other Income (Expense), Net (10-Q pp. 11–12) Total of $942M vs $(623)M in Q3 FY2025, driven by $1,652M of net recognized gains on investments (mostly unrealized equity gains) partly offset by $(295)M FX and $(491)M “Other, net” (p. 11). OpenAI contributed a net loss of only $19M this quarter vs a $768M net loss in Q3 FY2025 (p. 12). Significance: this is the crux of the quarter — Q3 is clean of the large OpenAI marks that distorted Q1 (loss) and Q2 (the recapitalization dilution gain), so GAAP earnings this quarter reflect operations.
Note 4 — Investments (10-Q pp. 13–15) Total investments of $111,955M; equity-method investments rose to $11.1 billion (from $6.0 billion at June 30, 2025) and measurement-alternative equity investments to $9.3 billion (from $2.9 billion), reflecting the expanded OpenAI stake and other AI-related holdings (p. 14). [Rating and price target withdrawn — see the note at the top.] Significance: the doubling of the equity-method balance concentrates estimate-heavy, HLBV-based carrying value in the accounts.
Note 5 — Derivatives (10-Q pp. 15–18) [Rating and price target withdrawn — see the note at the top.] Confirmed consistent in structure vs June 30, 2025 (10-Q p. 17). Significance: routine hedging; no thesis impact.
Note 6 — Property and Equipment (10-Q pp. 18–19) PP&E net of $283,228M (from $204,966M at June 30, 2025); servers, network equipment and software gross rose to $190,883M from $132,836M; depreciation expense was $9.0 billion for the quarter vs $5.8 billion a year ago; and $22.6 billion of PP&E purchases remained in accounts payable (from $6.9 billion) (pp. 18–19). Significance: this is the balance-sheet face of the AI build — rising depreciation will keep pressuring cost-of-revenue margins, and the $22.6B payables build flatters near-term FCF.
Note 7 — Goodwill (10-Q p. 19) Goodwill of $119,661M vs $119,509M at June 30, 2025 — a $152M increase from small acquisitions and FX, with no impairment. Confirmed unchanged in substance vs June 30, 2025 (10-Q p. 19). Significance: none; no impairment signal.
Note 8 — Intangible Assets (10-Q p. 19) Net intangibles of $19,325M (from $22,604M at June 30, 2025), amortizing as expected; quarterly amortization $1.1 billion vs $1.5 billion a year ago. Confirmed no impairment (10-Q p. 19). Significance: none.
Note 9 — Debt (10-Q p. 20) Total debt of $40,262M (from $43,151M at June 30, 2025), with $8,839M current; no new issuance; estimated fair value $36.6 billion; $9,250M matures in FY2027 (p. 20). Significance: gross debt is small and shrinking, and the AI build is being self-funded from cash rather than new debt — but see the liquidity draw-down and the lease stack under Notes 1/12.
Note 10 — Income Taxes (10-Q p. 21) [Rating and price target withdrawn — see the note at the top.] Unrecognized tax benefits and other income tax liabilities rose to $29.3 billion (from $27.4 billion at June 30, 2025) (p. 21). The IRS transfer-pricing NOPAs for 2004–2013 still seek $28.9 billion plus penalties and interest, unresolved and not expected to resolve within 12 months; MSFT holds no incremental reserve and will “vigorously contest” (p. 21). [Rating and price target withdrawn — see the note at the top.]
Note 11 — Unearned Revenue (10-Q pp. 21–22) Unearned revenue of $53,677M (from $67,265M at June 30, 2025, reflecting seasonality of annual billings); total remaining performance obligations of $633 billion, of which the commercial portion is $627 billion at a ~2.5-year weighted duration (p. 22). Significance: the RPO backlog (commercial +99% YoY per MD&A) is the single strongest forward-demand indicator and underpins the growth thesis.
Note 12 — Leases (10-Q pp. 22–23) Finance-lease liabilities of $62,932M (from $46,172M at June 30, 2025) and operating-lease liabilities of $22,238M; finance-lease right-of-use assets obtained were $4,009M in the quarter ($19,486M over nine months); and $196.6 billion of leases (primarily datacenters) are signed but not yet commenced, to begin FY2026–FY2031 (pp. 22–23). Significance: this is the defining off-balance-sheet item — the $196.6B not-yet-commenced stack is ~5× reported total debt and will convert into fixed cash obligations before the associated AI revenue is proven.
Note 13 — Contingencies (10-Q pp. 23–24) The LinkedIn/Irish Data Protection Commission GDPR matter remains under appeal, with a preliminary hearing held December 2025 (p. 23). Aggregate accrued legal liabilities of $647 million (up from $553 million disclosed at fiscal year-end), with reasonably-possible additional losses of ~$400 million beyond amounts recorded (p. 24). Significance: quantified legal exposure is immaterial to MSFT’s scale and adequately reserved; larger AI/antitrust/DMA risks remain non-estimable and off-model.
Note 14 — Stockholders’ Equity (10-Q pp. 24–25) $44.0 billion remained of the $60 billion buyback authorization at March 31, 2026; the quarter’s dividend was $0.91/share (declared March 10, 2026, payable June 11, 2026, and sat in other current liabilities at quarter-end) (pp. 24–25). Significance: capital return continues but is being deprioritized behind capex — see 7.5.
Note 15 — Accumulated Other Comprehensive Income (Loss) (10-Q p. 26) AOCI improved to $(3,228)M from $(3,347)M at June 30, 2025, on small investment and derivative movements. Confirmed immaterial and consistent vs prior periods (10-Q p. 26). Significance: none.
Note 16 — Segment Information and Geographic Data (10-Q pp. 26–29) Three reportable segments unchanged, all periods presented on the current (recast) basis, so Q3 FY2026 is directly comparable to Q3 FY2025 (p. 26). Segment results: Productivity & Business Processes revenue $35,013M (+17%), operating income $20,973M (+21%); Intelligent Cloud revenue $34,681M (+30%), operating income $13,753M (+24%), with cost of revenue +47% on AI infrastructure; More Personal Computing revenue $13,192M (-1%), operating income $3,672M (+4%) (pp. 28, 36). Significance: confirms the segment recast noted for MSFT — the comparison is apples-to-apples — and shows Intelligent Cloud carrying the growth while its 47% cost-of-revenue increase drives group gross-margin erosion.
Report of Independent Registered Public Accounting Firm (10-Q p. 30) Deloitte & Touche LLP performed an interim review (not an audit) and is “not aware of any material modifications” needed; dated April 29, 2026 (p. 30). Significance: clean interim review; no qualification.
Related-party transactions (10-Q p. 9) OpenAI is MSFT’s equity-method investee — an approximately 27% as-converted interest accounted for under the HLBV method — and is therefore a related party (Note 1, p. 9). CQ (Q3 FY2026) P&L impact: a net loss of $19M pre-tax / $14M after-tax from OpenAI (Note 3, p. 12; non-GAAP reconciliation, p. 43). PYSQ (Q3 FY2025) comparison: a net loss of $768M pre-tax / $583M after-tax (p. 12, p. 35) — so the OpenAI swing improved the year-over-year comparison by roughly $0.6B after tax. Funding: total commitments of $13.0 billion, of which $11.8 billion had been funded as of March 31, 2026 (Note 1, p. 9), up from the annual $11.9B funded-basis; the equity-method carrying value stood at $11.1 billion (Note 4, p. 14). Terms changed during the period: a new definitive agreement was signed in October 2025 and the partnership was extended again in April 2026 (MD&A, p. 32). Disclosure gap: unlike the FY2026 10-K, this 10-Q does not quantify the dollar amount of Azure/commercial revenue earned from OpenAI, so the OpenAI slice inside the reported 40% Azure growth cannot be sized from this filing. Note also the apparent tension with MD&A p. 45, where management states it “has not engaged in any related party transactions… reasonably likely to materially affect liquidity” — that statement addresses liquidity/capital-resource impact, whereas OpenAI is a disclosed equity-method related party affecting the income statement and investment balances.
Contingencies and litigation (10-Q pp. 23–24) Two matters: (1) the LinkedIn GDPR appeal before the Irish courts (preliminary hearing December 2025), amount not separately quantified (p. 23); and (2) aggregate accrued legal liabilities of $647 million with ~$400 million of reasonably-possible additional loss (p. 24). The IRS $28.9 billion transfer-pricing NOPA (Note 10, p. 21) is the largest contingent exposure and is unreserved beyond existing allowances. Change vs prior: accrued legal liabilities rose from $553M (fiscal year-end) to $647M; the IRS amount is unchanged at $28.9B and remains unresolved.
Subsequent events (10-Q p. 32, p. 66) No dedicated subsequent-events note is included. Disclosed post-quarter items: (1) the OpenAI partnership was extended again in April 2026 (MD&A, p. 32); (2) the $0.91/share dividend declared March 10, 2026 is payable June 11, 2026 (Note 14, p. 25); and (3) CEO Satya Nadella adopted a new Rule 10b5-1 trading plan on March 8, 2026 (in-quarter) under which he will sell 80% of net vested shares upon an August 31, 2026 performance-stock-award vest, first trade no earlier than August 31, 2026 (Item 5, p. 66). No other Section 16 officer or director adopted, modified, or terminated a trading arrangement in the quarter (p. 66).
7.5 What Changed This Quarter
sources - The OpenAI accounting noise cleared. OpenAI cut net income by only $14M this quarter versus a $583M drag a year ago and a large recapitalization gain in Q2 FY2026; adjusted (ex-OpenAI) EPS of $4.27 grew +21% against GAAP EPS growth of +23.4% (10-Q p. 43). Thesis implication: for the first time this fiscal year, headline earnings can be trusted as an operating read — and they are strong. - Commercial RPO grew 99% to $627 billion at a ~2.5-year weighted duration (10-Q p. 22, p. 31). Thesis implication: the forward book roughly doubled year-over-year, directly supporting the durability of the cloud-growth thesis and de-risking near-term revenue. - Azure and other cloud services grew 40%, lifting Intelligent Cloud revenue +30% to $34,681M, but Intelligent Cloud cost of revenue rose +47% (10-Q p. 36, p. 37). Thesis implication: growth is intact but increasingly capital-intensive; the growth should be read net of OpenAI’s own Azure consumption, which the quarterly filing does not size. - The capital-intensity regime intensified. Cash capex rose +84.4% YoY to $30,876.0M, pushing FCF down -22.2% to $15,803.0M and conversion to 49.7% (10-Q p. 6); true investment is higher still given $22.6B of accrued-in-payables capex and $4.0B of finance-lease additions this quarter (Note 6, p. 18; Note 12, p. 22). Thesis implication: near-term free cash flow is being consumed by the build, and any DCF must add finance-lease additions to capex. - The off-balance-sheet obligation stack grew. Finance-lease liabilities rose to $62,932M (from $46,172M) and not-yet-commenced leases stand at $196.6B (10-Q Note 12, pp. 22–23). Thesis implication: reported net debt of $8,157.0M materially understates committed infrastructure obligations. - Capital return held but was deprioritized. MSFT returned $10.2 billion via buybacks and dividends this quarter (10-Q p. 65), with $44.0B of authorization remaining and the dividend +9.5% YoY — but buybacks are small relative to the ~$31B capex quarter. Thesis implication: cash is flowing to infrastructure over shareholders, consistent with the AI build.
7.6 Portfolio Decision
sources [Rating and price target withdrawn — see the note at the top.] This was the cleanest and strongest quarter of MSFT’s fiscal year on an operating basis: revenue +18.3% to $82,886.0M, EBIT +20.0% to $38,398.0M, Azure +40%, and commercial RPO +99% to $627B — and, unlike Q1 and Q2, the $4.27 of diluted EPS (+23.4% YoY) is essentially undistorted by OpenAI marks, which cut net income by only $14M (10-Q p. 43). That confirms the AI-cloud demand thesis rather than merely reflecting an accounting gain, which is the single most important read from the footnotes. The reason not to add is the cash-flow and obligation profile: free cash flow fell -22.2% YoY to $15,803.0M at just 49.7% conversion, cash capex rose +84.4% to $30,876.0M, finance-lease liabilities reached $62,932M, and $196.6B of leases are signed but not yet on the balance sheet (10-Q Notes 6 and 12, pp. 18, 22–23) — alongside an unreserved $28.9B IRS exposure (Note 10, p. 21). The thesis is intact and arguably reinforced on demand, but the price of that growth is rising, so the balanced call is to hold the position rather than press it here.
What would change this view: [Rating and price target withdrawn — see the note at the top.] [Rating and price target withdrawn — see the note at the top.]
Report Versions
Every published version of this report, newest first — each one kept so a reader can see what changed and when.
| Version date | Files |
|---|---|
| 2026-08-19 Current | Model (Excel) |
| 2026-08-04 | Model (Excel) |