
Meta Platforms, Inc.
Section 1 — Business Overview, Operations & Competitive Positioning
sources
1.1 The Business
sources Meta Platforms, Inc. is an advertising business wrapped in a social-network: it assembles the largest engaged consumer audience in the world across a family of free apps, then sells advertisers precise access to that audience — and it now channels the resulting cash flow into an enormous artificial-intelligence and data-center build. Substantially all of the company’s revenue comes from selling advertising placements across Facebook, Instagram, Messenger, Threads and WhatsApp; the underlying economic engine is engagement, which the company monetizes through the number of ad impressions it delivers and the average price it commands per impression. §
The scale of that engine is best seen in the revenue trajectory: reported revenue has grown from $40,653.0M in FY2017 to $200,966.0M in FY2025, a roughly five-fold expansion over eight years driven almost entirely by advertising. That growth has come from both more impressions — supported by continued user and engagement gains, particularly in Asia-Pacific — and a higher average price per ad, which management attributes largely to ongoing improvements in AI-driven ad targeting and measurement. The company operates globally, reaching users through mobile devices, personal computers, virtual-reality headsets and AI glasses, and sells advertising through a predominantly self-service platform supplemented by a global sales force with offices in more than ninety cities. Meta’s workforce is large, global and increasingly weighted toward engineering and AI research talent; the company has repeatedly reshaped headcount through restructurings and efficiency programs while competing aggressively for scarce senior AI engineers, and it now positions AI-tool fluency as core to how employees operate. Meta’s Class A common stock trades on Nasdaq under the ticker META; it sits within the Communication Services sector.
Economically, the company earns its returns by converting attention into advertising demand at very high incremental margins, then reinvesting that cash into two long-dated bets — frontier AI and the Reality Labs “metaverse” hardware platform — the first of which increasingly reinforces the core advertising business and the second of which remains a large, deliberate operating loss. [Rating and price target withdrawn — see the note at the top.]
Key Information
| Item | Value |
|---|---|
| Ticker | META |
| Sector / Industry | Communication Services |
| Report Date | 2026-08-03 |
| Most Recent FY Revenue | $200,966.0M |
| EBIT Margin (Most Recent FY) | 41.4% |
| Diluted Shares (FY2025 wtd-avg) | 2,574M |
| Current Price | $543.67 |
Source: Company SEC filings (10-K); see Appendix A.1.
1.2 Operating Segments
sources Meta reports two segments, and understanding the business means understanding that they are not two comparable divisions but a cash machine and the capital project it funds.
Family of Apps (FoA) comprises Facebook, Instagram, Messenger, WhatsApp and Threads, together with the Meta AI assistant. It generates substantially all of the company’s revenue and effectively all of its operating profit, almost entirely from advertising. The single economic variable that drives it is monetized engagement — the product of daily active people and the revenue extracted per person — which in turn feeds impressions and ad pricing. Each app plays a distinct role in sustaining that engagement: Facebook around community, Feed, Reels, Groups and Marketplace; Instagram around visual sharing, discovery and shopping; Messenger and WhatsApp as private, encrypted messaging (with WhatsApp still only lightly monetized and positioned as the long-term business-messaging and payments surface); and Threads as a text-based public conversation app. This segment operates at very high margins and is the source of all the cash the rest of the company spends.
Reality Labs (RL) covers virtual- and augmented-reality hardware, software and content — Meta Quest headsets and the Horizon store, plus a fast-growing wearables line including Ray-Ban Meta and Oakley Meta AI glasses, the Orion true-AR prototype, and the Meta Ray-Ban Display paired with the Neural Band wrist device. It earns modest revenue from hardware, software and content sales, but the variable that actually defines it is not revenue at all — it is the size of the operating loss the company is willing to absorb in pursuit of what management calls “the next computing platform.” That loss is large and has widened again this year, driven by rising personnel, technology-development and inventory-related costs, even as segment revenue grew only slightly (AI-glasses strength offsetting weaker Quest sales). Management is explicit that it expects Reality Labs to keep losing money for the foreseeable future and guides the 2026 loss to remain similar to 2025 — a material, persistent drag that a portfolio manager must weigh against, not blend into, the core franchise. This is the single most important framing point of the entire investment case, and it is why the segment loss deserves prominent disclosure rather than burial in blended margins: the consolidated operating margin understates how profitable the advertising business truly is while overstating how sustainable the combined economics are.
The two segments form a deliberate flywheel. FoA engagement generates advertising data; that data, refined through AI ranking, discovery and ad-targeting systems, improves advertiser return on investment; better returns attract more ad spend; and that spend funds reinvestment in AI, infrastructure and — at management’s discretion — Reality Labs. The synergy is real and increasingly AI-mediated: the same model investment that powers content ranking also powers ad targeting and generative-ad tools. The fragility is equally real. First, the flywheel depends on data signals that Apple’s and Google’s mobile-platform control can restrict (developed further below and in Section 2). Second, Reality Labs is an open-ended capital sink with no visible path to breakeven, funded entirely by the advertising profits it does not yet contribute to. The strategic bet is that today’s AI and hardware spending eventually unlocks new monetization surfaces; the risk is that it does not, while the losses compound.
1.3 Geographic Exposure
sources Meta’s audience is global, but its monetization is not evenly distributed. Advertising revenue skews heavily toward higher-income geographies — the United States, Canada and Europe generate far more revenue per person than Asia-Pacific or the rest of the world — even though impression growth is fastest in Asia-Pacific, where more users and rising engagement expand volume at a lower price per ad. The practical implication is a structural tension the company manages continuously: unit (impression) growth is concentrated in lower-monetizing regions, while pricing power is concentrated in mature, slower-growing ones. Reels and other lower-monetizing surfaces reinforce this, growing engagement in places and formats that currently earn less per impression.
Currency exposure follows the international revenue base, and management reports advertising results on both a reported and a constant-currency basis to isolate that effect. Two geography-specific realities matter even at this overview level. Europe is a source of both revenue and concentrated regulatory risk: the EU’s Digital Markets Act challenge to Meta’s “subscription for no ads” model could force changes that materially worsen the European user experience and revenue. And a meaningful slice of revenue flows through a small number of resellers serving China-based advertisers, exposing the company to trade-policy and government-action risk, while Meta’s own consumer apps are largely unavailable in China and have been restricted or prohibited in markets including Russia. The full regulatory and political-risk analysis belongs in Section 2; here the point is simply that Meta’s geographic footprint concentrates its growth, its pricing power and its regulatory exposure in three different places.
1.4 Management Team
sources The management assessment begins and ends with one person. Meta is founder-led by Chairman and CEO Mark Zuckerberg, who through the dual-class share structure controls a majority of the voting power and can determine the outcome of every matter submitted to shareholders. [Rating and price target withdrawn — see the note at the top.] For an investor, this is double-edged. It has enabled decisive, long-horizon capital allocation that a more constrained board might not have permitted — an advantage when the bets pay off, as the advertising-AI reinvestment largely has. It also concentrates strategic risk in a single individual and removes the standard board-independence checks (Meta operates under Nasdaq’s “controlled company” exemption). The filing itself flags key-personnel dependence on Zuckerberg, and the governance and control implications are treated as a risk in Section 2.
Below the founder sits an experienced, long-tenured senior team spanning finance, operations and technical leadership, supported by a company-wide push to hire and retain senior engineering and AI-research talent in a fiercely competitive market — arguably the most important operational execution challenge the leadership faces today, given that the entire AI strategy depends on it. Two gaps are worth noting for completeness. First, succession is thin by design: there is no evident heir to a founder-controlled company, which is a genuine long-term overhang rather than a near-term concern. Second, related-party and detailed compensation disclosure is deferred to the forthcoming proxy statement and is therefore not assessable from the annual filing alone; a complete governance read requires that document.
1.5 Capital Allocation Track Record
| Year | Dividends Paid ($M) | Share Repurchases ($M) | CapEx ($M) |
|---|---|---|---|
| FY2021 | — | $44,537.0M | $18,567.0M |
| FY2022 | — | $27,956.0M | $31,431.0M |
| FY2023 | — | $19,774.0M | $27,266.0M |
| FY2024 | $5,072.0M | $30,125.0M | $37,256.0M |
| FY2025 | $5,324.0M | $26,248.0M | $69,691.0M |
Source: Company SEC filings (10-K); see Appendix A.1.
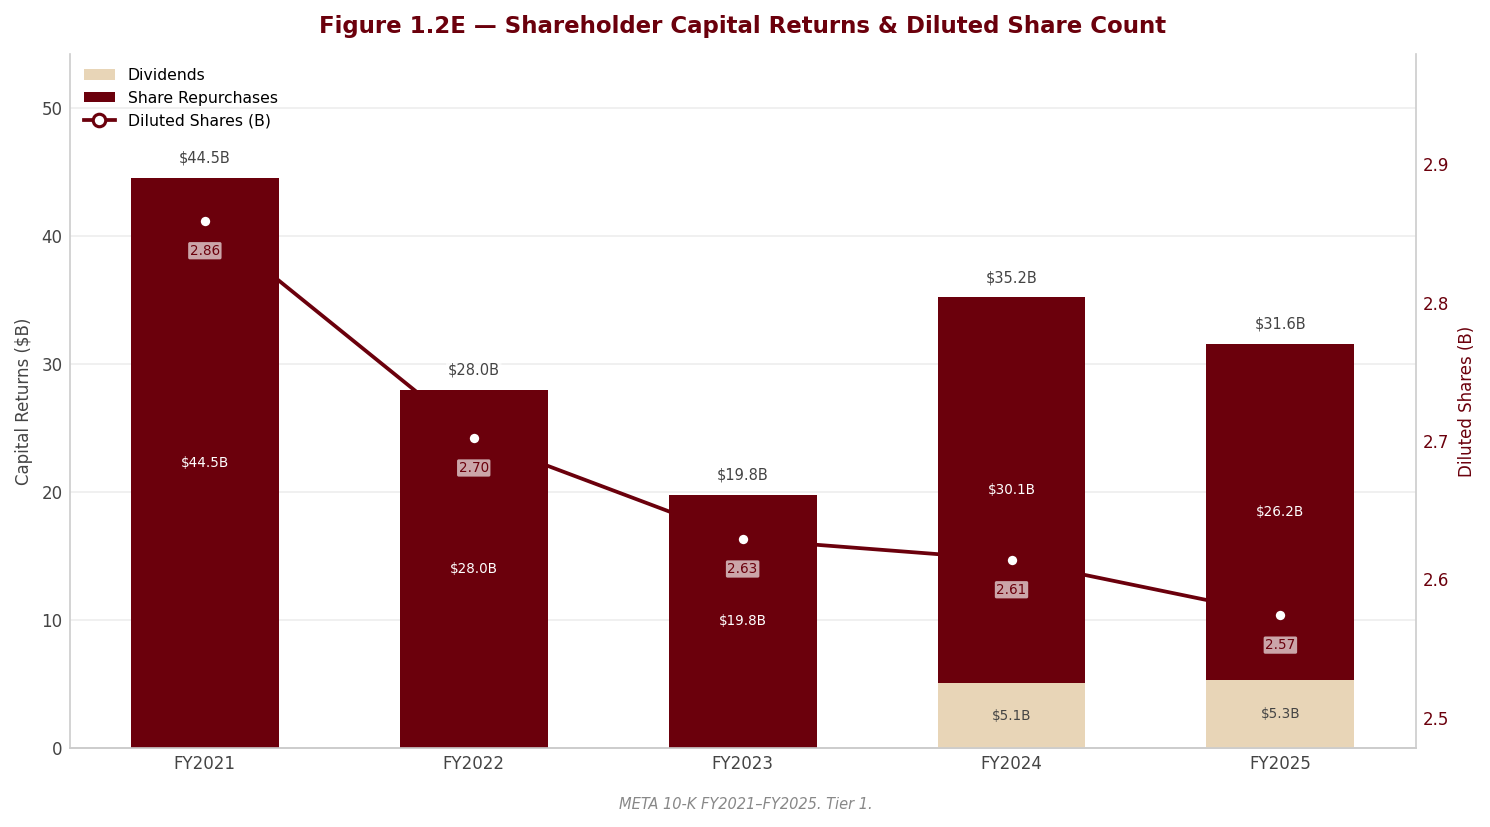
The capital-allocation story of the past five years is a shift in emphasis from returning cash to building physical infrastructure. Through FY2022 the company was primarily a buyback machine funded entirely by operating cash. It then initiated its first-ever dividend and has since grown it modestly, layering a small, rising dividend on top of continued large repurchases. But the dominant and accelerating call on capital is now capital expenditure: spending on data centers, servers and network infrastructure to support the AI build has surged and is guided sharply higher again into 2026, to a level that dwarfs the company’s depreciation and amortization. That gap is the key signal in the table — capital expenditure now runs at a multiple of the depreciation charge, which tells you this is overwhelmingly growth investment in new capacity, not the maintenance replacement of existing assets. It also means a large and growing base of construction-in-progress that has not yet begun to depreciate, foreshadowing a future depreciation step-up that current margins do not reflect (developed in Section 3).
The read-through on management’s priorities and confidence is straightforward: this is a team that believes it has found a high-return use for capital inside the business and is prioritizing it over shareholder returns, while still returning meaningful cash. The discipline question is whether the returns on this AI capital will justify the outlay — a genuinely open question the company itself concedes. One further shift deserves flagging: for the first time the build is no longer fully self-funded. Meta issued a large tranche of senior unsecured notes late in FY2025, roughly doubling its debt, to help fund the combination of record capital expenditure, buybacks and the growing dividend as free-cash-flow conversion falls. [Rating and price target withdrawn — see the note at the top.]
1.6 Competitive Positioning & Moat
sources Industry structure. Digital advertising is a scale-and-data business in which returns concentrate among a handful of platforms that own the largest pools of engaged attention and the best tools to target and measure against it. The economics reward incumbency: the more users and engagement a platform has, the more data it collects; the more data, the better its targeting and measured return for advertisers; the better the advertiser return, the more spend it attracts — a winner-take-most dynamic. The corollary is that the scarce inputs are consumer attention and the data signals needed to act on it, and control over either — by a competitor or by the mobile-operating-system owners — is where competitive power actually sits.
Competitive advantages. Meta’s moat rests on several reinforcing sources, each grounded in the filing rather than asserted. The first is network effects and sheer audience scale: billions of people use the Family of Apps, and management identifies the size and engagement of that base as the critical driver of its ability to deliver ad impressions. The second is data and targeting scale operating across an integrated family of apps, which lets the company build ad-targeting and measurement systems, and increasingly generative-AI ad tools, that smaller rivals cannot match. The third is distribution: a global, predominantly self-service advertising platform reaching advertisers of every size, supplemented by a sales force in more than ninety cities. The fourth is AI and infrastructure — Meta designs and operates its own data centers, is investing heavily in frontier models, and uses AI to power content ranking, discovery and advertiser tools; its open-sourcing of the Llama model family is a deliberate strategy to accelerate AI progress, seed an external developer ecosystem around its stack, and improve its own products. Together these create high advertiser switching costs and a self-reinforcing data-and-engagement loop that is genuinely difficult to replicate.
Competitive vulnerabilities. The moat is wide but not impregnable, and the filing is candid about the pressure points. Engagement competition is real: management names TikTok as having reduced engagement, particularly among younger users — the demographic that most shapes long-term platform relevance. Platform dependence is a structural weakness: the substantial majority of revenue comes from advertising on mobile devices running Apple’s iOS and Google’s Android, and those two companies both compete with Meta and control the operating systems that can limit ad targeting and measurement — Apple’s iOS privacy changes have already pressured targeting effectiveness and advertiser budgets. Regulation is an escalating constraint, especially in Europe, where the DMA, DSA and related regimes can force changes to Meta’s data use, ad model and product design. A further caution applies to the very metrics used to judge engagement: management discloses that its daily-active-people and per-person revenue figures are model-derived estimates carrying a meaningful margin of error, and that it changed the methodology behind its “violating accounts” estimate late in FY2025 — so reported user and per-user trends should be read as directional rather than precise, and cross-period comparability is imperfect. Finally, Reality Labs and the frontier-AI race are simultaneously a strategic option and a vulnerability, consuming capital and management attention with uncertain payoff.
Verdict. Meta possesses a wide, cash-generative moat around its core advertising franchise — built on audience scale, cross-app data, AI-driven targeting and global self-service distribution — that should sustain high segment margins for the foreseeable future. But the moat is bounded on two sides: by the mobile-platform owners who control the data signals Meta depends on, and by an intensifying regulatory regime that can reshape its ad model. The AI build is beginning to widen the moat by improving the core product, but it is not yet itself a durable competitive advantage, and Reality Labs remains an open-ended cost rather than a source of protection. For long-run margin durability, the base case is favorable for the advertising franchise; the risk is not that the moat collapses, but that targeting-signal erosion and regulation slowly compress its pricing power while the AI-and-metaverse spending tests whether the reinvestment earns its cost of capital.
Section 2 — Key Risks & Catalysts
2.1 Downside Risks
sources For Meta, the dominant risk is not the durability of the advertising franchise itself — which remains formidable — but the collision of three forces the franchise now sits astride: a founder-controlled governance structure that removes the usual shareholder check on capital allocation, an escalating AI-infrastructure build that is being financed increasingly off the balance sheet, and an unusually dense and largely unquantified legal, regulatory and tax tail. The core cash engine is one of the best in global equities; the risks concern what management is choosing to do with the cash it generates, and how much of the associated obligation is visible on the face of the financial statements.
Risk 1 — Founder voting control removes the normal check on capital allocation
sources Meta operates a dual-class structure in which Class B shares carry ten votes to the Class A’s one, leaving founder, Chairman and CEO Mark Zuckerberg in control of a majority of the combined voting power. The company relies on the Nasdaq “controlled company” exemption and is therefore not required to maintain a majority-independent board, an independent compensation committee, or an independent nominating function. This matters more than a boilerplate governance caveat because every other risk in this section — the scale of the AI capital regime, the open-ended Reality Labs losses, the pace of buybacks versus debt issuance — is a capital-allocation decision that minority holders cannot meaningfully influence, delay, or reverse through the ballot. Compounding the opacity, all related-party transaction detail (Item 13) is incorporated by reference to the forthcoming 2026 proxy and is absent from the 10-K, so an arm’s-length assessment of insider and intercompany dealings cannot be completed from this filing alone. We note separately that in Q4 2025 the CFO, COO and a director each adopted Rule 10b5-1 plans to sell shares during 2026 — routine and pre-planned, but worth monitoring given the magnitude of equity vesting.
Probability: High (structural and certain) | Timeframe: Immediate / ongoing | Quantified potential impact: Not directly quantifiable; expressed as a persistent governance discount. The practical effect is that the market cannot rely on board independence to moderate the spending decisions described in Risks 3 and 4.
Risk 2 — Extreme, largely unquantified legal and regulatory tail (RED FLAG)
sources This is a red-flag disclosure. Item 3 states that the maximum aggregate monetary damages and penalties sought across Meta’s various proceedings could reach an aggregate the company itself concedes could be material to its financial condition — an order of magnitude that dwarfs the legal-related accrual actually sitting in the balance sheet. The critical analytical point is that reported earnings are not charged for the bulk of this exposure, because most matters are deemed not yet probable or estimable; the accrued figure is a floor, not a ceiling, and Note 11 warns that additional accruals “could be material.” The auditor identified loss contingencies as one of three Critical Audit Matters, underscoring the judgment involved.
Three strands make this live rather than theoretical. First, the youth “social-media addiction” litigation entered its trial phase in 2026 — the first personal-injury trial began in late January, the first state-attorney-general trial in early February, with a school-district bellwether and additional trials scheduled through 2026 and 2027, and more than one hundred thousand mass-arbitration demands outstanding; damages sought in some matters run into the tens of billions. An adverse bellwether verdict is a genuine catalyst: it could force a large incremental accrual in the very period the loss becomes probable and estimable, hitting G&A and net income sharply. Second, the FTC antitrust case seeking divestiture of Instagram and WhatsApp — which Meta won at trial in November 2025 — was appealed by the FTC in January 2026, keeping a low-probability but structurally existential remedy alive. Third, the European regulatory stack (the DMA “subscription for no ads” decision, the DSA minors proceeding, the IDPC data-transfer order, the Marketplace tying fine) continues to generate fines under appeal and, more importantly, the risk of forced product-model changes that could impair European ad revenue. §
Probability: Medium (aggregate); Low but non-trivial for the existential FTC remedy | Timeframe: Immediate — the 2026 trial calendar is the near-term trigger | Quantified potential impact: Deliberately not quantified by the company; the point is that the on-balance-sheet legal accrual understates the exposure, and a single adverse verdict could require an incremental charge material to net income.
Risk 3 — The AI capital super-cycle, the depreciation wall, and the off-balance-sheet build (RED FLAGS)
sources This is the most financially consequential cluster of red flags in the report, and it has four interlocking parts.
The capex regime and the depreciation wall. Capital expenditure reached $69,691.0M in FY2025, roughly double the $37,256.0M of the prior year, pushing capex-to-revenue to 34.7%. Management has guided FY2026 capital expenditure sharply higher again to support its AI ambitions. Yet depreciation and amortization recognised in FY2025 was only $18,616.0M — capex now runs at 3.7x of D&A. That gap is the problem: an enormous and growing base of construction-in-progress and recently placed-in-service equipment has not yet begun to depreciate at scale. As it does, depreciation will ramp for years as a structural headwind to operating margin that current earnings do not yet reflect. Because capex roughly doubled while operating cash flow grew, free cash flow fell to $46,109.0M in FY2025 from $54,072.0M despite record operating cash generation — the clearest single sign that capital discipline, not cash generation, is the metric that now matters.
The earnings-flattering useful-life extension (RED FLAG). Effective 1 January 2025, Meta extended the estimated useful lives of most servers and network assets to five-and-a-half years, the second consecutive year of lengthening. The change reduced depreciation and added a measurable slice of reported net income and diluted EPS purely through an accounting estimate rather than operations. The direction is aggressive precisely when it should be conservative: in a frontier-AI hardware race where accelerator generations turn over quickly, the case is for shorter asset lives, not longer. The extension does not eliminate the depreciation wall — it defers it, front-loading reported profit into 2025 and pushing depreciation into future years.
The off-balance-sheet Louisiana “Venture” VIE (RED FLAG). In October 2025 Meta entered a co-development arrangement for a Louisiana data-center campus, contributing assets, taking a cash distribution back out at formation, and retaining only a 20% equity-method interest. It concluded it is not the primary beneficiary and does not consolidate the entity — despite a disclosed maximum loss exposure running into the tens of billions of dollars, comprising committed development funding, residual-value guarantees and future leases. This is structured financing that keeps a large slice of the AI build, and its associated obligations and residual-value risk, off Meta’s consolidated balance sheet, understating reported leverage and invested capital. The auditor flagged the non-consolidation judgment as a Critical Audit Matter.
The broader commitment stack (RED FLAG). Beyond the VIE, Note 11 discloses a very large body of non-cancelable contractual commitments (mostly third-party cloud capacity, servers, data centers and Reality Labs hardware), and Note 7 discloses a further large tranche of operating and finance leases that have not yet commenced and are therefore not yet on the balance sheet. Aggregating the VIE exposure, the contractual commitments and the not-yet-commenced leases yields well over a quarter of a trillion dollars of contracted future cash outflows sitting outside reported debt — plus multi-year renewable-energy purchase agreements of three to twenty-five years that carry no fixed volume and are therefore an unquantified, take-or-pay-like power obligation that scales with data-center draw. To help fund this, Meta doubled its long-term debt to $58,744.0M from $28,826.0M via a November 2025 note issuance and swung to a modest net-debt position of $22,871.0M, a strategic departure from its historically net-cash, self-funding model.
As a watch item, we also flag that Meta’s non-marketable equity book — including a large Scale AI stake carried under the measurement alternative and characterised as conferring no significant influence — has ballooned into illiquid, Level 3, cost-basis holdings whose losses would surface only on impairment or an observable down-round, a source of hidden downside if private AI valuations compress. §
Probability: High that the spend and obligations occur; Medium/uncertain that the returns justify them | Timeframe: Onset now; the full depreciation wall builds over 3–5 years | Quantified potential impact: FCF already down to $46,109.0M; a multi-year D&A step-up will pressure the $83,276.0M operating-income base, and if AI monetisation disappoints the fixed-cost and off-balance-sheet commitments become a heavy operating-leverage burden.
Risk 4 — Reality Labs: an open-ended cash sink with no stated path to breakeven (RED FLAG)
sources This is a red-flag disclosure. Reality Labs generated a small fraction of a percent of company revenue against costs many multiples larger, producing an operating loss that widened again in FY2025 for the third consecutive year, and management guides FY2026 losses to remain similar and the segment to keep losing money “for the foreseeable future.” Cumulative multi-year losses now run well into the tens of billions. The disclosure itself is clean — the segment definition is unchanged and the loss is transparently reported, not buried — but the analytical consequence is significant: the profitability of the core Family of Apps advertising engine is materially understated by the consolidated $83,276.0M operating-income figure, because that number nets a highly profitable franchise against an open-ended loss-making bet. The risk is not disclosure quality; it is that a persistent, growing, founder-directed cash drain has no visible breakeven and cannot be curtailed by minority holders (see Risk 1).
Probability: High (the loss is guided and near-certain) | Timeframe: Ongoing / foreseeable future | Quantified potential impact: A recurring annual reduction to consolidated operating profit of the order of the current-year loss, with no offsetting revenue visibility.
Risk 5 — Single-revenue-stream concentration, ad-signal loss, and competition
sources [Rating and price target withdrawn — see the note at the top.] Two structural pressures sit on top of the cycle. First, signal loss: Meta’s targeting and measurement depend on data signals from properties it does not control, and platform and regulatory changes — Apple’s iOS privacy changes since 2021 chief among them — have reduced and will continue to reduce those signals, directly pressuring the return marketers earn and therefore the budgets they commit. Second, competition for engagement, with TikTok named by management as having reduced engagement particularly among younger users, and with Apple and Google controlling the mobile operating systems that gate Meta’s targeting and distribution. The mitigants are real — AI-driven targeting improvements, business-messaging and Reels formats — but they are also the same investments driving the capex in Risk 3, so the monetisation payoff and the capital risk are two sides of one bet.
Probability: Medium | Timeframe: Ongoing, with acute sensitivity in any macro downturn | Quantified potential impact: A cyclical ad-demand contraction would compress the $200,966.0M revenue base and, against the now-elevated fixed-cost and commitment structure, would hit margins and FCF disproportionately.
Risk 6 — The IRS transfer-pricing tail and a tax-distorted earnings picture (RED FLAG)
sources This is a red-flag disclosure. Meta is in an escalating, long-running transfer-pricing dispute with the IRS over intellectual property transferred to foreign subsidiaries. In May 2025 the Tax Court valued the disputed 2010 IP above the amount Meta had reported, increasing the provision; in September 2025 the IRS issued a new Statutory Notice of Deficiency for 2017–2019 asserting a very large additional tax — running into the tens of billions before interest and penalties — relating to the same underlying transaction, which Meta is now litigating. Gross unrecognised tax benefits have risen for three consecutive years, and open years extend well beyond those already assessed, so the exposure could expand further. Because the Tax Court has already ruled the IP was undervalued once, the accrual may prove inadequate if litigation turns adverse; this is a discrete, potentially multi-tens-of-billions cash-tax tail that would hit cash flows in any settlement period. The auditor identified uncertain tax positions as its second Critical Audit Matter.
Related, and analytically important in the opposite direction: reported FY2025 earnings are understated, not flattered, by tax. [Rating and price target withdrawn — see the note at the top.] As a direct result, reported net income fell to $60,458.0M from $62,360.0M and diluted EPS eased to $23.49 from $23.86, even though pre-tax income rose to $85,932.0M. [Rating and price target withdrawn — see the note at the top.] Reported EPS therefore understates the underlying earnings power of the business.
Probability: Medium (dispute is active and expanding) | Timeframe: Multi-year, settlement timing uncertain | Quantified potential impact: A potential cash-tax settlement in the tens of billions not fully captured by the current accrual; separately, normalised earnings sit above the reported $60,458.0M once the one-time charge is stripped out.
2.2 Upside Catalysts
sources The picture is deliberately asymmetric: six substantive downside risks against three to four credible catalysts. We do not manufacture balance — the risks genuinely outnumber the catalysts, and most of the catalysts are the favourable resolution of the same bets that create the risks. What tilts the overall thesis is that the catalysts, though fewer, act on a franchise of exceptional profitability, while several of the largest risks are low-probability tails.
Catalyst 1 — AI-driven advertising monetisation
sources [Rating and price target withdrawn — see the note at the top.] Management attributes FY2025 ad-revenue growth to gains in both impressions delivered and average price per ad, with pricing driven mostly by ongoing improvements in AI-based targeting and measurement — precisely the payoff the capex is meant to buy. Newer, lower-monetising surfaces (Reels, business messaging) still have substantial pricing headroom as AI closes the gap to Feed. If AI continues to lift price-per-ad and the newer formats ramp, revenue growth can be sustained without proportional user growth, showing up as expanding revenue on a stable engagement base.
[Rating and price target withdrawn — see the note at the top.]
Catalyst 2 — Operating leverage as the AI build matures
sources Meta’s core Family of Apps engine already earns far more than the consolidated margin suggests, because that margin absorbs the Reality Labs drag (Risk 4). If the AI capex converts to revenue faster than the depreciation wall (Risk 3) arrives, the franchise can hold or expand margins even as D&A ramps — the bull case in miniature. The catalyst is proof that spend per unit of incremental revenue is falling, i.e., that the build is efficient rather than open-ended. Management’s stated discipline on operating efficiency, alongside the investment, is the swing factor.
Probability: Medium | Timeframe: 2–3 years | Monitoring trigger: Revenue growth outpacing the D&A ramp; stable-to-rising operating margin despite rising depreciation; falling capex-to-incremental-revenue.
Catalyst 3 — Capital returns sustained through the build
sources Despite the record capex, Meta returned substantial cash to shareholders in FY2025 — $26,248.0M of buybacks plus $5,324.0M of dividends, having initiated its first dividend and then raised it. Continued buybacks meaningfully shrink the share count and offset the roughly $20,427.0M of annual share-based compensation dilution, while the growing dividend signals management confidence that the core engine can fund both the build and the return. A demonstrated ability to sustain returns while spending on AI would validate the self-funding thesis; the risk (already flagged) is that this is now partly debt-funded rather than fully covered by free cash flow.
Probability: High | Timeframe: Ongoing | Monitoring trigger: Continued net share-count reduction and dividend growth without a further step-up in net leverage beyond $22,871.0M.
Catalyst 4 — Removal of the antitrust overhang
[Rating and price target withdrawn — see the note at the top.]
Probability: Medium | Timeframe: 1–2 years | Monitoring trigger: Appellate ruling affirming the trial court’s judgment in Meta’s favour.
2.3 Risk & Catalyst Summary
| # | Item | Type | Probability | Timeframe | Status | Monitoring Trigger |
|---|---|---|---|---|---|---|
| 1 | Founder voting control / controlled-company exemption | Risk | High | Ongoing | Active | 2026 proxy for related-party detail; board-independence posture |
| 2 | Unquantified legal & regulatory tail (youth trials, FTC appeal, EU) | Risk | Medium (Low for existential FTC remedy) | Immediate | Active | 2026 youth-litigation verdicts; FTC appeal; EU model-change orders |
| 3 | AI capex super-cycle, D&A wall & off-balance-sheet build | Risk | High (returns uncertain) | 1–5 years | Active | FCF trajectory; D&A ramp; VIE consolidation triggers; net leverage |
| 4 | Reality Labs open-ended operating losses | Risk | High | Ongoing | Active | Segment operating loss vs guidance; any breakeven roadmap |
| 5 | Ad-revenue concentration, signal loss & competition | Risk | Medium | Ongoing | Monitoring | Price-per-ad trend; macro ad-budget signals; engagement vs TikTok |
| 6 | IRS transfer-pricing tail (and tax-distorted reported EPS) | Risk | Medium | Multi-year | Active | Tax Court rulings; UTB trend; open-year assessments |
| 7 | AI-driven advertising monetisation | Catalyst | High/Medium | 1–2 years | Monitoring | Average price per ad; ARPP; Reels/messaging monetisation |
| 8 | Operating leverage as the AI build matures | Catalyst | Medium | 2–3 years | Latent | Margin vs D&A ramp; capex-to-incremental-revenue |
| 9 | Capital returns sustained through the build | Catalyst | High | Ongoing | Active | Net share-count reduction; dividend growth; net leverage |
| 10 | Removal of the antitrust overhang | Catalyst | Medium | 1–2 years | Monitoring | Appellate ruling on the FTC appeal |
Source: Company SEC filings (10-K) and forensic footnote review; see Appendix A.1.
2.4 Risk Interdependencies
sources The risks are dangerous less individually than in combination, and they share a common ignition point: a downturn in advertising demand. The franchise today carries a far higher fixed-cost and contracted-obligation base than at any prior point — the D&A wall, the tens of billions of off-balance-sheet VIE and lease commitments, the unquantified multi-year energy agreements, and a newly doubled debt load (Risk 3), plus the recurring Reality Labs loss (Risk 4). In a normal cycle these are absorbed comfortably by the cash engine. But if the ad cycle turns (Risk 5) while capex and commitments are already locked in, the same operating leverage that magnifies profit on the way up magnifies the hit on the way down: revenue softens against a fixed and rising cost base, the depreciation wall arrives regardless, and free cash flow — already down to $46,109.0M — compresses far faster than revenue.
Two further couplings sharpen this. First, timing: the 2026 youth-litigation bellwether calendar (Risk 2) could force a large, discrete legal accrual in the same window that the IRS transfer-pricing dispute (Risk 6) crystallises a multi-tens-of-billions cash-tax demand — two unquantified, largely uncorrelated liabilities that could nonetheless land close together and strike cash flow simultaneously. Second, governance (Risk 1) is the amplifier that runs through all of it: because minority holders cannot restrain the pace of the AI build or the Reality Labs spend, the market has no mechanism to force a pullback if the ad-demand assumptions underpinning the whole capital plan prove optimistic. The single most damaging scenario is therefore the simultaneous arrival of an ad-cycle downturn, a full depreciation step-up, and an adverse legal or tax verdict — a combination against which the off-balance-sheet commitments and the absence of shareholder control would turn a cyclical dip into a sharp, and structurally sticky, cash-flow contraction.
2.5 ESG & Regulatory Exposure
sources Environmental. Meta’s environmental profile is now inseparable from its AI-infrastructure build. The data-center and compute expansion drives a large and rising draw on power, network capacity and water, and the company has entered multi-year clean- and renewable-energy purchase agreements ranging from three to twenty-five years that specify no fixed or minimum volume — a material but unquantified forward power obligation that scales with data-center demand and represents the principal environmental and cost exposure to monitor.
Social. The most acute social exposure is user well-being, particularly for minors. The youth “social-media addiction” litigation, the DSA proceeding assessing systemic risks to minors on Instagram and Facebook, expanding U.S. state laws restricting services to minors, and Australia’s under-sixteen social-media ban together constitute a coherent regulatory and litigation front around younger users — one that overlaps directly with the legal tail in Risk 2. Content moderation, misinformation, AI-generated content and deepfakes, and the January 2025 changes to content-enforcement policy add reputational and enforcement-cost exposure. Cybersecurity is managed through a board-overseen program (delegated to the Audit & Privacy Committee) that identified no material threat in FY2025, though management cautions the risk cannot be eliminated given Meta’s scale as a target.
[Rating and price target withdrawn — see the note at the top.] Obtaining and reviewing that proxy is a prerequisite to completing the related-party and executive-compensation analysis.
Regulatory. Beyond the litigation front, the standing regulatory load is heavy and European-weighted: the Digital Markets Act (including the adverse “subscription for no ads” decision and the risk of further product-model changes on appeal), the Digital Services Act, the EU AI Act, the GDPR and the fragile EU–US data-transfer framework whose invalidation management warns could impair its ability to offer Facebook and Instagram in Europe, alongside the UK Online Safety Act and a widening patchwork of U.S. state privacy and youth-safety laws. On tax, the OECD global minimum tax, the OBBBA/CAMT interaction and ongoing digital-services taxes add a persistent, jurisdictionally fragmented compliance and cash-tax burden that sits alongside the discrete IRS dispute in Risk 6.
Section 3 — Financial Analysis & Historical Performance
sources The single most important interpretive point in this section: FY2025 is a year in which Meta’s reported net income fell while the operating business accelerated. The decline is a tax accounting event, not operating deterioration, and any reader who anchors on the headline earnings line will misjudge the franchise. A second point runs underneath the first: the advertising engine is now financing a capital-expenditure regime of a scale Meta has never run, and free cash flow — not operating cash flow, not GAAP earnings — is the metric that captures the strain.
Three-Statement Linkage Confirmation (complete before writing begins): - Net Income ties (Income Statement → Cash Flow Statement): Confirmed. Reported net income of $60,458.0M is the opening line of the Consolidated Statement of Cash Flows; the two statements reconcile with no residual. - Cash ties (Balance Sheet → Cash Flow Statement): Confirmed. Ending cash and cash equivalents on the cash-flow statement equals the $35,873.0M cash and equivalents line on the balance sheet. Meta additionally holds a substantial marketable-securities portfolio that sits outside this line and is discussed under leverage below. - Retained Earnings reconciliation (Beg RE + NI - Dividends = End RE): Confirmed, with the standard equity charge. Opening retained earnings of $102,506.0M plus net income of $60,458.0M less dividends of $5,324.0M overshoots closing retained earnings of $121,179.0M; the difference is explained by share repurchases of $26,248.0M and the tax withheld on net-share settlement of vested RSUs, both charged against retained earnings. Once those are included, the roll-forward ties. No anomaly.
3.1A Income Statement
Source: Meta Platforms FY2025 Form 10-K (fiscal year ended December 31, 2025), Consolidated Statements of Income; figures per the FL model — see Appendix A.1–A.2.
CAGR Summary
| Metric | 3Y CAGR | 5Y CAGR | 10Y CAGR |
|---|---|---|---|
| Revenue | 19.9% | 18.5% | - |
| EBITDA | 39.4% | 20.8% | - |
| Net Income | 37.6% | 15.7% | - |
| Diluted EPS | 39.8% | 18.4% | - |
| FCF | 34.3% | 14.3% | - |
Source: Company SEC filings (10-K); figures per the FL model — see Appendix A.1–A.2. Ten-year CAGRs are shown as “—”: the FL model’s history window opens in FY2017, so no FY2015 base year exists from which to compute a full decade.
3.1B Income Statement — Analysis
sources Revenue story. The five-year record is not a smooth compounding curve; it is a stall and a recovery, and understanding the stall is the key to the current thesis. Revenue growth of 37.2% in FY2021 collapsed to -1.1% in FY2022 — the only revenue contraction in Meta’s public history — before reaccelerating to 15.7%, 21.9% and 22.2% across FY2023–FY2025. The FY2022 trough was the product of three simultaneous shocks: Apple’s iOS privacy changes stripping ad-targeting signal, TikTok pulling engagement from younger users, and a cyclical pullback in advertiser budgets. What matters for the forward view is how Meta climbed out. Management attributes the FY2025 top line almost entirely to advertising, and to two components in roughly equal measure — more ad impressions delivered (led by Asia-Pacific, on higher users and engagement) and a higher average price per ad, the latter driven by improved AI-based targeting and measurement rather than by scarcity. This is the important distinction for an equity investor: Meta’s reacceleration is a productivity story — the same impressions monetized better through machine learning — not a price-gouging one that would invite churn. The online-commerce vertical was the single largest contributor to the increase. [Rating and price target withdrawn — see the note at the top.]
Margin trajectory. Gross margin held at 82.0% — a software-like level that reflects how little of Meta’s cost base sits in cost of revenue. The real operating story is one line down. EBIT margin was 41.4% in FY2025, essentially flat-to-slightly-down from 42.2% in FY2024, after a violent round trip: 39.6% in FY2021, a trough of 24.8% in FY2022 as costs ran ahead of a stalled top line, then a sharp recovery through the “year of efficiency” to 42.2%. The FY2025 fractional compression is the first tell of the structural pressure that dominates the forward case: infrastructure and compensation costs are rising faster than the useful-life-extension tailwind (below) can offset, and Reality Labs continues to widen its drag. EBITDA grew 20.0% on the year — operating momentum is intact — but the operating margin has stopped expanding, and investors should not extrapolate the FY2021–FY2024 margin-recovery slope into future years.
The reported earnings line is misleading this year — read it with care. Here is the fact that reframes the entire income statement: net income fell to $60,458.0M in FY2025 from $62,360.0M in FY2024 — a decline of -3.1% — even as EBIT rose from $69,380.0M to $83,276.0M and pre-tax income rose from $70,663.0M to $85,932.0M. The entire disconnect sits in tax. [Rating and price target withdrawn — see the note at the top.] [Forensic RED flag F001.] The driver is a one-time, largely non-cash charge — chiefly a valuation allowance recorded against U.S. federal deferred tax assets following mid-2025 U.S. tax legislation. [Rating and price target withdrawn — see the note at the top.] The interpretive consequence is unambiguous: reported FY2025 net income and the $23.49 diluted EPS materially understate underlying earnings, and the year-over-year decline is an accounting event, not an operating one. Any valuation, comparison or trend line built on the GAAP earnings line without normalizing for this distortion will be wrong. On a normalized-tax basis, earnings grew strongly in line with pre-tax income.
Major movers.
-
Advertising demand and price (structural). The swing factor in revenue and therefore in the whole model. FY2025 growth of 22.2% came from impressions plus average price, both compounding off AI targeting improvements. This is the most durable driver in the business and the one that funds everything else — but it is exposed to the regulatory/platform signal-loss headwinds management explicitly says will persist.
-
The OBBBA tax charge (temporary). Discussed above. It is the reason net margin fell to 30.1% from 37.9% — a collapse that has nothing to do with operations and everything to do with a deferred-tax valuation allowance. Non-recurring by management’s own account.
-
Server/network useful-life extension (temporary, earnings-flattering). [Forensic RED flag F002.] In January 2025 Meta extended the estimated useful lives of most servers and network assets. [Rating and price target withdrawn — see the note at the top.] The direction of the assumption is aggressive at precisely the wrong moment — in a frontier-AI hardware race, accelerator generations turn over faster, arguing for shorter, not longer, asset lives. Extending lives while capital spending is exploding front-loads reported profit and defers depreciation into future years, compounding the depreciation wall discussed in 3.3B. This is the second consecutive year of life lengthening, and it should be treated as a quality reduction to FY2025 earnings and stress-tested on a shorter-life assumption.
-
Reality Labs drag (structural, deliberate). [Forensic RED flag F006.] The consolidated EBIT margin of 41.4% badly understates the profitability of the core franchise, because it nets a large and widening Reality Labs operating loss against a Family of Apps advertising business that earns a segment operating margin far above the consolidated level. RL’s loss was wider again in FY2025 than in either of the two prior years, on segment revenue that remains a rounding error against its cost base, and management guides the FY2026 loss to remain similar. Stripped of RL, the underlying advertising engine is materially more profitable than the blended figure suggests; RL is best understood as a large, open-ended, profit-funded option on a next computing platform with no visible path to breakeven. The clean point, noted by the forensic review, is that segment definitions were unchanged year-over-year — there is no re-cut to disguise the loss.
-
G&A optics and below-the-line income (temporary/quality). [Forensic YELLOW flags F011, F009.] Two smaller distortions bracket the operating line. Above it, G&A growth looks worse than it is: the prior year was flattered by the release of a legal accrual that did not recur in FY2025, exaggerating the reported year-over-year cost increase; the underlying G&A trajectory is smoother than the headline. [Rating and price target withdrawn — see the note at the top.]
Quality of earnings — net assessment. The paradox of FY2025 is that GAAP earnings are simultaneously understated (by the one-time tax charge) and, at a finer grain, flattered (by the useful-life extension and by non-cash investment gains). The two are not the same size — the tax distortion dominates by an order of magnitude — so on balance reported EPS understates economic earnings. But the right treatment is to normalize both directions: add back the one-time tax charge, and haircut for the depreciation-estimate benefit and the unrealized investment gains. A genuine positive underpins all of this: Meta presents no SBC-excluding or otherwise adjusted EPS/EBITDA measure, so headline GAAP earnings are not inflated by aggressive add-backs — the ~$20,427.0M of share-based compensation is fully expensed in the numbers above (see 3.3B). The auditor issued a clean, unqualified opinion with effective internal controls and no going-concern language.
⚠ Items to Watch. [Rating and price target withdrawn — see the note at the top.] [Rating and price target withdrawn — see the note at the top.] - If revenue growth decelerates below 15.7%, the demand-side offset to the rising fixed-cost base weakens materially, and the depreciation wall (3.3B) begins to bite margins directly.
3.2A Balance Sheet
Source: Meta Platforms FY2025 Form 10-K, Consolidated Balance Sheets; figures per the FL model — see Appendix A.1–A.2. Inventory is shown as “—”: Meta does not report a separate inventory line, carrying its modest hardware inventory within prepaid expenses and other current assets.
3.2B Balance Sheet — Analysis
sources Asset composition — the balance sheet is transforming in real time. Meta has historically been a cash-rich, asset-light franchise. It is becoming a capital-intensive one in front of our eyes. Total assets expanded from $276,054.0M to $366,021.0M in a single year, and the driver is property and equipment, which rose from $121,346.0M to $176,400.0M — data centers, servers and network infrastructure for the AI build. PP&E is now the dominant asset on the balance sheet, displacing the cash-and-securities character of prior years. Goodwill, at $24,534.0M, remains small relative to equity of $217,243.0M and shows no impairment — Meta is a builder, not a serial acquirer, and its book is not stuffed with acquisition premia. The critical analytical point is that a large fraction of the placed-in-service PP&E has not yet begun depreciating: the balance sheet shows the assets, but the income statement has not yet absorbed their cost. That timing gap is the depreciation wall, quantified in 3.3B.
Leverage — a deliberate shift from a net-cash model to modest, opportunistic leverage. [Forensic YELLOW flag F014.] For most of its history Meta ran with little or no debt. [Rating and price target withdrawn — see the note at the top.] On a cash-and-equivalents-only basis, Meta swung from a net-cash position of -$15,063.0M in FY2024 to net debt of $22,871.0M in FY2025 — but this overstates the shift, because it excludes Meta’s substantial marketable-securities portfolio, which is not captured in the cash line; counting those securities, the company remains close to net-neutral. The leverage that exists is trivial by any credit standard: Net Debt/EBITDA of 0.2x and Debt/Equity of 0.3x. The notes carry no financial covenants and there is no near-term maturity wall. [Rating and price target withdrawn — see the note at the top.]
The reported balance sheet understates true forward commitments — this is the most important caveat in the section. [Forensic RED flags F004, F005.] Meta’s on-balance-sheet debt of $58,744.0M is not a complete picture of its economic obligations. In October 2025 Meta entered a co-development arrangement for a Louisiana data-center campus structured as a non-consolidated variable interest entity — it holds a minority interest, concluded it is not the primary beneficiary, and keeps the vehicle off its balance sheet despite carrying tens of billions of dollars of maximum loss exposure through funding commitments, residual-value guarantees and future leases. This was one of the auditor’s three Critical Audit Matters, precisely because the non-consolidation judgment is difficult. Beyond the VIE, Meta discloses very large non-cancelable contractual commitments, a further large tranche of leases that have not yet commenced and are therefore not yet on the balance sheet, and multi-year clean-energy purchase agreements that carry no fixed volume commitment and are therefore unquantified. In aggregate, these contracted and committed future outflows materially exceed reported debt. For leverage, invested-capital and solvency analysis, the reported balance sheet should be read as a floor on Meta’s true infrastructure obligations, not a full measure — and the fixed-cost base they imply becomes a real risk if AI monetization disappoints.
Working capital and receivables — clean. There is no working-capital red flag. Receivables grew to $19,769.0M, a slower pace than the 22.2% revenue increase — receivables are not outpacing sales, which rules out the channel-stuffing / aggressive revenue-recognition signal that a faster receivables build would raise. Inventory is immaterial and not separately disclosed. The current ratio of 2.6x is comfortable. Liquidity is a non-issue at the reported level; the only liquidity question worth asking is the off-balance-sheet one above.
⚠ Items to Watch. - A sustained rise in Net Debt/EBITDA well above the current 0.2x — particularly if driven by further debt issuance to fund capital returns rather than assets — would mark the point at which the “opportunistic, net-neutral” leverage story becomes a genuine balance-sheet story. - Any change in facts that made Meta the primary beneficiary of the Louisiana VIE would force consolidation of billions of development obligations and associated debt onto the balance sheet — a discrete, mechanical increase in reported leverage. - Receivables growth accelerating above revenue growth of 22.2% would be the first quantitative earnings-quality trigger to watch.
3.3A Cash Flow Statement
| FY2021 | FY2022 | FY2023 | FY2024 | FY2025 | |
|---|---|---|---|---|---|
| Cash from Operations ($M) | $57,683.0M | $50,475.0M | $71,113.0M | $91,328.0M | $115,800.0M |
| — Depreciation & Amortization ($M) | $7,967.0M | $8,686.0M | $11,178.0M | $15,498.0M | $18,616.0M |
| Capital Expenditures ($M) | $18,567.0M | $31,431.0M | $27,266.0M | $37,256.0M | $69,691.0M |
| Free Cash Flow ($M) | $39,116.0M | $19,044.0M | $43,847.0M | $54,072.0M | $46,109.0M |
| FCF Margin | 33.2% | 16.3% | 32.5% | 32.9% | 22.9% |
| FCF / Share | $13.68 | $7.05 | $16.68 | $20.69 | $17.91 |
| FCF Conversion (FCF/NI) | 99.4% | 82.1% | 112.1% | 86.7% | 76.3% |
| CapEx / Revenue | 15.7% | 27.0% | 20.2% | 22.6% | 34.7% |
| CapEx / D&A | 2.3x | 3.6x | 2.4x | 2.4x | 3.7x |
| Dividends Paid ($M) | — | — | — | $5,072.0M | $5,324.0M |
| Share Repurchases ($M) | $44,537.0M | $27,956.0M | $19,774.0M | $30,125.0M | $26,248.0M |
Source: Meta Platforms FY2025 Form 10-K, Consolidated Statements of Cash Flows; free cash flow and per-share/conversion ratios per the FL model — see Appendix A.1–A.2.
3.3B Cash Flow — Analysis
sources Operating cash flow is at a record — and its quality needs a caveat this year. OCF reached $115,800.0M in FY2025, a genuine high. But the FY2025 OCF is inflated by a large non-cash deferred-tax add-back — the mirror image of the one-time book tax charge in 3.1B. [Rating and price target withdrawn — see the note at the top.] The practical instruction is the one the forensic review reaches independently: do not treat this year’s OCF as the clean measure of cash generation — use free cash flow.
Free cash flow is where the AI build shows up, and it is falling despite record OCF. [Forensic RED flag F003.] This is the single most important number movement in the section. FCF declined to $46,109.0M in FY2025 from $54,072.0M in FY2024, and FCF margin compressed from 32.9% to 22.9% — even though OCF hit a record. The reason is capital expenditure, which nearly doubled from $37,256.0M to $69,691.0M, lifting capex/revenue to 34.7%. FCF conversion fell to 76.3% of net income. A company generating record operating cash while free cash flow shrinks is, by definition, consuming the difference in the ground — here, in data centers and AI compute. FCF is the honest scorecard of the AI wager, and it is deteriorating fast; management has guided capex materially higher again for FY2026, which means FCF is likely to compress further before the investment cycle matures.
The depreciation wall — capex is running far ahead of the cost the income statement recognizes. Capex/D&A reached 3.7x in FY2025 — Meta is spending nearly four dollars of capital for every dollar of depreciation it books. D&A recognized was only $18,616.0M against capex of $69,691.0M. A ratio far above 1.0x always signals aggressive growth investment rather than harvest, but the size of the gap here is the point: the assets are being placed in service faster than they are being depreciated, so depreciation must ramp sharply for years as construction-in-progress comes online. This is a structural headwind to future operating margin that current earnings do not yet reflect — and the useful-life extension in 3.1B delays, but does not eliminate, that wall. For modeling purposes, the FY2025 operating margin cannot be extrapolated; a multi-year D&A step-up has to be built in.
Capital allocation — a franchise funding three claims on one shrinking free-cash pool. Over the five-year window Meta has directed the overwhelming majority of returned capital to buybacks, which retired shares in size and drove the diluted share count down even against heavy RSU issuance; FY2025 repurchases were $26,248.0M. [Rating and price target withdrawn — see the note at the top.] The tension is now visible in the arithmetic: capex of $69,691.0M plus capital returns of roughly $26,248.0M in buybacks and $5,324.0M in dividends, set against free cash flow of only $46,109.0M, is what pushed Meta to issue debt in November 2025. The mix still fits the opportunity set — reinvestment dominates, as it should for a business earning the returns shown in 3.4 — but the days of funding record capex, record buybacks and a growing dividend entirely out of free cash flow are over. A related nuance on the buyback: with share-based compensation of $20,427.0M (up from $9,164.0M at the start of the window) and a large associated tax-withholding cash outlay on net-share settlement, a meaningful portion of the repurchase spend functions as a dilution offset rather than pure per-share accretion. [Forensic YELLOW flag F013.] SBC is a real and rising economic cost, fully expensed in the earnings above, and — creditably — not add-back-adjusted out of any non-GAAP headline.
⚠ Items to Watch. - If FCF conversion falls further below 76.3% while capex continues to climb, the gap between capital commitments and internally generated cash widens, implying more debt issuance to sustain the current pace of capital returns. - If capex/D&A stays near or above 3.7x for another two to three years without a commensurate rise in advertising revenue, the eventual depreciation catch-up will compress operating margin sharply and mechanically. - A cut or pause to the buyback would be the clearest early signal that management sees the capex/FCF squeeze as binding rather than transitory.
3.4 Returns Analysis
| FY2021 | FY2022 | FY2023 | FY2024 | FY2025 | |
|---|---|---|---|---|---|
| ROIC | 35.6% | 20.3% | 30.8% | 41.2% | 28.7% |
| ROE | 31.1% | 18.5% | 28.0% | 37.1% | 30.2% |
| ROA | 24.2% | 13.2% | 18.8% | 24.7% | 18.8% |
| Interest Coverage | 3116.9x | 180.9x | 111.3x | 97.0x | 76.4x |
Source: Company SEC filings (10-K); figures per the FL model — see Appendix A.1–A.2.
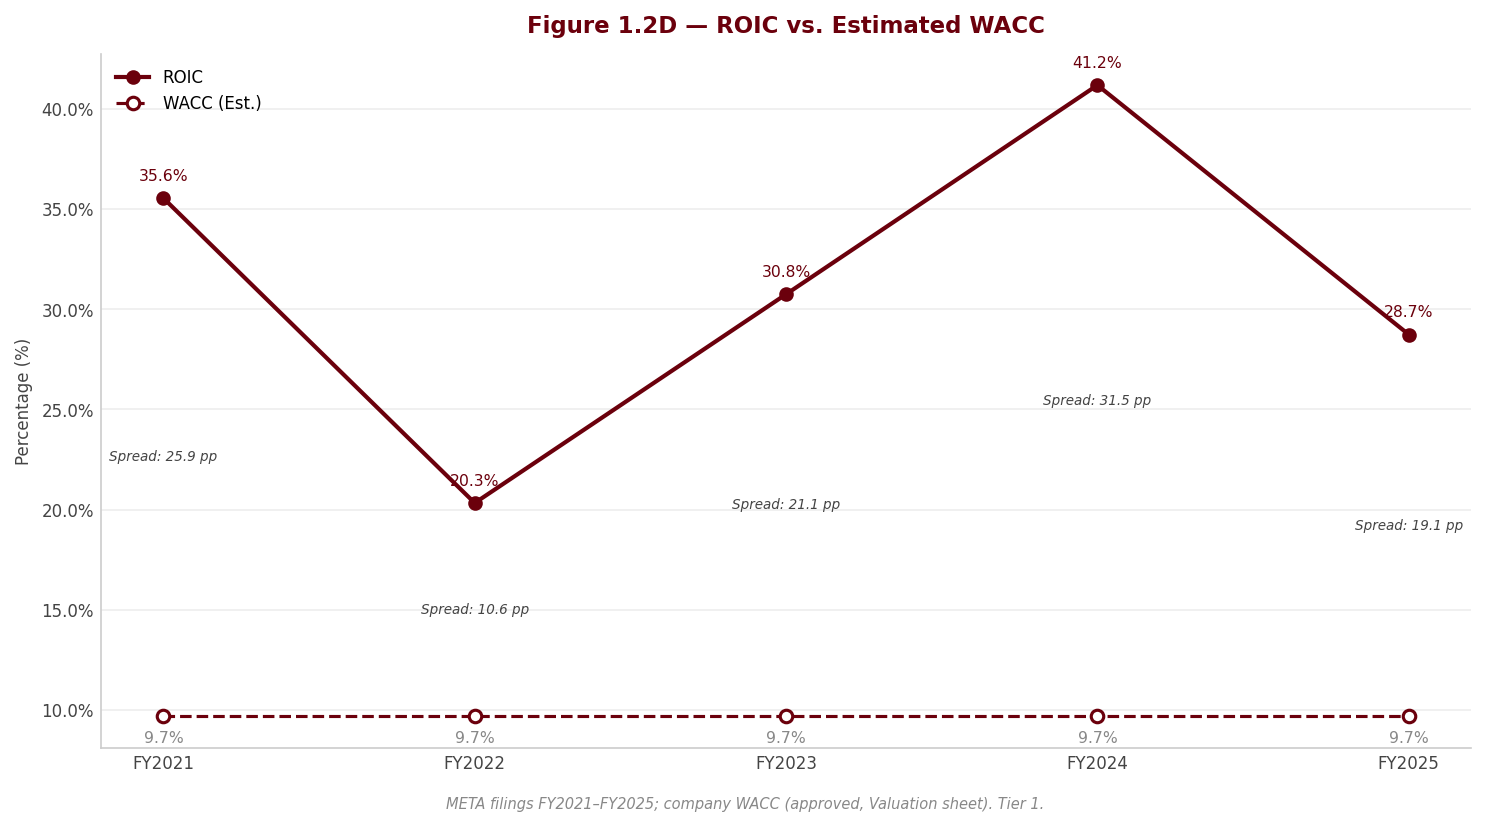
ROIC — the number that ultimately justifies the capex, and it clears the bar with room to spare. ROIC was 28.7% in FY2025. That figure is depressed by the same one-time tax charge that hit net income — NOPAT is computed on the inflated FY2025 tax — so the underlying return on capital is higher than the reported 28.7% and closer to the 41.2% recorded in FY2024. Either way, ROIC sits far above any reasonable estimate of Meta’s cost of capital (the WACC; against a mid-single-digit-to-low-double-digit hurdle, a high-twenties-to-forty-percent ROIC is a wide positive spread). The five-year path tells the operating story cleanly: 35.6% in FY2021, a trough of 20.3% in FY2022 as the ad recession and cost overexpansion collided, then recovery to 30.8% and 41.2%. The forward question — the one that decides the investment case — is whether ROIC can stay above the cost of capital as the invested-capital denominator balloons with the AI build and the depreciation wall lands on NOPAT. As long as the incremental capital earns above WACC, the spending compounds value; the risk case (developed in Section 2) is that AI monetization disappoints and returns on the newest, largest vintage of capital fall toward or below the hurdle. That is the central tension of the stock.
DuPont decomposition — profitability, not leverage, drives the return, and margin is the FY2025 swing. Decomposing ROE of 30.2% into its three levers: net margin of 30.1%, asset turnover of 0.63x (computed on average assets, per the DuPont convention — the period-end asset-turnover figure used in the Section 5 benchmarking is slightly lower), and an equity multiplier of 1.61x. The read is unambiguous. Meta’s ROE is earned, not levered: the equity multiplier of 1.61x is low — this is a lightly-levered balance sheet — so the return is overwhelmingly a function of net margin. Asset turnover of 0.63x is modest and is falling as the asset-heavy AI build swells the denominator, which is a structural headwind to ROE that reinvestment will keep pressing. The swing factor in FY2025 specifically was net margin, which the one-time tax charge pulled down from the prior-year level; normalize the tax and the margin lever — and therefore ROE — steps back up. The strategic implication: Meta cannot lean on leverage to defend ROE (it has little), and asset turnover is working against it as capital intensity rises, so the entire return structure rests on defending advertising net margin. That is where the analytical attention belongs.
Interest coverage — enormous, and still enormous after doubling the debt. Coverage was 76.4x in FY2025. It has fallen from 3116.9x in FY2021 purely because Meta added debt to a previously near-debt-free balance sheet — this is the arithmetic of a rising denominator, not any weakening of earnings. At 76.4x, interest is a non-event for credit; the balance-sheet risk in this story is the off-balance-sheet commitment stack (3.2B), not the serviceability of the on-balance-sheet notes.
3.5 Altman Z-Score (Most Recent FY)
| Component | FY2023 | FY2024 | FY2025 |
|---|---|---|---|
| X1 (Working Capital / Total Assets) | 0.233 | 0.241 | 0.183 |
| X2 (Retained Earnings / Total Assets) | 0.357 | 0.371 | 0.331 |
| X3 (EBIT / Total Assets) | 0.204 | 0.251 | 0.228 |
| X4 (Equity / Total Liabilities) | 2.003 | 1.955 | 1.460 |
| X5 (Revenue / Total Assets) | 0.587 | 0.596 | 0.549 |
| Z-Score | 2.53 | 2.68 | 2.28 |
| Zone | Gray | Gray | Gray |
Source: Company SEC filings (10-K); figures per the FL model — see Appendix A.1–A.2.
Interpretation — a gray-zone reading that is a model artifact, not a credit signal. Under the Z′ model computed here (safe above 2.90, distress below 1.23), all three recent years sit in the gray band, and the score slipped further from 2.68 in FY2024 to 2.28 in FY2025. I will not soften the classification — the level is gray and the direction is down — but I will explain precisely why, because the mechanical drivers here are the fingerprints of the AI build, not of distress. Two of the five components fell for reasons that are unambiguously investment, not deterioration: X3 (EBIT/Total Assets) declined because the asset base surged with the data-center build while EBIT grew more slowly and was further held back by the tax-depressed profit environment; and X4 (Equity/Total Liabilities) fell because Meta doubled its debt and grew liabilities faster than equity. In other words, the Z-Score is being pulled down by a rapidly expanding, capex-inflated denominator and a deliberately levered-up liability base — the same two facts that the rest of this section frames as strategic choices, not weakness. The independent credit evidence flatly contradicts any distress read: Net Debt/EBITDA of 0.2x, interest coverage of 76.4x, ROIC of 28.7%, and a clean unqualified audit opinion. The correct conclusion is that the Altman model — built for industrial balance sheets — is registering Meta’s transformation into a capital-heavy business, and the trend is the thing to watch: if X3 keeps falling as the depreciation wall lands on EBIT and the asset base keeps swelling, the score will drift lower still, and at that point the gray reading becomes a genuine prompt to re-underwrite the return on the AI capital — not because Meta is anywhere near financial distress, but because the model is flagging, in its blunt way, exactly the capital-intensity question that dominates the forward thesis.
4. Valuation withdrawn
This section stated what the shares were worth and what to do about them. It rested on an exit multiple set by hand — across the coverage it averaged 24% below where each company actually traded — so the conclusion largely restated that assumption instead of testing it. Rather than leave it standing, it has been withdrawn while the method is rebuilt.
Nothing else in this report depends on it: the financial analysis above and below is drawn from the company's own filings, and every figure links to the page it was verified against.
Section 5 — Financial Metrics & Peer Benchmarking
5.1 Peer Selection
sources Meta occupies an unusual position in the public equity universe: it is one of only two Western advertising-led digital platforms operating at genuine hyperscale, and the second — Alphabet — is also its single most useful comparable. The peer set is therefore deliberately narrow rather than padded. We benchmark Meta against Alphabet Inc. (GOOGL) and Snap Inc. (SNAP), the two ends of the ad-supported-platform spectrum, and we are explicit about what each comparison can and cannot support.
Alphabet is the closest possible mega-cap comparable: an advertising-led revenue base, the same AI-datacenter capex cycle, a similar returns profile, and — critically — an identical December 31, 2025 US-GAAP fiscal year-end. This is the cleanest cross-company comparison available anywhere in the sector, with no currency, accounting-standard, or period lag. Snap sits at the opposite end: a pure-play social/advertising platform, but roughly one-thirty-fourth of Meta’s revenue and structurally loss-making. Snap is a directional read on the same ad model at the small, unprofitable end of the maturity curve — useful for growth, gross margin, R&D intensity and revenue-multiple context, but not a like-for-like profitability peer, because its operating loss and negative GAAP EBITDA render P/E, EV/EBITDA, EV/EBIT, net-debt/EBITDA and interest coverage not meaningful (detailed in 5.7).
The single most important framing point for this section — and the reason the caveats in 5.7 are not boilerplate — is that the FY2025 net-income line is distorted in opposite directions on the two mega-caps. [Rating and price target withdrawn — see the note at the top.] Any comparison built on P/E, net margin, ROE or ROA is therefore doubly misleading — Meta understated, Alphabet overstated. The clean read across the set is operating profitability (EBIT and EBITDA), and it is the anchor we return to throughout.
| Peer | Ticker | Exchange | Filing Type | Accounting Standard | Fiscal Year End | Comparability Note |
|---|---|---|---|---|---|---|
| Alphabet Inc. | GOOGL | NASDAQ | 10-K | US GAAP | December | Cleanest comparable; identical Dec-2025 year-end. Net-income metrics inflated by a non-operating securities gain — read profitability off EBIT/EBITDA. |
| Snap Inc. | SNAP | NYSE | 10-K | US GAAP | December | Directional read only; loss-making and ~1/34th of Meta’s revenue. P/E, EV/EBITDA and coverage not meaningful. |
Source: Peer-company SEC filings; comparability notes in 5.7 — see Appendix A.1.
5.2 Profitability Comparison
sources Comparative: Most Recent Full Fiscal Year (FY2025, Dec)
| Metric | Meta Platforms, Inc. | Alphabet Inc. | Snap Inc. |
|---|---|---|---|
| Revenue ($M) | $200,966.0M | $402,836.0M | $5,931.4M |
| Gross Margin | 82.0% | 59.7%ᶜ | 55.0%ᶜ |
| EBITDA Margin | 50.7% | 37.3% | —ⁿᵐ |
| EBIT Margin | 41.4% | 32.0% | -9.0% |
| Net Margin | 30.1%ᵗ | 32.8%ᵍ | -7.8% |
| FCF Margin | 22.9% | 18.2% | 7.4%ˢ |
Source: Peer-company SEC filings; comparability notes in 5.7 — see Appendix A.1.
Flag legend: ᶜ = computed from filing components (neither peer prints a gross-profit subtotal); ᵗ = depressed by Meta’s one-off FY2025 tax charge (net-income basis only); ᵍ = inflated by Alphabet’s non-operating securities gain (net-income basis only); ˢ = positive only because non-cash stock-based compensation is added back; ⁿᵐ = not meaningful — Snap’s GAAP EBITDA is negative (its headline “Adjusted EBITDA” is non-GAAP). All EBITDA figures are EBIT + D&A with no SBC add-back.
Meta carries the highest operating profitability in the set by a wide margin. Its EBIT margin of 41.4% sits well above Alphabet’s 32.0% and against a Snap operating loss of -9.0%; the EBITDA-margin gap is similar at 50.7% versus 37.3%. This is a genuine structural advantage, not an artifact: Meta’s software-defined ad platform converts a 82.0% gross margin — the widest in the group, well ahead of Alphabet’s 59.7%ᶜ, which is diluted by lower-margin cloud, hardware and traffic-acquisition costs — into best-in-class operating leverage even while absorbing the drag of a still-loss-making Reality Labs.
The net-margin row is where the reader must not take the numbers at face value. On reported net margin Alphabet (32.8%ᵍ) appears to edge past Meta (30.1%ᵗ) — an optical inversion of the operating reality. [Rating and price target withdrawn — see the note at the top.] On the clean operating basis Meta is decisively the more profitable business. Snap’s negative net margin (-7.8%) simply confirms it is not yet a profitability comparable.
Historical: Meta Platforms, Inc. Own 5-Year Progression
| Metric | FY2021 | FY2022 | FY2023 | FY2024 | FY2025 |
|---|---|---|---|---|---|
| Gross Margin | 80.8% | 78.3% | 80.8% | 81.7% | 82.0% |
| EBITDA Margin | 46.4% | 32.3% | 42.9% | 51.6% | 50.7% |
| EBIT Margin | 39.6% | 24.8% | 34.7% | 42.2% | 41.4% |
| Net Margin | 33.4% | 19.9% | 29.0% | 37.9% | 30.1% |
| FCF Margin | 33.2% | 16.3% | 32.5% | 32.9% | 22.9% |
Source: Peer-company SEC filings; comparability notes in 5.7 — see Appendix A.1.
Meta’s own history frames why the current margin is impressive. The EBIT margin collapsed to 24.8% in FY2022 as Reality Labs spending and a revenue-growth air-pocket collided; the 41.4% delivered in FY2025 is a near-full recovery toward the 39.6% pre-shock level, achieved while capex and R&D ran at record highs. Net margin (30.1%) is the one line that stepped down from FY2024’s 37.9% — but that reflects the one-off tax charge, not operating deterioration, and reconciles with the earnings-quality discussion in Section 3. FCF margin at 22.9% is well below the operating margin and below FY2024’s 32.9%, a direct consequence of the AI-capex surge rather than any weakening of cash conversion — the subject of 5.4 and 5.6.
5.3 Returns Comparison
Comparative: Most Recent Full Fiscal Year (FY2025, Dec)
| Metric | Meta Platforms, Inc. | Alphabet Inc. | Snap Inc. |
|---|---|---|---|
| ROIC | 28.7% | 24.9% | -11.1%ⁿᵐ |
| ROE | 30.2%ᵗ | 35.7%ᵍ | -19.5%ⁿᵐ |
| ROA | 18.8%ᵗ | 25.3%ᵍ | -5.9%ⁿᵐ |
| Asset Turnover | 0.55x | 0.77x | 0.76x |
Source: Peer-company SEC filings; comparability notes in 5.7 — see Appendix A.1.
Flag legend: ᵗ = depressed by Meta’s one-off FY2025 tax charge; ᵍ = inflated by Alphabet’s non-operating securities gain; ⁿᵐ = not meaningful — Snap is operating-loss-making, so its returns are negative and undefined on an after-tax basis.
On invested capital Meta and Alphabet are, once methodology is aligned, essentially tied: Meta earns ROIC of 28.7% against Alphabet’s 24.9%, both a very wide spread over the 9.68% cost of capital. [Rating and price target withdrawn — see the note at the top.]
The ROE and ROA rows are again distorted in opposite directions and should not be read literally. Alphabet’s ROE (35.7%ᵍ) and ROA (25.3%ᵍ) are flattered by the securities gain running through net income; Meta’s (30.2%ᵗ, 18.8%ᵗ) are suppressed by the tax charge. Meta’s lower asset turnover (0.55x versus Alphabet’s 0.77x) is the one genuine structural difference here — but it is a function of Meta’s heavier data-center asset base and large financial-asset holdings, not weaker commercial execution; it is asset intensity, not asset inefficiency, and it is precisely what the record capex programme is building.
Historical: Meta Platforms, Inc. Own 5-Year Progression
| Metric | FY2021 | FY2022 | FY2023 | FY2024 | FY2025 |
|---|---|---|---|---|---|
| ROIC | 35.6% | 20.3% | 30.8% | 41.2% | 28.7% |
| ROE | 31.1% | 18.5% | 28.0% | 37.1% | 30.2% |
| ROA | 24.2% | 13.2% | 18.8% | 24.7% | 18.8% |
Source: Peer-company SEC filings; comparability notes in 5.7 — see Appendix A.1.
Meta’s returns troughed in FY2022 (ROIC 20.3%, ROE 18.5%) and rebuilt to a FY2024 peak (ROIC 41.2%, ROE 37.1%). The FY2025 step-down to ROIC 28.7% and ROE 30.2% is, once more, the tax artifact rather than fading economics — the underlying operating returns remain firmly in the top tier of large-cap technology and comfortably value-accretive against the cost of capital.
5.4 Leverage & Liquidity Comparison
Comparative: Most Recent Full Fiscal Year (FY2025, Dec)
| Metric | Meta Platforms, Inc. | Alphabet Inc. | Snap Inc. |
|---|---|---|---|
| Net Debt / EBITDA | 0.2x | -0.5x | —ⁿᵐ |
| Total Debt / Equity | 0.3x | 0.1x | 1.6x |
| Interest Coverage | 76.4x | 175.3x | —ⁿᵐ |
| Current Ratio | 2.6x | 2.0x | 3.6x |
| FCF Margin | 22.9% | 18.2% | 7.4%ˢ |
Source: Peer-company SEC filings; comparability notes in 5.7 — see Appendix A.1.
Flag legend: ˢ = positive only because non-cash SBC is added back; ⁿᵐ = not meaningful — Snap’s negative GAAP EBITDA and operating loss make net-debt/EBITDA and interest coverage undefined.
Both mega-caps run effectively unlevered balance sheets. Meta sits at a fractional 0.2x net-debt/EBITDA and 0.3x debt/equity, while Alphabet remains in a net-cash position (-0.5x) at 0.1x debt/equity. The meaningful nuance is directional: Meta has shifted from net cash toward a modest net-debt position in FY2025 as it began funding the capex programme with issued debt — a deliberate, low-risk use of a pristine balance sheet rather than a solvency concern. Interest coverage at 76.4x (Meta) and 175.3x (Alphabet) is so high as to be immaterial; both cover interest many dozens of times over. Snap, by contrast, is the only name carrying real relative leverage (1.6x debt/equity, convertible-note-driven), and its coverage and net-debt/EBITDA are not meaningful against an operating loss.
Liquidity is ample everywhere — current ratios of 2.6x (Meta), 2.0x (Alphabet) and 3.6x (Snap). The binding constraint on Meta’s capital structure is not leverage capacity but the FCF drawdown from capex: its 22.9% FCF margin, though ahead of Alphabet’s 18.2%, is running far below its operating margin because of the AI build — a strategic choice, not a balance-sheet weakness, and one Meta’s cash generation can comfortably absorb.
5.5 Valuation Multiples Comparison
sources Comparative: Current Price (FY2025 basis)
| Metric | Meta Platforms, Inc. | Alphabet Inc. | Snap Inc. |
|---|---|---|---|
| EV/EBITDA | 13.8xᵐ | 28.5xᵐ | —ⁿᵐ |
| P/E | 23.1xᵐᵗ | 33.0xᵐᵍ | —ⁿᵐ |
| FCF Yield | 3.3%ᵐ | 1.7%ᵐ | 5.6%ᵐˢ |
Source: Peer-company SEC filings; comparability notes in 5.7 — see Appendix A.1.
All peer valuation multiples are market-sourced and move with price. Flag legend: ᵐ = market-sourced; ᵗ = Meta’s P/E is on tax-depressed earnings (understates cheapness); ᵍ = Alphabet’s P/E is on securities-gain-inflated earnings (understates richness); ˢ = Snap’s FCF/yield depends on SBC add-back; ⁿᵐ = not meaningful — Snap’s net loss and negative GAAP EBITDA make P/E and EV/EBITDA undefined.
This is the section’s punchline. On the clean, capital-structure-neutral, tax-neutral metric — EV/EBITDA — Meta trades at 13.8x against Alphabet’s 28.5x, roughly half the multiple, despite Meta carrying the higher operating margin and a comparable return on capital. Meta’s own EV/EBIT of 16.9x tells the same story. There is no operating-quality justification for that discount; if anything the quality argument runs the other way.
The P/E comparison (23.1xᵗ Meta versus 33.0xᵍ Alphabet) understates the gap on both sides simultaneously — the exact trap 5.7 warns against. Meta’s earnings denominator is artificially small (tax charge), so its true earnings multiple is lower than 23.1x; Alphabet’s is artificially large (securities gain), so its true multiple is higher than 33.0x. Normalize both and the valuation dispersion widens further in Meta’s favour. Meta’s FCF yield (3.3%) screens richer than Alphabet’s (1.7%) but is temporarily suppressed by the capex cycle; Snap’s optically higher 5.6%ˢ rests entirely on adding back stock-based compensation and should be discounted accordingly.
Historical: Meta Platforms, Inc. EV/EBITDA (period-end price)
| FY2021 | FY2022 | FY2023 | FY2024 | FY2025 |
|---|---|---|---|---|
| 17.3x | 8.5x | 15.7x | 17.9x | 16.9x |
Source: Peer-company SEC filings; comparability notes in 5.7 — see Appendix A.1.
Against its own history Meta is not expensive. The FY2025 period-end EV/EBITDA of 16.9x is below the FY2024 17.9x and a fraction of the 17.3x carried in FY2021 — and only modestly above the FY2022 distress trough of 8.5x, when sentiment was at its worst. A business now growing revenue faster, with higher margins and a rebuilt returns profile, trades at a middling multiple by its own five-year range and a deep discount to its closest peer.
5.6 Efficiency Comparison
| Metric | Meta Platforms, Inc. | Alphabet Inc. | Snap Inc. |
|---|---|---|---|
| Days Sales Outstanding | 33 days | 57 days | 84 days |
| Days Inventory Outstanding | - | 0 days | 0 days |
| Days Payables Outstanding | 84 days | 27 days | 30 days |
| Cash Conversion Cycle | -50 days | 30 days | 54 days |
| CapEx / Revenue | 34.7% | 22.7% | 3.7% |
Source: Peer-company SEC filings; comparability notes in 5.7 — see Appendix A.1. Meta’s summary Cash Conversion Cycle is not carried in the model; its components (DSO, negligible inventory, DPO) imply a materially negative cycle — see commentary.
Meta runs the tightest working-capital position in the set. It collects in 33 days — faster than Alphabet’s 57 days and far quicker than Snap’s 84 days — while stretching payables to 84 days, well beyond both peers. With essentially no inventory (a software/advertising model), payables days materially exceed receivables days, so Meta’s effective cash conversion cycle is negative: suppliers finance the business, working capital is a source rather than a use of cash, and the cycle is structurally superior to Alphabet’s positive cycle of 30 days and Snap’s 54 days.
The one line where Meta screens “heaviest” is capital intensity. Capex ran at 34.7% of revenue in FY2025 versus Alphabet’s 22.7% and Snap’s asset-light 3.7%. This is not inefficiency — it is the deliberate AI-datacenter build-out, and it is the primary reason both mega-caps’ FCF margins sit below their operating margins (5.4). The reader should treat Meta’s elevated capex as a forward-looking growth investment whose returns are not yet in the FCF line, not as a structural cost disadvantage; Snap’s trivial capex reflects its scale and its outsourced-infrastructure model, not superior capital discipline.
5.7 Comparability Caveats
sources The comparison above is unusually clean on the mechanics and unusually treacherous on the optics. The mechanics first: all three companies report under US GAAP in USD with an identical December 31, 2025 fiscal year-end (note C005). There is no currency translation, no accounting-standard difference and no period lag — every difference in the tables reflects genuine business economics, not a calendar or accounting artifact. That is the ideal case, and it is why the caveats below are about earnings quality, not reconciliation.
The net-income line is distorted in opposite directions on the two mega-caps — this is the single most important caveat in the section (notes C003 and C004, both MATERIAL). Alphabet’s FY2025 net income is inflated by a large non-operating gain on debt and equity securities booked below the operating line; this lifts its net margin (to a level above its own EBIT margin), ROE, ROA and P/E, none of which reflect operating performance. [Rating and price target withdrawn — see the note at the top.] Read together, any net-income-based comparison is doubly misleading: Meta understated, Alphabet overstated. Every net-income metric in 5.2, 5.3 and 5.5 is flagged accordingly (ᵗ for Meta, ᵍ for Alphabet), and the correct anchor for both names is EBIT/EBITDA, on which Meta is clearly the more profitable and the cheaper business.
Snap is loss-making at every level except gross profit and SBC-driven free cash flow (note C001, MATERIAL). Its FY2025 operating loss, negative GAAP EBITDA and net loss make P/E, EV/EBITDA, EV/EBIT, net-debt/EBITDA and interest coverage not meaningful — they are shown as em dashes, never as misleading numbers, and its ROIC/ROE/ROA are negative. Only revenue growth, gross margin, R&D intensity and EV/Revenue support a like-for-like read; Snap is a directional signal on the ad-supported social model at ~1/34th of Meta’s scale, not a profitability peer.
Snap’s headline “Adjusted EBITDA” is non-GAAP and must not be confused with the figures used here (note C002, MATERIAL). Snap prominently reports a positive “Adjusted EBITDA” that adds back a substantial amount of stock-based compensation plus other items to its operating loss. This report uses GAAP EBITDA (operating income + D&A, no SBC add-back) for every company, on which Snap’s EBITDA is negative — consistent with how Meta’s and Alphabet’s EBITDA is built. Relatedly, Snap’s positive free cash flow and FCF yield (flagged ˢ) exist only because that same stock-based compensation is a non-cash add-back; they should be discounted, not taken as evidence of cash profitability.
Two further items are informational rather than distortive. Capital intensity has diverged sharply on AI infrastructure (note C006): Meta’s capex at 34.7% of revenue and Alphabet’s at 22.7% are both at record highs and are the key swing factor compressing FCF margins below operating margins — a strategic choice, not a comparability defect, and the reason the FCF and FCF-yield comparisons must be read as capex-cycle-depressed rather than structurally weak. Ratio methodology is applied uniformly (note C007): returns use average beginning-plus-ending balances; ROIC is after-tax EBIT over debt-plus-equity-less-cash (no tax adjustment for loss-making Snap); EBITDA excludes any SBC add-back; and interest coverage — immaterial for both net-cash mega-caps — uses a cash interest-paid proxy for Meta, which carries no interest-expense line on the face of its income statement. None of these methodology points changes the conclusions; they are disclosed so the exact construction of each ratio is auditable.
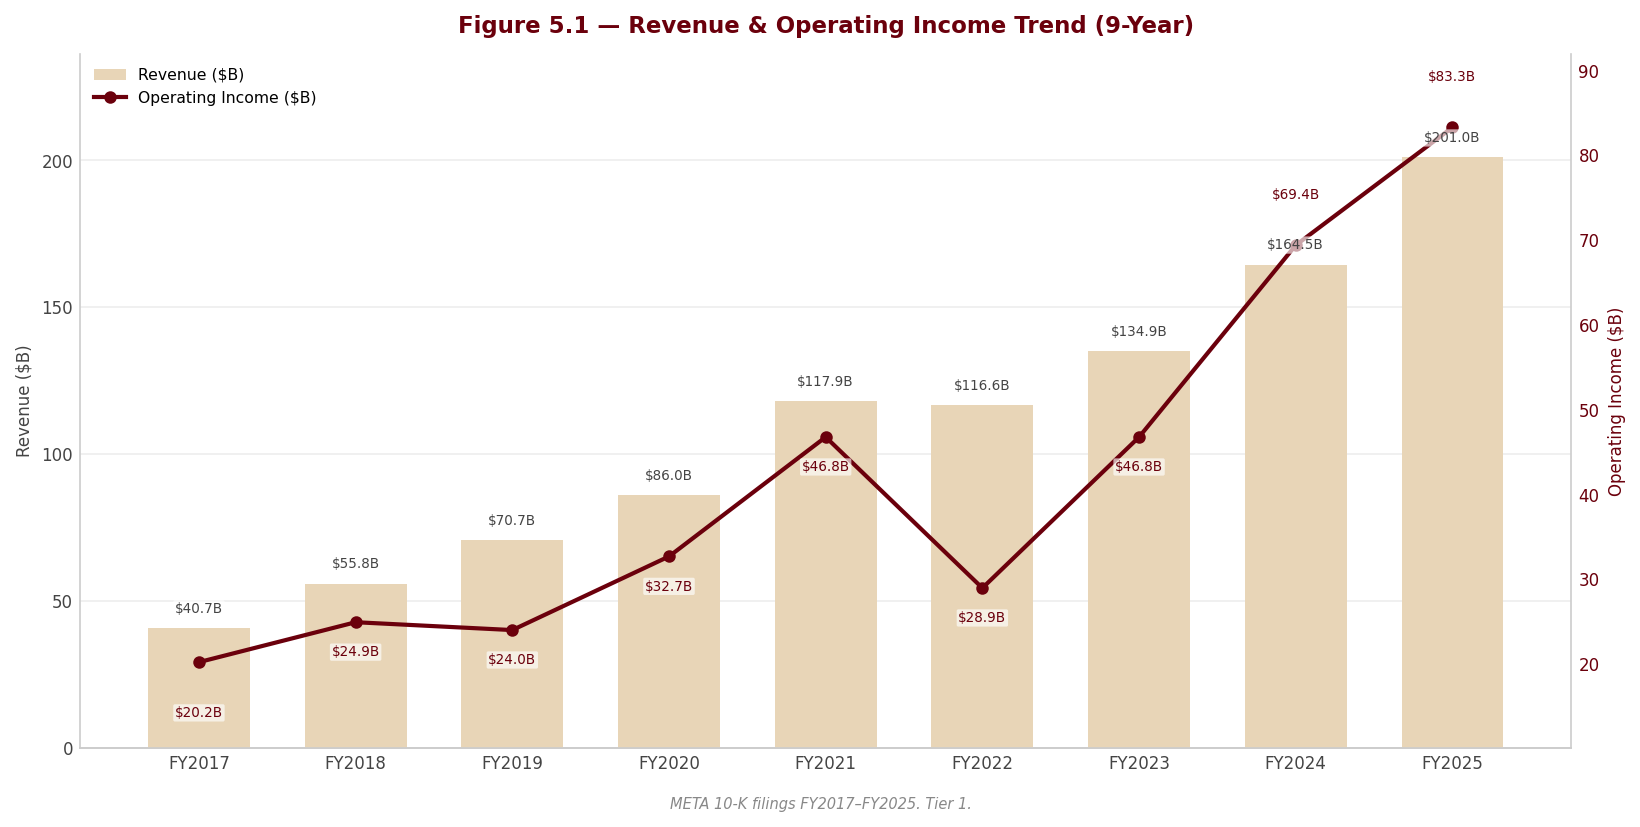
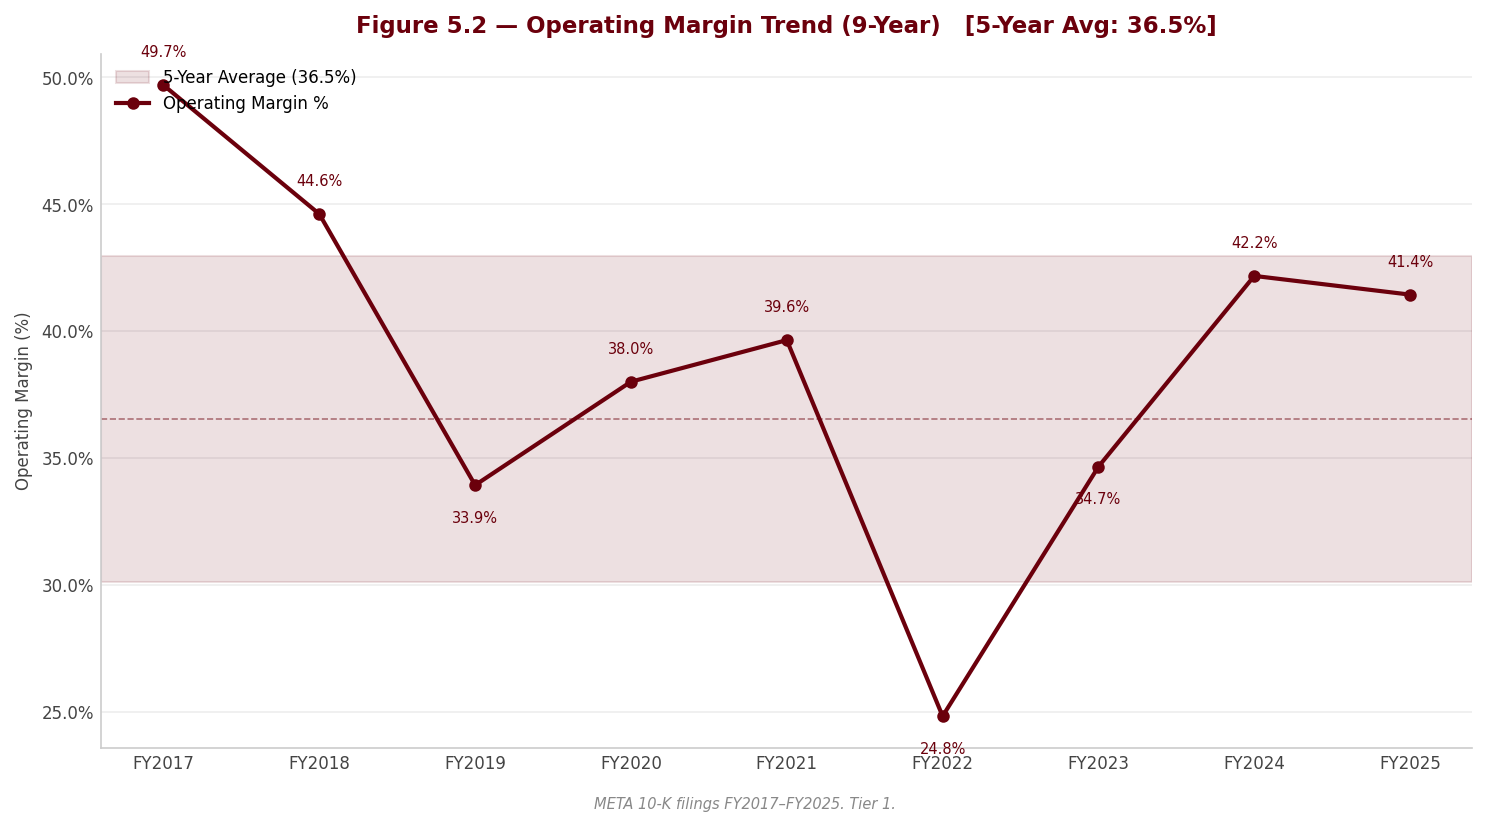
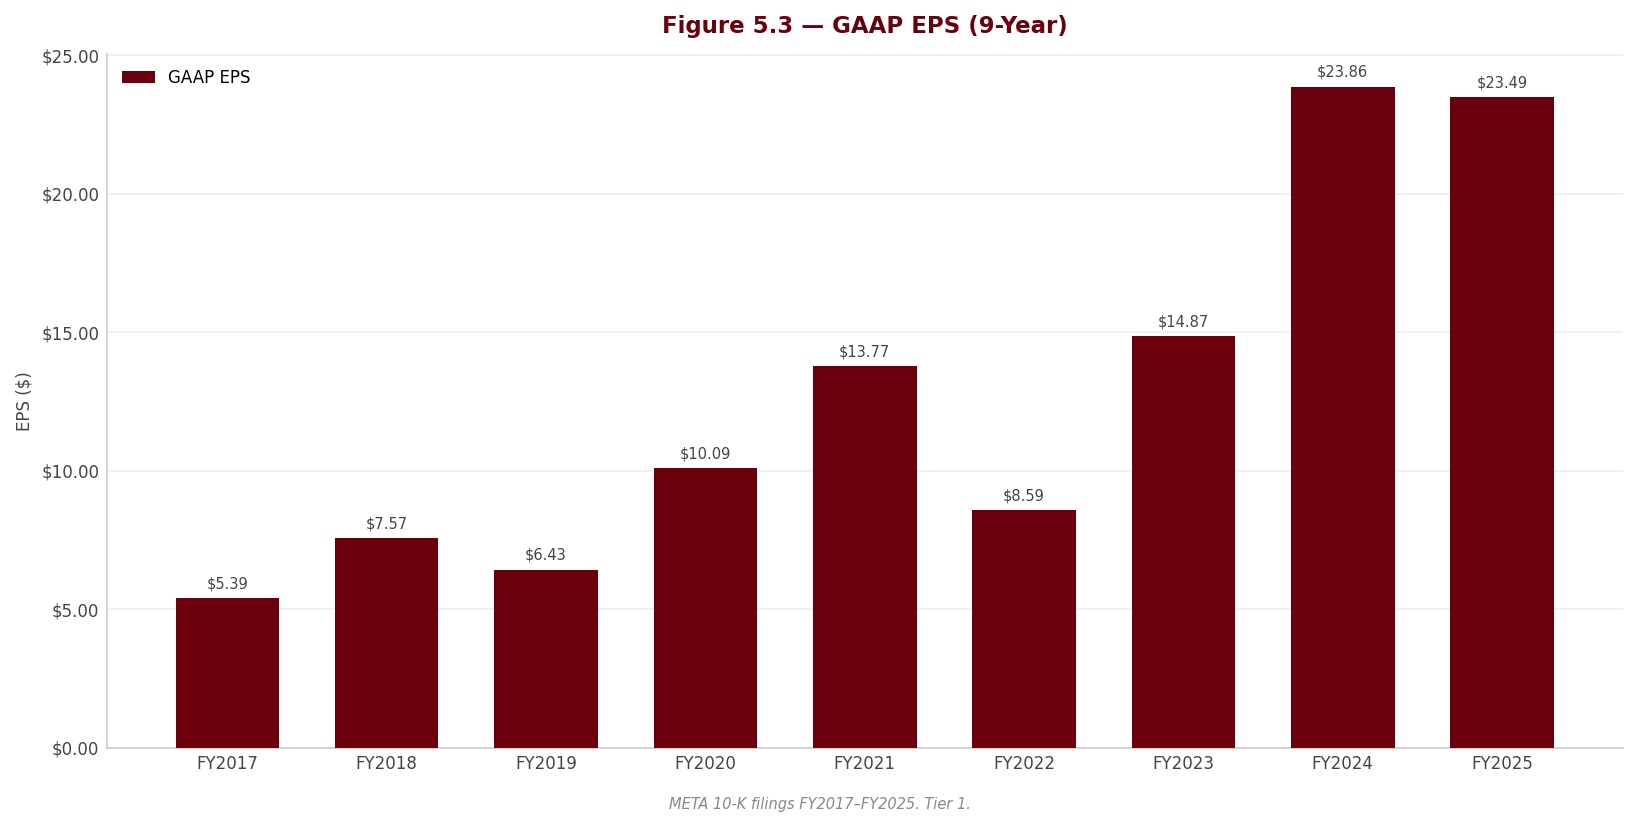
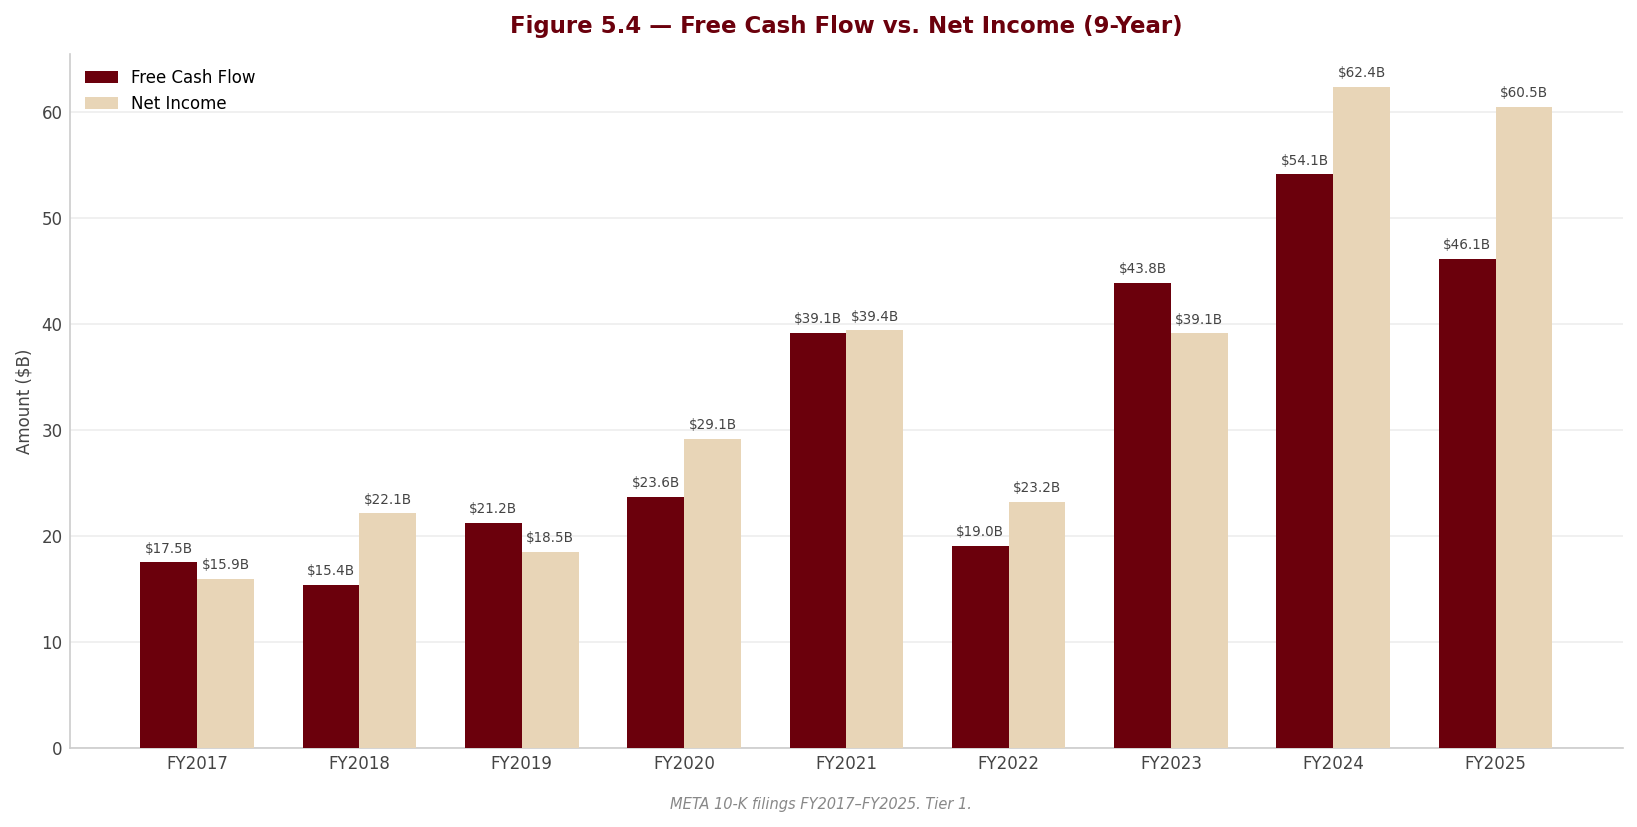
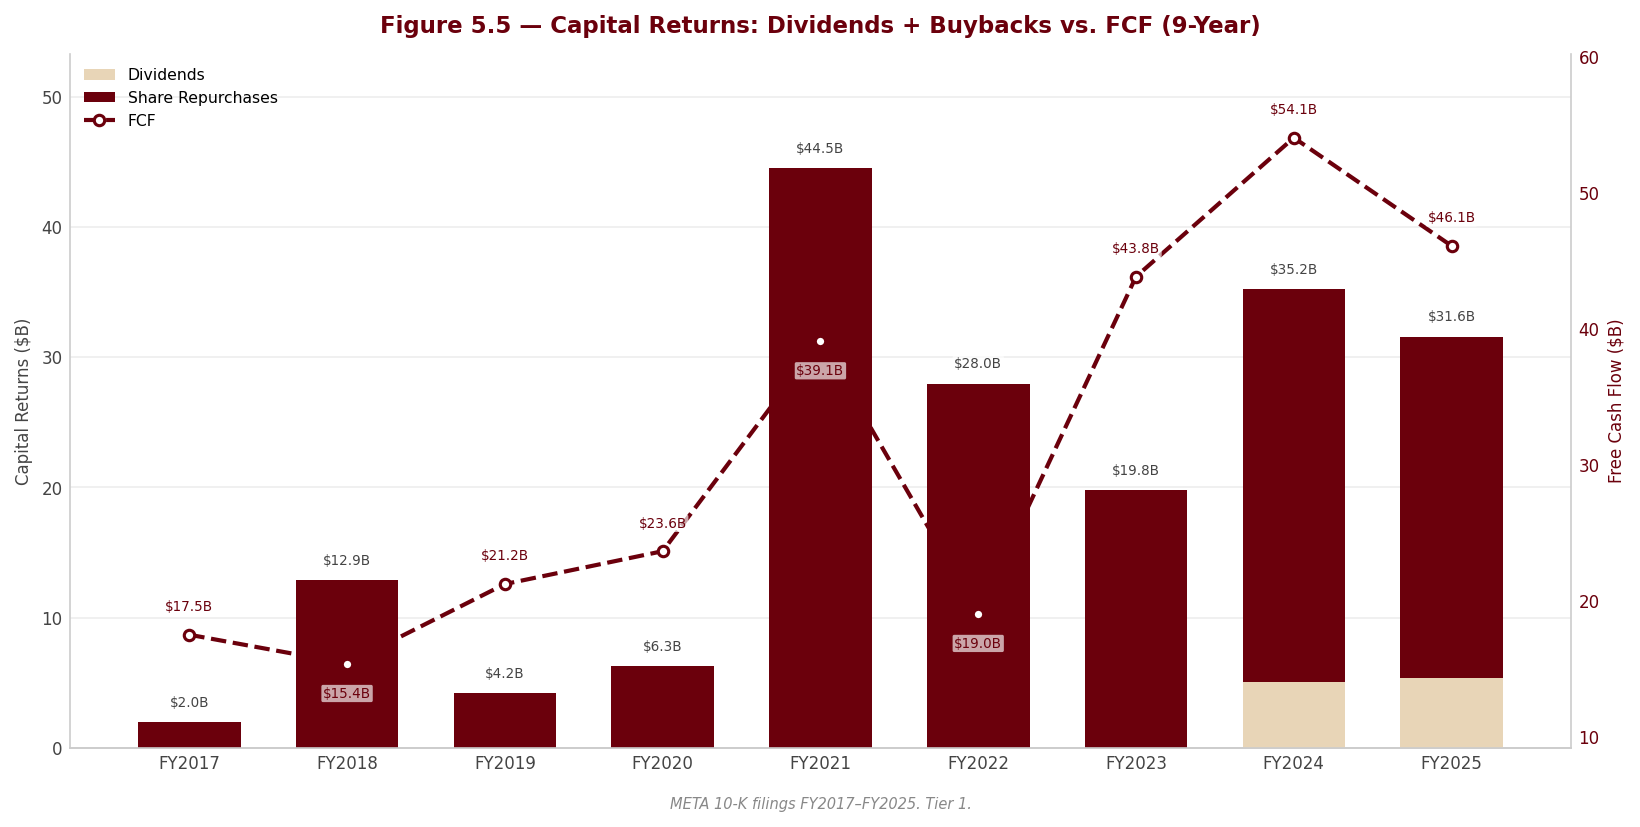
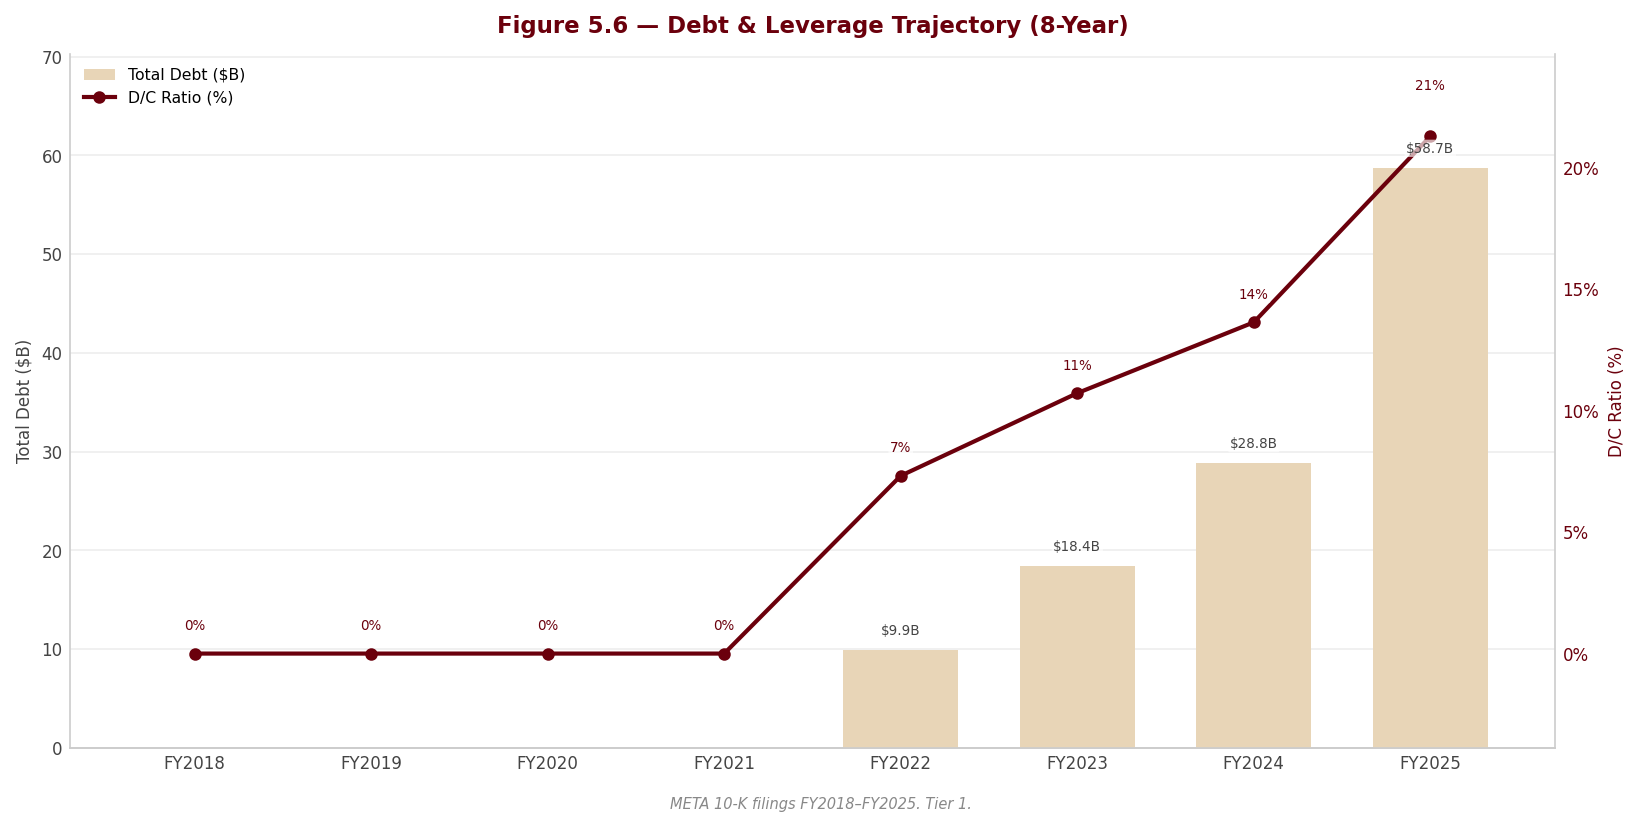
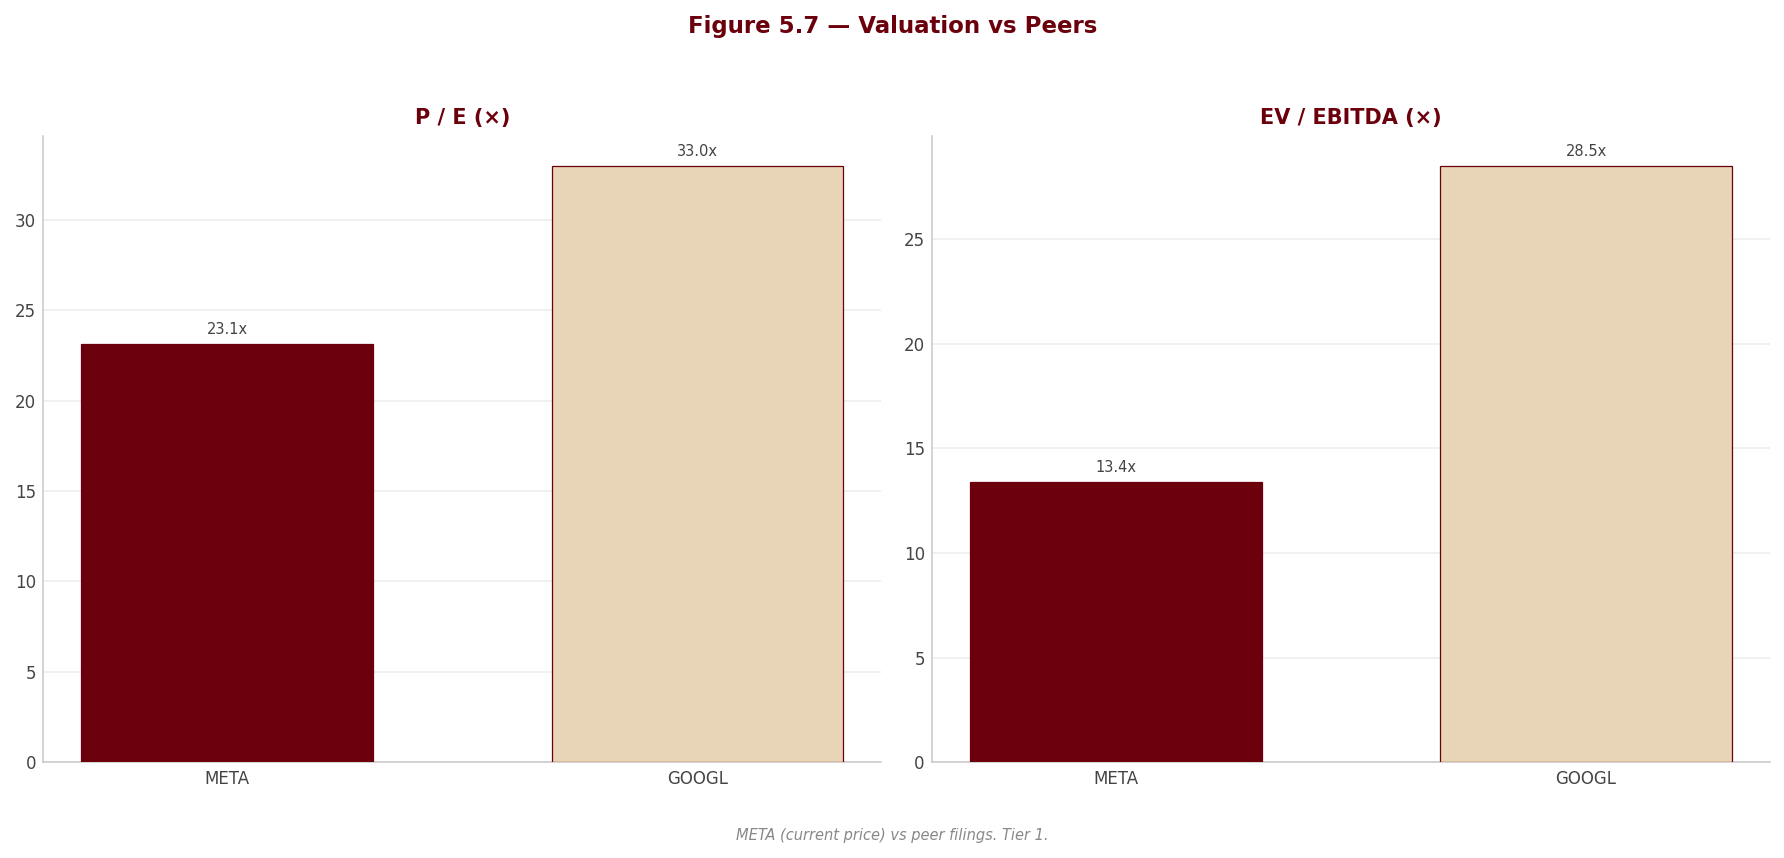
6. Valuation & Price Target withdrawn
This section stated what the shares were worth and what to do about them. It rested on an exit multiple set by hand — across the coverage it averaged 24% below where each company actually traded — so the conclusion largely restated that assumption instead of testing it. Rather than leave it standing, it has been withdrawn while the method is rebuilt.
Nothing else in this report depends on it: the financial analysis above and below is drawn from the company's own filings, and every figure links to the page it was verified against.
Section 7 — Quarterly Update: Q2 2026
Portfolio Action
[Rating and price target withdrawn — see the note at the top.]
| Assessment | |
|---|---|
| Action | [Rating and price target withdrawn — see the note at the top.] |
| Reason | Revenue grew +28.0% YoY to $60,801.0M on ad impressions +14% and price +12%, but operating income fell 8% to $18,775.0M and EBIT margin compressed to 30.9% (from 43.0%) as R&D rose 67% and capex hit $30,116.0M — the thesis’ deliberate AI-investment trade-off is playing out on schedule, not breaking. |
| Thesis intact? | PARTIALLY — the core Family-of-Apps ad engine strengthened (ARPP $16.86, +24% YoY; FoA revenue $60,370M), but the AI build is now visibly compressing margins and free cash flow (Q2 FCF ~$1.7bn vs $9.0bn a year ago), and the capital-allocation pivot flagged in the FY2025 10-K has arrived: zero buybacks in H1 2026 and +$25bn of new debt. |
| Trigger to revisit | FoA operating margin sustained below ~35% for two further quarters without a matching acceleration in ad revenue, OR 2026 capex realized above the raised $145bn ceiling with FCF still falling, OR a youth-litigation aggregate accrual step-up materially above the $15,848.0M quarterly earnings base. |
7.1 Results at a Glance
| Metric | Q2 2026 | Q2 2025 | YoY Δ | Q1 2026 | QoQ Δ |
|---|---|---|---|---|---|
| Revenue ($M) | $60,801.0M | $47,516.0M | +28.0% | $56,311.0M | +8.0% |
| Gross Profit ($M) | $49,471.0M | $39,025.0M | +26.8% | $46,093.0M | +7.3% |
| Gross Margin | 81.4% | 82.1% | -0.8 pp | 81.9% | -0.5 pp |
| EBITDA ($M) | $25,131.0M | $24,783.0M | +1.4% | $28,871.0M | -13.0% |
| EBITDA Margin | 41.3% | 52.2% | -10.8 pp | 51.3% | -9.9 pp |
| EBIT ($M) | $18,775.0M | $20,441.0M | -8.2% | $22,872.0M | -17.9% |
| EBIT Margin | 30.9% | 43.0% | -12.1 pp | 40.6% | -9.7 pp |
| Net Income ($M) | $15,848.0M | $18,337.0M | -13.6% | $26,773.0M | -40.8% |
| Net Margin | 26.1% | 38.6% | -12.5 pp | 47.5% | -21.5 pp |
| Diluted EPS | $6.18 | $7.14 | -13.4% | $10.44 | -40.8% |
YoY Δ = (Q2 2026 - Q2 2025) / |Q2 2025| × 100; QoQ Δ = (Q2 2026 - Q1 2026) / |Q1 2026| × 100. Margin = line / revenue × 100 (e.g. gross margin 81.4% = $49,471.0M / $60,801.0M × 100). The Q1 2026 (PQ) net margin of 47.5% and EPS of $10.44 are inflated by an $8.03bn discrete tax benefit booked in Q1 (see 7.4, Note 11) and are not a clean sequential comparator.
Source: Meta Platforms Q2 FY2026 Form 10-Q, Condensed Consolidated Statements of Income (10-Q p. 7); EBITDA and gross profit are analyst-derived (EBIT + D&A; revenue - cost of revenue).
7.2 P&L Drivers
sources Revenue: Revenue rose +28.0% YoY ((60,801 - 47,516) / 47,516 × 100) and +8.0% QoQ, driven almost entirely by advertising, which grew 27% to $59,363M as ad impressions delivered increased 14% YoY and average price per ad increased 12% YoY, with the online-commerce vertical the largest contributor and a favorable FX tailwind of $693M on ad revenue (10-Q p. 41–42). Family-of-Apps revenue was $60,370M (+28%) with DAP of 3.60bn (+3% YoY) and ARPP of $16.86 (+24% YoY); Reality Labs revenue was just $431M (+16%, driven by AI glasses offsetting lower Quest sales) (10-Q p. 13, 36–37).
Cost and margin: Gross margin held near flat at 81.4% ($11,330.0M cost of revenue in CQ vs $8,491.0M in PYSQ, +33% as data-center, cloud and depreciation costs rose; D&A was $6,356.0M CQ vs $4,342.0M PYSQ). The damage was below gross profit: R&D jumped 67% to $21,656M (36% of revenue vs 27%) on higher share-based compensation, infrastructure and third-party AI token costs, and G&A rose 111% to $5,609M on $2.40bn of legal charges, so EBIT margin fell -12.1 pp to 30.9% and EBIT declined -8.2% YoY (10-Q p. 43–44). Total costs also absorbed $1.18bn of severance tied to a ~8,000-person May 2026 headcount reduction (10-Q p. 29) — this cost pressure is structural (AI infrastructure and talent), not a one-off, apart from the severance and legal items.
Below the line: Interest and other income swung to an expense of -$19.0M (vs +$93M PYSQ) as interest expense rose to $783M on the higher debt load (vs $241M) and a $123M FX loss and lower equity-investment marks offset $859M of interest income (10-Q p. 45). Net income fell -13.6% YoY and diluted EPS fell -13.4% to $6.18 (-$0.96 YoY); the QoQ EPS drop of -40.8% (-$4.26) is a tax-comparability artifact, not operating deterioration.
7.3 Balance Sheet & Cash Flow
| Metric | Q2 2026 | Q2 2025 | YoY Δ | Q1 2026 | QoQ Δ |
|---|---|---|---|---|---|
| Cash ($M) | $15,462.0M | $12,005.0M | +28.8% | $23,426.0M | -34.0% |
| Net Debt ($M) | $68,202.0M | $16,827.0M | +305.3% | $35,322.0M | +93.1% |
| Net Debt / LTM EBITDA | 0.6× | — | — | — | — |
| Total Assets ($M) | $449,956.0M | $294,744.0M | +52.7% | $395,250.0M | +13.8% |
| Equity ($M) | $261,221.0M | $195,070.0M | +33.9% | $243,681.0M | +7.2% |
| OCF ($M) | $31,862.0M | $25,561.0M | +24.6% | $32,226.0M | -1.1% |
| CapEx ($M) | $30,116.0M | $16,538.0M | +82.1% | $18,997.0M | +58.5% |
| FCF ($M) | $1,746.0M | $9,023.0M | -80.6% | $13,229.0M | -86.8% |
| Dividends Paid ($M) | $1,353.0M | $1,327.0M | +2.0% | $1,346.0M | +0.5% |
CapEx YoY Δ = (30,116 - 16,538) / 16,538 × 100 = +82.1%. Net Debt / LTM EBITDA: LTM EBITDA = Q3 2025 $25,498M + Q4 2025 $30,156M + Q1 2026 $28,871M + Q2 2026 $25,131M = $109,656M; Net Debt CQ $68,202.0M / $109,656M = 0.6×. Note the net-debt line nets only cash; including $74,798M of marketable securities, total cash + marketable securities of $90,260M (10-Q p. 47) exceeds gross debt of $83,664M, so Meta remains roughly net cash despite the reported $68.2bn net-debt figure. Standalone-quarter OCF and FCF are derived by differencing the 10-Q’s year-to-date (six-month) cash-flow statement less Q1 (1H 2026 OCF $64,088M, 1H PP&E purchases $49,113M; 10-Q p. 10).
Source: Meta Platforms Q2 FY2026 Form 10-Q, Condensed Consolidated Balance Sheets (10-Q p. 6) and Statements of Cash Flows (10-Q p. 10); MD&A Liquidity (10-Q p. 46–47). LTM EBITDA is analyst-derived from the four most recent standalone quarters.
Balance sheet note: Two structural moves dominate the quarter: PP&E net rose to $225,724.0M (+13.8% QoQ from $194,776.0M) with construction-in-progress alone jumping to $80,345M from $50,521M at year-end, and long-term debt rose to $83,664M from $58,744M after a $25.0bn senior-notes issuance in May 2026 (10-Q p. 6, 18, 19). Cash fell -34.0% QoQ to $15,462.0M as $10.80bn of money-market funds was reclassified to restricted cash for infrastructure-purchase escrows, though marketable securities rose to $74,798M (10-Q p. 15, 20).
Cash flow note: Cash flow did not track earnings this quarter — the story is the capex-vs-OCF squeeze. FCF conversion fell to ~11.0% ($1,746.0M free cash flow / $15,848.0M net income), because standalone Q2 capex of $30,116.0M (+82.1% YoY; $31.08bn including finance leases) consumed almost all of $31,862.0M of operating cash flow — leaving FCF of just $1,746.0M, down from $9,023.0M a year earlier (-80.6% YoY) (10-Q p. 10, 31). Management raised 2026 capex guidance to $130–145bn (from the $115–135bn in the FY2025 10-K), so the free-cash-flow compression is set to persist (10-Q p. 46).
7.4 Footnote Review
sources Note 1 — Summary of Significant Accounting Policies (10-Q p. 12) Confirmed no material changes to significant accounting policies vs the FY2025 10-K (10-Q p. 12). The only new item is a not-yet-adopted standard, ASU 2026-02 (Environmental Credits, Topic 818), effective FY2028; Meta is still evaluating the impact. Analytically neutral this quarter.
Note 2 — Revenue (10-Q p. 13) Advertising was $59,363M of the $60,801M total; FoA $60,370M and RL $431M. By geography, US & Canada $23,863M (+32%), Europe $14,009M (+24%), Asia-Pacific $16,073M (+19%), Rest of World $6,856M (+36%) (10-Q p. 13, 35). Deferred revenue was $1.16bn (vs $1.08bn at year-end). Confirms the ad franchise is broad-based and accelerating; supports the thesis’ revenue engine.
Note 3 — Earnings per Share (10-Q p. 14) Diluted share count was 2,566M. Notably, ~60M shares were excluded as anti-dilutive in Q2 2026 versus only ~1M in Q2 2025 (10-Q p. 14) — a jump tied to the newly issued high-strike stock options (Note 10) and RSU mechanics; a modest, watch-only future dilution signal, not material to this quarter’s EPS.
Note 4 — Financial Instruments (10-Q p. 15) Marketable securities were $74,798M (all Level 1/2); marketable equity securities carried net unrealized losses of $733M in Q2 2026 (vs $511M PYSQ), recorded in interest and other income. New this period: restricted cash equivalents of $13.55bn, including $10.80bn of money-market funds escrowed under multi-year infrastructure-purchase agreements, releasing 2028–2030 (10-Q p. 16). This is a direct footprint of the AI build tying up liquidity — a change vs prior quarters.
Note 5 — Non-Marketable Equity Investments / VIE (10-Q p. 16) Total carrying value $30,157M (vs $27,524M at year-end); equity-method holdings rose to $9,406M. The Louisiana “Venture” data-center VIE (20% interest, equity-method) carried $2.92bn (vs $1.83bn), with maximum exposure to loss of $46.03bn (vs $45.95bn at year-end), comprising the equity carrying value, ~$12.31bn lease commitments, pro-rata funding of ~$27bn of development costs, and a ~$28bn residual-value-guarantee threshold; Meta is not the primary beneficiary and does not consolidate it (10-Q p. 16–17). Other unconsolidated VIEs add $6.41bn of exposure (vs $5.58bn). This off-balance-sheet infrastructure financing grew slightly and remains a structural leverage/ROIC caveat.
Note 6 — Property and Equipment (10-Q p. 17) PP&E net $225,724M; servers/network gross rose to $119,683M (from $98,040M) and CIP to $80,345M (from $50,521M). Depreciation was $6.00bn in Q2 2026 (vs $4.28bn) — the future D&A wall is beginning to materialize as CIP is placed in service. A March 2026 held-for-sale plan reclassified $1.48bn of data-center assets (10-Q p. 17–18). Reinforces the F003-type capital-intensity risk from the FY2025 forensic read.
Note 7 — Acquisitions and Goodwill (10-Q p. 18) Goodwill declined to $23,406M from $24,534M, driven by a $1.27bn reclassification to held-for-sale (the El Paso disposal); no impairment recognized (10-Q p. 18). Immaterial to the thesis.
Note 8 — Long-term Debt / covenants (10-Q p. 19) Total face amount of Notes rose to $84,000M from $59,000M after a $25.0bn six-series issuance in May 2026 (stated coupons 4.55%–6.45%, maturities 2031–2066). Meta is not subject to any financial covenants; no near-term maturity wall (only $2.75bn due 2027; $73.75bn “thereafter”). Interest expense on the Notes was $754M in Q2 2026 vs $232M PYSQ (10-Q p. 19). The debt-funded build is confirmed; covenant-free structure limits balance-sheet risk near term.
Note 9 — Commitments and Contingencies (10-Q p. 19) Off-balance-sheet obligations expanded sharply vs the FY2025 10-K: not-yet-commenced leases of $278.99bn (vs $103.77bn at year-end) and non-cancelable contractual commitments of $349.31bn (vs $131.05bn), with $53.52bn and $81.65bn due in 2026 and 2027; plus a $14.72bn contingent cloud obligation and multi-year (9–25yr) energy purchase agreements with no fixed volume (10-Q p. 19–20). These figures more than doubled QoQ/vs-year-end and materially raise Meta’s contracted fixed-cost base if AI monetization disappoints — the single largest change this quarter for the risk case. (Litigation covered under Contingencies below.)
Note 10 — Stockholders’ Equity (10-Q p. 26) Zero share repurchases in H1 2026 ($25.03bn remained authorized), versus $23.16bn repurchased in H1 2025 — an explicit capital-allocation pivot to fund the build. The $0.525/quarter dividend was maintained. SBC expense rose to $7,601M in Q2 2026 (from $4,834M); unrecognized SBC ballooned to $79.79bn (from $54.81bn at year-end). New: 20M stock options issued at a $2,788 weighted-average strike (10-Q p. 26–27). The buyback halt is the defining capital-return change of the quarter.
Note 11 — Income Taxes (10-Q p. 27) [Rating and price target withdrawn — see the note at the top.] Gross unrecognized tax benefits rose to $18.74bn (from $16.45bn) with $2.97bn of accrued interest/penalties; the IRS 2017–2019 Notice ($15.89bn asserted) and the 2010 Tax Court IP re-valuation ($7.79bn, $1.48bn above Meta’s) remain live multi-year cash-tax tail risks (10-Q p. 28). Meta states its UTB accrual is adequate.
Note 12 — Segment Information (10-Q p. 29) FoA operating income was $23,394M, down 6% YoY despite 28% revenue growth — the cost surge hit the profit engine directly; FoA margin fell to 39% from 53%. RL loss widened 2% to $(4,619)M on $431M of revenue (RL margin -1,072%); full-year 2026 RL losses are guided “similar to 2025” (10-Q p. 29, 34). Segment definitions unchanged. The FoA margin compression is the most thesis-relevant single data point in the filing.
Note 13 — Subsequent Event (10-Q p. 30) — see Subsequent events below.
Related-party / equity-method transactions (10-Q p. 16–17) Meta has no controlling-shareholder commercial related-party transactions disclosed in this 10-Q (founder-CEO Zuckerberg holds voting control via Class B super-voting shares; Item 13 related-party detail is deferred to the annual proxy, not this filing). The material affiliated arrangement is the equity-method Louisiana “Venture” VIE, in which Meta holds a 20% interest, carries the investment at $2.92bn (vs $1.83bn at year-end), provides construction-management, administrative and property-management services to the entity, has committed to fund its pro-rata share of ~$27bn of development costs, and will lease properties back from the Venture from 2029 (~$12.31bn initial commitment) with a ~$28bn residual-value guarantee — total maximum exposure $46.03bn (10-Q p. 16–17). Terms are materially unchanged vs the FY2025 10-K ($45.95bn) other than the modest increase in carrying value and exposure. No dividends, management fees, or purchase/sale transactions with a controlling shareholder are disclosed.
Contingencies and litigation (10-Q p. 19–26, Part II p. 50–56) Aggregate monetary damages/penalties sought across all matters remain stated as “up to hundreds of billions of dollars.” Open matters and Q2 developments: - Youth “social-media addiction” litigation: first personal-injury bellwether returned a March 25, 2026 verdict of $6M (70% allocated to Meta ≈ $4.2M, on appeal); New Mexico AG youth trial returned a March 24, 2026 civil-penalty verdict of $375M, with the AG now seeking $953M in abatement costs; Tennessee AG trial began July 20, 2026; the multidistrict state-AG trial is set for August 12, 2026; plaintiffs across these cases indicate they could seek “up to more than a trillion dollars,” and 200,000+ mass-arbitration demands are outstanding (10-Q p. 24–25). - New Mexico AG privacy case: trial set for September 8, 2026; AG intends to seek up to $62.85bn in penalties (10-Q p. 21). - Flo Health: August 1, 2025 jury liability verdict; plaintiffs seek $5,000 per class member across up to ~1.25 million members (10-Q p. 22). - FTC antitrust (Instagram/WhatsApp): Meta won at trial November 18, 2025; the FTC appealed January 20, 2026 — the existential divestiture risk remains alive but low-probability (10-Q p. 23). - EU stack: Marketplace fine ~€798M (appealed); DMA “subscription for no ads” fine €200M (appealed); a June 2026 EC interim measure requires WhatsApp to open its Business API free to general-purpose AI providers (Meta to appeal); Spain AMI unfair-competition award ~€542M (appealed); IDPC SCC fine €1.2bn (stayed) (10-Q p. 22–24). - AI copyright: Kadrey fair-use ruling in Meta’s favor (June 2025); further per-work damages cases pending (10-Q p. 25–26). The financial expression of this tail was the $2.40bn of legal charges in Q2 2026 G&A (10-Q p. 44) — absorbable against $15,848.0M of quarterly net income, but the accrual is explicitly a floor, and management warns additional accruals “could be material.”
Subsequent events (10-Q p. 30, 19) Disclosed after quarter-end: (1) a July 2026 exclusivity agreement to co-develop an El Paso, Texas data-center campus via a new 20%-interest venture — Meta expects to contribute ~$2.3bn of held-for-sale assets, receive a ~$1bn distribution, and provide a ~$13bn maximum residual-value guarantee, closing expected Q3 2026; and (2) ~$68bn of additional data-center leases entered in July 2026, commencing 2027–2028 (10-Q p. 30, 19). Both extend the off-balance-sheet infrastructure regime past quarter-end.
7.5 What Changed This Quarter
sources - Operating leverage inverted: revenue +28.0% YoY to $60,801.0M, but EBIT -8.2% to $18,775.0M and EBIT margin -12.1 pp to 30.9% — the first clear quarter where AI/infrastructure cost growth (R&D +67%, $2.40bn legal, $1.18bn severance) outran the ad franchise. Directly pressures the earnings-power leg of the thesis. - Free cash flow compressed to ~$1.7bn (from $9.0bn a year ago) as standalone capex of $30,116.0M nearly matched operating cash flow, and 2026 capex guidance was raised to $130–145bn (10-Q p. 46). The FCF-conversion deterioration flagged in the FY2025 read is accelerating. - Capital-allocation pivot confirmed: zero buybacks in H1 2026 (vs $23.16bn in H1 2025) plus a $25.0bn May 2026 debt issuance (total face $84bn) — Meta is funding the build with retained cash and debt rather than returning it, exactly as the FY2025 10-K foreshadowed. Dividend held at $0.525/quarter. - Off-balance-sheet obligations roughly tripled vs year-end: non-cancelable commitments $349.31bn (from $131.05bn) and not-yet-commenced leases $278.99bn (from $103.77bn), plus the $46.03bn Louisiana VIE and a new El Paso venture — the contracted fixed-cost base is now very large relative to the on-balance-sheet position. [Rating and price target withdrawn — see the note at the top.] - Franchise health intact: DAP 3.60bn (+3%), ARPP $16.86 (+24%), ad impressions +14%, price +12% — demand is strengthening, so the margin/FCF deterioration is a deliberate investment choice, not a top-line problem.
7.6 Portfolio Decision
sources [Rating and price target withdrawn — see the note at the top.] This quarter confirms both halves of the investment thesis and resolves none of its central tension. The Family-of-Apps advertising engine is not just intact but accelerating — revenue +28.0% to $60,801.0M, ARPP $16.86 (+24%), ad price +12%, impressions +14% — which validates the demand-and-monetization case underpinning valuation. But the quarter also makes concrete the risk the thesis always carried: the AI/infrastructure build is now compressing profitability and cash generation in real time, with EBIT down 8.2% to $18,775.0M, FoA operating margin down to 39% from 53%, standalone free cash flow compressed to ~$1.7bn, and 2026 capex guidance raised to $130–145bn. The footnote review adds two reinforcing facts — off-balance-sheet commitments that roughly tripled to $349.31bn and a buyback halt with $25bn of fresh debt — that weaken the “self-funding compounder” framing without breaking it, since the spend is deliberate, disclosed, and set against a covenant-free balance sheet that is still roughly net cash ($90.26bn cash + securities vs $83.66bn debt). The legal tail grew (a $375M New Mexico verdict, $2.40bn of Q2 legal charges, aggregate exposure “up to hundreds of billions”) but remains within the accrue-and-appeal frame and is absorbable against $15,848.0M of quarterly earnings. [Rating and price target withdrawn — see the note at the top.]
What would change this view: [Rating and price target withdrawn — see the note at the top.] [Rating and price target withdrawn — see the note at the top.]
Report Versions
Every published version of this report, newest first — each one kept so a reader can see what changed and when.
| Version date | Files |
|---|---|
| 2026-08-19 Current | Model (Excel) |
| 2026-08-03 | Model (Excel) |