
Mastercard Incorporated
Section 1 — Business Overview, Operations & Competitive Positioning
sources
1.1 The Business
sources Mastercard earns a small, volume-based fee every time money moves across its global payments network: it authorizes, clears and settles electronic transactions between banks, and increasingly sells data-driven services on top of that switching flow — without ever issuing a card, lending to a consumer, or earning a cent of interchange. This distinction is the single most important thing to understand about the company. Mastercard operates a four-party payments network connecting the account holder, the issuing bank, the merchant and the acquiring bank; it administers the settlement between those parties and sets network rules, but the customer relationship, the credit risk and the interchange economics all sit with its bank customers, not with Mastercard.
The economic model is therefore a toll on the flow of electronic payments rather than a lending or issuing business. Net revenue reached $32,791.0M in FY2025, and management reports it in two categories: the payment network — fees charged on the gross dollar volume carried on Mastercard-branded cards and for switching transactions — and value-added services and solutions, which spans security, fraud, consumer engagement, data analytics, digital authentication, processing and gateway, and newer account-to-account and open-finance capabilities. A structurally important accounting point that recurs through this report: reported net revenue is stated net of a very large, management-estimated pool of rebates and incentives paid to customers to win and renew card programs, so the headline figure is already the product of the company’s single largest financial estimate. The business is asset-light, generates the great majority of its revenue outside the United States, and — a point the market frequently underappreciates — operates its core network model under active antitrust and regulatory scrutiny in several jurisdictions, including a U.S. Department of Justice investigation into its U.S. debit program and a European Commission inquiry into its network fees. Mastercard trades on the NYSE under MA and employs a large, globally distributed technology workforce with the majority of staff located outside the United States.
Key Information
| Item | Value |
|---|---|
| Ticker | MA |
| Sector / Industry | Financials / Payment Processing |
| Report Date | 2026-08-05 |
| Most Recent FY Revenue | $32,791.0M |
| EBIT Margin (Most Recent FY) | 57.6% |
| Diluted Shares Outstanding | 906M |
| Current Price | $571.10 |
Source: Company SEC filings (10-K); see Appendix A.1.
1.2 Operating Segments
sources Mastercard reports as a single operating segment (“Payment Solutions”), and it does not disclose segment-level operating income, so the useful unit of analysis is not a segment hierarchy but the two revenue categories through which management runs the business. The first is the payment network. Its economics are driven by one variable above all others — gross dollar volume: the value of purchases made on Mastercard-branded cards, split between domestic volume, cross-border volume and the number of switched transactions. Cross-border volume is the highest-value and most cyclical strand, because it is tied to international travel and to customers’ currency-conversion needs; it collapsed during the 2020 pandemic and rebounded strongly thereafter, which is why FY2020 revenue of $15,301.0M dipped below the prior year before the multi-year climb resumed. The second category is value-added services and solutions — security and fraud tools, consumer acquisition and engagement, business and market insights, digital and authentication, processing, gateway, and account-to-account rails. Its driver is the number of transactions the network switches (more transactions create more data and more surface area to sell services against) plus pricing and cross-sell.
These two categories function as a flywheel rather than as independent lines. Switching payments generates the transaction data that powers the services; the services, in turn, differentiate the network, deepen customer relationships and help win the next tranche of payments volume. Management has been explicit that value-added services grew markedly faster than the payment network in the most recent year, which matters analytically for two reasons: it diversifies the revenue base away from pure interchange-adjacent volume — the part of the model most exposed to regulation — and it tends to carry stickier, less cyclical demand. The fragility in the system is the mirror image of its strength: because both categories ultimately feed off the same network of issuing and acquiring customers, a loss of a large customer or a regulatory intervention that reroutes volume away from the network would compress payments and the services sold on top of it at the same time.
1.3 Geographic Exposure
sources Mastercard disaggregates revenue only coarsely — into two geographic regions (the Americas, and Asia Pacific / Europe / Middle East / Africa) — which limits granularity for an outside analyst. What the disclosure does establish is that the large majority of revenue is generated outside the United States, and that no single country other than the United States accounts for a large share of net revenue. The practical consequence is a genuinely global demand base with meaningful currency exposure: the company’s primary functional currencies are the U.S. dollar, the euro, the British pound and the Brazilian real, and results are subject to both translational and transactional foreign-exchange effects. A strengthening dollar translates overseas revenue into fewer reported dollars, which is why management reports currency-neutral growth alongside as-reported growth. The geographic footprint also carries a specific operational reality — a rising tide of national payment infrastructure, data-localization and in-country switching mandates in markets such as India, China and Saudi Arabia — but the detailed risk treatment of that exposure belongs to Section 2.
1.4 Management Team
sources The leadership anchor is the pairing of Chief Executive Officer Michael Miebach, in the role since January 2021 after a long internal ascent, and Chief Financial Officer Sachin Mehra, in post since April 2019. That is a multi-year, deeply internal executive core running a business whose strategy — grow the core network, diversify into services, extend into new payment flows — has been consistent and continuously executed rather than reinvented, which is the profile an investor wants at the head of a compounding, franchise-driven model.
The more revealing signal in the current period is the shape of the new additions to the executive bench. Alongside a new Chief People Officer and a new Chief Marketing and Communications Officer, the company created a Chief Administrative Officer role and installed a Vice Chairman and President of Strategic Growth who is a former U.S. ambassador. Read together, these hires point to a deliberate escalation of government engagement and public-policy capability at the most senior level — an entirely rational response to a business whose principal external threat is now regulatory and antitrust rather than competitive. The main governance watch item is not the executive team but the share register: the Mastercard Foundation, a legacy charitable holder of a significant share of the voting power, is roughly one year into a pre-announced multi-year plan to diversify out of the stock, a matter detailed in Section 2.
1.5 Capital Allocation Track Record
| Year | Dividends Paid ($M) | Share Repurchases ($M) | CapEx ($M) |
|---|---|---|---|
| FY2021 | $1,741.0M | $5,904.0M | $814.0M |
| FY2022 | $1,903.0M | $8,753.0M | $1,097.0M |
| FY2023 | $2,158.0M | $9,032.0M | $1,088.0M |
| FY2024 | $2,448.0M | $11,035.0M | $1,194.0M |
| FY2025 | $2,756.0M | $11,727.0M | $1,215.0M |
Source: Company SEC filings (10-K); see Appendix A.1.
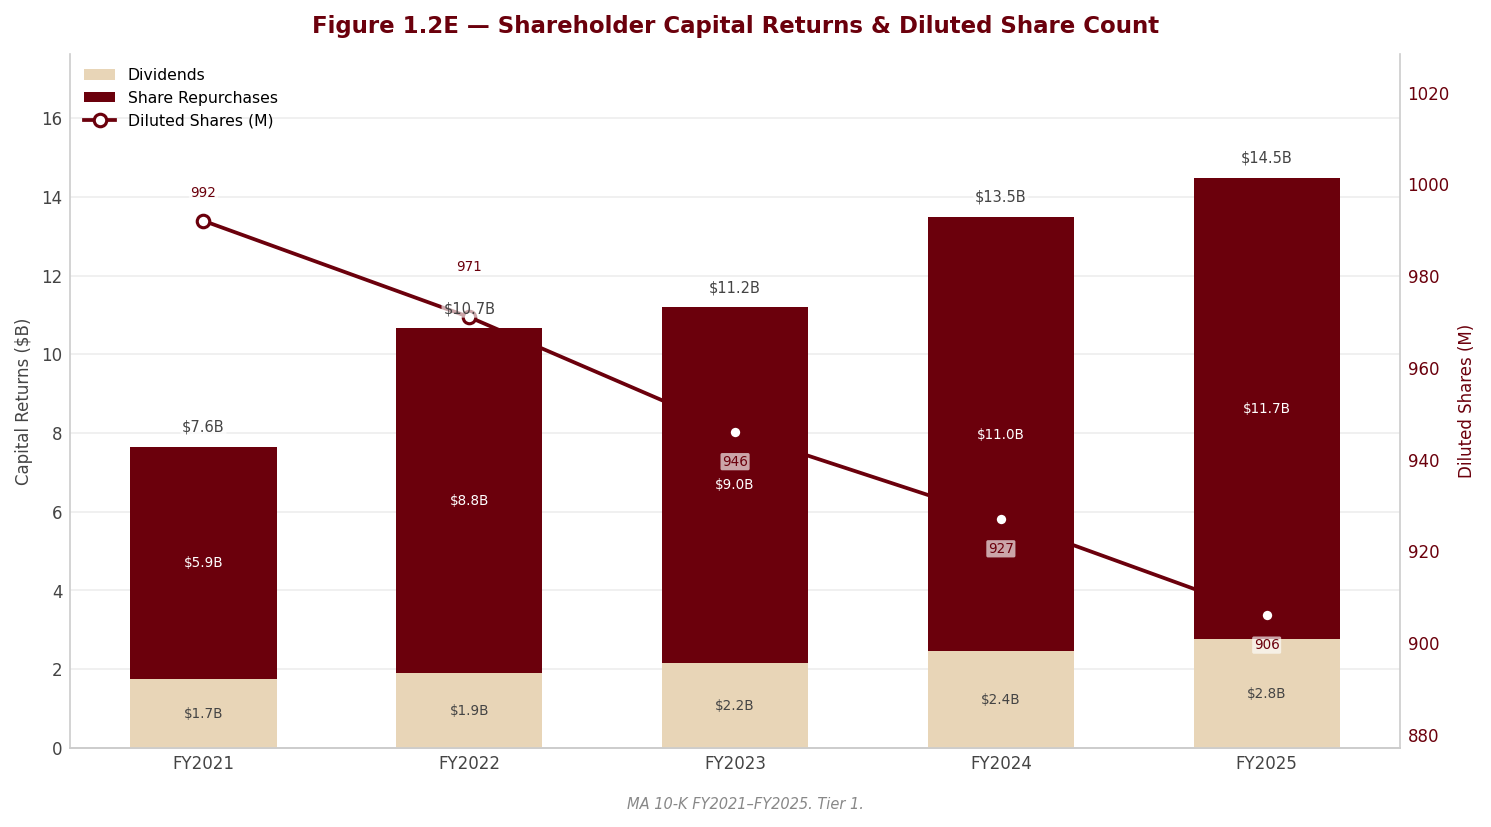
Mastercard’s capital-allocation record is that of a mature, cash-generative franchise that returns the overwhelming majority of its free cash flow to shareholders and is decisively tilted toward buybacks over dividends. The dividend is raised annually but is deliberately kept a modest claim on earnings — a low dividend payout ratio of 18.4% in FY2025 — while share repurchases run at a multiple of the dividend under standing board authorizations, with a fresh authorization approved to succeed the prior one and a substantial buyback capacity remaining at year-end. Combined, dividends and repurchases produced a total shareholder yield of 2.8% in FY2025. The buyback is not merely a return of cash: because it steadily reduces the Class A share count, diluted earnings per share compound faster than net income, and the repurchase program also absorbs the natural supply created by the Mastercard Foundation’s multi-year sell-down.
Critically, almost none of this cash is required to run or grow the business. Capital expenditure is a small fraction of operating cash flow — the network is a technology and rules platform, not a capital-intensive physical asset base, with no inventory and no working-capital cycle in the conventional sense. The signal is a management team confident that incremental growth can be funded out of a light reinvestment budget while the bulk of cash is handed back, and disciplined enough to have kept that posture consistent across the five years shown. The one nuance an analyst should carry forward is that a growing share of “investment” in this model is not capex at all but capitalized customer incentives — the upfront payments made to win and renew card deals — a dynamic examined in the financial analysis in Section 3.
1.6 Competitive Positioning & Moat
sources 1.6.1 Industry structure. Global general-purpose payment networks are a scale-driven oligopoly. The network is two-sided — it is only valuable to issuers if merchants accept it, and only valuable to merchants if consumers carry it — so acceptance breadth and switching scale compound on themselves and are extraordinarily difficult to replicate from a standing start. [Rating and price target withdrawn — see the note at the top.] Mastercard’s operating margin of 57.6% in FY2025 is the clearest single quantitative expression of that structure. Returns in this industry accrue to the two or three players with genuinely global acceptance, real-time switching capacity and a trusted brand; everyone else competes at the domestic or single-function level.
1.6.2 Competitive advantages. Mastercard’s moat rests on several reinforcing pillars, each grounded in the filing rather than asserted. First, network effects and switching scale: the company switches the large majority of transactions on its Mastercard and Maestro cards, including nearly all cross-border transactions, across a distributed architecture that applies fraud scoring and tokenization in real time — a two-sided flywheel a new entrant cannot bootstrap. Second, the franchise model: Mastercard sets the rules and standards that make the system interoperable and, importantly, backs a settlement guarantee supported by its strong credit standing — a trust function that is itself a barrier to entry. Third, brand: the Mastercard and Maestro marks and the long-running “Priceless” platform give it globally recognized consumer trust. Fourth, data and AI assets and multi-rail capability: the transaction data flywheel powers the value-added services that differentiate the network, and the company’s account-based (“multi-rail”) capabilities let it offer customers choice beyond the card. The durability of the pricing power these produce is visible in the margin cited above and in the fact that value-added services are growing faster than the core network.
1.6.3 Competitive vulnerabilities. The moat is wide but it is not un-besieged, and the primary threat is regulatory rather than competitive. The most material vulnerability — and it must be stated with appropriate weight — is the broad antitrust and regulatory overhang on the network model itself. Mastercard faces long-running interchange antitrust litigation in the United States and Europe, ATM-surcharge and EMV liability-shift matters, and, most pointedly, a U.S. Department of Justice Civil Investigative Demand aimed squarely at its U.S. debit program and a European Commission inquiry into the network fees it charges acquirers. The last two are the ones that reach the core: interchange regulation affects Mastercard only indirectly (it does not earn interchange), but regulation of its own network fees, or a forced change to its U.S. debit practices, would strike the pricing power directly. There is also a structural asymmetry the company itself flags — because it runs a four-party network, it can attract more regulatory scrutiny than three-party rivals such as American Express that connect directly to both consumers and merchants and do lend, potentially placing Mastercard at a relative disadvantage. Beyond regulation, the secondary vulnerabilities are disintermediation risk from government-backed real-time rails (Brazil’s PIX, India’s UPI, the U.S. FedNow), potential central bank digital currencies and stablecoins; persistent pricing pressure from large customers and merchants demanding richer incentives; and customer concentration, with a significant portion of net revenue tied to the five largest customers.
1.6.4 Verdict. Mastercard is a genuinely wide-moat business whose competitive advantages — two-sided network effects, global switching scale, a trusted franchise and settlement guarantee, and a self-reinforcing data-and-services flywheel — are structural and difficult to replicate, and are reflected in an operating margin that sits among the highest of any large-cap enterprise. On the evidence, the binding constraint on long-run margin durability is not competitive displacement, which the network is well-positioned to resist, but the regulatory and antitrust pressure now pointed at the core model. Our judgment is that the moat is durable and the margin structure is likely to persist, but that the regulatory tail — not competition — is the variable that determines whether that margin compounds or is gradually legislated lower. The implications of that high quality for the valuation are.
Section 2 — Key Risks & Catalysts
sources
2.1 Downside Risks
sources The risk profile of Mastercard is unusual for a business of its quality: the dominant threat is neither operational, financial nor competitive, but legal and regulatory. The network is asset-light, unlevered in any meaningful sense, carries no inventory or credit risk, and faces no serious question about the durability of its two-sided franchise. What it does face — squarely and increasingly at the core of the model — is a state that has decided the economics of card payments are a matter of public policy. Because Mastercard operates a four-party network rather than a closed-loop three-party system, it sits at the intersection of interchange politics, antitrust enforcement and a newer, more pointed line of scrutiny aimed at its own network fees. Every material downside below flows, directly or indirectly, from that fact. The two lower-probability but genuinely structural threats — long-horizon disintermediation and the quality of reported revenue — round out a risk map on which the tail, not the base case, is where the danger lies.
Risk 1 — Antitrust litigation and two live government investigations into the core business model
sources This is the principal risk in the investment case, and it is disclosed as a mandatory red-flag matter. Mastercard carries a broad, largely unreserved overhang of interchange and antitrust litigation whose disclosed claim amounts vastly exceed what the company has accrued: multiple individual matters each assert single damages exceeding a billion dollars — U.S. opt-out merchant claims heading to trial in the coming year, U.K. and pan-European merchant claims (with a U.K. trial court having ruled against the company on certain liability issues, now under appeal), a U.K. commercial-card collective action, newly filed Netherlands and Portugal collective actions, and an ATM-operators class — while the aggregate accrued liability is a small fraction of that exposure. Because U.S. antitrust claims can carry treble damages, the gap between accrual and potential loss is not a rounding item. More important than the historic interchange docket are two active government investigations that reach the model itself: a U.S. Department of Justice Civil Investigative Demand focused on Mastercard’s U.S. debit program and its competition with other networks, and a European Commission request for information into the network fees Mastercard charges acquirers. The distinction matters enormously and is frequently missed: interchange regulation touches Mastercard only indirectly, because it neither sets nor earns interchange — it flows between issuer and acquirer — so caps and litigation there affect the company through volumes and issuer behaviour. The European inquiry is different in kind. It targets Mastercard’s own fees, which is direct revenue risk to the pricing power that underpins the entire margin structure. An adverse DOJ outcome on U.S. debit could force business-practice changes and spawn follow-on civil claims. This is the one risk that can reach the moat rather than merely dent a quarter.
Probability: High (that provisions and adverse rulings continue; lower that any single matter is company-altering) | Timeframe: Immediate and ongoing, with several trials scheduled in the coming year | Quantified potential impact: Not reliably estimable — the company itself states it cannot estimate loss for most matters, which is precisely why disclosed claims dwarf accruals; the durable impact is a recurring annual litigation-provision drag plus a low-probability, high-severity tail from an adverse network-fee or debit ruling.
Risk 2 — Direct regulation of network fees, and structural pricing pressure from merchants and large customers
sources Distinct from the litigation docket is the slower-moving but more corrosive risk that Mastercard’s own pricing gets regulated or negotiated down. This is where the economics actually sit and where they are most exposed: the company earns assessments on domestic and cross-border volume, fees for switching and processing transactions, and a growing pool of value-added-services fees — and reported net revenue is already stated after deducting a very large pool of customer incentives. Several forces press on that pricing simultaneously. Regulators in a widening set of jurisdictions have signalled interest in the fees networks charge customers, which could in future be capped directly rather than left to negotiation. Large, increasingly global merchants — who have bankrolled the interchange litigation for years — are now explicitly asking authorities to review Mastercard’s network fees, the same posture that produced the European inquiry. And the company’s largest customers, being few and powerful, extract escalating incentives and rebates to place and renew card programs; customer consolidation or the loss of a single large program would shift bargaining power further toward the buyer. Real-time and account-based schemes offering low or subsidised pricing add a downward reference point. [Rating and price target withdrawn — see the note at the top.]
Probability: Medium-High | Timeframe: 1–2 years for discrete regulatory or customer-driven steps; continuous as a background pressure | Quantified potential impact: Gradual rather than cliff-edged — expressed as slower net-revenue yield and higher incentive intensity; a direct fee cap in a major market would be a step-change, but no such cap is in force today.
Risk 3 — Long-horizon disintermediation by public rails, digital currencies, fintechs and payment nationalism
sources The genuine long-run question for any card network is whether the transaction still needs to travel over a card rail at all. Mastercard itself catalogues the alternatives, and they are no longer hypothetical: government-built instant-payment infrastructure such as Brazil’s PIX, India’s UPI and the U.S. FedNow moves money account-to-account and, in some markets, at little or no cost to the merchant; account-based rails can bypass the card network entirely; central bank digital currencies and stablecoins raise the prospect, over a longer horizon, of value settling without an intermediary of Mastercard’s kind; and fintechs, wallets and buy-now-pay-later providers can reroute or capture the front end of the transaction. Compounding this is payment nationalism — mandates in markets such as India, China and Saudi Arabia that domestic switching occur in-country or only through domestic providers, plus data-localization rules, which can wall Mastercard out of geographies regardless of product quality. None of this is an imminent threat to the base case; card acceptance, cross-border reach and the settlement guarantee remain difficult to replicate, and Mastercard is actively converting several of these threats into owned rails (its multi-rail and account-to-account capabilities, and its embrace of stablecoins as a settlement option). But it is the risk that, over a five-to-ten-year view, most credibly bends the growth trajectory, and it deserves to be held as a structural watch item rather than dismissed.
Probability: Medium (as a gradual share-of-flow erosion); Low (as a near-term rupture) | Timeframe: 3–5 years and beyond | Quantified potential impact: Diffuse and long-dated — a slow tax on the addressable pool rather than a discrete loss; the stablecoin/CBDC strand is the widest-variance, lowest-visibility element.
Risk 4 — The quality and predictability of reported revenue: rebates and incentives
sources This is the second mandatory red-flag disclosure, and it is a matter of interpretation rather than integrity. Mastercard’s headline net revenue is presented net of a very large pool of rebates and incentives paid to customers — a contra-revenue figure of roughly the same order of magnitude as reported net payment-network revenue itself — and that pool is built on management’s estimates of future customer performance: forecasted transactions, card issuance and conversion, volume thresholds. The independent auditor identified revenue recognition of rebates and incentives as the sole Critical Audit Matter precisely because it demands significant management judgment and a high degree of auditor effort. The analytical consequence is that the single most important number in the model is reported after subtracting the single largest estimate in the financial statements; small shifts in the incentive assumptions can move net revenue materially, and gross-to-net dynamics — a wave of new or renewed customer deals lifting incentives — can mask or amplify the underlying pricing and volume trend. The related balance-sheet position deepens the watch: the capitalized customer-incentive asset has been growing faster than net revenue, deferring the cost of winning and keeping customers onto the balance sheet, where a slowdown in new-deal capitalization or a step-up in amortization would pressure reported margins. The audit is clean and controls were tested; this is not an allegation of misstatement. It is a caution that revenue quality here is contingent on estimate accuracy in a way it is not for a simpler business.
Probability: Medium (that gross-to-net dynamics obscure the underlying trend in any given period) | Timeframe: Ongoing | Quantified potential impact: Not a discrete loss event; the effect is on the reliability of the growth signal and the durability of margins if capitalized incentives keep outrunning revenue.
Risk 5 — Governance structure and the Mastercard Foundation share overhang
sources The final principal risk is a governance one, and it too is a mandatory watch-item disclosure. The Mastercard Foundation — a legacy charitable holder created at the company’s IPO, whose directors must be independent of Mastercard and its customers — remains a significant, greater-than-threshold holder of the general voting power and is partway through a pre-announced, court-sanctioned multi-year plan to diversify out of the stock. That is a persistent, fundamentals-independent supply overhang on the publicly traded Class A shares that will run for years yet; the company’s own buyback partly absorbs it, but it is a standing feature of the share register rather than a one-off. Two nuances temper the severity and one sharpens it. Tempering: the Foundation is a charitable related party with independent directors, not a controlling insider extracting value, and there is no arm’s-length pricing issue because it transacts no fees with the company. Sharpening: the related-party disclosure that previously sat inside the audited financial-statement notes was, this year, moved out into the narrative risk and governance section — the substance remains disclosed but its prominence is reduced, a presentation change worth noting. Sitting behind this is a layered share-class structure — publicly held Class A shares carrying the vote and the economics, alongside legacy non-voting Class B shares associated with former member financial institutions and a special Class M carrying essentially no economic rights — together with anti-takeover features including an ownership cap on Class A voting power and the disqualification from the board of any representative of a competitor or of the Foundation. This is a well-governed structure rather than a red flag, but the overhang and the reduced disclosure prominence are legitimate items to carry.
Probability: Medium (as a technical supply/liquidity overhang); Low (as a fundamental governance concern) | Timeframe: Multi-year, running well into the next decade | Quantified potential impact: A modest, persistent headwind to share-price supply-demand rather than an earnings risk; no operating impact.
2.2 Upside Catalysts
sources The catalyst set is deliberately presented as smaller in number and steadier in character than the risk set, and that asymmetry is real: this is a company whose downside is a low-probability regulatory tail and whose upside is compounding rather than binary. [Rating and price target withdrawn — see the note at the top.] Instead the constructive case rests on the secular displacement of cash and checks — the backdrop tailwind beneath everything below — expressed through a deliberate broadening of the revenue base away from pure volume dependence, a set of new rails and commerce models that convert several of the disintermediation threats into owned opportunities, and the eventual clearing of the litigation fog.
Catalyst 1 — Value-added services outgrowing the core network
sources [Rating and price target withdrawn — see the note at the top.] Management reports that services — security and fraud, consumer engagement, data and analytics, digital and authentication, processing and gateway, open finance — grew markedly faster than the core network in the most recent period. This matters for two reasons that compound. First, it diversifies revenue away from the assessment-and-switching stream that is most exposed to interchange politics and network-fee regulation, structurally lowering the company’s regulatory beta. Second, services demand is stickier and less cyclical than volume, and it feeds the flywheel — more switched transactions generate the data that powers more services, which in turn differentiate the network and win the next tranche of volume. Sustained mix shift toward services is the single clearest way the business earns its way out from under Risk 2.
Probability: High | Timeframe: Ongoing, compounding over 1–5 years | Monitoring trigger: Value-added-services growth continuing to outpace payment-network growth, and services rising as a share of net revenue, in successive results.
Catalyst 2 — New payment flows and the multi-rail strategy
sources Beyond the card, Mastercard is extending into commercial and business-to-business payments, disbursements and remittances through its money-movement platform, virtual-card technology embedded across business-to-business and travel-and-expense workflows, and real-time account-to-account rails. Each of these expands the addressable pool well beyond consumer card volume and, critically, positions the company to carry flows that might otherwise migrate onto the very public and account-based rails identified in Risk 3 — turning a disintermediation threat into a rail Mastercard operates rather than one that bypasses it. Traction here is the practical answer to the long-horizon question of whether the network stays relevant as money movement modernises. §
Probability: Medium-High | Timeframe: 1–3 years for visible contribution | Monitoring trigger: Continued expansion of embedded virtual-card volumes and money-movement corridors, and management disclosure of new-flow and commercial-payment growth outpacing consumer volume.
Catalyst 3 — New commerce models: agentic commerce, tokenization, and stablecoins as an owned rail
sources A less certain but higher-optionality catalyst is the set of forward initiatives Mastercard is seeding at the frontier of how commerce happens: a framework to enable secure AI-assisted and fully automated “agentic” commerce built on its tokenization capabilities; the embedding of stablecoin and crypto spending across its acceptance network and money-movement platform; the scaling of tokenized transactions and authentication; and newer data-driven businesses in threat intelligence and commerce media. The strategic significance is that each takes a technology often framed as an existential threat to card networks — autonomous agents, stablecoins, crypto — and reframes it as a flow Mastercard can secure, tokenize and monetise. These are options on future volume and services, not committed financial targets, and should be valued as optionality rather than base case; but they are the mechanism by which the company most credibly neutralises the stablecoin and account-based strands of the disintermediation risk. §
Probability: Medium | Timeframe: 2–5 years | Monitoring trigger: Commercial rollout and adoption milestones for agentic-commerce and stablecoin enablement, and disclosed growth in tokenized transaction share.
Catalyst 4 — Resolution of the litigation overhang
sources Because the litigation and regulatory overhang is the dominant drag on how the market values the business, its incremental resolution is itself a catalyst. Mastercard has already settled with the large majority of U.S. opt-out merchants — the settled volume representing the vast majority of its U.S. interchange volume — and has reached settlements, subject to court approval, on several ancillary matters including the liability-shift and ATM-surcharge complaints, with a revised injunctive-relief class settlement awaiting approval. Each finalization removes a discrete uncertainty and shrinks the unreserved tail. A clean resolution of the DOJ debit inquiry and the European network-fee inquiry without structural remedy would be the most powerful version of this catalyst — the removal of the one risk that reaches the moat. This is the mirror image of Risk 1: the same matters that constitute the principal downside become an upside as they clear.
Probability: Medium | Timeframe: 1–2 years for the pending settlements; open-ended for the government investigations | Monitoring trigger: Court approval of the pending class settlements, closure of the DOJ CID and European Commission inquiry, and a plateau or decline in the annual litigation provision.
2.3 Risk & Catalyst Summary
| # | Item | Type | Probability | Timeframe | Status | Monitoring Trigger |
|---|---|---|---|---|---|---|
| 1 | Antitrust litigation, DOJ U.S. debit probe & EU network-fee inquiry | Risk | High | Immediate / ongoing | Active | Trial outcomes; DOJ and EU inquiry developments; annual litigation provision |
| 2 | Direct network-fee regulation & structural pricing pressure | Risk | Medium-High | 1–2 yrs / continuous | Active | Regulatory fee-cap proposals; merchant fee reviews; incentive intensity |
| 3 | Disintermediation — public rails, CBDC/stablecoin, fintechs, payment nationalism | Risk | Medium | 3–5 yrs+ | Monitoring | Public-rail volume share; localization mandates; account-to-account adoption |
| 4 | Revenue quality — rebates & incentives estimate (sole Critical Audit Matter) | Risk | Medium | Ongoing | Active | Gross-to-net dynamics; capitalized-incentive asset vs revenue growth |
| 5 | Governance & Mastercard Foundation share overhang | Risk | Medium | Multi-year | Latent | Foundation sell-down pace; buyback absorption; disclosure prominence |
| 6 | Value-added services outgrowing the core network | Catalyst | High | Ongoing | Active | Services growth vs network growth; services share of net revenue |
| 7 | New payment flows & multi-rail expansion | Catalyst | Medium-High | 1–3 yrs | Active | Virtual-card and money-movement growth; new-flow disclosure |
| 8 | New commerce models — agentic commerce, tokenization, stablecoin rails | Catalyst | Medium | 2–5 yrs | Monitoring | Agentic/stablecoin rollout milestones; tokenized-transaction share |
| 9 | Resolution of the litigation & regulatory overhang | Catalyst | Medium | 1–2 yrs / open-ended | Monitoring | Settlement approvals; DOJ/EU closure; declining provision |
Source: Company SEC filings (10-K) and forensic footnote review; see Appendix A.1.
2.4 Risk Interdependencies
sources The risks above are not independent draws; the most important feature of Mastercard’s risk map is how tightly the regulatory, pricing and revenue-quality strands reinforce one another. An adverse ruling on network fees (Risk 1) would not stand alone — it would embolden the merchant lobby and regulators pressing on pricing (Risk 2), and because the largest customers already negotiate hard, it would likely accelerate the incentive escalation that sits at the heart of the revenue-quality concern (Risk 4): more aggressive incentives simultaneously enlarge the contra-revenue pool and stress the very estimate that is the sole Critical Audit Matter. In the same way, an adverse DOJ outcome on U.S. debit would not be a one-time cost but a template — it would invite follow-on civil claims and hand ammunition to every merchant challenge already in flight. The disintermediation and payment-nationalism strands (Risk 3) compound each other on a longer clock: a government that builds a domestic instant-payment rail is often the same government that mandates in-country switching and data localization, so the technological and political threats arrive together in a given market rather than separately.
The scenario that would be disproportionately damaging — and the one an investor should stress-test — is the simultaneous materialization of Risks 1, 2 and 3: an adverse network-fee remedy in a major market, arriving while merchant-driven fee pressure intensifies and a subsidised public rail scales in the same geography. That combination attacks pricing power and volumes at once, which is the only path by which the regulatory tail actually reaches the moat rather than merely trimming growth. Cutting across all of these is an operational amplifier not itself a top-five risk but a genuine accelerant: a material information-security breach or a prolonged switching outage would compound regulatory scrutiny, invite the critical-infrastructure supervisors that already oversee the network, and damage the brand and settlement-trust that are core to the franchise — turning an operational event into a regulatory and reputational one.
2.5 ESG & Regulatory Exposure
sources Mastercard’s material non-financial exposure is overwhelmingly the “G” and the regulatory dimension rather than the “E.” As an asset-light technology and rules platform, its direct environmental footprint is modest; the more relevant physical-risk channel is operational resilience — the vulnerability of its switching infrastructure to catastrophic and climate-linked disruption — which is better understood as an operational risk than an environmental one.
The regulatory exposure is unusually heavy and is structural to the business rather than incidental. Mastercard is supervised as systemically important payments infrastructure in multiple jurisdictions: designated a systemically important payment system in the European Union with attendant governance and risk-management obligations, a recognized payment system in the United Kingdom, and its real-time platform overseen by the Bank of England as a specified service provider, with critical-infrastructure and cyber-resilience duties in several countries and European rules requiring separation of its scheme activities from its switching and processing. On top of this sits the interchange, antitrust, network-fee, surcharging, privacy, AI, sanctions and anti-corruption regime detailed throughout the risk discussion — including evolving requirements such as the EU AI Act, data-localization mandates, and strong-authentication and third-party account-access rules under European payments law, all of which raise compliance cost and can constrain the company’s ability to leverage its data and AI assets for product innovation. The company maintains a board-supervised cybersecurity and data-responsibility program with a dedicated senior executive structure, which is appropriate given that a payments network is a standing target for organized crime and state-sponsored actors; management states it has not experienced a material breach, but the exposure is permanent and cannot be eliminated.
On the social and governance axes, three points are specific to this filing. First, Mastercard has positioned its impact strategy as commercially rational — bringing more people into the digital economy grows its own customer base — while candidly noting it draws criticism from both proponents and opponents of such initiatives and faces rising ESG-disclosure compliance cost, a genuine double-bind rather than a settled positive. Second, the governance structure carries the layered share classes, the ownership cap on Class A voting power, and the board disqualification of competitor and Foundation representatives described in Risk 5 — features that are protective of independence but also anti-takeover in effect. Third, and most concretely, the Mastercard Foundation’s multi-year, court-sanctioned diversification remains a live governance and share-register item, made slightly less prominent this year by the relocation of its related-party disclosure out of the audited financial-statement notes into the narrative section. None of these is disqualifying; together they define a company whose principal external accountability is to regulators and courts, and whose governance is built, deliberately, around managing that reality.
Section 3 — Financial Analysis & Historical Performance
sources Three-Statement Linkage Confirmation - Net Income ties (Income Statement → Cash Flow Statement): Confirmed. Net income of $14,968.0M is the starting line of the FY2025 cash-flow statement and reconciles to the income statement without adjustment. - Cash ties (Balance Sheet → Cash Flow Statement): Confirmed. The cash-flow statement rolls to the $10,566.0M of cash and equivalents reported on the FY2025 balance sheet. - Retained Earnings reconciliation: Confirmed within a minor residual. Opening retained earnings of $72,907.0M plus net income of $14,968.0M less dividends of $2,756.0M approximates closing retained earnings of $85,035.0M; the small remaining difference is consistent with equity-compensation and dividend-equivalent movements rather than a break in the linkage.
3.1A Income Statement
Source: MA 10-K FY2025, Consolidated Statements of Operations; figures per the FL model — see Appendix A.1–A.2. YoY growth rates, margins and EBITDA are analyst-computed.
CAGR Summary
| Metric | 3Y CAGR | 5Y CAGR | 10Y CAGR |
|---|---|---|---|
| Revenue | 13.8% | 16.5% | - |
| EBITDA | 15.5% | 18.3% | - |
| Net Income | 14.7% | 18.5% | - |
| Diluted EPS | 17.4% | 21.0% | - |
| FCF | 17.6% | 20.3% | - |
Source: Company SEC filings (10-K); figures per the FL model — see Appendix A.1–A.2. The FY2017–FY2025 filing window supports the 3-year and 5-year CAGRs; the 10-year column is not populated because no source filing in scope predates FY2017.
3.1B Income Statement — Analysis
sources [Rating and price target withdrawn — see the note at the top.] Anchoring the trajectory to the FY2017–FY2025 filing window makes the shape clear: revenue climbed from $12,497.0M in FY2017 to $32,791.0M in FY2025, interrupted only by the FY2020 pandemic dip when cross-border travel volume — the highest-value strand of the network — briefly collapsed. Growth is a product of three moving parts: gross dollar volume on Mastercard-branded cards, the number of switched transactions, and price/mix, with value-added services now growing faster than the core payment network. The reacceleration in FY2025 to 16.4% from 12.2% in FY2024 is genuine, but it must be read with one structural caveat that recurs through this section: reported net revenue is stated net of a very large, management-estimated pool of customer rebates and incentives — a contra-revenue of roughly the same order of magnitude as reported net payment-network revenue — and that pool has been growing. The headline growth number is therefore the residual of two large gross flows, and its quality is only as good as the estimate that nets them. This is the single most important interpretive point about Mastercard’s top line and is developed under quality of earnings below.
The margin trajectory. Operating (EBIT) margin is the profitability measure that matters for this business — there is no cost of revenue and no gross-profit subtotal to speak of — and on the surface it tells a story of relentless operating leverage, expanding from 53.4% in FY2021 to 57.6% in FY2025. A software-based network with near-zero marginal cost per incremental transaction should, in principle, widen margins as volume scales, and part of the expansion is exactly that. But the most recent step — from 55.3% in FY2024 to 57.6% in FY2025 — is materially lower in quality than it looks. On management’s own account, the great majority of that year’s margin expansion is attributable to new multi-year government-grant income that did not exist in FY2024: it appears both as an offset to general and administrative expense and in other income. Grants of this kind are lumpy, jurisdiction-specific and may not recur at the same magnitude, so the FY2025 operating margin should not be treated as a clean new baseline. This is precisely why the approved valuation deliberately models a margin below the FY2025 print — the analyst should not extrapolate a grant-assisted peak as structural operating leverage.
Major movers. 1. Revenue reacceleration (structural, with a caveat). The lift to 16.4% growth is driven by resilient domestic and cross-border volume plus faster-growing value-added services — a secular, durable driver — but it is reported after a growing incentive deduction, which can flatter or mask the underlying yield in any given year. 2. Government-grant-assisted margin expansion (partly temporary). The move to a 57.6% operating margin is, in large part, a grant-driven expense offset rather than core leverage. Strip the grants and the underlying operating margin is closer to the 55.3% recorded in FY2024 — the honest starting point for a forward model. 3. [Rating and price target withdrawn — see the note at the top.] This is a red-flag structural change, not a one-year swing: pre-tax income grew faster than net income in FY2025, and net-income growth of 16.3% sat well below the growth in pre-tax income precisely because of the higher tax take. [Rating and price target withdrawn — see the note at the top.] 4. Buyback-driven EPS compounding (structural). Diluted share count fell from 992M in FY2021 to 906M in FY2025, so diluted EPS has compounded faster than net income — EPS growth of 18.9% in FY2025 against net-income growth of 16.3%. This is a deliberate, repeatable capital-return mechanism rather than an operating result, and it is why the five-year EPS CAGR of 21.0% exceeds the net-income CAGR of 18.5%. 5. Recurring litigation provisions (permanent, not one-off). A provision for litigation judgments and settlements has appeared in the income statement in every year and is stripped out of management’s non-GAAP “adjusted” EPS as a “Special Item.” A charge that recurs annually is a recurring cost of doing business, and it is treated as such in this report.
Quality of earnings. Four disclosed items temper the reported numbers, and all four are mandatory forensic findings. [Rating and price target withdrawn — see the note at the top.] Second (red flag), the gross-to-net revenue presentation means the top line is reported after subtracting the single largest estimate in the financial statements — the rebates-and-incentives pool — which the independent auditor identified as the sole Critical Audit Matter for its degree of management judgment; revenue quality here is contingent on estimate accuracy in a way it is not for a simpler business. [Rating and price target withdrawn — see the note at the top.] Fourth (yellow flag), the FY2025 government-grant benefit is new and potentially non-recurring; isolating it is essential to avoid over-reading the operating-margin expansion. Taken together, these do not impugn the integrity of a clean, unqualified audit — but they mean the reported growth in margin and EPS is of lower quality than the headline suggests.
⚠ Items to Watch. If operating margin fails to hold above the FY2024 level of 55.3% once the government-grant tailwind lapses, it would confirm that the FY2025 expansion to 57.6% was grant-assisted rather than structural and would warrant trimming forward margin assumptions. [Rating and price target withdrawn — see the note at the top.] And if the annual litigation provision that management adjusts away continues to appear, its treatment as a permanent operating cost is reinforced rather than relaxed.
3.2A Balance Sheet
Source: MA 10-K FY2025, Consolidated Balance Sheet; figures per the FL model — see Appendix A.1–A.2. Net debt and all ratios are analyst-computed.
3.2B Balance Sheet — Analysis
sources Asset composition. Mastercard’s balance sheet is that of a technology and rules platform, not a capital-intensive operator: net PP&E of $2,303.0M in FY2025 is a rounding item against total assets of $54,157.0M, and there is no inventory to speak of because the company sells switching and services, not goods. The two features that dominate the asset side are a large and rising cash and liquid-investment position — cash and equivalents reached $10,566.0M — and a substantial goodwill-and-intangibles balance of $9,560.0M built through acquisitions of data, security and services capabilities. That intangibles balance now exceeds reported shareholders’ equity, but this is an artifact of capital return, not fragility: goodwill was tested and not impaired, and equity is depressed by cumulative buybacks, discussed next. What is genuinely growing on the asset side, and warrants monitoring, is the capitalised customer-incentive asset embedded in prepaid expenses and other assets — the upfront cost of winning and renewing card programs — which has been expanding faster than net revenue and is the balance-sheet counterpart to the revenue-quality concern.
Leverage trajectory. Financial leverage is trivial in economic terms and its optics are badly distorted by the buyback program. Net debt of $8,434.0M against EBITDA of $20,040.0M leaves net debt/EBITDA at just 0.4x — actually the lowest of the five years shown, down from 0.6x in FY2024 — and interest is covered many times over (see Section 3.4). The debt/equity ratio of 2.5x looks elevated only because the denominator is tiny: shareholders’ equity of $7,737.0M sits far below retained earnings of $85,035.0M, the gap being cumulative Class A treasury stock retired through buybacks. In other words, the company has earned and retained far more than its book equity shows; the equity line is a capital-return residual, not a measure of economic net worth. Consistent with management’s stated priority of returning the bulk of free cash flow, the senior notes carry no financial covenants, the maturity profile is well laddered with no near-term wall, and an undrawn revolver and commercial-paper program provide ample backstop liquidity. There is no covenant concern in the forensic file. Because book equity is buyback-depressed, book-value-based ratios — including book value per share of $8.54 and return on equity — should be read with caution and are not meaningful gauges of franchise value here.
Working capital. With no inventory, the conventional cash-conversion-cycle framework does not apply; the relevant lens is receivables against the customer-incentive accruals and other payables. The defining feature is that Mastercard runs structurally negative operating working capital: the large accrual for customer incentives, together with other payables, exceeds receivables, so the business is a net user of customer float and growth releases cash rather than consuming it. The current ratio has drifted to roughly parity — 1.0x in FY2025 versus 1.3x in FY2021 — precisely because these incentive and settlement-related accruals have grown with the business, which is a source of cash, not a liquidity warning. The one item to keep honest is receivables: at $4,609.0M they grew faster than the 16.4% rise in revenue, a mild divergence worth watching but not yet a concern given the collateralised, bank-counterparty nature of the network’s receivables.
⚠ Items to Watch. If net debt/EBITDA were to climb back above the 0.6x FY2024 level and keep rising, it would signal that debt-funded buybacks are outrunning cash generation and could begin to compete with the dividend for capacity. Separately, if the capitalised customer-incentive asset continues to outgrow revenue, the deferred cost of customer acquisition would build on the balance sheet and set up a future amortisation drag on margins.
3.3A Cash Flow Statement
| FY2021 | FY2022 | FY2023 | FY2024 | FY2025 | |
|---|---|---|---|---|---|
| Cash from Operations ($M) | $9,463.0M | $11,195.0M | $11,980.0M | $14,780.0M | $17,648.0M |
| — Depreciation & Amortization ($M) | $726.0M | $750.0M | $799.0M | $897.0M | $1,143.0M |
| Capital Expenditures ($M) | $814.0M | $1,097.0M | $1,088.0M | $1,194.0M | $1,215.0M |
| Free Cash Flow ($M) | $8,649.0M | $10,098.0M | $10,892.0M | $13,586.0M | $16,433.0M |
| FCF Margin | 45.8% | 45.4% | 43.4% | 48.2% | 50.1% |
| FCF / Share | $8.72 | $10.40 | $11.51 | $14.66 | $18.14 |
| FCF Conversion (FCF/NI) | 99.6% | 101.7% | 97.3% | 105.5% | 109.8% |
| CapEx / Revenue | 4.3% | 4.9% | 4.3% | 4.2% | 3.7% |
| CapEx / D&A | 1.1x | 1.5x | 1.4x | 1.3x | 1.1x |
| Dividends Paid ($M) | $1,741.0M | $1,903.0M | $2,158.0M | $2,448.0M | $2,756.0M |
| Share Repurchases ($M) | $5,904.0M | $8,753.0M | $9,032.0M | $11,035.0M | $11,727.0M |
Source: MA 10-K FY2025, Consolidated Statements of Cash Flows; figures per the FL model — see Appendix A.1–A.2. FCF, margins, conversion and per-share figures are analyst-computed.
3.3B Cash Flow — Analysis
sources Quality of operating cash flow. Cash generation is the clearest evidence of the franchise’s quality and it is improving, not merely holding. Operating cash flow reached $17,648.0M in FY2025, up from $9,463.0M in FY2021, and free cash flow of $16,433.0M translated into an FCF margin of 50.1% — half of every revenue dollar converts to free cash. Critically, FCF conversion sits above net income, at 109.8% in FY2025, meaning the company earns more cash than it books as accounting profit. That is notable because it is achieved despite the largest single working-capital use being the upfront cash paid for customer incentives that is capitalised to the balance sheet and amortised over the life of each deal. The forensic file flags this as the dominant operating cash drag and rightly frames it as a watch item rather than a red flag today: OCF comfortably exceeds net income, but the pace at which capitalised incentives are growing — faster than net revenue — is exactly the dynamic that would begin to erode conversion if new-deal capitalisation slowed or amortisation stepped up. Free-cash-flow quality should be assessed net of these incentive flows, and on that basis it remains high.
CapEx analysis. Reinvestment intensity is strikingly light and falling as a share of the business: capital expenditure of $1,215.0M was just 3.7% of revenue in FY2025, down from 4.3% in FY2021. Capex has run close to depreciation and amortisation — a capex/D&A ratio of 1.1x in FY2025 — indicating the company is investing at roughly maintenance-plus levels rather than in a heavy build-out. One nuance materially understates how asset-light the operation truly is: the capex figure here includes capitalised software development, which is the larger half of the total. Stripped to physical property and equipment, the network’s true fixed-asset intensity is smaller still, which is why PP&E barely moves on the balance sheet. The real “investment” in this model is not capex at all but the capitalised customer incentives discussed above — a point that reframes where the growth spend actually sits.
Capital allocation. The allocation of free cash flow is unambiguous and consistent with a mature, high-return franchise: reinvestment is a light call on cash, so the overwhelming majority of FCF is returned to shareholders, decisively tilted toward buybacks over dividends. In FY2025, share repurchases of $11,727.0M ran at several times the dividend of $2,756.0M, and that ratio has held across the five years shown. The buyback is not idle financial engineering — by steadily retiring Class A shares it is the mechanism that compounds EPS ahead of net income, and it simultaneously absorbs the natural share supply created by the Mastercard Foundation’s multi-year diversification sell-down. Combined dividends and buybacks were funded comfortably within FCF in FY2025, so the return program is self-financing rather than debt-dependent. Given a reinvestment opportunity set that genuinely cannot absorb much capital — the network is built — returning the balance is the correct allocation, and the five-year FCF CAGR of 20.3% shows the pool being returned is still growing briskly.
⚠ Items to Watch. Should FCF conversion slip back below parity and stay there — versus the 97.3% low of the recent window — while capitalised incentives keep outrunning revenue, it would signal that the cost of retaining customers is being deferred onto the balance sheet faster than it is being recovered, and would call the durability of the negative-working-capital cash benefit into question.
3.4 Returns Analysis
| FY2021 | FY2022 | FY2023 | FY2024 | FY2025 | |
|---|---|---|---|---|---|
| ROIC | 74.7% | 76.6% | 84.1% | 86.8% | 93.9% |
| ROE | 126.8% | 145.9% | 169.3% | 191.9% | 210.5% |
| ROA | 24.4% | 26.0% | 27.6% | 28.4% | 29.3% |
| Interest Coverage | 23.4x | 26.0x | 24.4x | 24.1x | 26.2x |
Source: Company SEC filings (10-K); figures per the FL model — see Appendix A.1–A.2. All returns metrics are analyst-computed.
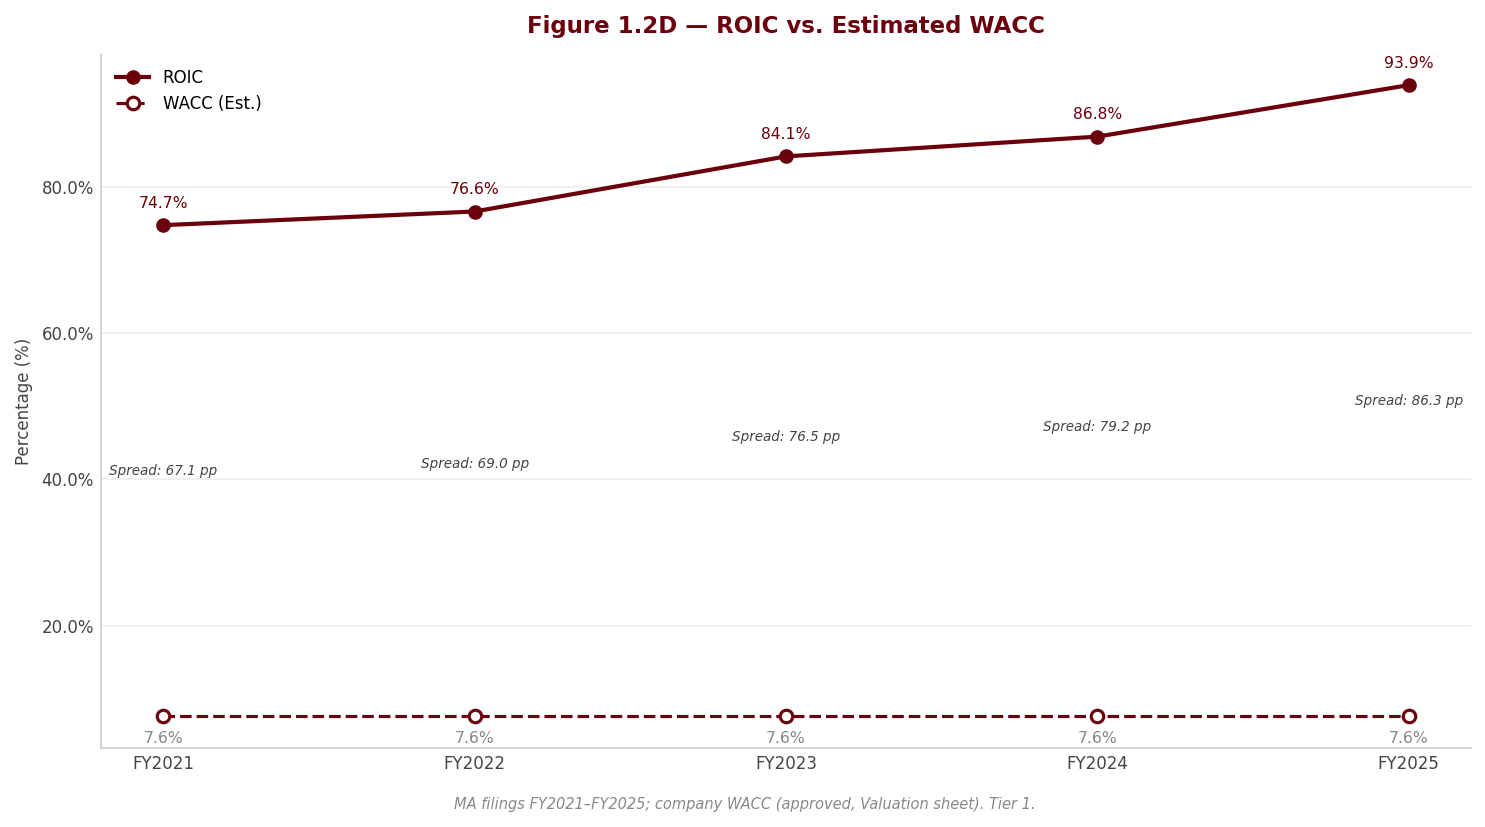
Return on invested capital is the single most important long-term metric for a franchise of this kind, and Mastercard’s is exceptional: ROIC of 93.9% in FY2025, rising steadily from 74.7% in FY2021. Against any plausible cost of capital — the WACC is a fraction of this level — the company earns an enormous positive spread, which is the quantitative signature of a wide-moat, capital-light network that can grow without consuming capital. Two honest caveats keep this in proportion. First, the ROIC level is itself flattered by a very small invested-capital base, the same buyback dynamic that depresses book equity; the spread over WACC is unambiguously large, but the absolute percentage overstates the reinvestment runway because so little capital can actually be put to work at that return. Second, return on equity of 210.5% is not a meaningful measure of franchise quality here at all — it is an arithmetic artifact of a near-eliminated equity base. Return on assets of 29.3%, which is not distorted by the equity denominator, is the cleaner corroboration that the underlying asset productivity is genuinely elite. Interest is covered 26.2x over, underscoring that the leverage optics carry no real credit risk.
The DuPont decomposition makes the ROE distortion explicit. Return on equity resolves into a net margin of 45.6%, an asset turnover of 0.64x (stated on average assets, the basis the DuPont identity requires, and therefore slightly above the period-end figure shown in the peer table in Section 5.3), and an equity multiplier of 7.19x. The genuine economic driver is the net margin — a level few businesses of any size achieve — while asset turnover is modest, reflecting the large liquid-investment and settlement-related assets the network carries. The swing factor that pushes ROE into triple digits is neither of those: it is the equity multiplier of 7.19x, produced not by operating leverage but by the cumulative buybacks that have shrunk the equity base. In plain terms, the extraordinary ROE headline is a capital-structure outcome, not evidence of incremental operating quality; the margin and the ROA are where the real quality shows.
3.5 Altman Z-Score (Most Recent FY)
| Component | FY2023 | FY2024 | FY2025 |
|---|---|---|---|
| X1 (Working Capital / Total Assets) | 0.064 | 0.010 | 0.015 |
| X2 (Retained Earnings / Total Assets) | 1.474 | 1.516 | 1.570 |
| X3 (EBIT / Total Assets) | 0.330 | 0.324 | 0.349 |
| X4 (Equity / Total Liabilities) | 0.195 | 0.156 | 0.167 |
| X5 (Revenue / Total Assets) | 0.591 | 0.586 | 0.605 |
| Z-Score | 2.99 | 2.95 | 3.10 |
| Zone | Safe | Safe | Safe |
Source: Company SEC filings (10-K); figures per the FL model — see Appendix A.1–A.2. Z-Score and components are analyst-computed.
The Altman Z-Score places Mastercard in the safe zone throughout the recent window, at 3.10 in FY2025 — above the model’s 2.90 safe boundary, up from 2.95 in FY2024. The credit implication is that the model sees negligible distress risk, which is consistent with the covenant-free, well-laddered debt profile, the ample undrawn liquidity, and interest coverage above 26.2x noted above. One interpretive caveat cuts in the company’s favour: the score is actually held back by the same buyback dynamic that runs through this section — the equity-to-liabilities component (X4) is depressed by the near-eliminated book equity, and the working-capital component (X1) is minimal because the business deliberately runs lean working capital. A more economically representative view of Mastercard’s balance-sheet resilience would score higher still. In short, the Z-Score corroborates what the rest of the section establishes: whatever the genuine risks to this investment, balance-sheet and credit fragility is emphatically not among them — the exposure lies in the regulatory and revenue-quality domains discussed above, not in solvency.
4. Valuation withdrawn
This section stated what the shares were worth and what to do about them. It rested on an exit multiple set by hand — across the coverage it averaged 24% below where each company actually traded — so the conclusion largely restated that assumption instead of testing it. Rather than leave it standing, it has been withdrawn while the method is rebuilt.
Nothing else in this report depends on it: the financial analysis above and below is drawn from the company's own filings, and every figure links to the page it was verified against.
Section 5 — Financial Metrics & Peer Benchmarking
5.1 Peer Selection
sources The peer set for Mastercard is deliberately narrow — two names, chosen for structural relevance rather than breadth. A padded comparables table of payment-adjacent tickers would dilute, not sharpen, the only comparison that matters: how the world’s second-largest four-party payment network stacks up against the first.
Visa Inc. is the only genuine like-for-like. It is the other global four-party network, running the same open-loop, capital-light switching model, earning the same volume-, transaction- and mix-driven revenue, and carrying the same near-zero marginal cost per incremental transaction. Operating margin, net margin, ROIC, growth and valuation multiples are all directly comparable to Mastercard’s — with one timing caveat: Visa’s fiscal year ends in September, three months ahead of Mastercard’s December year-end, so its FY2025 spans roughly October 2024 to September 2025. The comparison is therefore one quarter offset, which matters most for fast-moving items such as revenue growth and incentive timing; it is not re-cut to a December basis.
American Express is included as the mandated different-model contrast, not as a like-for-like. Amex is a three-party (closed-loop) network that also issues cards, takes consumer and commercial credit risk, and earns net interest income — funded largely by customer deposits rather than corporate borrowing. It reports revenue net of interest expense, prints no operating-income or EBIT subtotal, and does not classify its balance sheet into current and non-current. As a consequence, operating margin, EBITDA margin, FCF margin, ROIC, net-debt/EBITDA, interest coverage, current ratio, EV/EBITDA, FCF yield and DSO are simply not meaningful for Amex and are not shown. Amex earns its place in the table on the handful of measures that are comparable across all three — net margin, ROE, revenue growth and P/E — and nowhere else.
The processors and wallets a reader might expect — Fiserv, Global Payments, PayPal and the hybrid lender-network Discover — were considered and excluded. [Rating and price target withdrawn — see the note at the top.] A clean two-peer set is the right answer here.
| Peer | Ticker | Exchange | Filing Type | Accounting Standard | Fiscal Year End | Comparability Note |
|---|---|---|---|---|---|---|
| Visa Inc. | V | NYSE | 10-K | US GAAP | September | True four-party-network like-for-like; ~3-month fiscal offset (Sep year-end) — treat as one quarter lagged. |
| American Express Company | AXP | NYSE | 10-K | US GAAP | December | Three-party network and lender; revenue net of interest, no EBIT line — comparable only on net margin, ROE, growth and P/E. |
Source: Peer-company SEC filings; comparability notes in 5.7 — see Appendix A.1.
5.2 Profitability Comparison
sources Comparative: Most Recent Full Fiscal Year
| Metric | Mastercard Incorporated | Visa Inc. | American Express Company |
|---|---|---|---|
| Revenue ($M) | $32,791.0M | $40,000.0M | $72,229.0Mᴺ |
| EBITDA Margin | 61.1% | 63.0%ᶜ | — |
| EBIT (Operating) Margin | 57.6% | 60.0% | — |
| Net Margin | 45.6% | 50.1% | 15.0% |
| FCF Margin | 50.1% | 53.9%ᶜ | — |
Source: Peer-company SEC filings; comparability notes in 5.7 — see Appendix A.1.
Legend: ᶜ = analyst-computed from filing components; ᴺ = Amex revenue is stated net of interest expense (a lender), not gross of funding cost like the networks; — = metric not meaningful for a three-party lender (see 5.7). Mastercard, Visa and Amex report no cost-of-revenue line or gross-profit subtotal, so that profitability line does not exist anywhere in this set and the row is omitted rather than shown blank.
Historical: Mastercard Own 5-Year Progression
| Metric | FY2021 | FY2022 | FY2023 | FY2024 | FY2025 |
|---|---|---|---|---|---|
| EBITDA Margin | 57.2% | 58.5% | 59.0% | 58.5% | 61.1% |
| EBIT (Operating) Margin | 53.4% | 55.2% | 55.8% | 55.3% | 57.6% |
| Net Margin | 46.0% | 44.7% | 44.6% | 45.7% | 45.6% |
| FCF Margin | 45.8% | 45.4% | 43.4% | 48.2% | 50.1% |
Source: Peer-company SEC filings; comparability notes in 5.7 — see Appendix A.1.
The honest profitability comparison in this set is Mastercard against Visa, and on the measure that defines a payment network — operating margin — Visa runs the structurally higher number: an operating margin of 60.0% against Mastercard’s 57.6% in FY2025, with the same ordering at the EBITDA line (63.0%ᶜ versus 61.1%). The gap is real and it is longstanding. [Rating and price target withdrawn — see the note at the top.] In other words, part of Mastercard’s margin “shortfall” versus Visa is the price of a faster-diversifying revenue base, not operational slack.
Two caveats keep the comparison honest, and both cut against Mastercard’s reported figure rather than for it. First, the ~3-month fiscal offset means Visa’s FY2025 is not contemporaneous with Mastercard’s, so the point-in-time margin gap should be read as directional. Second, and more important, Mastercard’s FY2025 operating margin was flattered by roughly two percentage points of new, multi-year government-grant income that did not exist in FY2024 — recognised partly as an offset to general-and-administrative expense and partly in other income. Strip that grant benefit out, as Section 3 does, and Mastercard’s underlying operating margin sits closer to the 55.3% it recorded in FY2024 — which means the true operating-margin gap to Visa is wider than the headline 57.6%-versus-60.0% comparison implies, and the FY2025 step-up is lower-quality than a clean read of the table would suggest. The gap to Visa is not closing on an underlying basis; it is being partially and temporarily masked by grant income. A further interpretive point applies to both networks equally but is worth restating: reported revenue for Mastercard (and Visa) is stated net of a very large, management-estimated pool of customer rebates and incentives — for Mastercard the single largest estimate in the financial statements and the auditor’s sole Critical Audit Matter — so every margin in this table is computed on a net-revenue denominator whose composition depends on that estimate.
On net margin the picture narrows and then diverges by model. Mastercard’s 45.6% sits below Visa’s 50.1% — a smaller gap than at the operating line, reflecting differences in tax and financing rather than core economics — while American Express, at 15.0%, earns roughly a third of the networks’ net margin. That is not underperformance; it is the arithmetic of a fundamentally different business. Amex carries the cost of funding, credit provisions and the operating expense of actually issuing cards, none of which touch a pure network’s income statement, so its net margin is the correct measure to compare but a low one by design. [Rating and price target withdrawn — see the note at the top.]
5.3 Returns Comparison
sources Comparative: Most Recent Full Fiscal Year
| Metric | Mastercard Incorporated | Visa Inc. | American Express Company |
|---|---|---|---|
| ROIC | 93.9% | 42.4%ᶜ | — |
| ROE | 210.5% | 52.1%ᶜ | 34.0%ᶜ |
| ROA | 29.3% | 20.7%ᶜ | 3.8%ᶜ |
| Asset Turnover (period-end assets) | 0.61x | 0.40xᶜ | 0.24xᶜ |
Source: Peer-company SEC filings; comparability notes in 5.7 — see Appendix A.1.
Legend: ᶜ = analyst-computed from filing components; — = not meaningful for a three-party lender. Amex ROA and asset turnover are shown for completeness but reflect a large, asset-heavy lending balance sheet and are not comparable to the capital-light networks (see 5.7). Asset turnover here is stated on period-end assets for cross-company comparability; the DuPont decomposition in Section 3.4 states it on average assets, which is the basis that identity requires, so the two figures differ slightly by construction.
Historical: Mastercard Own 5-Year Progression
| Metric | FY2021 | FY2022 | FY2023 | FY2024 | FY2025 |
|---|---|---|---|---|---|
| ROIC | 74.7% | 76.6% | 84.1% | 86.8% | 93.9% |
| ROE | 126.8% | 145.9% | 169.3% | 191.9% | 210.5% |
| ROA | 24.4% | 26.0% | 27.6% | 28.4% | 29.3% |
Source: Peer-company SEC filings; comparability notes in 5.7 — see Appendix A.1.
Both networks earn returns on invested capital that dwarf any plausible cost of capital — Mastercard’s ROIC of 93.9% and Visa’s 42.4%ᶜ both sit an order of magnitude above the 7.61% WACC — which is the quantitative signature of two wide-moat, capital-light franchises that grow without consuming capital. Mastercard’s ROIC screens well above Visa’s, but the reader should not over-read that lead: as Section 3 established, Mastercard’s return metrics are flattered by a very small invested-capital and equity base, itself a product of years of aggressive buybacks that have retired Class A stock and shrunk the denominator. The spread over WACC is unambiguously enormous for both; the absolute percentage gap between the two says more about capital structure and cumulative repurchases than about any difference in underlying asset productivity.
That distortion is most extreme, and least meaningful, at the ROE line. Mastercard’s 210.5% return on equity is not evidence of superior operating quality over Visa’s 52.1%ᶜ or Amex’s 34.0%ᶜ — it is an arithmetic artifact of a near-eliminated book-equity base, and Section 3’s DuPont decomposition shows the swing factor is the equity multiplier, not margin or turnover. The cleaner cross-sectional read is ROA, which is not distorted by the equity denominator: Mastercard’s 29.3% comfortably exceeds Visa’s 20.7%ᶜ, corroborating genuinely elite underlying asset productivity, and the modest edge over Visa is consistent with Mastercard’s higher asset turnover (0.61x versus 0.40xᶜ). American Express’s ROA of 3.8%ᶜ and asset turnover of 0.24xᶜ are shown only for completeness: they reflect an asset-heavy lending balance sheet many times the size of a pure network’s, and comparing them to a network that carries almost no earning assets would be a category error, not a verdict on management. Mastercard’s own five-year progression — ROIC climbing from 74.7% to 93.9% and ROA from 24.4% to 29.3% — confirms the trend is genuinely upward, even before the buyback-driven denominator effect is stripped out.
5.4 Leverage & Liquidity Comparison
sources Comparative: Most Recent Full Fiscal Year
| Metric | Mastercard Incorporated | Visa Inc. | American Express Company |
|---|---|---|---|
| Net Debt / EBITDA | 0.4x | 0.3xᶜ | — |
| Total Debt / Equity | 2.5x | 0.7xᶜ | 1.7xᶜ |
| Interest Coverage | 26.2x | 40.7xᶜ | — |
| Current Ratio | 1.0x | 1.1xᶜ | — |
| FCF Margin | 50.1% | 53.9%ᶜ | — |
Source: Peer-company SEC filings; comparability notes in 5.7 — see Appendix A.1.
Legend: ᶜ = analyst-computed from filing components; — = not meaningful for a three-party lender. Amex’s debt/equity is shown but its reported debt excludes its customer-deposit funding base, its primary source of funding — see 5.7.
Both networks carry trivial economic leverage. On the measure that reflects genuine credit capacity — net debt against EBITDA — Mastercard sits at 0.4x and Visa marginally lower at 0.3xᶜ; on either figure, debt is a fraction of a single year’s cash earnings, and interest is covered many times over (26.2x at Mastercard, 40.7xᶜ at Visa). Neither network faces any solvency question, consistent with Mastercard’s safe-zone Altman score and covenant-free debt profile in Section 3.
The one figure in this table that invites a false conclusion is total debt/equity, where Mastercard’s 2.5x towers over Visa’s 0.7xᶜ. This is not a sign that Mastercard is more aggressively levered; it is the same denominator distortion that runs through the returns section. Mastercard’s book equity has been shrunk to a sliver by cumulative buybacks, so any debt load looks large against it — the ratio is a capital-return artifact, not a measure of balance-sheet risk. Visa, which has repurchased stock less aggressively relative to its equity base, carries a more conventional-looking ratio. Read alongside net-debt/EBITDA and interest coverage, the correct conclusion is that both networks are under-levered relative to their cash-generative capacity, with Mastercard’s higher debt/equity reflecting a more complete return of capital rather than more risk. American Express is deliberately absent from the leverage lines that assume a corporate balance sheet: its reported debt/equity of 1.7xᶜ excludes its customer-deposit funding base — its single largest source of funding — and its cash is mostly interbank operating liquidity, so a net-debt or coverage figure for a bank-like lender would not be comparable to the networks and is not carried. Both networks also convert profits to cash prodigiously, with Mastercard’s FCF margin of 50.1% just below Visa’s 53.9%ᶜ — the liquidity that makes the light leverage a choice rather than a constraint.
5.5 Valuation Multiples Comparison
sources Comparative: Current Price
| Metric | Mastercard Incorporated | Visa Inc. | American Express Company |
|---|---|---|---|
| EV/EBITDA | 25.4x | 27.1xᵐ | — |
| P/E (LTM) | 34.6x | 33.7xᵐ | 22.2xᵐ |
| FCF Yield | 3.3% | 3.2%ᵐ | — |
Source: Peer-company SEC filings; comparability notes in 5.7 — see Appendix A.1.
Legend: ᵐ = market-sourced (approximate, ~Aug 2026 quote-based market caps applied to FY2025 filing fundamentals); — = not meaningful for a three-party lender. All peer valuation multiples move with price.
Historical: Mastercard EV/EBITDA (period-end price)
| FY2021 | FY2022 | FY2023 | FY2024 | FY2025 |
|---|---|---|---|---|
| 33.6x | 26.5x | 27.7x | 30.2x | 26.2x |
Source: Peer-company SEC filings; comparability notes in 5.7 — see Appendix A.1.
Against Visa, Mastercard and the market price the two networks almost identically — as they should, given near-identical business models. Mastercard trades at 25.4x EV/EBITDA versus Visa’s 27.1xᵐ, and on a slight P/E premium (34.6x versus 33.7xᵐ) with an essentially matched FCF yield (3.3% against 3.2%ᵐ). The modest P/E premium to Visa is defensible on Mastercard’s faster FY2025 revenue growth of 16.4% and its larger value-added-services growth engine, though a disciplined buyer should remember two things: the P/E is levered by the same buyback dynamic that inflates ROE, and the growth premium is partly a function of the government-grant and net-of-incentive revenue effects flagged above rather than a clean operating comparison. These are not two cheap stocks — both sit in the mid-twenties on EV/EBITDA and north of thirty times earnings — but they are consistently and rationally priced relative to each other.
American Express prices in a different universe, at 22.2xᵐ — a large discount to the networks’ P/E — and no EV/EBITDA or FCF yield is shown because neither is meaningful for a deposit-funded lender. That discount is not a signal that Amex is “cheaper” than Mastercard in any actionable sense; it is the market correctly assigning a lower multiple to a business that carries credit risk, funding cost and the cyclicality of a lending book, versus the toll-road economics of a pure network. Placed against Mastercard’s own history, the more useful signal is the EV/EBITDA path: at 26.2x on the FY2025 period-end price, Mastercard sits at the low end of its own five-year range — down from 33.6x in FY2021 and below the 30.2x of FY2024 — so the current multiple is neither stretched versus history nor versus its only true peer.
5.6 Efficiency Comparison
| Metric | Mastercard Incorporated | Visa Inc. | American Express Company |
|---|---|---|---|
| Days Sales Outstanding | 47 days | 26 daysᶜ | — |
| CapEx / Revenue | 3.7% | 3.7%ᶜ | 3.4%ᶜ |
Source: Peer-company SEC filings; comparability notes in 5.7 — see Appendix A.1.
Legend: ᶜ = analyst-computed from filing components; — = not applicable. Inventory-days, days-payable and the cash-conversion-cycle are omitted for the whole set: none of these businesses carries inventory and neither network reports a cost-of-revenue line to anchor payables (see 5.7).
The efficiency comparison is thin by nature — these are asset-light, inventory-free businesses, so the traditional working-capital cycle does not exist and is not manufactured here. On receivables, Mastercard’s 47 days of days-sales-outstanding is longer than Visa’s 26 daysᶜ, but the two are not on the same basis: Visa’s figure uses trade accounts receivable only and excludes its large settlement receivable, while Mastercard’s is computed on total receivables. The row is directional at best, and no fine-grained working-capital conclusion should be drawn from it; Amex is not shown because its “receivables” are a Card Member lending book, not trade receivables. On reinvestment intensity the three are strikingly close — Mastercard at 3.7% of revenue, Visa at 3.7%ᶜ and Amex at 3.4%ᶜ — confirming that light capital intensity is a shared feature of the payments industry rather than a Mastercard-specific edge. As Section 3 noted, Mastercard’s capex figure itself flatters to deceive in the other direction: it includes capitalised software development, so the network’s true physical-asset intensity is lighter still, and the genuine “growth investment” in this model sits in capitalised customer incentives rather than in capex.
5.7 Comparability Caveats
sources This peer set is usable only because its limits are stated plainly. Four issues are material and shape every table above; three are informational but still bear on interpretation.
C001 — American Express is a different business (MATERIAL). Amex is a three-party network that also issues cards, takes credit risk and earns net interest income, funded largely by customer deposits — its single largest source of funding. It reports revenue net of interest expense, prints no operating-income/EBIT subtotal, and does not classify its balance sheet. Consequently EBIT margin, EBITDA margin, FCF margin, ROIC, net-debt/EBITDA, interest coverage, current ratio, EV/EBITDA, FCF yield and DSO are not meaningful for Amex and are shown as “—” throughout, not as zeros or blanks implying underperformance. Amex is compared to Mastercard only on net margin, ROE, revenue growth and P/E; its lower net margin and P/E reflect its model, not weaker execution. Its ROA and asset turnover, where shown, describe a lending balance sheet many times the size of a network’s and are not comparable to a capital-light network.
C002 — Visa’s fiscal year is offset by three months (MATERIAL). Visa’s year ends September 30; Mastercard’s and Amex’s end December 31. Visa’s FY2025 therefore covers roughly October 2024 to September 2025 — about a quarter behind the subject. All Visa figures are the as-reported FY2025 (September) numbers and are not re-cut to a December basis. [Rating and price target withdrawn — see the note at the top.]
C003 — No cost-of-revenue, inventory-days or cash-conversion-cycle metrics exist for this set (MATERIAL). None of Mastercard, Visa or Amex reports a cost-of-revenue line or a gross-profit subtotal, so that profitability line does not exist for any name — the row is omitted across the section rather than shown against a blank subject. None carries inventory, so days-inventory-outstanding and the cash-conversion cycle are meaningless and omitted. Days-payable-outstanding is anchored to cost of goods sold, which the networks do not report, so it too is omitted. The shared profitability measures are operating margin (Mastercard and Visa only) and net margin (all three); readers should not expect a working-capital-cycle comparison that does not exist for these businesses.
C004 — Amex leverage and cash-flow figures are not comparable (MATERIAL). Amex’s reported total debt excludes its customer-deposit funding base — its single largest source of funding, so its debt/equity of 1.7xᶜ understates its true funding leverage and is not on the same basis as the networks’ corporate debt. Its large cash balance is mostly interest-bearing interbank deposits — a bank’s operating liquidity, not surplus cash — so a net-debt figure is not meaningful. And its operating cash flow excludes the growth in Card Member loans and receivables (classified in investing), so an Amex “free cash flow” is not free cash to equity in the network sense; accordingly no Amex FCF margin or FCF yield is carried anywhere in this section.
C005 — The peer set is intentionally limited to two names (informational). Visa is the only genuine four-party-network like-for-like; Amex is the mandated different-model contrast. [Rating and price target withdrawn — see the note at the top.] A reader expecting a longer table should read the brevity as deliberate rigour, not omission.
C006 — Peer valuation multiples are market-sourced approximations (informational). EV/EBITDA, P/E and FCF yield for the peers are Tier-2 figures: market capitalisations are approximate, dated around August 2026, drawn from public quote aggregators solely to obtain market cap, then combined with FY2025 filing fundamentals (EBITDA, EPS, FCF and balance-sheet debt from the primary filings). They therefore mix a current price against FY2025 fundamentals and will move with the market; treat them as snapshots, not precise point-in-time-matched multiples.
C007 — DSO is only loosely comparable (informational). Visa’s DSO uses trade accounts receivable only and excludes its settlement receivable, while Mastercard’s uses total receivables; Amex’s is not applicable. The DSO row is directional and should not carry a fine-grained working-capital conclusion.
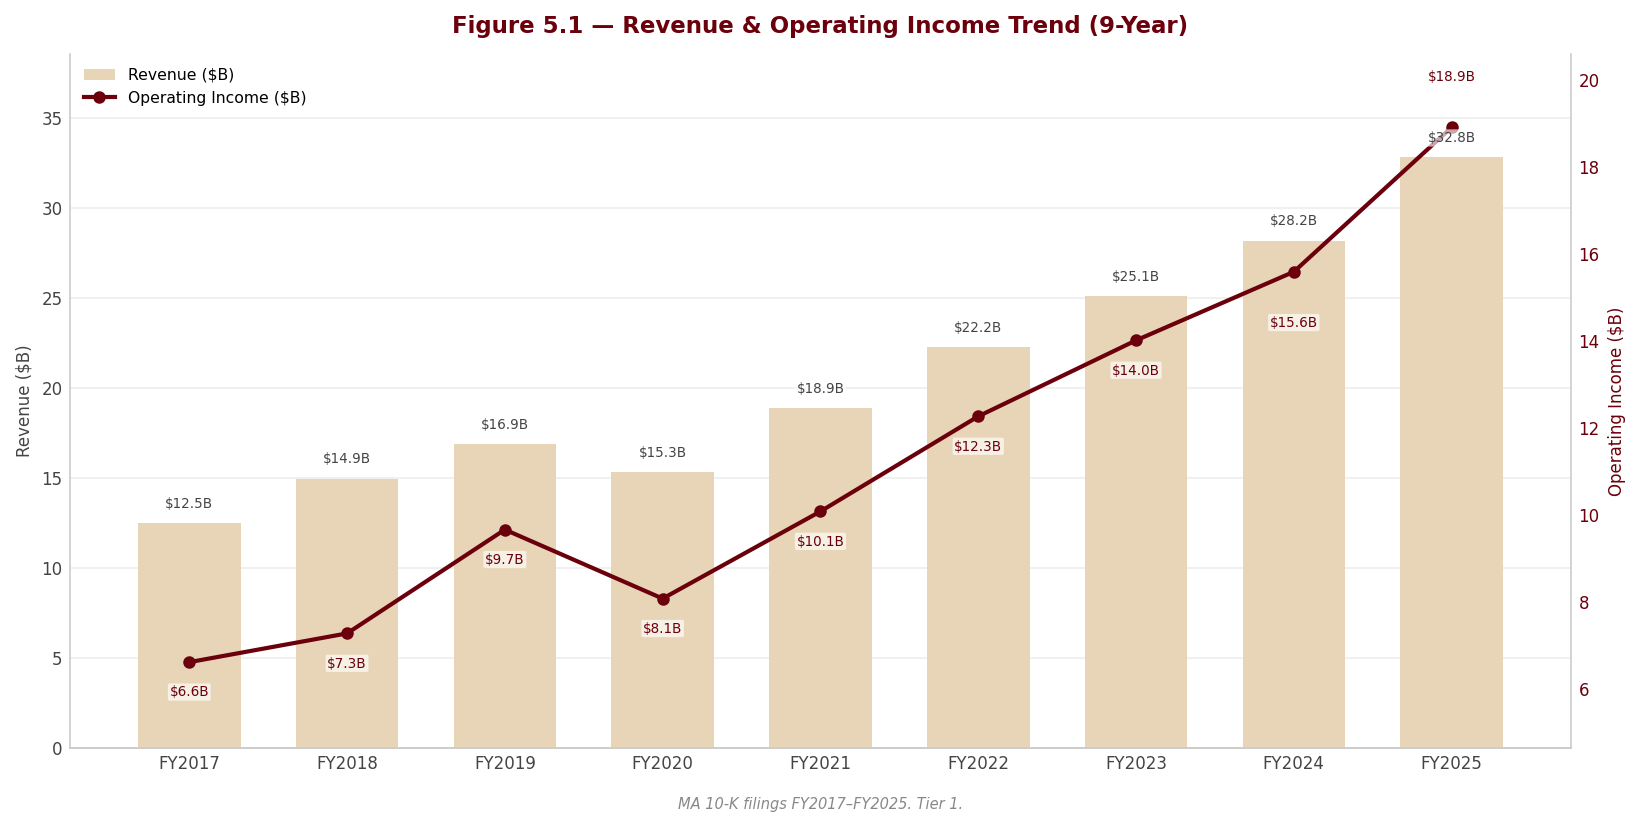
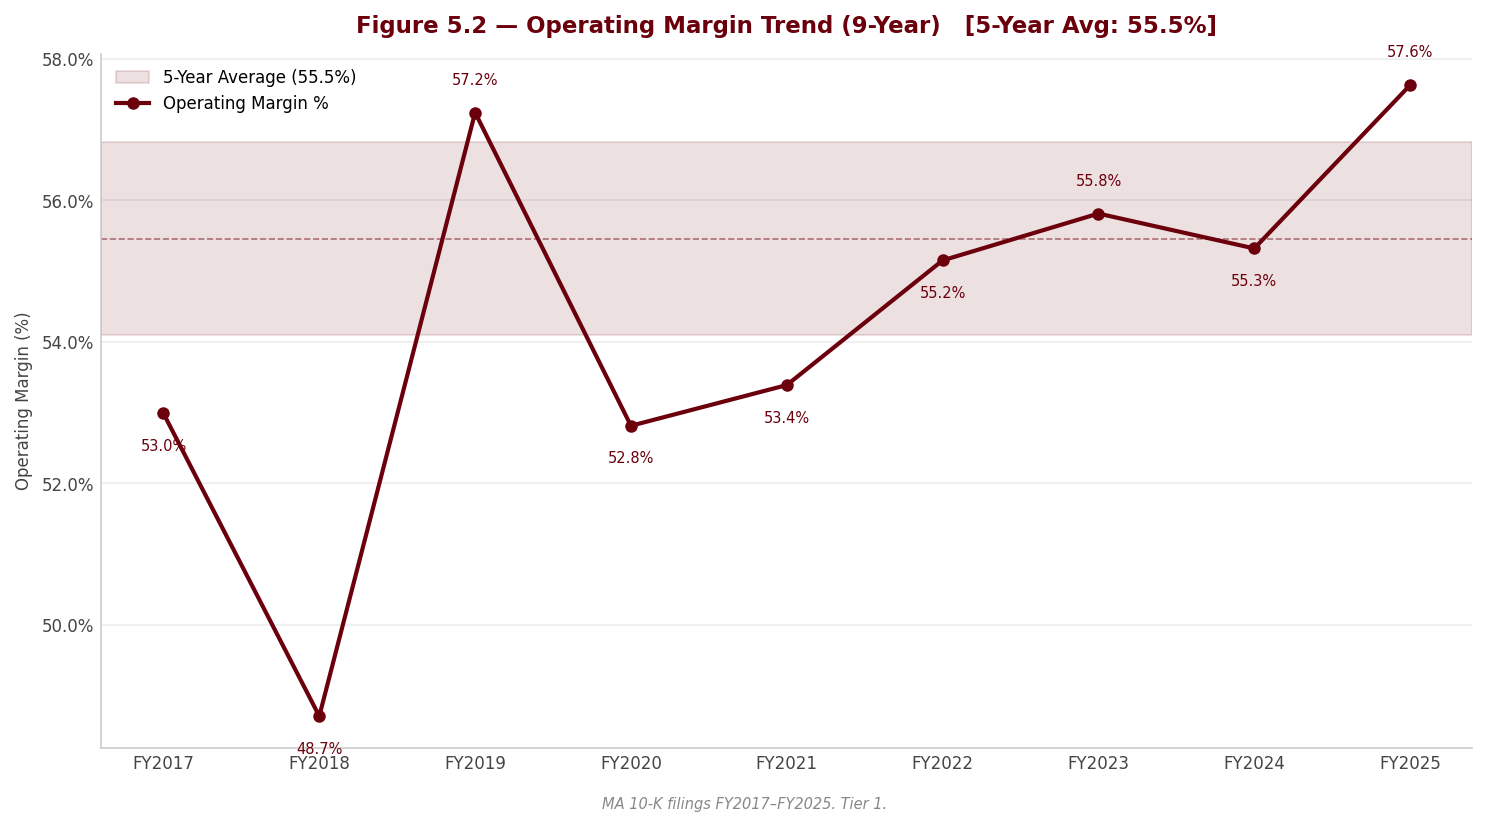
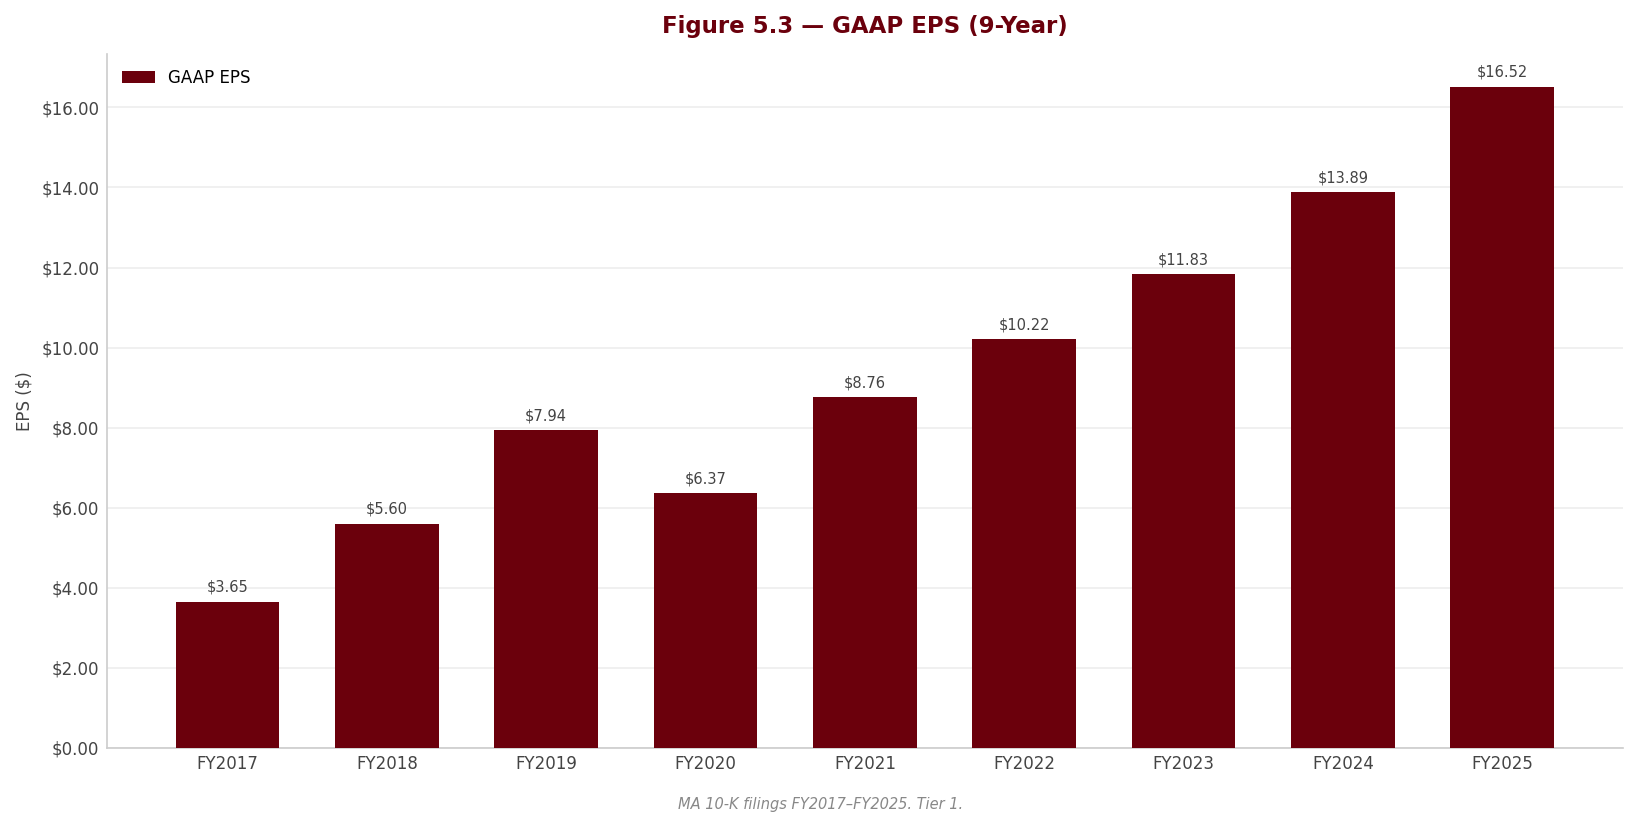
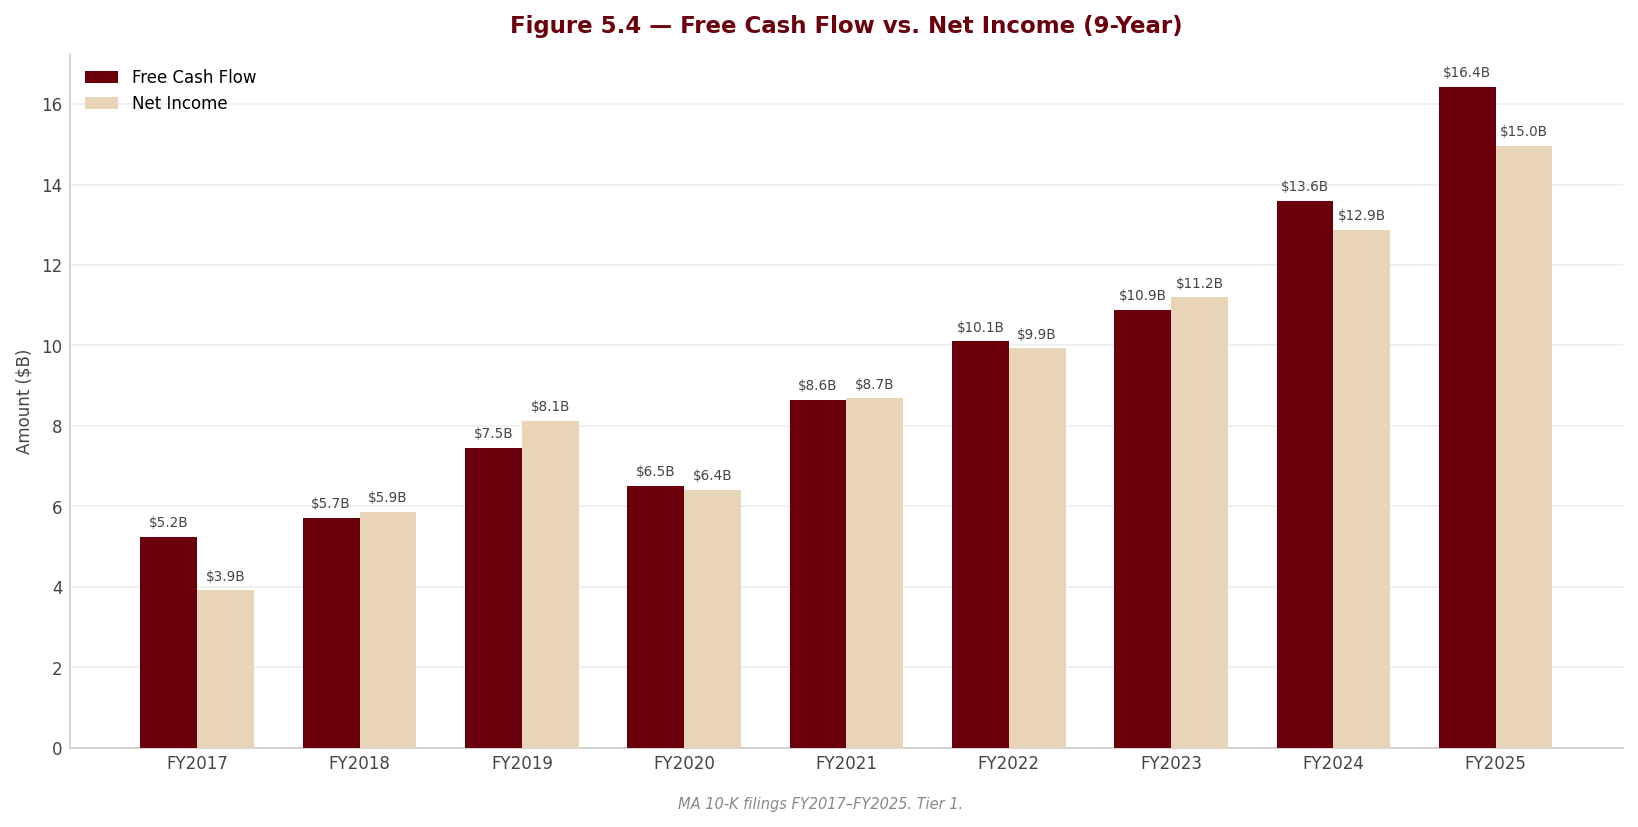
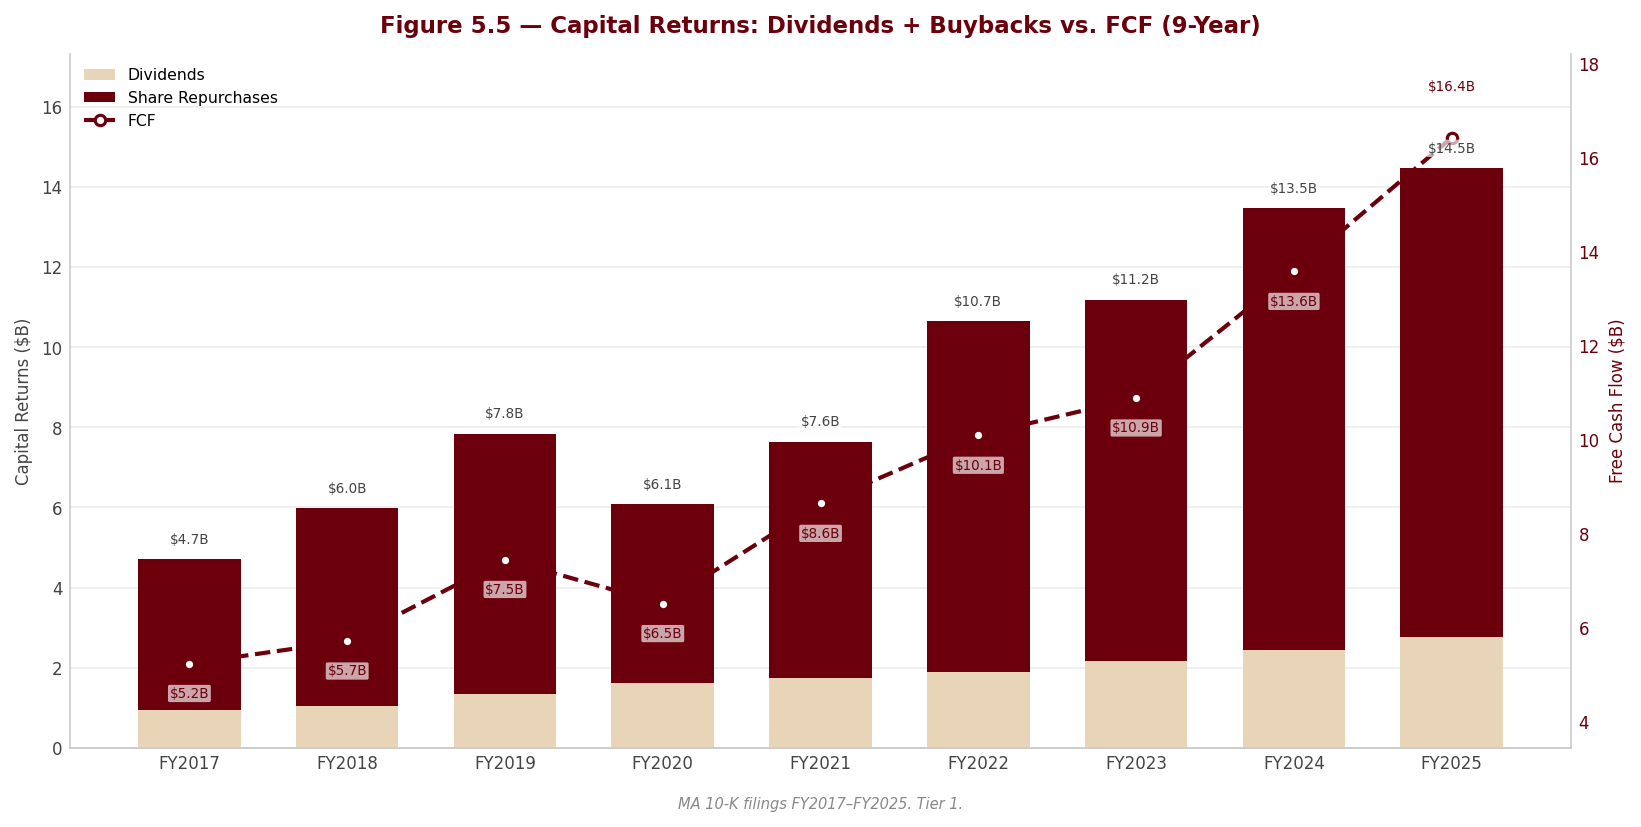
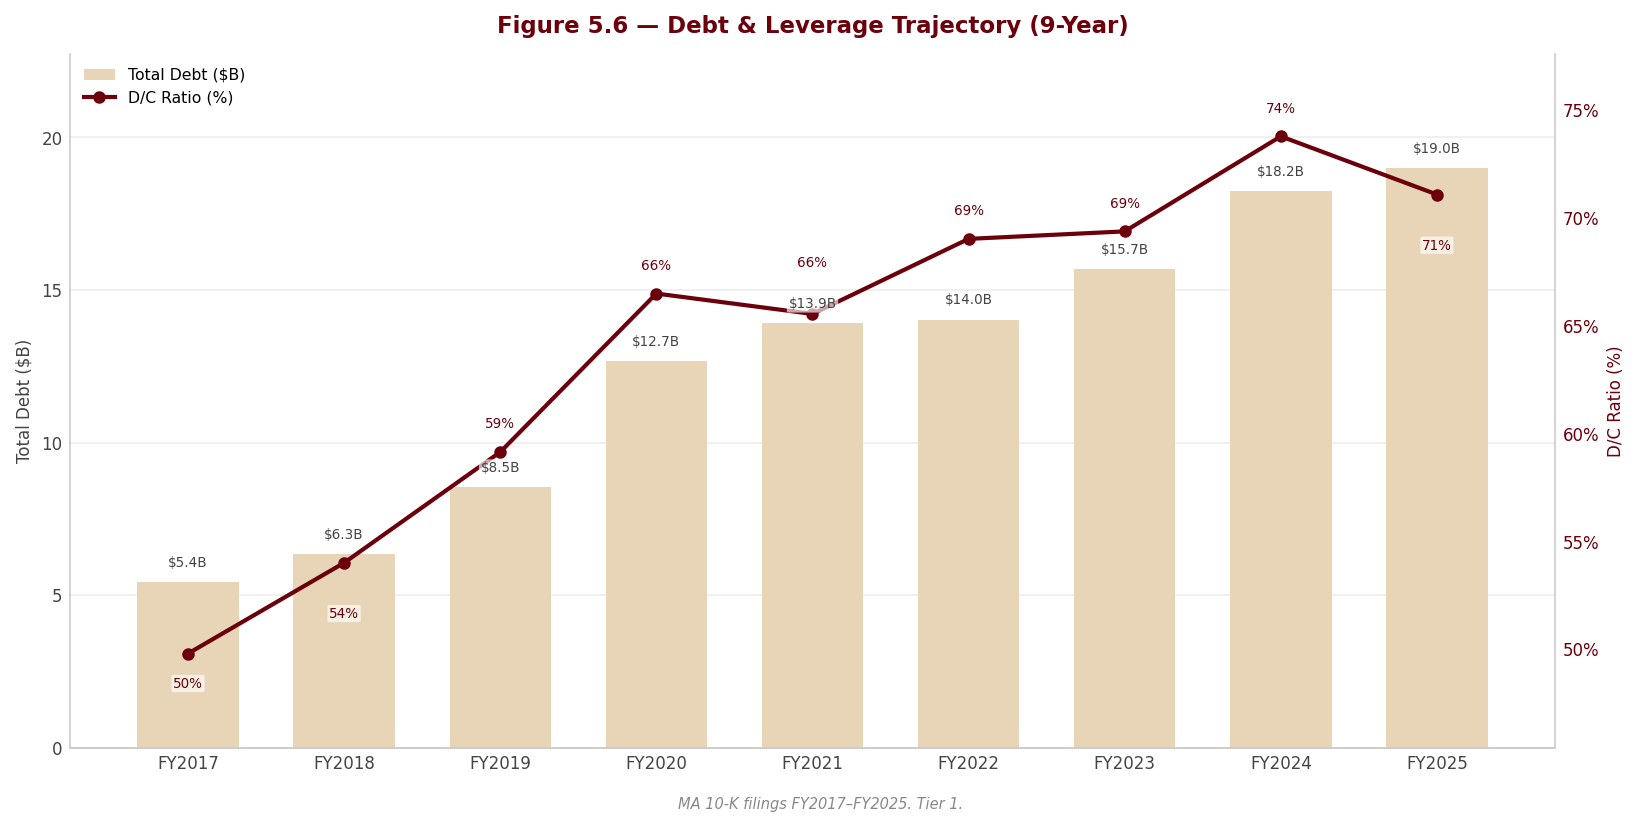
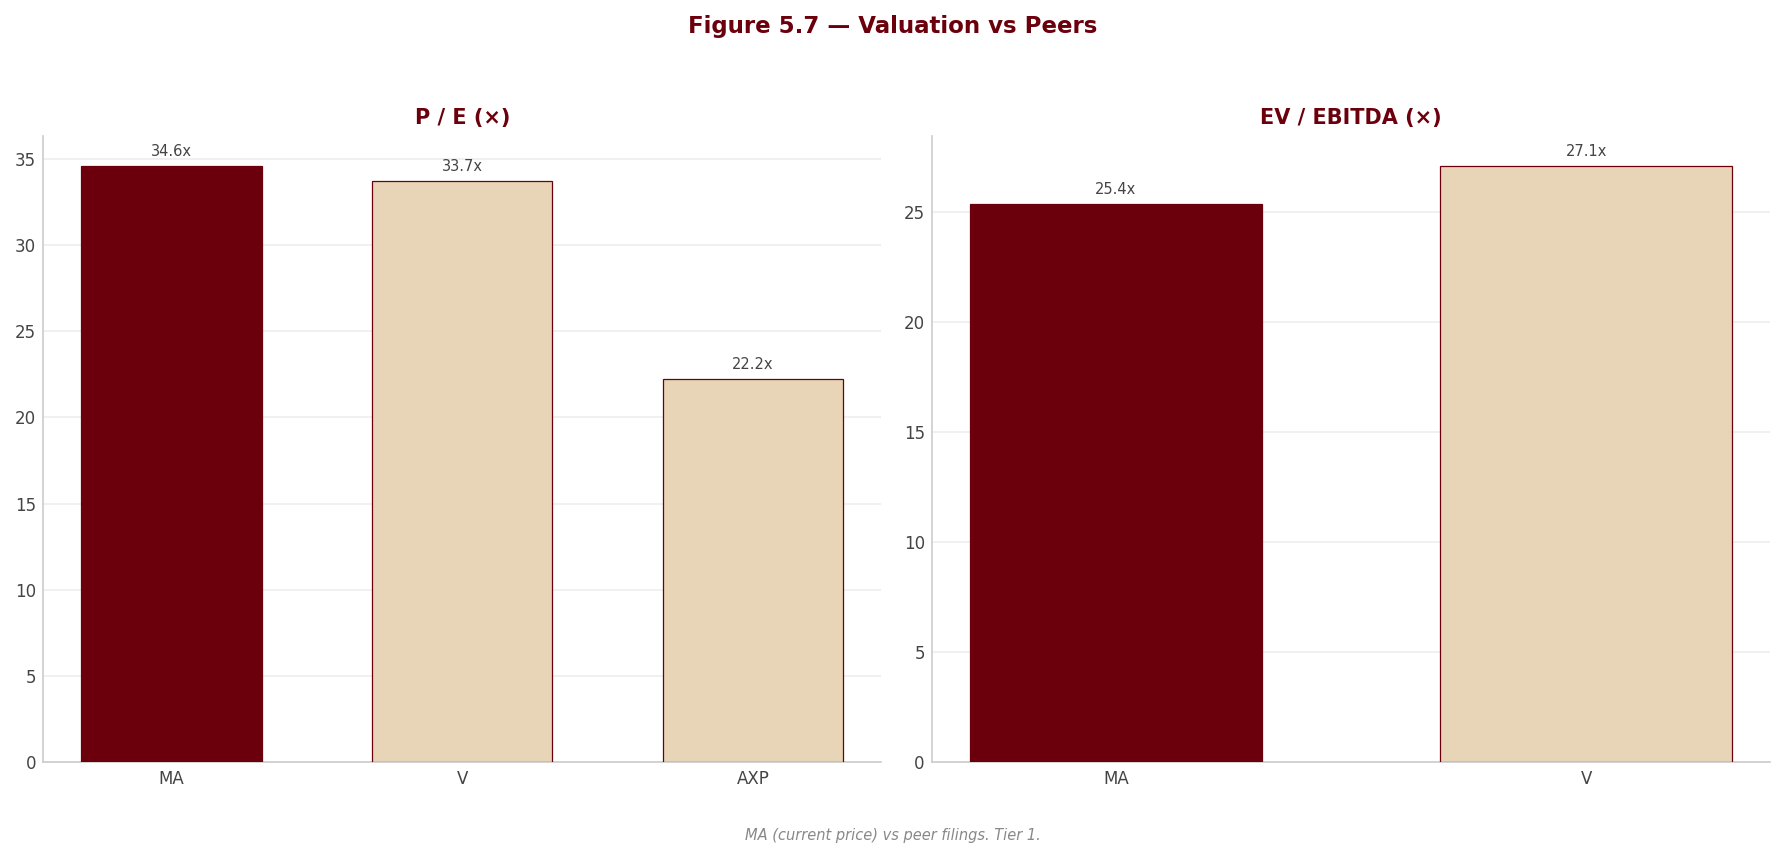
6. Valuation & Price Target withdrawn
This section stated what the shares were worth and what to do about them. It rested on an exit multiple set by hand — across the coverage it averaged 24% below where each company actually traded — so the conclusion largely restated that assumption instead of testing it. Rather than leave it standing, it has been withdrawn while the method is rebuilt.
Nothing else in this report depends on it: the financial analysis above and below is drawn from the company's own filings, and every figure links to the page it was verified against.
Section 7 — Quarterly Update: Q2 2026
sources Page references in this section are to the printed page numbers of Mastercard’s Form 10-Q for the quarterly period ended June 30, 2026 (filed July 30, 2026).
Portfolio Action
[Rating and price target withdrawn — see the note at the top.]
| Assessment | |
|---|---|
| Action | [Rating and price target withdrawn — see the note at the top.] |
| Reason | [Rating and price target withdrawn — see the note at the top.] |
| Thesis intact? | YES — the operating thesis was confirmed (value-added services grew 20.0% YoY and reached 41.2% of net revenue; operating margin at a new high), and the two flagged watch-items worsened at the margin rather than broke: customer incentives inside payment-network revenue reached $5,997 million, now 110.0% of the $5,451 million of net payment-network revenue they are deducted from, and FCF conversion fell to 75.1% from 118.7% a year ago. |
| Trigger to revisit | [Rating and price target withdrawn — see the note at the top.] DOJ debit matter or the European Commission network-fee inquiry escalates to a formal action. |
7.1 Results at a Glance
| Metric | Q2 2026 | Q2 2025 | YoY Δ | Q1 2026 | QoQ Δ |
|---|---|---|---|---|---|
| Revenue ($M) | $9,277.0M | $8,133.0M | +14.1% | $8,398.0M | +10.5% |
| EBITDA ($M) | $5,896.0M | $5,058.0M | +16.6% | $5,206.0M | +13.3% |
| EBITDA Margin | 63.6% | 62.2% | +1.4 pp | 62.0% | +1.6 pp |
| EBIT ($M) | $5,587.0M | $4,777.0M | +17.0% | $4,907.0M | +13.9% |
| EBIT Margin | 60.2% | 58.7% | +1.5 pp | 58.4% | +1.8 pp |
| Net Income ($M) | $4,388.0M | $3,701.0M | +18.6% | $3,882.0M | +13.0% |
| Net Margin | 47.3% | 45.5% | +1.8 pp | 46.2% | +1.1 pp |
| Diluted EPS | $4.97 | $4.07 | +22.1% | $4.35 | +14.3% |
YoY Δ = (Q2 2026 - Q2 2025) / |Q2 2025| × 100; e.g. revenue (9,277 - 8,133) / 8,133 × 100 = +14.1%. QoQ Δ = (Q2 2026 - Q1 2026) / |Q1 2026| × 100; e.g. revenue (9,277 - 8,398) / 8,398 × 100 = +10.5%. Margins are the metric divided by revenue for the same quarter — EBIT Margin Q2 2026 = 5,587 / 9,277 × 100 = 60.2%, which ties to management’s reported 60.2% (10-Q p. 30). Margin deltas are expressed in percentage points (pp).
Mastercard reports no cost of revenue and no gross-profit subtotal, so gross profit and gross margin are not presented; operating margin is the profitability measure throughout this report.
Source: MA 10-Q Q2 2026, Consolidated Statements of Operations (p. 6); figures per the FL model — see Appendix A.1–A.2. YoY/QoQ changes, margins and EBITDA are analyst-computed.
7.2 P&L Drivers
sources Revenue: Net revenue of $9,277.0M grew +14.1% YoY, but only 12% of that was operational — currency contributed 2 percentage points and acquisitions nil (Drivers of Change, 10-Q p. 37). The mix, not the network, did the work: value-added services and solutions rose 20.0% to $3,826 million while payment-network revenue rose only 10.2% to $5,451 million, lifting services to 41.2% of net revenue from 39.2% a year ago (Note 3, 10-Q p. 12; MD&A p. 36). Underneath, the volume drivers decelerated — cross-border volume growth of +14% in U.S. dollars (+12% local) against +19% (+15%) in Q2 2025, switched transactions +9% against +10%, and GDV +9% (+8% local) — so the reported acceleration is a services-and-currency story rather than a volume one (10-Q p. 35). Gross assessments of $11,448 million (domestic $3,154M, cross-border $3,460M, transaction processing $4,508M, other $326M) were reduced by $5,997 million of rebates and incentives to reach the $5,451 million of net payment-network revenue, and those incentives grew 22% (+20% currency-neutral) on “an increase in our key drivers as well as new and renewed deals” (10-Q pp. 35, 37).
Cost and margin: Total operating expenses rose 10% to $3,690 million against 14% revenue growth, which is the whole of the +1.5 pp operating-margin expansion to 60.2%. General and administrative expense of $3,082.0M (from $2,766.0M, +11.4%) was driven by personnel $1,947 million (+5.1%) and data processing and telecommunications $369 million (+17.5%), with an adverse foreign-exchange remeasurement line of $59 million against $41 million (10-Q pp. 39, 29). D&A of $309.0M against $281.0M (+10.0%) tracked higher capitalized-software amortization. The litigation provision — the recurring item management excludes from adjusted results — was $82 million against $96 million, a 15% reduction that management’s own reconciliation credits with 0.3 pp of the reported margin gain (10-Q pp. 33–34, 38). Stripping it out, adjusted operating margin was 61.1% against 59.9%, +1.2 pp reported and only +0.8 pp currency-neutral (10-Q p. 34): roughly half the headline margin expansion is currency and a smaller legal charge rather than operating leverage.
Below the line: Interest expense of $218.0M rose 11.8% YoY (and 17.8% against Q1 2026’s $185.0M) on the June 2026 issuance of $5.0 billion of senior notes; other income (expense), net improved to $31 million from $16 million “primarily driven by government grants,” the lumpy, jurisdiction-specific item first disclosed in FY2025 (10-Q p. 40). [Rating and price target withdrawn — see the note at the top.] Diluted EPS of $4.97 rose $0.90 (+22.1%) YoY and $0.62 (+14.3%) QoQ, of which roughly 3 percentage points of the YoY gain came from the 2.9% reduction in diluted shares to 883 million from 909 million (10-Q pp. 6, 13).
7.3 Balance Sheet & Cash Flow
| Metric | Q2 2026 | Q2 2025 | YoY Δ | Q1 2026 | QoQ Δ |
|---|---|---|---|---|---|
| Cash ($M) | $11,291.0M | $9,031.0M | +25.0% | $7,906.0M | +42.8% |
| Net Debt ($M) | $13,352.0M | $9,939.0M | +34.3% | $11,054.0M | +20.8% |
| Net Debt / LTM EBITDA | 0.6× | — | — | — | — |
| Total Assets ($M) | $57,691.0M | $51,431.0M | +12.2% | $52,449.0M | +10.0% |
| Equity ($M) | $5,611.0M | $7,853.0M | -28.5% | $6,719.0M | -16.5% |
| OCF ($M)ᵃ | $3,773.0M | $4,603.0M | -18.0% | $2,999.0M | +25.8% |
| CapEx ($M)ᵃ ᵇ | $478.0M | $209.0M | +128.7% | $335.0M | +42.7% |
| FCF ($M)ᵃ | $3,295.0M | $4,394.0M | -25.0% | $2,664.0M | +23.7% |
| Dividends Paid ($M)ᵃ ᵇ | $771.0M | $691.0M | +11.6% | $777.0M | -0.8% |
Net Debt / LTM EBITDA: LTM EBITDA = Q3 2025 $5,351M + Q4 2025 $5,207M + Q1 2026 $5,206M + Q2 2026 $5,896M = $21,660M; Net Debt Q2 2026 of 13,352 / 21,660 = 0.6×. Same YoY and QoQ formulas as 7.1 — e.g. net debt YoY (13,352 - 9,939) / 9,939 × 100 = +34.3%; cash QoQ (11,291 - 7,906) / 7,906 × 100 = +42.8%. Prior-period leverage is not shown because a comparable standalone LTM EBITDA series is not presented in this filing.
ᵃ The 10-Q cash-flow statement is presented year-to-date only (10-Q p. 11); standalone second-quarter operating cash flow, capital expenditure and dividends paid are derived by differencing the six-month figures against the corresponding first-quarter 10-Q, and are therefore analyst-derived rather than a reported line. ᵇ CapEx and dividends paid are shown as positive magnitudes; both are cash outflows.
Source: MA 10-Q Q2 2026, Consolidated Balance Sheets (p. 8) and Consolidated Statements of Cash Flows (p. 11); figures per the FL model — see Appendix A.1–A.2. Net debt, FCF, leverage and all YoY/QoQ changes are analyst-computed.
[Rating and price target withdrawn — see the note at the top.] Book equity fell to $5,611.0M because $9,002 million was added to Class A treasury stock in six months (to $92,226 million) against $8,270 million of six-month net income — equity is buyback-depressed, not impaired, and leverage of 0.6× LTM EBITDA remains trivial for a business with no financial covenants on its senior notes (10-Q pp. 8, 9, 19).
Cash flow note: FCF conversion = FCF / Net Income = 3,295 / 4,388 × 100 = 75.1%, against 118.7% in Q2 2025 — the single most important deterioration in the quarter. Cash and earnings diverged for two identifiable reasons disclosed in the six-month statement: prepaid expenses (predominantly capitalized customer incentives) consumed $3,835 million against $2,238 million a year earlier, and accrued litigation and legal settlements swung to a $504 million use of cash from an $81 million source — a $2,182 million combined adverse swing that management itself cites as the cause of the $211 million six-month decline in operating cash flow despite higher net income (10-Q pp. 11, 41). Capital expenditure of $478.0M more than doubled YoY on higher purchases of property and equipment ($445 million for six months against $199 million), a genuine step-up but immaterial to the cash profile at 5.2% of quarterly revenue.
7.4 Footnote Review
sources Note 1 — Summary of Significant Accounting Policies (10-Q p. 12) Organization, consolidation and basis of presentation only. Confirms no significant VIEs required consolidation at June 30, 2026 or December 31, 2025 and that the December 31, 2025 balance sheet was derived from the audited statements. Confirmed unchanged in substance vs. Q2 2025 (10-Q p. 12). Analytically notable for what is absent: the note contains no “Recent Accounting Pronouncements” subsection this quarter even though MD&A p. 42 cross-refers to it, so no new standard is disclosed as pending adoption in the period.
Note 2 — Acquisitions (10-Q p. 12) New disclosure with no Q2 2025 counterpart. In March 2026 Mastercard agreed to acquire 100% of BVNK Holdings Limited, a stablecoin-infrastructure provider, for $1.5 billion plus up to $300 million of contingent consideration on performance targets; completion is expected before the end of Q3 2026, subject to regulatory approval. Unchanged from the Q1 2026 disclosure — still pending at quarter end, so no goodwill or intangibles are recognised yet. Thesis-relevant: it is the first balance-sheet-sized commitment behind the stablecoin/multi-rail optionality carried in Section 2, and at $1.5 billion it is small enough (2.6% of total assets) to be an option premium rather than a bet.
Note 3 — Revenue (10-Q pp. 12–13) Disaggregation by category and geography only — Mastercard discloses no volume-times-price build. Payment network $5,451M vs $4,945M; value-added services $3,826M vs $3,188M; Americas $3,999M vs $3,406M (+17.4%); Asia Pacific/Europe/Middle East/Africa $5,278M vs $4,727M (+11.7%). Deferred revenue rose to $1,438M current (from $1,137M at December 31, 2025) with $447M long-term, and contract assets fell to $138M current plus $481M non-current. Same two-category, two-region format as Q2 2025 — the disaggregation remains coarse enough that no country- or product-level deterioration would be visible here. Significance: the Americas outgrowing the larger international region reverses the usual pattern and is the clearest revenue-mix change in the quarter.
Note 4 — Earnings Per Share (10-Q p. 13) Diluted shares 883 million vs 909 million; dilutive options and stock units contributed just 1 million shares in both periods, and anti-dilutive awards were “minimal.” Confirmed structurally unchanged vs. Q2 2025 (10-Q p. 13). Significance: EPS growth of +22.1% against net-income growth of +18.6% is entirely buyback arithmetic, not option-related dilution management.
Note 5 — Investments (10-Q pp. 14–15) Total debt-security investments $318M vs $332M at December 31, 2025; held-to-maturity balance ran to zero. Equity investments fell to $1,667M from $1,705M, with $(68)M of fair-value changes for six months (of which $(50)M on marketable securities). Measurement-alternative carrying value was flat at $1,242M with cumulative upward adjustments of $517M and downward adjustments of $246M; equity-method holdings rose to $282M from $260M. Changed vs. Q2 2025 in direction — a $2M loss this quarter against a $4M gain — but immaterial at 0.05% of net income. No impairment trigger disclosed.
Note 6 — Fair Value Measurements (10-Q pp. 15–16) Level classifications unchanged; no Level 3 recurring assets or liabilities in either period. [Rating and price target withdrawn — see the note at the top.]
Note 7 — Prepaid Expenses and Other Assets (10-Q p. 17) This is where the incentive dynamic shows. Capitalized customer incentives rose to $3,156M current (from $2,531M) and $8,440M non-current (from $7,870M) — $11,596M in total against $10,401M at December 31, 2025, up 11.5% in six months, an annualised pace of roughly 24% against 15% six-month net-revenue growth. Changed materially vs. the FY2025 position and in the same direction the forensic memo flagged. Significance: Mastercard continues to pay cash up front to win and renew customer deals and defer the cost onto the balance sheet; this is the mechanism behind the FCF-conversion decline in 7.3 and the item to watch if it persists.
Note 8 — Accrued Expenses (10-Q p. 17) Total accrued expenses $13,027M vs $13,272M at December 31, 2025. Accrued customer incentives edged down to $9,868M from $9,958M and long-term customer incentives to $2,664M from $3,041M — i.e. the accrued (payable) side fell $467M while the capitalized (asset) side rose $1,195M, which is the balance-sheet signature of cash being paid out against previously accrued incentives and new deals being capitalized. Personnel costs fell to $1,087M from $1,716M and income and other taxes rose to $1,375M from $914M, both consistent with normal first-half payout and provisioning seasonality.
Note 9 — Debt (10-Q pp. 18–19) The material financing event of the quarter. In June 2026 Mastercard issued $5.000 billion of 2026 USD Notes (floating due 2028 $500M; 4.325% due 2028 $1,250M; 4.425% due 2029 $1,150M; 4.600% due 2031 $1,350M; 5.000% due 2036 $750M), net proceeds $4.978 billion. Total debt $24,798M gross / $24,643M net of discount and hedge adjustments, against $19,000M at December 31, 2025; short-term debt $2,459M vs $749M as the $750M 2016 Notes due November 2026 and $1,000M 2020 Notes due March 2027 moved current alongside $710M of commercial paper. Covenants: the senior notes are expressly “not subject to any financial covenants”; the $8 billion revolver (expiring November 2030) carries customary covenants and the company “was in compliance, in all material respects” at June 30, 2026 and December 31, 2025 — no covenant ratio is disclosed because none applies to the notes. Changed vs. Q2 2025: the debt book is materially larger and commercial paper is now drawn where it was nil at December 31, 2025. Significance: at 0.6× LTM EBITDA and with no maturity wall, this is capital-structure optimisation to fund buybacks, not distress — but interest expense is now compounding at +11.8% YoY against +14.1% revenue growth and will step up further with a full quarter of the new notes.
Note 10 — Stockholders’ Equity (10-Q pp. 19–20) Dividends declared $0.87 per share, $763M in the quarter against $0.76 and $687M in Q2 2025 (+14.5% per share). Repurchases: 9.8 million Class A shares in the quarter and 17.6 million for six months at an average $508.11, for $8,933 million — nearly double the $4,838 million spent in the first half of 2025. Remaining authorization $8,528 million at June 30, 2026 under the $14.0 billion December 2025 programme, which became effective in March 2026. Changed sharply vs. Q2 2025: buyback intensity roughly doubled and was part-funded by the June debt issue. Significance: at an average $508.11 paid against the June repurchases at $489.28, management is buying below its own recent average — but the pace consumed more than the period’s free cash flow, which is why net debt rose.
Note 11 — Accumulated Other Comprehensive Income (Loss) (10-Q p. 21) AOCI moved to $(1,004)M from $(981)M at December 31, 2025, driven by $(62)M of currency translation on a weaker sterling and euro, offset by $50M on net-investment hedges. Direction reversed vs. the first half of 2025, when a stronger euro and sterling produced a $631M translation gain. [Rating and price target withdrawn — see the note at the top.]
Note 12 — Share-Based Payments (10-Q pp. 21–22) Six-month grants: 0.2 million options at a $165 weighted-average grant-date fair value, 1.1 million RSUs at $511 and 0.2 million PSUs at $503; expected option life six years, expected volatility 27.5%. Valuation models, vesting (three years ratably) and the PSU one-year deferral are confirmed unchanged vs. Q2 2025 (10-Q pp. 21–22). Share-based compensation of $326M for six months against $308M (+5.8%) is immaterial at 1.8% of six-month net revenue and is materially outrun by the $8,933M of repurchases.
Note 13 — Income Taxes (10-Q p. 22) [Rating and price target withdrawn — see the note at the top.] U.S. federal obligations remain settled through 2014, unchanged. Significance for forensic flag F003: the structural step-up holds. [Rating and price target withdrawn — see the note at the top.]
Note 14 — Legal and Regulatory Proceedings (10-Q pp. 22–25) Treated in full in the “Contingencies and litigation” block below, which is where the quarter’s most consequential disclosure changes sit.
Note 15 — Settlement and Other Risk Management (10-Q pp. 25–26) Gross settlement exposure rose to $93,402M from $89,599M at December 31, 2025 (+4.2%); risk-mitigation arrangements were essentially flat at $16,703M vs $16,722M, so net settlement exposure rose to $76,699M from $72,877M (+5.2%). Policy language and the “historically low level of losses” statement are confirmed unchanged (10-Q p. 25). Significance: the largest off-balance-sheet item in the accounts grew faster than collateral, so the uncollateralised share edged up to 82.1% of gross from 81.3%. It remains a few-days-duration guarantee tied to customer-bank failure, not a funding exposure — but it is 13.7× total equity and should be sized as the network’s genuine tail risk.
Note 16 — Derivative and Hedging Instruments (10-Q pp. 26–28) Total notional fell to $10,116M from $10,916M; derivative assets $43M vs $35M and liabilities $95M vs $187M. Hedging-only, no speculation, all Level 2 — confirmed unchanged vs. Q2 2025 (10-Q p. 26). Cash-flow hedges moved a $38M gain into G&A this quarter against a $254M loss a year ago, a $292M swing that flatters the reported expense line; €1.7 billion of euro-denominated debt continues to hedge the European net investment, and no FX contracts were designated as net-investment hedges at either date. Non-designated contracts cost $(31)M in G&A against a $60M gain. Significance: derivative noise inside G&A is a real component of the margin comparison and argues, again, for the currency-neutral read.
Note 17 — Segment Reporting (10-Q p. 29) One reportable operating segment, “Payment Solutions,” unchanged from Q2 2025, with the CODM managing on consolidated net income and no segment-level operating income presented — so there is no segment profitability to analyse and revenue disaggregation (Note 3) is the only mix lens available. The expense detail is the useful content: personnel $1,947M (+5.1%), data processing and telecommunications $369M (+17.5%), professional fees $128M (+19.6%), foreign-exchange activity $59M (+43.9%) and other segment items $579M (+28.1%). Significance: the fastest-growing lines are the technology and “other” buckets, not headcount — consistent with the services mix shift and inconsistent with any claim that the margin gain came from labour restraint alone.
Related-party transactions (10-Q pp. 9, 15, 45) Mandatory review, executed: Mastercard’s Q2 2026 10-Q contains no related-party transactions note and discloses no transaction with any related party — no controlling shareholder, no affiliate services, purchases, sales or management fees, and no dollar amounts of any kind. The Mastercard Foundation, the greater-than-5% voting holder mid-way through a seven-year sell-down that Section 2 carries as a governance risk, is not mentioned anywhere in this filing; it appeared only in the FY2025 10-K’s governance section, so this quarter provides no update on the pace of that sell-down. The related items the filing does disclose, with amounts: equity-method investments of $282 million at June 30, 2026 against $260 million at December 31, 2025 (Note 5, p. 15) with no associated transactions quantified; non-controlling interests of $(5) million at June 30, 2026 against $9 million at December 31, 2025, after $(8) million of NCI activity in the quarter and $(14) million for six months (Statements of Changes in Equity, p. 9) — immaterial at 0.1% of equity; and insider trading arrangements adopted in the quarter under Item 5 (p. 45), namely CFO Sachin Mehra on May 6, 2026 (7,444 option-underlying shares plus 7,266 shares), President Americas Linda Kirkpatrick on May 4, 2026 (4,280 plus 2,114 shares) and director Julius Genachowski on June 15, 2026 (741 shares), all Rule 10b5-1 plans. Terms: none disclosed as changed, because no related-party terms are disclosed at all. Comparison to Q2 2025: identical position — the Q2 2025 comparative periods in this filing likewise carry no related-party disclosure.
Contingencies and litigation (10-Q pp. 22–25) Six matters moved this quarter; this is where the forensic flag F004 lives, and the disclosure both improved and deteriorated.
- U.S. MDL interchange litigation. The accrued liability fell to $149 million at June 30, 2026 from $637 million at December 31, 2025, “a result of payments made during 2026” — cash out, not a release. Total accrued litigation on the balance sheet fell to $296 million from $800 million (p. 8). Mastercard’s share of any global settlement remains 12%, or 36% if only Mastercard and the financial institutions settle.
- New April 2026 putative class action (new this quarter, first disclosed here). U.S. merchants filed a putative class action seeking damages on interchange for Mastercard and Visa credit transactions since January 2019, together with a summary-judgment motion asking the court to declare that the Damages Class Settlement release — which prospectively releases non-opt-out U.S. merchants through August 2028 — does not bar their claims. Mastercard and Visa have opposed and moved to enjoin. This is the single most important new legal fact in the quarter: if the release is held not to bar the claims, the settled 95%+ of U.S. interchange volume becomes contestable again.
- Opt-out merchants — quantum sharply restated upward. The remaining opt-out litigation is now described as two merchants seeking aggregate single damages in excess of $250 million (trial September 2026) plus Block and Intuit seeking aggregate single damages in excess of $5 billion, with expert reports and summary-judgment briefing running through 2026. The FY2025 10-K described seven merchants at in excess of $1 billion with Block and Intuit unquantified; the Circle K April 2026 trial is no longer disclosed, consistent with settlement. Net effect: fewer parties, far larger disclosed exposure, and U.S. antitrust damages are trebled.
- Rules Relief Class settlement — favourable movement. The district court granted preliminary approval in June 2026, with a final-approval hearing scheduled for November 2026, after the 2024 version was rejected.
- Europe — exposure grew. Further U.K. merchant interchange claims were filed during Q2 2026, and unresolved U.K./pan-European damages claims are now stated at over £0.5 billion (approximately $0.7 billion), up from approximately £0.3 billion ($0.4 billion) at FY2025. Mastercard was granted permission in March 2026 to appeal the 2025 adverse liability ruling on all grounds, with the appeal set for February 2027; a February 2026 damages ruling went partly in its favour; further liability and damages issues are scheduled for October 2027. The U.K. commercial-card collective action still claims in excess of £1 billion (approximately $1.3 billion), though the court excluded over 100 merchants from the class in February 2026. Portugal claims approximately €0.4 billion (approximately $0.5 billion) with trial scheduled October 2026; the Netherlands action claims in excess of €0.3 billion (approximately $0.3 billion).
- Australia, ATM and liability shift. The ACCC liability hearing concluded in June 2026 (decision pending). In the ATM Operators Class Complaint, alleging over $1 billion in single damages, Mastercard reached an agreement in principle in June 2026 with the sole opt-out operator; the class litigation continues, and the $79 million Non-bank ATM Consumer accrual stands. The U.S. Liability Shift settlement ($80 million accrual) received final court approval in April 2026 — closed.
- European Commission network-fee inquiry — no movement. The 2024 formal request for information into network fees charged to acquirers is disclosed in identical terms to the FY2025 10-K: “Mastercard is cooperating.” No escalation, no formal proceeding, no estimate (p. 25). Unchanged is the honest answer here.
- U.S. DOJ debit investigation — not mentioned. The 2023 Civil Investigative Demand from the DOJ Antitrust Division into Mastercard’s U.S. debit programme, disclosed in the FY2025 10-K and carried as the sharpest edge of Risk 1 in Section 2, does not appear anywhere in Note 14 of this 10-Q. The filing gives no reason for the omission and does not state that the matter was closed. It cannot be read as resolution, and it cannot be read as escalation; it is an unexplained disclosure gap that should be raised with the company and re-checked at the FY2026 10-K.
- Telephone Consumer Protection Act class action. Approximately 381,000 faxes at uncapped statutory damages of $500 each; the parties still await the court’s decision on class definition, briefing having been completed in April 2023. Confirmed unchanged vs. the prior disclosure (p. 25).
Against all of this, accrued litigation is $296 million (p. 8) while individually disclosed claims exceed $8 billion before trebling. The gap between accrual and disclosed exposure widened this quarter — the accrual fell 63% while the disclosed claim amounts rose — because Mastercard accrues only what is probable and estimable and states it cannot estimate the rest. §
Subsequent events (10-Q pp. 12, 20, 42, cover page) The filing contains no Subsequent Events note; this is a disclosure structure, not an omission finding, and it is consistent with the Q2 2025 comparative. Post-quarter facts are disclosed elsewhere and are listed here in full: (1) $697 million of Class A shares repurchased between July 1 and July 27, 2026, leaving $7.8 billion of authorization against $8,528 million at June 30 (pp. 20, 42); (2) 869,464,115 Class A and 6,545,825 Class B shares outstanding at July 27, 2026, against 870.7 million and 6.5 million at June 30 (cover page; p. 20); (3) the $0.87 per share dividend declared June 16, 2026, aggregating $763 million, payable August 7, 2026 to holders of record July 9, 2026 (p. 42); (4) the BVNK acquisition, still pending regulatory approval, expected to complete before the end of Q3 2026 (p. 12). The report was signed July 30, 2026 (p. 47). Nothing post-quarter is thesis-changing.
7.5 What Changed This Quarter
sources - Value-added services carried the quarter and the mix shift accelerated. Services revenue of $3,826 million grew 20.0% against payment-network growth of 10.2%, lifting services to 41.2% of net revenue from 39.2%. This is the Section 2 Catalyst 1 mechanism working in real time: every point of mix shift toward services lowers the share of revenue exposed to interchange politics and network-fee regulation. It is the strongest confirmatory evidence in the filing. - Customer incentives now exceed the net payment-network revenue they are deducted from. Rebates and incentives of $5,997 million grew 22% (+20% currency-neutral) against gross assessments of $11,448 million growing 16.0% and net payment-network revenue growing 10.2% — incentives are 110.0% of net payment-network revenue and 52.4% of gross assessments, up from 49.9% a year ago. The capitalized incentive asset rose to $11,596 million from $10,401 million in six months. Forensic flag F002 did not just persist, it intensified: the growth signal in the payment network is increasingly a function of the largest estimate in the accounts. - Cash conversion broke stride: FCF conversion of 75.1% against 118.7% a year ago. Driven by $3,835 million of six-month prepaid-expense outflow (customer incentives) and a $585 million adverse swing on litigation settlement payments. One quarter is not a trend and the incentive outflow is growth-related rather than distress-related — but this is the metric that would confirm or refute the downgrade trigger on revenue quality, and it moved the wrong way. - Disclosed U.S. antitrust exposure was restated materially higher while the accrual was drawn down. Block and Intuit are now disclosed at in excess of $5 billion of aggregate single damages, a new April 2026 putative class action challenges the scope of the Damages Class release covering 95%+ of U.S. interchange volume, and accrued litigation fell to $296 million from $800 million as cash was paid out. The “one-time” litigation charge recurred yet again at $82 million after $96 million in Q2 2025 and annual provisions in each of 2023, 2024 and 2025 — F001 confirmed — and adjusted EPS of $5.04 against GAAP $4.97 is the $0.07 measure of it this quarter. - The U.S. DOJ debit investigation disappeared from the legal note without explanation. Carried in Section 2 as the risk that reaches the moat, it is simply absent from Note 14 (pp. 22–25). No inference is available in either direction; it is an open question for the company and a re-check item at the FY2026 10-K. - The balance sheet was levered up to fund buybacks. $5.0 billion of new notes plus $710 million of commercial paper took total debt to $24,643 million from $19,000 million, funding $8,933 million of six-month repurchases against $4,838 million a year earlier. Leverage is still only 0.6× LTM EBITDA and the notes carry no financial covenants, so this is an efficiency choice — but it converts a portion of future EPS growth into a fixed interest obligation now compounding at +11.8% YoY, and it is why net debt rose 34.3% YoY.
7.6 Portfolio Decision
sources [Rating and price target withdrawn — see the note at the top.] [Rating and price target withdrawn — see the note at the top.] Net revenue of $9,277.0M (+14.1%), operating margin of 60.2% (+1.5 pp) and diluted EPS of $4.97 (+22.1%) are an unambiguously strong print, and the services mix shift to 41.2% of revenue is precisely the structural development that lowers Mastercard’s regulatory beta over time. [Rating and price target withdrawn — see the note at the top.] The footnote review adds two things the income statement does not show. First, the incentive dynamic hardened: $5,997 million of rebates growing 22% against gross assessments growing 16.0%, a capitalized incentive asset up 11.5% in six months, and FCF conversion down to 75.1% from 118.7% — the downgrade trigger on revenue quality is now one reporting period closer, not further away. Second, the legal position is more exposed than the shrinking accrual suggests: $296 million of accrued litigation against newly quantified Block/Intuit claims in excess of $5 billion, a fresh April 2026 challenge to the release protecting 95%+ of U.S. interchange volume, and a DOJ debit investigation that vanished from the note without explanation. None of that breaks the thesis — Mastercard remains a 60%-operating-margin network levered at 0.6× — but it is why a quarter this strong still does not justify paying up.
What would change this view: [Rating and price target withdrawn — see the note at the top.] - Downgrade condition: rebates and incentives continuing to outgrow gross assessments (22% vs 16.0% this quarter) for two further quarters with FCF conversion below 80%, confirming that reported growth is being bought on the balance sheet; or an adverse development in the U.S. opt-out litigation — a September 2026 trial verdict, or a ruling that the Damages Class release does not bar the April 2026 class claims — that forces a provision materially above the $296 million currently accrued.
Report Versions
Every published version of this report, newest first — each one kept so a reader can see what changed and when.
| Version date | Files |
|---|---|
| 2026-08-19 Current | Model (Excel) |
| 2026-08-10 | Model (Excel) |
| 2026-08-06-2 | Model (Excel) |
| 2026-08-06 | Model (Excel) |