
Johnson & Johnson
Section 1 — Business Overview, Operations & Competitive Positioning
1.1 The Business
sources Johnson & Johnson is a holding company that develops, manufactures and sells patent-protected pharmaceuticals and medical devices in virtually every country in the world; it earns its returns by translating sustained, large-scale research investment into intellectual property, and then monetising that IP at premium prices and premium margins for the finite window before generics and biosimilars erode it. The economic model is therefore a treadmill of innovation: cash generated by today’s protected franchises funds the R&D and acquisitions that must replace them as exclusivity lapses. Following the 2023 separation of its Consumer Health business, the company is a purer play on that model, organised into two reportable segments — Innovative Medicine (branded pharmaceuticals) and MedTech (medical devices).
In its most recent fiscal year the company generated revenue of $94,193.0M, split between prescription medicines distributed to wholesalers, hospitals, retailers and healthcare professionals, and devices sold into surgical, cardiovascular, orthopaedic and vision settings. It is a New Jersey–incorporated multinational whose operating subsidiaries span nearly all countries, supported by a large, globally distributed and highly skilled scientific, clinical, manufacturing and commercial workforce operating under the company’s long-standing “Our Credo” governance framework. The shares trade under ticker JNJ in the Health Care sector. [Rating and price target withdrawn — see the note at the top.] The investment case is that of a defensive, AAA-quality dividend aristocrat whose durability we admire but whose current price, after the 2026 rally, already pays for that durability more than once — a franchise we respect at a valuation we cannot underwrite.
Key Information
| Item | Value |
|---|---|
| Ticker | JNJ |
| Sector / Industry | Health Care |
| Report Date | 2026-08-19 |
| Most Recent FY Revenue | $94,193.0M |
| EBIT Margin (Most Recent FY) | 26.8% |
| Diluted Shares Outstanding | 2,429M |
| Current Price | $271.11 |
Source: Company SEC filings (10-K); see Appendix A.1.
1.2 Operating Segments
sources Innovative Medicine is the pharmaceutical engine of the company and the larger of the two segments. It sells branded prescription medicines across six therapeutic areas — Oncology, Immunology, Neuroscience, Pulmonary Hypertension, Infectious Diseases, and Cardiovascular & Metabolism — with revenue driven by a portfolio of flagship franchises rather than any single molecule. The single most important economic variable for this segment is patent exclusivity: each drug earns outsized margins while protected and loses the bulk of that revenue quickly once generics or biosimilars enter. The franchise is anchored by the DARZALEX/DARZALEX FASPRO (daratumumab) multiple-myeloma platform — the company’s largest single product, licensed in part from Genmab under royalty-bearing patents — alongside the CAR-T therapy CARVYKTI, prostate-cancer agent ERLEADA, the RYBREVANT/LAZCLUZE lung-cancer combination, and bispecifics TALVEY and TECVAYLI in oncology; TREMFYA, STELARA, SIMPONI and REMICADE in immunology; SPRAVATO, CAPLYTA (added via the Intra-Cellular acquisition) and the INVEGA family in neuroscience; OPSUMIT/OPSYNVI and UPTRAVI in pulmonary hypertension; an HIV portfolio in infectious diseases; and the anticoagulant XARELTO. The defining near-term dynamic here is the STELARA loss-of-exclusivity cliff, where biosimilar entry is eroding a formerly top-selling immunology drug — a headwind we examine in Sections 2 and 3, offset in the growth math by newer assets and the pipeline.
MedTech develops and manufactures medical devices across four fields — Cardiovascular, Orthopaedics, Surgery and Vision — sold to hospitals, physicians, eye-care professionals and health systems for acute and elective procedures. Its economics are driven less by patent cliffs than by procedure volumes, clinical evidence, and the pace of technological iteration: incumbency and surgeon/institution switching costs matter, but a rival’s better device can render a product line obsolete. The Cardiovascular portfolio spans electrophysiology (including the VARIPULSE pulsed-field-ablation platform), Abiomed’s Impella circulatory-support devices, Shockwave’s calcified-artery products and neurovascular stroke care; Orthopaedics covers joint reconstruction, trauma, spine and sports; Surgery spans instrumentation, energy, stapling, wound closure, biosurgery and robotics (including the OTTAVA system); and Vision includes ACUVUE contact lenses and TECNIS intraocular lenses. Notably, in October 2025 management announced its intention to separate the Orthopaedics business, targeting completion within 18–24 months — a further structural reshaping that follows the Kenvue spin and re-focuses MedTech on higher-growth cardiovascular, surgery and vision categories.
As a system, the two segments share a common operating flywheel: enormous, sustained R&D and business-development spend generates a stream of protected products; the resulting cash funds the dividend, buybacks and the next wave of innovation; and the breadth of the portfolio smooths the lumpiness of any single launch or patent expiry. The synergies are real but diffuse — shared scale in manufacturing, regulatory affairs, global commercial reach and balance-sheet firepower — rather than the tight cross-selling of a single-market company. The fragility is the mirror image of the strength: because value rests on IP and clinical evidence, the model is permanently exposed to patent cliffs, pipeline attrition, pricing reform and product-liability litigation, and it increasingly relies on acquisitions to keep the innovation treadmill turning.
1.3 Geographic Exposure
sources The company conducts business in virtually all countries of the world, with a majority of sales generated in the United States and a substantial international remainder concentrated principally in Europe and the Asia-Pacific/Africa region. This footprint gives the franchise genuine diversification of demand but also embeds meaningful currency exposure: a large share of revenue and cost is denominated outside the U.S. dollar, so translation and transactional foreign-exchange movements swing reported results, and the company hedges to mitigate — but cannot eliminate — that exposure. Management explicitly flags that international activity carries higher risk than comparable U.S. activity, citing financial instability, restrictive economic policies and legal-system uncertainty in some jurisdictions, and it accounts for several high-inflation economies (Argentina, Turkey, Venezuela and Egypt) as highly inflationary. The geographic mix also shapes pricing risk on both sides of the Atlantic — U.S. drug-pricing reform and ex-U.S. price controls — which we treat in detail in Section 2.
1.4 Management Team
sources The leadership anchor is Chairman and Chief Executive Officer Joaquin Duato, who also serves as the company’s Chief Operating Decision Maker, supported by Executive Vice President and Chief Financial Officer Joseph J. Wolk. Strategy and priorities are set by an Executive Committee that functions as the senior leadership team, while day-to-day operations are run by management at the U.S. and international operating companies within those strategic parameters — a structure that reflects the company’s holding-company architecture. Oversight is exercised by a board operating through five standing committees (Audit; Compensation & Benefits; Nominating & Corporate Governance; Regulatory Compliance & Sustainability; and Science & Technology), with the Regulatory Compliance & Sustainability Committee carrying primary responsibility for cybersecurity and privacy risk. Governance quality is further evidenced by a clean, unqualified audit opinion from PricewaterhouseCoopers LLP, which has served as auditor since at least 1920; the very length of that tenure is a minor independence-optics consideration rather than a substantive concern. On balance we view the team as experienced and deep, with the principal governance question being not competence but the sequencing of major structural events — the Kenvue separation, and now the planned Orthopaedics separation — which place a premium on disciplined execution and on succession planning across a broad senior bench.
1.5 Capital Allocation Track Record
| Year | Dividends Paid ($M) | Share Repurchases ($M) | CapEx ($M) |
|---|---|---|---|
| FY2021 | $11,032.0M | $3,456.0M | $3,652.0M |
| FY2022 | $11,682.0M | $6,035.0M | $4,009.0M |
| FY2023 | $11,770.0M | $5,054.0M | $4,543.0M |
| FY2024 | $11,823.0M | $2,432.0M | $4,424.0M |
| FY2025 | $12,381.0M | $5,953.0M | $4,832.0M |
Source: Company SEC filings (10-K), Consolidated Statements of Cash Flows; see Appendix A.1.
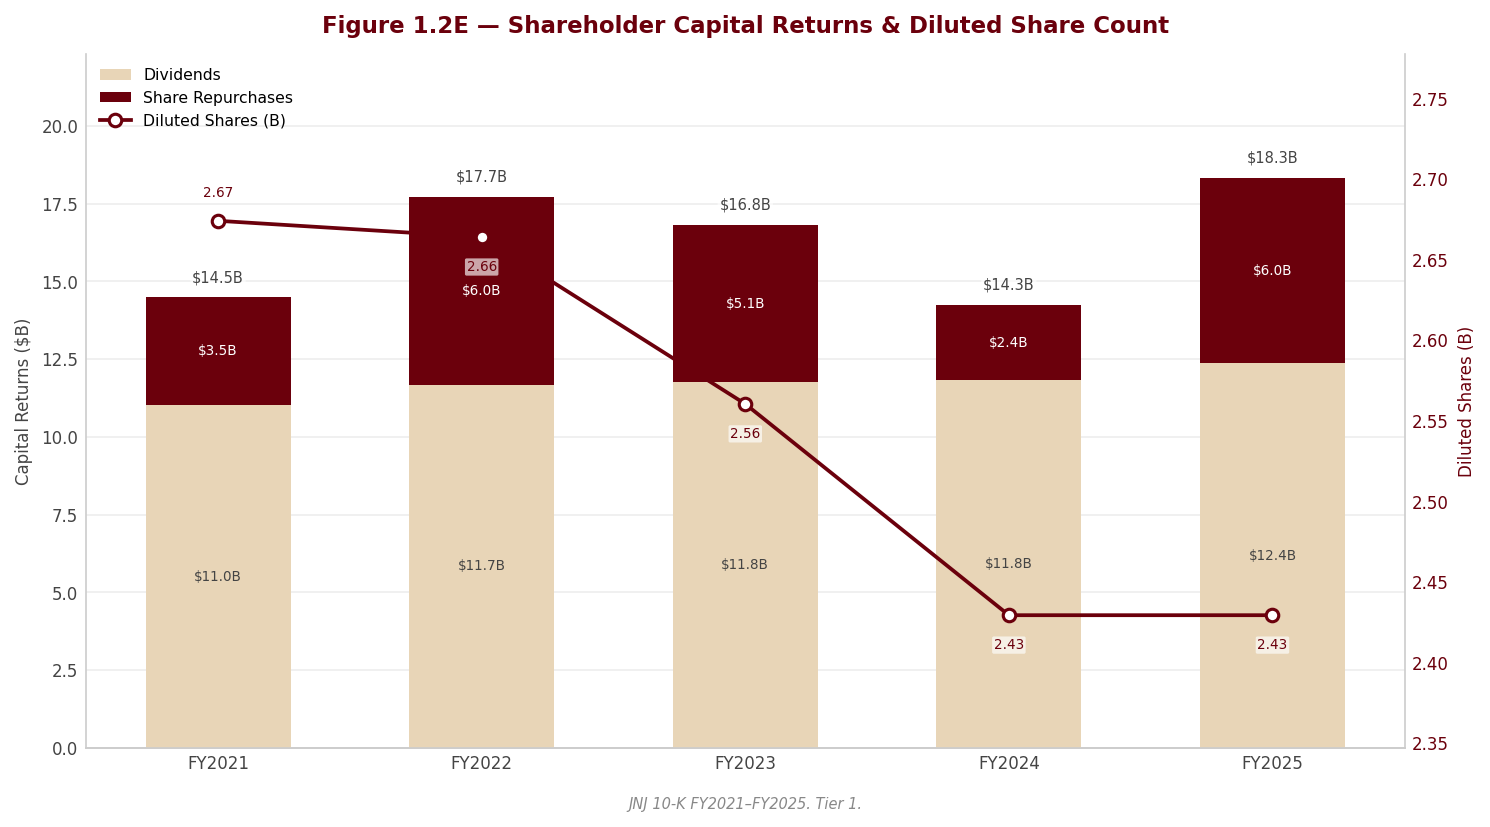
Capital allocation is where the character of this business is clearest. The defining fact is the dividend: the company again raised its per-share payout during the year, extending a multi-decade, uninterrupted streak of consecutive annual increases that places it in the small cohort of true dividend aristocrats and makes the dividend the single most reliable component of shareholder return. Buybacks supplement — rather than dominate — that policy; taken together, the dividend-plus-repurchase mix produced a total shareholder yield of 3.6%, while the dividend itself absorbed 46.2% of earnings, a payout that management has kept comfortably serviced by operating cash flow through multiple litigation and separation shocks. The prior-year comparison is distorted by the 2023 Kenvue exit — the split-off retired a large block of shares acquired in the exchange offer, which flatters the buyback and share-count optics of that year and should not be read as a change in underlying repurchase intensity.
Alongside returns to shareholders, management has leaned heavily on inorganic innovation, deploying significant capital into acquisitions during the year — most prominently Intra-Cellular Therapies (bringing CAPLYTA) and Halda Therapeutics — to refill the pipeline as exclusivity lapses. Capital expenditure, meanwhile, has been directed at new state-of-the-art manufacturing capacity, including a multi-year commitment to invest heavily in U.S. production; the trajectory of CapEx in the table above reflects genuine growth investment in capacity and next-generation manufacturing rather than mere maintenance replacement of the asset base. The signal we take from the mix is a management team that prioritises balance: it funds the business and the pipeline, defends the aristocrat dividend as a near-sacred commitment, and treats buybacks as the flexible residual — a conservative, quality-oriented allocation posture consistent with the company’s top-tier credit standing.
1.6 Competitive Positioning & Moat
sources §1.6.1 — Industry structure. Returns in branded healthcare are earned by whoever can most reliably convert research spend into approved, patent-protected products and then defend the resulting pricing against payors, generics and biosimilars. [Rating and price target withdrawn — see the note at the top.] Both of the company’s segments sit in this structure — pharmaceuticals via patent economics, devices via clinical evidence and iteration speed — and in both, breadth and financial staying power are decisive.
§1.6.2 — Competitive advantages. The company’s moat rests on four reinforcing pillars. First, scale and portfolio breadth: management positions the group as the most comprehensive healthcare-innovation company spanning both medicine and devices, with a growing roster of individually large-scale product platforms that diversifies dependence on any single product. Second, intellectual property and a deep, well-funded pipeline — the company describes its portfolio and pipeline as the strongest in its history, and discloses that products launched within the most recent five-year window account for a meaningful share of current sales, evidence that the innovation engine is genuinely replenishing revenue. Third, entrenched leadership in specific device categories: management characterises the group as the market leader in several cardiovascular businesses, with an expanding pulsed-field-ablation position (VARIPULSE), strong Impella adoption, and differentiated surgical-robotics, stapling and vision franchises that carry real switching costs at the hospital and surgeon level. Fourth, the balance sheet itself is a competitive weapon: a AAA-quality, investment-grade credit profile — a distinction shared by only a handful of corporate issuers — lets the company out-invest and out-acquire peers and absorb litigation shocks that would impair a weaker competitor.
§1.6.3 — Competitive vulnerabilities. The same model carries specific, identifiable fault lines. The most acute is the patent cliff: the STELARA biosimilar erosion illustrates how quickly a high-margin franchise can decay, and it will not be the last — management flags biosimilar and generic threats to SIMPONI, OPSUMIT and others, meaning growth increasingly depends on pipeline execution and continued M&A rather than the installed base. Layered on top is U.S. drug-pricing reform: the Inflation Reduction Act’s Medicare price-negotiation program and Part D redesign subject selected products (STELARA among the first) to government-set pricing from 2026, a structural — not cyclical — margin headwind. In MedTech, the vulnerability is technological obsolescence and competitive iteration rather than patents. And overhanging the entire enterprise is the talc product-liability litigation, where — following the March 2025 dismissal of the company’s third bankruptcy vehicle — a large body of unresolved claims has returned to the tort system, with the potential loss above accruals disclosed as not estimable; it is the single most important contingency facing the company and the defining risk overhang we address fully in Section 2. Channel concentration (a small number of wholesalers accounting for a substantial share of gross revenue) and reliance on acquired, single-asset pipeline bets round out the vulnerability set.
§1.6.4 — Verdict. Our conclusion is that the competitive position is genuinely wide and durable — anchored by scale, IP, category leadership and a fortress balance sheet — and should sustain premium, resilient operating margins over the long run even as individual franchises cycle through their patent lives. [Rating and price target withdrawn — see the note at the top.] But it is not a moat that generates accelerating growth or protects against the two structural pressures we weight most heavily: recurring patent cliffs that must be out-run with pipeline and deals, and an uncapped litigation overhang that reported earnings understate. [Rating and price target withdrawn — see the note at the top.]
Section 2 — Key Risks & Catalysts
2.1 Downside Risks
sources Johnson & Johnson is not a business whose risk profile is defined by its operations. Underlying demand for its medicines and devices is durable, its balance sheet is investment-grade, and its manufacturing base is diversified across the world. The risks that matter to the equity are instead contingent and accounting-interpretive in nature: a single, uncapped product-liability exposure that the company itself cannot estimate; a reported earnings number that has been distorted in both directions by the accrual and reversal of the reserve against that exposure; and a pharmaceutical franchise entering a patent-cliff-plus-drug-pricing transition. The through-line is that JNJ’s GAAP financials in FY2025 flatter the underlying reality, and the largest single risk is legal rather than commercial. We rank the risks below accordingly.
Talc litigation — an uncapped, binary tail liability the balance sheet does not provision for
sources This is the paramount risk in the JNJ investment case and we flag it in the strongest terms. In March 2025 the Texas bankruptcy court dismissed the company’s third attempt to resolve the talc ovarian-cancer litigation through a prepackaged Chapter 11 vehicle (the “Texas two-step” via Red River Talc). Management chose not to appeal and returned to litigating the claims individually in the tort system, with ovarian-cancer trials being scheduled across state courts and Daubert/general-causation proceedings advancing in the federal multidistrict litigation. The strategic consequence is severe: the tens of thousands of unresolved claims that the failed plan was designed to extinguish are now back in the courts, one verdict at a time. §
The critical point for an investor is that the remaining talc reserve on the balance sheet is not a cap on ultimate liability. Per the company’s own disclosure, it comprises only previously executed settlement agreements plus litigation defense and other costs — it does not provision for the large body of unresolved ovarian-cancer claims now heading to trial. Management states expressly that it is unable to estimate the possible loss or range of loss beyond the amounts already accrued. That inability is not boilerplate: the independent auditor designated talc litigation contingencies a Critical Audit Matter precisely because of the judgment required to assess whether a loss on the remaining claims is probable and estimable. Two features compound the exposure. First, JNJ does not purchase third-party product-liability insurance for these matters — it self-insures through a wholly owned captive subject to limits — so any adverse outcome is borne directly by shareholders. Second, historical trial outcomes have been genuinely bimodal: the company has won defense verdicts but has also faced large adverse awards, some later reduced on appeal and some ultimately paid at very substantial sums. A sustained adverse verdict trend, or a move toward a new comprehensive global settlement, could require accruals materially above the current reserve, hitting earnings and cash flow in the period recognized. A related securities class action alleging non-disclosure of asbestos contamination is also live, with a certiorari petition pending at the U.S. Supreme Court.
Probability: Medium (of a materially-above-reserve outcome over the litigation horizon) | Timeframe: 1–5 years | Quantified potential impact: Not reliably quantifiable — the company itself states the loss is not estimable beyond amounts accrued, and the reserve explicitly excludes the unresolved claim pool. This is the defining downside variable in the bear case and should be modelled as a scenario, not a point estimate.
Source: Company SEC filings (10-K, Item 1A and Note 19) and forensic footnote review; see Appendix A.1.
Earnings quality — the talc reserve whipsaw makes reported GAAP earnings a poor guide to operating performance
sources Directly related to the talc exposure, and equally important to how the numbers are read, is a RED-flag earnings-quality issue. The same reserve that understates ultimate liability has whipsawed reported pre-tax income across three consecutive years: large talc charges were booked in the two prior years, followed in FY2025 by the reversal of the bulk of the reserve after the bankruptcy dismissal. That reversal flows through the “Other (income)/expense, net” line — the same line that also carries investment marks, deal costs and other litigation — and swung it from a large expense to a large credit year over year. The result is that GAAP net earnings from continuing operations rose sharply in FY2025 for reasons that have nothing to do with the underlying business: cash flow from operations was essentially flat, confirming the earnings jump is a non-cash accrual reversal rather than operating improvement.
The practical hazard for an investor is an unusual inversion: because management’s non-GAAP reconciliation strips the litigation credit out, adjusted EPS is actually lower than GAAP EPS in FY2025 — the opposite of the usual pattern in which adjustments flatter the adjusted number. A reader who anchors on headline GAAP EPS growth, or who naïvely compares GAAP to adjusted across years, will badly misjudge the operating trend. Every earnings, margin, EPS-growth and return metric in this report is therefore built on a normalized basis that excludes the reserve reversal (see Section 3), and the valuation is anchored to operating rather than FY2025 GAAP earnings.
Probability: High (the distortion is present, not prospective) | Timeframe: Immediate | Impact: Interpretive rather than cash — it does not by itself destroy value, but mis-reading it leads to a materially overstated view of FY2025 earnings power. The volatility will persist because the “Other (income)/expense” line structurally aggregates litigation, investment and deal items.
Source: Company SEC filings (10-K, Note 19 and MD&A) and forensic footnote review; see Appendix A.1.
STELARA loss of exclusivity plus IRA Medicare pricing — a structural revenue headwind in Innovative Medicine
sources Johnson & Johnson’s historically largest medicine has lost exclusivity and is being eroded rapidly by biosimilars, with worldwide sales falling sharply year over year and dragging the Immunology franchise down double digits. This is not a one-off: management expects ongoing global biosimilar launches to keep pressuring the product, anticipates generic competition for the pulmonary-hypertension drug OPSUMIT, and notes multiple biosimilars pursuing a SIMPONI biosimilar in the United States — each of which would materially reduce future sales for the affected product. Layered on top is the Inflation Reduction Act: the Medicare Part D redesign was a headwind across several products this year, and government-established Medicare pricing takes effect from 2026, with STELARA among the first drugs selected for negotiation and additional products potentially added over time. The company is separately litigating the constitutionality of the negotiation program, but the base case must assume continued price pressure regardless of the outcome.
The reason this matters beyond the headline is that a large, high-margin revenue base is being replaced by newer and, in several cases, acquired products (TREMFYA, DARZALEX, CARVYKTI, RYBREVANT/LAZCLUZE, SPRAVATO and the acquired CAPLYTA). Reported Innovative Medicine growth therefore understates the underlying churn and elevates reliance on flawless pipeline and launch execution — and on continued acquisition activity — to stay ahead of the erosion. §
Probability: High (the erosion is under way) | Timeframe: Immediate to 1–2 years | Impact: A sustained drag on Innovative Medicine growth; the risk is that new-product and acquired-product ramps fail to offset the STELARA decline and IRA pricing on the pace the market expects.
Source: Company SEC filings (10-K, Item 1A and Note 17) and forensic footnote review; see Appendix A.1.
Acquisition-led growth model — intangible intensity, recurring amortization and IPR&D impairment risk
sources Increasingly, JNJ buys growth rather than generating it internally, and the accounting consequences of that model are a genuine risk. A large acquisition spree this year (led by Intra-Cellular and Halda) lifted the combined intangibles-and-goodwill balance above total shareholders’ equity — meaning tangible book value is negative — and was funded partly with new debt that more than doubled the company’s net-debt position in a single year. [Rating and price target withdrawn — see the note at the top.] That the tail risk is live, not hypothetical, is demonstrated by a prior-year IPR&D asset (NM26 / Yellow Jersey) that hit early-termination criteria in its Phase 2b study and was written off.
Two recurring drags follow. [Rating and price target withdrawn — see the note at the top.] Second, the freshly acquired IPR&D stack carries real impairment risk if key programs disappoint; notably, no goodwill or indefinite-lived impairment was taken this year despite the STELARA collapse, so the impairment “cushion” is untested. Book-value-based ratios are flattered by the goodwill and would be impaired by any large write-down.
Probability: Medium | Timeframe: 1–3 years | Impact: Persistent amortization drag on GAAP margins plus episodic, potentially large non-cash impairments; the model also keeps leverage and net interest cost trending higher if the M&A pace continues.
Source: Company SEC filings (10-K, Notes 5, 7 and 18) and forensic footnote review; see Appendix A.1.
Non-talc litigation, channel concentration and structural separations
sources Beyond talc, litigation is a structural, recurring cost centre rather than a tail event, and several matters touch the growth engine directly. Note 19 discloses an Auris/Fortis shareholder judgment that was accrued at year-end and paid in early 2026 (a first-quarter cash outflow); a certified antitrust class action alleging the company delayed STELARA biosimilar competition; a contract and license dispute with Xoma over TREMFYA, the very immunology asset carrying growth; a jury verdict and injunction against Biosense Webster in electrophysiology (on appeal), which touches MedTech; the residual opioid settlement obligations; and a reinstated Anti-Terrorism Act suit. Extensive ANDA and biosimilar patent litigation across XARELTO, INVEGA SUSTENNA, ERLEADA, SPRAVATO, CAPLYTA and UPTRAVI adds further, product-specific exposure where an at-risk launch could remove a major revenue stream quickly.
Two further items belong in the risk picture. First, channel concentration: the company routes a very large share of gross revenues through just three pharmaceutical wholesalers, which concentrates credit and channel risk and leaves reported sales sensitive to distributor destocking. Second, structural discontinuity: the October 2025 announced separation of the Orthopaedics business (to be named DePuy Synthes, targeted within roughly two years) is the second major spin in three years after Kenvue, carries significant execution cost and completion risk, and was accompanied by a management-judgment reclassification of the DePuy Synthes trademarks to indefinite-lived — which stops their amortization and modestly flatters go-forward comparability. It is disclosed and defensible, but it is a judgment change that a reader should note.
Probability: Medium (that at least one item is financially material in any given year) | Timeframe: Immediate to 3 years | Impact: Individually modest, collectively a recurring earnings and cash drag, with the STELARA-antitrust and TREMFYA matters carrying the sharpest tail because they touch the growth franchise.
Source: Company SEC filings (10-K, Notes 17, 19 and Item 1A) and forensic footnote review; see Appendix A.1.
2.2 Upside Catalysts
sources The catalyst set is genuinely asymmetric to the risk set, and we state that plainly rather than manufacture balance. The single largest catalyst and the single largest risk are the same variable — talc. A comprehensive, capped global settlement would remove the overhang that currently suppresses the multiple, while its continued absence keeps that overhang in place. The remaining catalysts are operational (pipeline and MedTech execution) and one is structural (the dividend), and they are the mechanisms by which normalized earnings compound once the litigation cloud is set aside.
A capped global talc settlement — the overhang-removal catalyst
sources [Rating and price target withdrawn — see the note at the top.] The market currently applies a discount for an exposure the company itself calls unestimable; converting that open-ended tail into a known, bounded cash cost — even a large one — would allow investors to value the operating business on its merits. This is the mirror image of Risk 1: the same event that is feared as an uncapped liability becomes, if resolved on capped terms, the biggest single positive.
Probability: Low-to-Medium over the near term (three prior resolution attempts have failed) | Timeframe: 1–3 years | Monitoring trigger: Announcement of a new global settlement framework or matrix; a decisive shift in the trend of trial verdicts and the federal Daubert/general-causation rulings; the Supreme Court’s disposition of the talc securities certiorari petition.
Source: Company SEC filings (10-K, Note 19) and forensic footnote review; see Appendix A.1.
Innovative Medicine pipeline launches and label expansions
sources Growth beyond STELARA depends on execution of a broad late-stage pipeline, and management points to a full slate of near-term catalysts: the filing of icotrokinra (a potential first targeted oral peptide for plaque psoriasis), continued expansion of TREMFYA into inflammatory bowel disease, and new oncology launches including RYBREVANT FASPRO and the INLEXZO bladder-cancer system, alongside the continued ramp of DARZALEX, CARVYKTI and the acquired CAPLYTA. These are the assets that must out-run the STELARA and IRA drag; successful launches would convert the current “growth understated by churn” dynamic into visible net growth. §
Probability: Medium | Timeframe: Immediate to 2 years | Monitoring trigger: Regulatory approvals and label expansions on the flagged assets; quarterly evidence that new-product and acquired-product sales are more than offsetting the STELARA decline.
Source: Company SEC filings (10-K, Chairman’s letter and Note 17) and forensic footnote review; see Appendix A.1.
MedTech acceleration through new cardiovascular, surgery and vision platforms
sources MedTech offers a cleaner growth story less exposed to the pharma patent cliff. Management cites leadership across several cardiovascular businesses — an expanding pulsed-field-ablation position via the VARIPULSE platform, continued adoption of Abiomed’s Impella devices, and the Shockwave coronary and peripheral portfolios — together with surgical-robotics and instrumentation catalysts (the OTTAVA system filed with the FDA, the ETHICON stapler line) and vision growth in TECNIS intraocular lenses and the ACUVUE OASYS family. Sustained above-market MedTech growth would diversify the earnings base and reduce reliance on the pharmaceutical pipeline. §
Probability: Medium | Timeframe: Immediate to 2 years | Monitoring trigger: MedTech segment growth outpacing its end markets; regulatory clearances for OTTAVA and continued PFA/Impella/Shockwave adoption; whether China volume-based-procurement and orthopaedics restructuring headwinds abate.
Source: Company SEC filings (10-K, Chairman’s letter and Note 17) and forensic footnote review; see Appendix A.1.
Continued dividend growth and capital returns
sources JNJ’s multi-decade record of consecutive annual dividend increases underpins its dividend-aristocrat standing, and the Board again raised the dividend during the year and declared a further regular quarterly dividend after year-end. For the income-oriented and quality-compounder shareholder base, the reliability and growth of the dividend — supported by strong and stable operating cash flow — is itself a catalyst for total return and a source of downside support while the talc overhang resolves.
Probability: High | Timeframe: Ongoing | Monitoring trigger: The annual dividend declaration; free-cash-flow coverage of the dividend as net debt and litigation reserves are funded from operating cash flow.
Source: Company SEC filings (10-K, MD&A) and forensic footnote review; see Appendix A.1.
2.3 Risk & Catalyst Summary
| # | Item | Type | Probability | Timeframe | Status | Monitoring Trigger |
|---|---|---|---|---|---|---|
| 1 | Talc litigation — uncapped liability above reserve | Risk | M | 1–5 yrs | Active | Verdict trend, Daubert rulings, move to global settlement |
| 2 | Earnings-quality distortion from talc reserve whipsaw | Risk | H | Immediate | Active | GAAP-vs-adjusted inversion; OCF vs net income gap |
| 3 | STELARA loss of exclusivity + IRA Medicare pricing | Risk | H | Immediate–2 yrs | Active | STELARA erosion pace vs new-product offset; 2026 negotiated prices |
| 4 | Acquisition-led model — amortization + IPR&D impairment | Risk | M | 1–3 yrs | Monitoring | IPR&D program readouts; impairment tests; net-debt trajectory |
| 5 | Non-talc litigation, channel concentration, separations | Risk | M | Immediate–3 yrs | Active | Auris/STELARA-antitrust/TREMFYA outcomes; Orthopaedics spin execution |
| 6 | Capped global talc settlement | Catalyst | L/M | 1–3 yrs | Latent | Announced settlement framework; verdict-trend shift |
| 7 | Innovative Medicine pipeline launches | Catalyst | M | Immediate–2 yrs | Monitoring | Approvals/label expansions; new-product sales offset |
| 8 | MedTech acceleration + continued dividend growth | Catalyst | M/H | Ongoing | Active | MedTech vs end-market growth; annual dividend increase |
Source: Company SEC filings (10-K) and forensic footnote review; see Appendix A.1.
2.4 Risk Interdependencies
sources The JNJ risks are not independent draws — they cluster around two nodes that, if they fire together, are disproportionately damaging. The first node is talc. The litigation exposure (Risk 1) and the earnings-quality distortion (Risk 2) are the same event seen from two sides: the reserve that understates ultimate liability is also the reserve whose reversal inflated reported earnings. An adverse turn in the tort system would therefore hit twice — forcing accruals materially above the current reserve and reversing the very “Other (income)/expense” credit that flattered FY2025 — so a single legal development can swing both the balance-sheet liability and the income statement in the same unfavourable direction. Because the company carries no third-party product-liability insurance, there is no external buffer between an adverse verdict trend and shareholders.
The second node is the growth-versus-leverage tension. The STELARA cliff and IRA pricing (Risk 3) create pressure to replace eroding revenue, which the company is addressing through debt-funded acquisitions (Risk 4). Those two compound: the more the organic base erodes, the more the model leans on acquired IPR&D, which raises both the amortization drag and the impairment risk — and does so having already more than doubled net debt in a single year. Should a large talc accrual (node one) coincide with an IPR&D impairment or a disappointing pipeline year (node two), the historically ample balance-sheet cushion — thinned materially this year — would be absorbing litigation, deal-integration and impairment shocks simultaneously. Individually each risk is manageable for a company of JNJ’s cash generation and credit quality; the tail case is their simultaneous arrival, which is precisely when the reduced balance-sheet slack would matter most.
2.5 ESG & Regulatory Exposure
sources JNJ’s most acute ESG exposure is social and governance in character and runs directly through the talc matter. The litigation is fundamentally a product-safety and consumer-trust issue, and the company’s repeated use of a bankruptcy-restructuring strategy to resolve mass tort claims — dismissed three times — has itself drawn governance and reputational scrutiny. The decision not to carry third-party product-liability insurance concentrates that social risk on the balance sheet. On the governance side, the framework is otherwise sound: no controlling shareholder, an unqualified audit opinion on both the financial statements and internal control, and Board-committee oversight of risk, cybersecurity and sustainability. The one governance-adjacent caution is the very long auditor tenure (the same firm since at least 1920), an independence-optics point rather than a substantive finding, and the fact that the two Critical Audit Matters — talc contingencies and the large, judgment-heavy U.S. Innovative Medicine rebate reserve — coincide exactly with the two highest-estimation-risk areas of the financials, independently corroborating the risk emphasis above.
The regulatory exposure is dominated by U.S. drug pricing. The Inflation Reduction Act’s Part D redesign and Medicare Drug Price Negotiation Program subject selected products (STELARA among the first) to government-established pricing from 2026, with additional products liable to be added over time and expanded federal drug-discount-program requirements a further headwind; the company is litigating the program’s constitutionality but must plan for continued pricing pressure regardless. Beyond pricing, the company operates under intensive FDA and Good Manufacturing Practice oversight (with powers extending to recalls, seizures and sanctions), anti-corruption regimes given heavy interaction with government-employed healthcare providers abroad, and an expanding global patchwork of privacy and data-protection law. Environmental exposure is comparatively modest and, on management’s assessment, compliance is not expected to be material to capital expenditure or earnings; climate change is disclosed as a physical and regulatory risk to facilities and supply chains rather than a near-term financial driver. Two high-inflation and geopolitically sensitive exposures round out the picture — operations in economies accounted for as highly inflationary (Argentina, Venezuela, Turkey, Egypt), and tariff and export-control risk tied to U.S.–China tensions that management already cites as a MedTech cost headwind.
Source: Company SEC filings (10-K, Items 1, 1A, 1C and the auditor’s report) and forensic footnote review; see Appendix A.1.
Section 3 — Financial Analysis & Historical Performance
sources
Three-Statement Linkage Confirmation: - Net Income ties (Income Statement → Cash Flow Statement): Confirmed. Reported net earnings from continuing operations flow through as the top line of the operating cash-flow reconciliation in every year of the review window. The critical caveat is FY2025: the non-cash talc reserve reversal that inflates net income is removed as a non-cash item in the cash-flow bridge, which is precisely why operating cash flow is essentially flat while net income nearly doubles. The statements articulate correctly; the divergence is the tell, not a break. - Cash ties (Balance Sheet → Cash Flow Statement): Confirmed. The change in the balance-sheet cash and equivalents balance reconciles to the net change in cash on the cash-flow statement across all five years, inclusive of financing draws (the FY2025 senior-note issuance) and the FY2023 Kenvue split-off flows. - Retained Earnings reconciliation (Beg RE + NI - Dividends = End RE): Confirmed with expected articulation. The roll-forward ties in each year once the FY2023 discontinuity is recognized — the retained-earnings step-up in FY2023 carries the Kenvue separation gain recorded in discontinued operations, and residual movements reflect other comprehensive items and the treasury/split-off exchange. No unexplained plug.
3.1A Income Statement
Source: Company SEC filings (10-K); figures per the FL model — see Appendix A.1–A.2.
CAGR Summary
| Metric | 3Y CAGR | 5Y CAGR | 10Y CAGR |
|---|---|---|---|
| Revenue | -0.3% | 2.7% | - |
| EBITDA | 2.6% | 4.2% | - |
| Net Income | 14.3% | 12.7% | - |
| Diluted EPS | 17.9% | 14.9% | - |
| FCF | 4.7% | -0.5% | - |
Source: Company SEC filings (10-K); figures per the FL model — see Appendix A.1–A.2.
3.1B Income Statement — Analysis
sources The revenue trajectory is broken by one structural discontinuity that the reader must strip out before drawing any conclusion. The apparent -10.3% contraction in FY2023 is not a deterioration in the business — it is the deconsolidation of the Consumer Health segment (Kenvue), split off on 23 August 2023. FY2021 and FY2022 revenue still carry Consumer Health; FY2023 onward is continuing operations only. On a like-for-like continuing-operations basis the underlying franchise grew, and the reported line reaccelerates to 4.3% in FY2024 and 6.0% in FY2025. This is also why the -0.3% three-year revenue CAGR reads negative while the 2.7% five-year figure is modestly positive — the CAGR window straddles the divestiture and mixes a total-company base with a continuing-operations base. [Rating and price target withdrawn — see the note at the top.]
Underneath the FY2025 line, growth was volume-led — higher unit volume partially offset by a negative net price effect, with a modest currency tailwind. The composition matters: this is the opposite of price-driven, cyclically reversible growth. The swing factor within Innovative Medicine is the STELARA biosimilar cliff, addressed as a major mover below; excluding STELARA, underlying growth was materially stronger, carried by Oncology (DARZALEX share gains, CARVYKTI capacity expansion, ERLEADA, and the TECVAYLI / TALVEY / RYBREVANT-LAZCLUZE launches), by TREMFYA in Immunology, by SPRAVATO and the acquired CAPLYTA in Neuroscience, and across MedTech by Cardiovascular (electrophysiology, Abiomed’s Impella, and the newly acquired Shockwave portfolios). §
Margins should be read on operating EBIT, not on reported net income — and on that clean basis the trend is genuine expansion. Because Johnson & Johnson does not print an operating-income subtotal, EBIT here is analyst-constructed (gross profit less operating expenses) and, critically, sits above the volatile “Other (income)/expense” line where the talc litigation accruals live. That construction is what makes it usable. EBIT margin held in a tight 24.6%–24.9% band through FY2021–FY2023, dipped to 23.4% in FY2024, then expanded to 26.8% in FY2025 — the high of the window and a real operating result. The driver was operating-expense leverage: corporate administrative-cost rationalization and planned selling/marketing leverage in Innovative Medicine, visible in the FY2025 step-down in total operating expense excluding cost of goods. Gross margin moved the other way, easing to 67.9% in FY2025 from 69.1%, on unfavorable product mix (the high-margin STELARA roll-off), unfavorable transactional currency, and tariffs — a mix headwind, not a cost-control failure. EBITDA margin at 34.8% corroborates the operating-leverage story.
Major movers:
-
Talc reserve reversal — the single most important interpretive item in the file (RED flag). In March 2025 the Texas bankruptcy court dismissed the third “Texas two-step” vehicle (Red River), and the company reversed substantially all of the reserve it had built for that resolution, booking the credit through Other (income)/expense. This is the primary reason net income jumped 90.6% to $26,804.0M and GAAP diluted EPS rose 90.5% to $11.03, lifting net margin to an economically meaningless 28.5%. None of this is operating improvement — it is a non-cash accrual reversal, confirmed by essentially flat operating cash flow. The same reserve whipsawed pre-tax income the other way in FY2023 and FY2024, when large talc charges depressed reported net income (note the -25.7% FY2023 print and the deeply understated net margins of 15.6% and 15.8%). The distortion runs through Other (income)/expense, which swung sharply from a large charge to a large credit year-over-year — a swing that, on its own, dwarfs the entire move in operating profit. Structural in the sense that litigation is a permanent, lumpy feature of this line; the specific FY2025 magnitude is one-time. Management’s own non-GAAP adjusted EPS strips the credit out and is therefore lower than GAAP EPS in FY2025 — an unusual inversion that will mislead any reader anchoring on the GAAP number.
-
Kenvue (Consumer Health) separation — the FY2023 discontinuity (RED flag). The August 2023 split-off both stepped revenue down (the -10.3% optical decline) and injected a large one-time gain into discontinued operations. The net income figures shown here are continuing operations and therefore exclude that gain — which is correct, but means FY2022→FY2023→FY2024 comparisons of total net earnings, share count, and total assets are not comparable without adjustment. It also drove an outsized FY2023 buyback of the shares tendered in the split-off exchange, distorting the share-count trend (diluted shares fall from 2,664 to 2,560). Structural, permanent, and the anchor point for all multi-year growth math: use continuing operations only.
-
STELARA biosimilar erosion (YELLOW flag). Historically the largest drug, STELARA lost exclusivity and worldwide sales fell sharply, dragging Immunology down double digits and pressuring gross margin via adverse mix. The offset is newer and partly acquired product — TREMFYA, DARZALEX, CARVYKTI, RYBREVANT/LAZCLUZE, SPRAVATO, and CAPLYTA. Structural: a large, high-margin base is being replaced by younger assets, so headline growth understates the underlying churn and raises reliance on launch execution and continued M&A. From 2026 the Inflation Reduction Act layers Medicare negotiated pricing onto STELARA (among the first drugs selected) — a further structural price headwind, not a cyclical one. §
-
[Rating and price target withdrawn — see the note at the top.] Unrecognized tax benefits rose, with the IRS auditing the 2017–2020 cycle. [Rating and price target withdrawn — see the note at the top.]
-
Rising net interest cost (YELLOW flag). Interest expense climbed steadily from $183.0M in FY2021 to $971.0M in FY2025 as the company issued new debt to fund M&A. Immaterial to the margin structure today, but a persistent, growing EPS headwind that did not exist at the start of the window.
Quality of earnings. The honest read of FY2025 earnings quality is cautious despite the headline. [Rating and price target withdrawn — see the note at the top.] Layered on top, substantial annual intangible amortization — the perennial largest add-back in the non-GAAP bridge — separates GAAP from adjusted earnings every year; because Johnson & Johnson is an acquisition-led compounder, this is a real, recurring economic cost of the model, not a clean add-back. Working-capital signals reinforce caution: receivables and inventory both grew faster than sales and cost of goods respectively (examined in 3.2B), and the large U.S. Innovative Medicine gross-to-net rebate reserve is a designated Critical Audit Matter with rising prior-period true-ups. The cleanest earnings-quality tell is that operating cash flow was roughly flat while GAAP net income nearly doubled — read the business through the cash, not the accrual.
⚠ Items to Watch. If EBIT margin falls back below 23.4%, it would unwind the FY2025 operating-leverage gain and force a re-underwrite of the administrative-cost-rationalization thesis. If gross margin erodes further from 67.9% as STELARA mix and Medicare pricing bite, the volume-led growth story loses its margin support. And any adverse shift in talc trial outcomes could reverse part of the FY2025 credit — the reader should treat GAAP net income above the operating-EBIT trend as borrowed, not earned.
3.2A Balance Sheet
Source: Company SEC filings (10-K); figures per the FL model — see Appendix A.1–A.2.
3.2B Balance Sheet — Analysis
sources This is an intangible-heavy, acquisition-built balance sheet, and that fact defines how it should be read. Goodwill and intangibles reached $99,175.0M in FY2025 — larger than the entire $81,544.0M of shareholders’ equity, which means tangible book value is negative (YELLOW flag). PP&E, at $23,169.0M, is a fraction of the intangible base; this is not a capital-intensive manufacturer but a portfolio of acquired and internally developed franchises capitalized on the balance sheet. The FY2025 step-up in goodwill and intangibles reflects the capital deployed on Intra-Cellular (bringing CAPLYTA) and Halda, much of it acquired IPR&D and amortizable intangibles. The consequence for the reader: book-value-based ratios — P/B and the equity denominator in ROE — are flattered by goodwill and would be impaired by any large write-down. The Q4 2025 impairment test recorded no goodwill impairment despite the STELARA collapse, and management reclassified DePuy Synthes trademarks from definite-lived to indefinite-lived ahead of the planned Orthopaedics separation, halting their amortization — a defensible but comparability-flattering judgment change to note. With a large base of freshly acquired, single-asset-heavy IPR&D on the books (and a prior IPR&D asset, NM26, already written off after a failed Phase 2b study), impairment risk here is real, not hypothetical.
Leverage stepped up materially in one year, but off a fortress starting point (YELLOW flag). Net debt more than doubled to $28,224.0M from $12,529.0M, driven by senior unsecured notes issued in Q1 2025 to fund the Intra-Cellular acquisition; total debt rose to $47,933.0M and cash fell to $19,709.0M from $24,105.0M. Even after that jump, net debt/EBITDA of 0.9x and debt/equity of 0.6x remain conservative for a business of this cash generation and top-tier credit standing — consistent with the AAA-quality, dividend-aristocrat profile. The maturity ladder is well spread (most debt beyond 2030), a committed credit facility and commercial-paper access remain available, and no financial maintenance covenants are disclosed, so there is no covenant concern in the forensic memo. The nuance a portfolio manager should hold, however, is that the balance-sheet cushion that historically absorbed litigation and M&A shocks has thinned meaningfully in a single year — the filing already earmarks operating cash flow to fund the remaining talc reserve, near-term bond maturities, and the residual opioid settlement.
Working capital is a genuine quality-of-earnings watch item (YELLOW flag). Receivables rose to $17,178.0M and inventory to $14,191.0M in FY2025 — both growing faster than the 6.0% sales growth and the underlying cost-of-goods increase respectively. Receivables outpacing sales and inventory (notably goods-in-process) outpacing COGS absorb cash and are the classic markers of channel loading, slowing collections, or demand mis-forecast; they are a material part of why operating cash flow was flat despite far higher net earnings. The current ratio sits at 1.0x, adequate but no longer carrying spare liquidity. Compounding the estimation risk on the revenue side, the large U.S. gross-to-net rebate reserve is a Critical Audit Matter with prior-period true-ups rising as a share of U.S. Innovative Medicine revenue — the estimate underpinning reported net sales is getting harder to pin down as U.S. mix shifts.
⚠ Items to Watch. If net debt/EBITDA rises materially above the current 0.9x on further debt-funded M&A, the litigation/M&A shock-absorber thins further and could begin to constrain the balance-sheet flexibility that underwrites the dividend. A large talc accrual above the current reserve, or a goodwill/IPR&D impairment on a failed acquired program, would hit the intangible-heavy equity base directly. And receivables or inventory growth persistently outrunning sales — beyond the FY2025 gap — would escalate the working-capital signal from watch item to earnings-quality concern.
3.3A Cash Flow Statement
| FY2021 | FY2022 | FY2023 | FY2024 | FY2025 | |
|---|---|---|---|---|---|
| Cash from Operations ($M) | $23,410.0M | $21,194.0M | $22,791.0M | $24,266.0M | $24,530.0M |
| — Depreciation & Amortization ($M) | $7,390.0M | $6,970.0M | $7,486.0M | $7,339.0M | $7,503.0M |
| Capital Expenditures ($M) | $3,652.0M | $4,009.0M | $4,543.0M | $4,424.0M | $4,832.0M |
| Free Cash Flow ($M) | $19,758.0M | $17,185.0M | $18,248.0M | $19,842.0M | $19,698.0M |
| FCF Margin | 21.1% | 18.1% | 21.4% | 22.3% | 20.9% |
| FCF / Share | $7.39 | $6.45 | $7.13 | $8.17 | $8.11 |
| FCF Conversion (FCF/NI) | 94.6% | 95.8% | 136.9% | 141.1% | 73.5% |
| CapEx / Revenue | 3.9% | 4.2% | 5.3% | 5.0% | 5.1% |
| CapEx / D&A | 0.5x | 0.6x | 0.6x | 0.6x | 0.6x |
| Dividends Paid ($M) | $11,032.0M | $11,682.0M | $11,770.0M | $11,823.0M | $12,381.0M |
| Share Repurchases ($M) | $3,456.0M | $6,035.0M | $5,054.0M | $2,432.0M | $5,953.0M |
Source: Company SEC filings (10-K); figures per the FL model — see Appendix A.1–A.2.
3.3B Cash Flow — Analysis
sources Operating cash flow is the truth-teller in this file, and its message is stability, not the near-doubling of GAAP net income. Cash from operations was $24,530.0M in FY2025 against $24,266.0M in FY2024 — essentially flat — even as reported net income surged to $26,804.0M. That gap is the definitive confirmation that the FY2025 earnings jump is the non-cash talc reserve reversal, not operating improvement. The same mechanism explains the volatile FCF-conversion series: conversion of 136.9% in FY2023 and 141.1% in FY2024 sat well above 100% because talc charges were depressing the net-income denominator, while FY2025 conversion of 73.5% sits below 100% because the talc reversal inflated it. Neither figure is a clean read of cash quality; normalized for the litigation line, conversion is steadier than the series suggests. Free cash flow itself has been remarkably stable — $19,698.0M in FY2025 versus $19,842.0M in FY2024 — with FCF margin holding around 20.9%. The working-capital build in receivables and inventory (3.2B) is the identifiable drag keeping FY2025 operating cash flow from rising with the business.
CapEx intensity is rising modestly, and the CapEx/D&A ratio understates true reinvestment because of the amortization distortion. Capital expenditure rose to $4,832.0M, or 5.1% of revenue, up from 3.9% at the start of the window — a measured increase, not a step-change. The CapEx/D&A ratio of 0.6x screens well below 1.0x, which in a normal industrial would signal harvest mode or underinvestment. Here it does not: D&A of $7,503.0M is heavily inflated by a large acquired-intangible amortization component, so the denominator is not a maintenance-capital proxy. This is the same point in cash terms — because reported FCF adds that amortization back, headline free cash flow flatters true maintenance free cash flow for an acquisition-led compounder that must keep buying pipeline to sustain the base. The reader should discount reported FCF accordingly rather than treat the full amount as distributable.
Capital allocation is disciplined and shareholder-friendly, and the mix fits a mature, moderate-growth franchise. Across the window the two return channels absorb the bulk of free cash flow. Dividends rose every year to $12,381.0M in FY2025 — the visible expression of the multi-decade dividend-aristocrat streak — and buybacks of $5,953.0M supplement them, together consuming close to the $19,698.0M of FY2025 free cash flow. Buybacks are the flex variable: elevated in FY2022 at $6,035.0M, throttled back to $2,432.0M in FY2024, and restored in FY2025 — sensibly dialed against the year’s M&A draw rather than run on autopilot. The FY2023 share-count reduction was a one-off tied to the Kenvue split-off exchange, not organic repurchase. With incremental capital increasingly directed to acquisitions (Intra-Cellular, Halda) funded partly by new debt, the return mix — a growing, near-fully-covered dividend plus opportunistic buybacks — is appropriate for a business whose organic growth is real but modest and whose best marginal use of capital is replenishing the pipeline.
⚠ Items to Watch. The dividend consumed the majority of free cash flow in FY2025; if free cash flow slips below the $12,381.0M dividend outlay in any year — whether from a litigation cash payment, a working-capital drag, or an M&A-driven cash draw — buyback capacity is the first casualty and the coverage cushion on the aristocrat streak narrows. Watch operating cash flow, not GAAP net income, as the coverage denominator.
3.4 Returns Analysis
| FY2021 | FY2022 | FY2023 | FY2024 | FY2025 | |
|---|---|---|---|---|---|
| ROIC | 24.1% | 19.7% | 21.0% | 21.9% | 21.5% |
| ROE | 30.4% | 23.8% | 18.3% | 20.1% | 35.0% |
| ROA | 11.7% | 9.7% | 7.5% | 8.1% | 14.1% |
| Interest Coverage | 127.8x | 84.7x | 27.5x | 27.6x | 26.0x |
Source: Company SEC filings (10-K); figures per the FL model — see Appendix A.1–A.2.
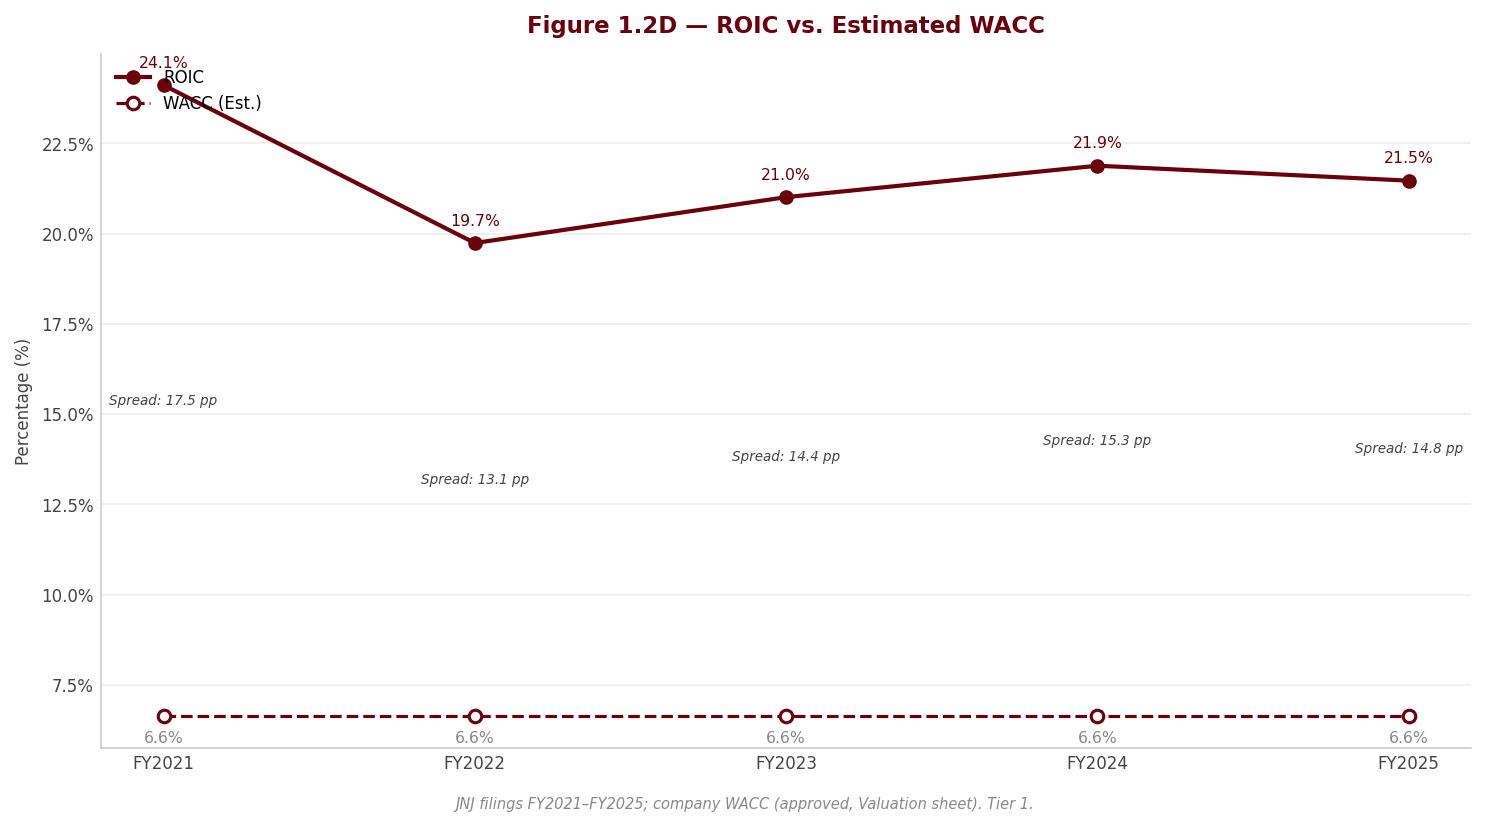
ROIC is the metric that matters most for this business, and it clears the cost of capital by a wide, durable margin. Return on invested capital held in a 19.7%–24.1% band across the window and printed 21.5% in FY2025 — comfortably above the WACC (referenced there as the forward hurdle), and, importantly, built on analyst-constructed EBIT that sits clean of the talc line. That is the reassurance the reported net-income series cannot give: the underlying economic return on the capital deployed in the franchise is stable and value-creative, even as GAAP earnings whipsaw on litigation accruals. The mild compression from the 24.1% FY2021 level reflects the growing invested-capital base as goodwill and intangibles from the M&A program build — the spread over WACC remains the source of value, and it is holding. Interest coverage, while down sharply from 127.8x in FY2021 to 26.0x in FY2025 as new-debt interest expense rose, remains enormous in absolute terms; there is no solvency signal in the decline, only the normalization of a near-debt-free capital structure toward a still-conservative one.
DuPont decomposition exposes why FY2025 ROE is not what it looks like. Return on equity printed 35.0% in FY2025, up steeply from 20.1% — but the decomposition shows the entire lift comes from the wrong place. Net margin of 28.5% multiplied by asset turnover of 0.50x and an equity multiplier of 2.48x reconciles to the reported ROE. The equity multiplier is modest, confirming leverage is not the driver; asset turnover is structurally low, a direct artifact of the intangible-heavy, acquisition-built asset base. The swing factor is the net-margin term — and that 28.5% margin is the talc-inflated figure, not an operating result. Stripped of the reserve reversal, ROE would sit far closer to the FY2024 level than the reported 35.0%. The DuPont read reinforces the section’s throughline: judge this company on ROIC and operating EBIT, treat the FY2025 ROE spike as a litigation-accounting artifact.
3.5 Altman Z-Score (Most Recent FY)
| Component | FY2023 | FY2024 | FY2025 |
|---|---|---|---|
| X1 (Working Capital / Total Assets) | 0.043 | 0.031 | 0.008 |
| X2 (Retained Earnings / Total Assets) | 0.918 | 0.865 | 0.848 |
| X3 (EBIT / Total Assets) | 0.127 | 0.116 | 0.127 |
| X4 (Equity / Total Liabilities) | 0.696 | 0.658 | 0.693 |
| X5 (Revenue / Total Assets) | 0.508 | 0.493 | 0.473 |
| Z-Score | 2.00 | 1.88 | 1.88 |
| Zone | Gray | Gray | Gray |
Source: Company SEC filings (10-K); figures per the FL model — see Appendix A.1–A.2.
The Z-Score sits in the gray zone and drifts marginally lower — and this is a case where the model materially understates true credit quality. At 1.88 in FY2025, down slightly from 2.00 in FY2023, the score falls in the model’s 1.23–2.90 gray band rather than the safe zone. Taken at face value that reads as ambiguous credit — but the Altman model was calibrated to asset-turning manufacturers, and it penalizes Johnson & Johnson precisely where the business is structurally different rather than genuinely weak. The X5 (revenue/total assets) term is depressed by the enormous intangible asset base that a pharmaceutical franchise necessarily carries, and the X1 (working capital/total assets) term is near zero because a cash-generative business runs lean working capital by design. Neither reflects distress. [Rating and price target withdrawn — see the note at the top.] The honest interpretation is to neither soften nor overinterpret: the gray-zone score is a known artifact of applying a manufacturing-calibrated model to an intangible-heavy compounder, and the direct credit metrics — not the Z-Score — are the authoritative read here. The mild downward drift, driven by the rising asset base from M&A, is worth monitoring as a directional signal, but it does not change the conclusion that credit risk is remote.
4. Valuation withdrawn
This section stated what the shares were worth and what to do about them. It rested on an exit multiple set by hand — across the coverage it averaged 24% below where each company actually traded — so the conclusion largely restated that assumption instead of testing it. Rather than leave it standing, it has been withdrawn while the method is rebuilt.
Nothing else in this report depends on it: the financial analysis above and below is drawn from the company's own filings, and every figure links to the page it was verified against.
Section 5 — Financial Metrics & Peer Benchmarking
5.1 Peer Selection
sources We benchmark Johnson & Johnson against the two large-cap US pharmaceutical majors whose scale, R&D intensity, and therapeutic-area overlap make them the most defensible comparators: AbbVie Inc. and Merck & Co., Inc.. Both file US GAAP 10-Ks with December fiscal year-ends identical to JNJ’s, so there is no period mismatch and no accounting-standard translation to caveat — the comparison is like-for-like on timing and framework. We deliberately keep the set tight: two genuinely comparable, primary-sourced peers are worth more than a longer screen padded with names that do not trade or operate on the same terms. Every peer figure in the tables below is taken from that company’s own FY2025 10-K (income and balance-sheet primitives) or from period-end market prices for the valuation multiples; none is sourced from an aggregator.
The single most important qualification is structural, not accounting. JNJ is a two-business company — Innovative Medicine (branded pharmaceuticals) plus MedTech (surgical, orthopaedics, cardiovascular, vision), the latter roughly a third of sales and carrying structurally lower gross and EBITDA margins and slower growth than branded drugs. AbbVie and Merck are, for practical purposes, pure-pharma. MedTech therefore mechanically drags JNJ’s consolidated gross and EBITDA margins toward a blended average that sits below what a pure-pharma read would show; the reader should not conclude from the consolidated margin line that JNJ’s drug economics are inferior to the peers’ — they are not, they are diluted by a device business the peers do not carry. Where the comparison bites hardest and cleanest is leverage and balance-sheet quality, where the three diverge sharply and the difference is real rather than an artifact.
| Peer | Ticker | Exchange | Filing Type | Accounting Standard | Fiscal Year End | Comparability Note |
|---|---|---|---|---|---|---|
| AbbVie Inc. | ABBV | NYSE | 10-K | US GAAP | December | Pure-pharma; negative book equity and heavy acquisition-accounting charges make GAAP net income, ROE, D/E, and book value per share not meaningful — steer to EBIT/EBITDA, net-debt/EBITDA, and FCF. |
| Merck & Co., Inc. | MRK | NYSE | 10-K | US GAAP | December | Pure-pharma; FY2025 earnings are the cleanest of the three, but heavy Keytruda concentration and a ~2028 loss-of-exclusivity colour the growth read and the low multiple. |
Source: Peer-company SEC filings (AbbVie FY2025 10-K; Merck FY2025 10-K); comparability notes in 5.7 — see Appendix A.1.
5.2 Profitability Comparison
sources Comparative: Most Recent Full Fiscal Year (FY2025)
| Metric | Johnson & Johnson | AbbVie Inc. | Merck & Co., Inc. |
|---|---|---|---|
| Revenue ($M) | $94,193.0M | $61,160.0M | $65,011.0M |
| Gross Margin | 67.9% | 70.2%ᵃ | 74.8% |
| EBITDA Margin | 34.8% | 38.0% | 41.6% |
| EBIT Margin | 26.8% | 24.6% | 32.6%ᵇ |
| Net Margin | 28.5%ᶜ | 6.9%ᵈ | 28.1% |
| FCF Margin | 20.9% | 29.1% | 19.0% |
Source: Peer-company SEC filings (AbbVie FY2025 10-K; Merck FY2025 10-K); comparability notes in 5.7 — see Appendix A.1.
Footnotes: ᵃ AbbVie’s gross margin is overstated versus JNJ and Merck because AbbVie reports acquired-intangible amortization on a separate line rather than within cost of sales. ᵇ Merck’s EBIT/EBIT-margin is an analyst construction (no operating-income subtotal on the face), computed on the same basis as JNJ, so the JNJ-vs-Merck EBIT comparison is like-for-like. ᶜ JNJ’s FY2025 net margin is flattered by a large talc-litigation reserve reversal. ᵈ AbbVie’s GAAP net margin is depressed by intangible amortization, contingent-consideration remeasurement, and acquired IPR&D — low comparability.
The disciplined read is to anchor on EBIT and EBITDA and to treat GAAP net margin as low-comparability across the entire set, because net income is distorted in three different directions. JNJ’s FY2025 net margin of 28.5% is inflated by the reversal of a talc-litigation reserve — a non-cash, non-operating tailwind — and is not a clean read of underlying earnings power. AbbVie’s 6.9% is the mirror image: crushed by a large block of non-cash intangible amortization plus contingent-consideration remeasurement and acquired IPR&D tied to the Allergan deal, which is why its GAAP net margin sits in single digits despite robust cash economics. Merck’s 28.1% is the cleanest of the three in FY2025, and it happens to land within a whisker of JNJ’s talc-inflated figure — a coincidence, not a like-for-like equivalence.
The operating lines tell the real story, and the most revealing feature is a crossover between EBIT and EBITDA. On EBIT margin, JNJ’s 26.8% sits above AbbVie’s 24.6% and below Merck’s 32.6%. But on EBITDA margin the order flips against JNJ: JNJ’s 34.8% falls below both AbbVie’s 38.0% and Merck’s 41.6%. The reason is AbbVie’s amortization load. AbbVie’s operating earnings are struck after a very large block of acquired-intangible amortization, so its EBIT margin is depressed to a level below JNJ’s; add that amortization back and AbbVie’s EBITDA margin vaults above JNJ’s, exposing the strong underlying pharma economics the acquisition accounting obscures. JNJ, by contrast, carries a smaller amortization wedge and a genuine MedTech dilution, so its EBITDA margin trails the two pure-pharma peers. Merck sits at the top on both operating lines — the pure-pharma, high-price-mix signature — and JNJ’s position below it is a business-mix consequence, not a drug-economics deficiency: JNJ’s Innovative Medicine segment on a stand-alone basis would compare far more closely to Merck. On gross margin, JNJ’s 67.9% trails both peers, but AbbVie’s apparent 70.2% edge is partly the same classification artifact (amortization kept out of COGS), while Merck’s 74.8% reflects a richer branded mix with no device drag. The one line where a pure-pharma peer clearly beats JNJ on economics rather than accounting is FCF margin: AbbVie converts 29.1% of revenue to free cash flow against JNJ’s 20.9%, a function of AbbVie’s very low capital intensity — a point developed in 5.4 and 5.6. Merck’s 19.0% FCF margin sits just below JNJ’s, held back by a heavier capex programme and a weaker FY2025 operating-cash-flow year.
Historical: Johnson & Johnson Own 5-Year Progression
| Metric | FY2021 | FY2022 | FY2023 | FY2024 | FY2025 |
|---|---|---|---|---|---|
| Gross Margin | 68.2% | 67.3% | 68.8% | 69.1% | 67.9% |
| EBITDA Margin | 32.8% | 32.0% | 33.7% | 31.7% | 34.8% |
| EBIT Margin | 24.9% | 24.6% | 24.9% | 23.4% | 26.8% |
| Net Margin | 22.3% | 18.9% | 15.6% | 15.8% | 28.5% |
| FCF Margin | 21.1% | 18.1% | 21.4% | 22.3% | 20.9% |
Source: JNJ FY2025 10-K (three-year statements) and prior filings; comparability notes in 5.7 — see Appendix A.1.
JNJ’s own five-year record confirms that the operating lines are the stable ones and the net line is the noisy one. Gross and EBITDA margins have held in a tight band across the period — evidence of a durable, mix-resilient cost structure. Net margin, by contrast, swings on litigation and separation accounting: it compressed through FY2023–FY2024 as the talc reserve was built and the Kenvue consumer-health separation worked through, then spiked to 28.5% in FY2025 on the reserve reversal. FCF margin — the metric hardest to manipulate — has been the steadiest of all, sitting around a fifth of revenue throughout, the cleanest evidence that the underlying cash engine is unchanged regardless of what the GAAP net line does in any single year.
5.3 Returns Comparison
sources Comparative: Most Recent Full Fiscal Year (FY2025)
| Metric | Johnson & Johnson | AbbVie Inc. | Merck & Co., Inc. |
|---|---|---|---|
| ROIC | 21.5%ᵍ | 15.1% | 18.0% |
| ROE | 35.0%ᵉ | —ᶠ | 36.9% |
| ROA | 14.1%ᵉ | 3.1% | 14.4% |
| Asset Turnover | 0.47x | 0.46x | 0.51x |
Source: Peer-company SEC filings (AbbVie FY2025 10-K; Merck FY2025 10-K); comparability notes in 5.7 — see Appendix A.1.
Footnotes: ᵉ JNJ’s FY2025 ROE and ROA are flattered by the same talc-reserve reversal that inflated net income; underlying returns are lower. ᶠ AbbVie’s ROE is not meaningful — the company carries negative book equity (an accumulated deficit from Allergan goodwill and sustained buybacks), so a book-based return is reported as not meaningful rather than as a spurious figure. ᵍ JNJ’s ROIC is the model’s EBIT-NOPAT-over-invested-capital figure; the peer ROICs are the peer-researcher’s own computations on a marginally different NOPAT/invested-capital basis, so the ordering should be read as directional rather than precise.
All three companies earn returns on invested capital comfortably above their cost of capital of 6.63%, which is the first-order test of value creation — each is compounding, not merely turning the crank. On invested capital the three cluster in the mid-to-high teens to low-twenties, with JNJ’s 21.5%, Merck’s 18.0% and AbbVie’s 15.1% all clearing the hurdle by a wide margin; AbbVie’s is the lowest of the three, weighed down by the enormous goodwill and intangible base its acquisitions put on the balance sheet. We caution against reading JNJ’s apparent lead too literally: the subject ROIC is struck on the model’s operating-NOPAT basis, whereas the peer figures come from the peer-researcher’s own construction, and a like-for-like recomputation narrows the gap materially — the robust conclusion is that JNJ and Merck are the stronger compounders and AbbVie the laggard, not that JNJ decisively out-returns Merck.
The equity-return lines demand more care still. JNJ’s reported ROE of 35.0% and ROA of 14.1% are FY2025 highs, but both are flattered by the talc-reserve reversal running through net income and should be read down toward the low-twenties ROE and high-single-digit ROA the franchise has historically produced. On that normalized basis Merck’s 36.9% ROE and 14.4% ROA are the genuinely stronger of the two clean names. AbbVie’s ROE is simply not meaningful — negative book equity makes any book-based return a mathematical artifact — which is why we report it as not meaningful and lean on net-debt/EBITDA, coverage, and FCF for that name instead; its 3.1% ROA, depressed by the same amortization that crushes net income, understates its cash-return reality. Asset turnover is near-identical across the set at roughly half a turn (0.47x for JNJ against 0.46x and 0.51x), the low capital velocity characteristic of high-margin, IP-heavy pharma — returns here are made on margin, not on churning the asset base.
Historical: Johnson & Johnson Own 5-Year Progression
| Metric | FY2021 | FY2022 | FY2023 | FY2024 | FY2025 |
|---|---|---|---|---|---|
| ROIC | 24.1% | 19.7% | 21.0% | 21.9% | 21.5% |
| ROE | 30.4% | 23.8% | 18.3% | 20.1% | 35.0% |
| ROA | 11.7% | 9.7% | 7.5% | 8.1% | 14.1% |
Source: JNJ FY2025 10-K and prior filings; comparability notes in 5.7 — see Appendix A.1.
JNJ’s ROIC has been remarkably stable in the low-twenties across the five years, through the Kenvue separation and the talc-reserve cycle — a signature of a diversified franchise whose returns do not hinge on any single product or one year’s accounting. ROE and ROA show far more volatility (ROE dipping toward the high-teens in FY2023 before the FY2025 rebound), but that volatility is a net-income-driven artifact, not a change in the operating business. The FY2025 equity-return print reads as a peak; a normalized view returns the franchise to the durable, above-cost-of-capital band it has occupied throughout.
5.4 Leverage & Liquidity Comparison
sources Comparative: Most Recent Full Fiscal Year (FY2025)
| Metric | Johnson & Johnson | AbbVie Inc. | Merck & Co., Inc. |
|---|---|---|---|
| Net Debt / EBITDA | 0.9x | 2.7x | 1.3x |
| Total Debt / Equity | 0.6x | —ʰ | 0.9x |
| Interest Coverage | 26.0x | 5.7x | 15.6x |
| Current Ratio | 1.0x | 0.7x | 1.5x |
| FCF Margin | 20.9% | 29.1% | 19.0% |
Source: Peer-company SEC filings (AbbVie FY2025 10-K; Merck FY2025 10-K); comparability notes in 5.7 — see Appendix A.1.
Footnote: ʰ AbbVie’s Total Debt / Equity is not meaningful — the denominator (book equity) is negative — so leverage for that name is assessed on net-debt/EBITDA and interest coverage.
This is where the three genuinely separate, and the spread is a real balance-sheet-quality differentiator rather than a comparability artifact. [Rating and price target withdrawn — see the note at the top.] Merck sits in the middle — net-debt/EBITDA of 1.3x and coverage of 15.6x — with leverage having ticked up in FY2025 to fund the Verona Pharma acquisition. AbbVie is the outlier at 2.7x net-debt/EBITDA, the legacy of Allergan-deal financing, and it carries both the thinnest coverage at 5.7x and negative book equity, which is why its debt-to-equity is unusable and we assess it on net-debt/EBITDA and coverage alone. The mitigant for AbbVie is its cash generation: a 29.1% FCF margin, the highest of the set, is what services that debt and explains why the market tolerates the leverage — but it leaves materially less room for error than JNJ’s balance sheet. On the current ratio, Merck’s 1.5x screens above JNJ’s 1.0x and AbbVie’s 0.7x, reflecting Merck’s larger cash balance rather than any JNJ weakness — JNJ deliberately runs a tighter current ratio funded by commercial paper, consistent with its top-tier access to short-term markets. The practical read for a portfolio manager: JNJ has by far the most balance-sheet optionality of the three — capacity to absorb litigation outflows, fund bolt-on M&A, and sustain its dividend through a downturn without stress — and that conservatism, for a company still carrying tail talc litigation exposure, is a feature rather than a drag.
5.5 Valuation Multiples Comparison
sources Comparative: Current Price
| Metric | Johnson & Johnson | AbbVie Inc. | Merck & Co., Inc. |
|---|---|---|---|
| EV/EBITDA | 20.8x | 21.4x | 13.0x |
| P/E | 24.6x | 104.3xⁱ | 17.6x |
| FCF Yield | 3.0% | 4.1% | 3.9% |
Source: Peer-company SEC filings for net debt and share counts; equity prices market-sourced as of 2026-08-03 close; comparability notes in 5.7 — see Appendix A.1.
All peer valuation multiples are market-sourced (equity prices as of 2026-08-03 close) and subject to change with price movements.
Footnote: ⁱ AbbVie’s GAAP P/E is not economically meaningful — the denominator (GAAP EPS) is suppressed by non-cash acquisition-accounting charges. Use EV/EBITDA and FCF yield for cross-company valuation.
Given the earnings distortions catalogued above, EV/EBITDA and FCF yield are the honest cross-company yardsticks and P/E should be discounted at both ends: AbbVie’s ~triple-digit GAAP P/E of 104.3x is a mechanical consequence of a suppressed denominator, not a statement about value, while JNJ’s own 24.6x is understated in the opposite direction because the talc reversal inflated its earnings base. On EV/EBITDA, JNJ at 20.8x trades at a clear premium to Merck’s 13.0x and a modest discount to AbbVie’s 21.4x. This is the crux of the relative-value case. The premium to Merck is not mispricing: the market is discounting Merck’s heavy Keytruda concentration and its ~2028 loss-of-exclusivity, and is offering, in exchange for that concentration risk, a cheaper, higher-operating-margin asset yielding 3.9% of free cash flow. The near-parity with AbbVie is the more debatable line — an investor is paying a similar multiple for JNJ’s mid-single-digit growth and AAA balance sheet as for AbbVie’s faster post-Humira growth inflection and superior FCF conversion, but at AbbVie you accept 2.7x net-debt/EBITDA leverage, negative book equity, and a narrower franchise. JNJ’s 3.0% FCF yield is the lowest of the three, sitting below both AbbVie’s 4.1% and Merck’s 3.9% — the numerical expression of the quality premium the reader is paying for JNJ’s balance-sheet strength, diversification, and dividend durability.
Historical: Johnson & Johnson EV/EBITDA (period-end price)
| FY2021 | FY2022 | FY2023 | FY2024 | FY2025 |
|---|---|---|---|---|
| 15.5x | 16.3x | 14.2x | 12.9x | 16.2x |
Source: JNJ FY2025 10-K (EBITDA) and period-end market prices; comparability notes in 5.7 — see Appendix A.1.
[Rating and price target withdrawn — see the note at the top.] The current-price multiple of 20.8x sits above that historical band, reflecting recent share-price appreciation — the stock is not cheap against its own past, and a premium of this size has to be earned by the balance-sheet-quality and diversification argument rather than by growth, which is only mid-single-digit.
5.6 Efficiency Comparison
| Metric | Johnson & Johnson | AbbVie Inc. | Merck & Co., Inc. |
|---|---|---|---|
| Days Sales Outstanding | 62 days | 75 days | 66 days |
| Days Inventory Outstanding | 161 days | 99 days | 148 daysʲ |
| Days Payables Outstanding | 135 days | — | 98 days |
| Cash Conversion Cycle | 88 days | — | 116 days |
| CapEx / Revenue | 5.1% | 2.0% | 6.3% |
Source: Peer-company SEC filings (AbbVie FY2025 10-K; Merck FY2025 10-K); comparability notes in 5.7 — see Appendix A.1.
Footnotes: AbbVie’s DPO and Cash Conversion Cycle are shown as not available — AbbVie reports trade payables combined with accrued liabilities on a single line, so they cannot be isolated cleanly and are omitted rather than computed off a contaminated denominator. ʲ Merck’s inventory days understate true inventory because a material amount of inventory is classified in long-term other assets, off the current line.
The efficiency comparison mostly reflects business mix rather than working-capital skill, and it rewards a careful read because the headline lines pull in opposite directions. On collections, JNJ is the fastest of the set: days sales outstanding of 62 days undercuts both Merck’s 66 days and AbbVie’s 75 days — a modest but genuine edge. The standout on the other side is inventory: JNJ’s 161 days of inventory sits far above AbbVie’s 99 days and above Merck’s 148 days, because JNJ carries physical MedTech inventory — surgical instruments, implants, hospital consignment stock — that a pure-drug company does not. That is a mix consequence, not a red flag. Crucially, it does not translate into a worse cash-conversion cycle: JNJ’s longer payables terms (135 days against Merck’s 98 days) offset the inventory build, so JNJ’s cash-conversion cycle of 88 days actually runs below Merck’s 116 days. AbbVie’s cash-conversion cycle cannot be computed cleanly and is omitted rather than estimated off a contaminated payables line. On capital intensity, JNJ’s CapEx/Revenue of 5.1% sits well above AbbVie’s 2.0% — again the MedTech effect, since device manufacturing is more capital-hungry than small-molecule and biologic production — and just below Merck’s 6.3%. AbbVie’s very low capital intensity is the pure-pharma, IP-driven model in its purest form and is precisely what drives its sector-leading FCF margin noted in 5.2. None of these efficiency lines changes the investment case; they confirm that JNJ is structurally a hybrid whose consolidated efficiency metrics must always be read with the device business in mind.
5.7 Comparability Caveats
sources Six comparability issues are material enough to govern how every table above should be read, and are disclosed here in full rather than buried.
1. Business-mix mismatch (all metrics). JNJ is pharma plus MedTech; AbbVie and Merck are pure-pharma. MedTech — roughly a third of JNJ’s sales, at structurally lower margin and slower growth — drags JNJ’s consolidated gross and EBITDA margins toward a blended average below a pure-pharma comparison, and lifts its inventory days and capital intensity. Do not read JNJ as “less profitable” than the peers from the consolidated line; on an Innovative Medicine stand-alone basis the gap narrows sharply.
2. GAAP net income is distorted three different ways (net margin, P/E, ROE, ROA). JNJ’s FY2025 net income is inflated by a talc-litigation reserve reversal, flattering its net margin, P/E, ROE, and ROA. AbbVie’s is crushed by a large block of non-cash intangible amortization plus contingent-consideration remeasurement and acquired IPR&D, rendering its GAAP net margin and ~triple-digit P/E not economically meaningful. Merck’s FY2025 is the cleanest of the three. All profitability and equity-return conclusions should be drawn from EBIT and EBITDA, which neutralize amortization and one-offs — not from net margin or P/E. Note the direction of the JNJ distortion is opposite to AbbVie’s: JNJ’s talc tailwind understates its P/E and overstates its ROE/ROA.
3. AbbVie carries negative book equity (ROE, D/E, BVPS, gross margin). An accumulated deficit from Allergan goodwill and sustained buybacks leaves AbbVie with negative total stockholders’ equity, so its ROE, debt-to-equity, and book value per share are not meaningful and are reported as such rather than as spurious numbers (a naive ROE calculation returns an absurd figure). Separately, AbbVie’s gross margin is overstated versus JNJ and Merck because it keeps acquired-intangible amortization out of cost of sales — a classification difference, not a genuine cost advantage — and that same amortization is what depresses AbbVie’s EBIT margin below JNJ’s while its EBITDA margin sits above JNJ’s.
4. The leverage spread is real, not an artifact (net-debt/EBITDA, D/E, coverage). JNJ (AAA, the lowest net-debt/EBITDA and strongest coverage of the set) versus Merck (mid-range, debt up on Verona Pharma) versus AbbVie (the most levered, thinnest coverage, negative equity) is a genuine balance-sheet-strength finding. Because AbbVie’s debt-to-equity is unusable, leverage across the set is assessed primarily on net-debt/EBITDA and interest coverage.
5. Merck’s EBIT is an analyst construction (EBIT, EBIT margin, coverage). Merck’s income statement shows no operating-income subtotal and nets interest inside “Other (income) expense, net.” Merck’s EBIT here is built as sales less cost of sales, SG&A, R&D, and restructuring — the same convention applied to JNJ’s split-line EBIT — so the JNJ-versus-Merck EBIT comparison is like-for-like. AbbVie’s operating earnings, by contrast, are reported directly on the face.
6. Working-capital and returns-basis comparability limits (DPO, CCC, inventory days, ROIC). AbbVie reports trade payables combined with accrued liabilities on one line, so its DPO and cash-conversion cycle cannot be isolated cleanly and are omitted rather than computed off a contaminated denominator. Merck’s current inventory excludes a material amount of inventory classified in long-term other assets, so its reported inventory days understate the true figure. JNJ’s and Merck’s trade payables are clean. Separately, the subject ROIC in 5.3 is computed on the model’s operating-NOPAT-over-invested-capital basis, whereas the peer ROICs are the peer-researcher’s own computations; the two rest on marginally different NOPAT and invested-capital definitions, so JNJ’s apparent ROIC lead over Merck should be read as directional, and the safe conclusion is that all three clear their cost of capital with JNJ and Merck the stronger compounders.
A note on patent cliffs. All three face loss-of-exclusivity risk that colours the growth comparison and should be read alongside the multiples. JNJ faces Stelara biosimilar erosion, cushioned by Darzalex, Tremfya, Carvykti, and the MedTech portfolio. AbbVie is already absorbing Humira biosimilar erosion, with Skyrizi and Rinvoq as the offset — its FY2025 growth reflects the post-Humira inflection, which helps explain why its multiple carries a growth premium despite its balance sheet. Merck carries heavy Keytruda concentration with a ~2028 loss of exclusivity, so its subdued FY2025 growth understates the nearer-term revenue risk embedded in its lower valuation. All three share December fiscal year-ends, so periods are aligned and no timing caveat applies.
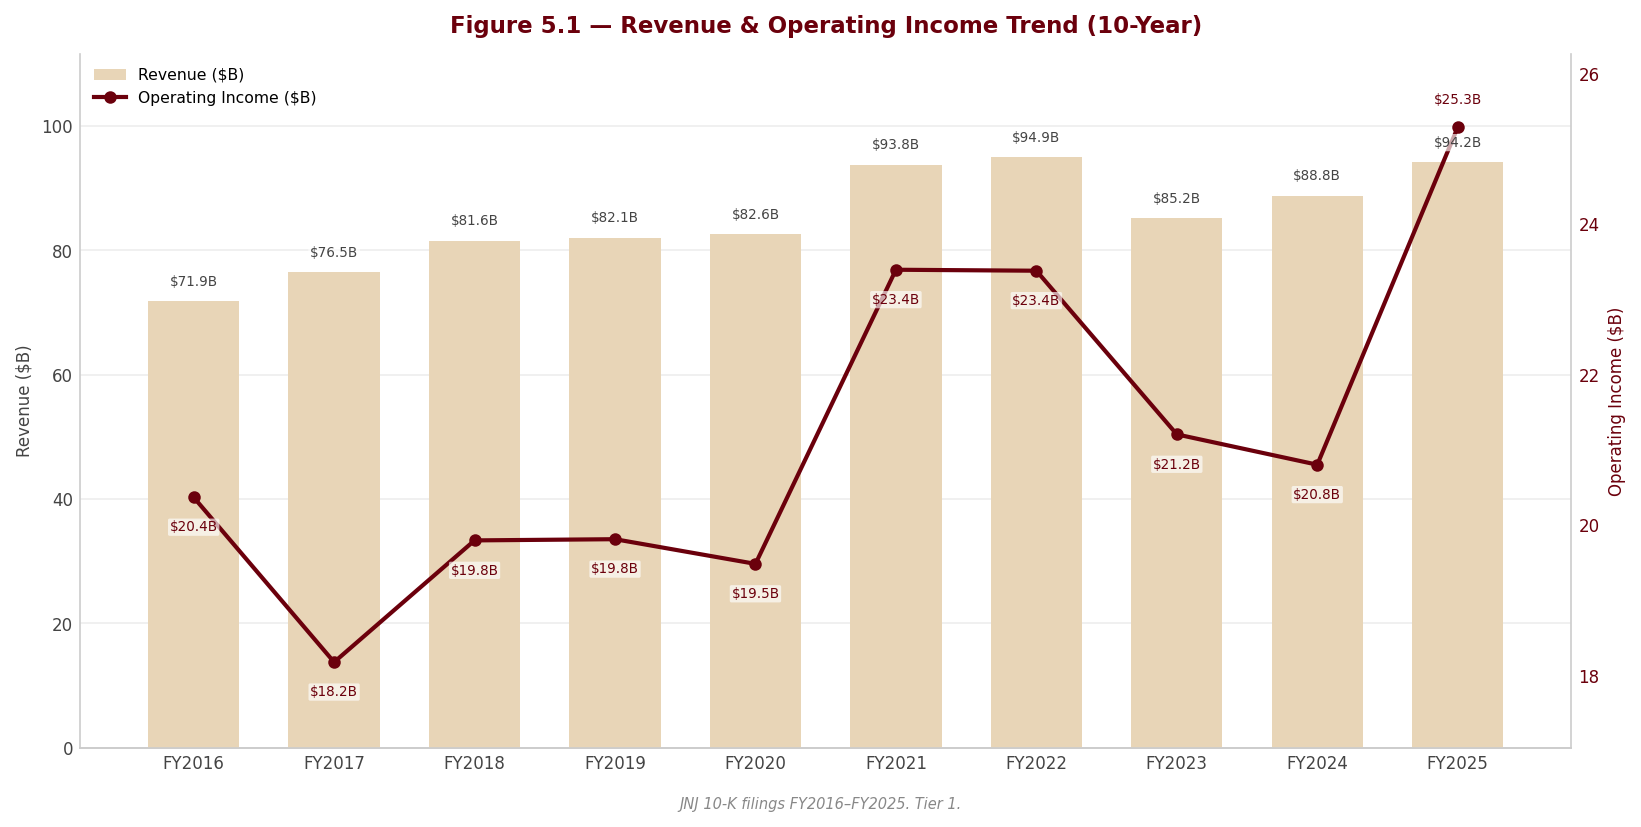
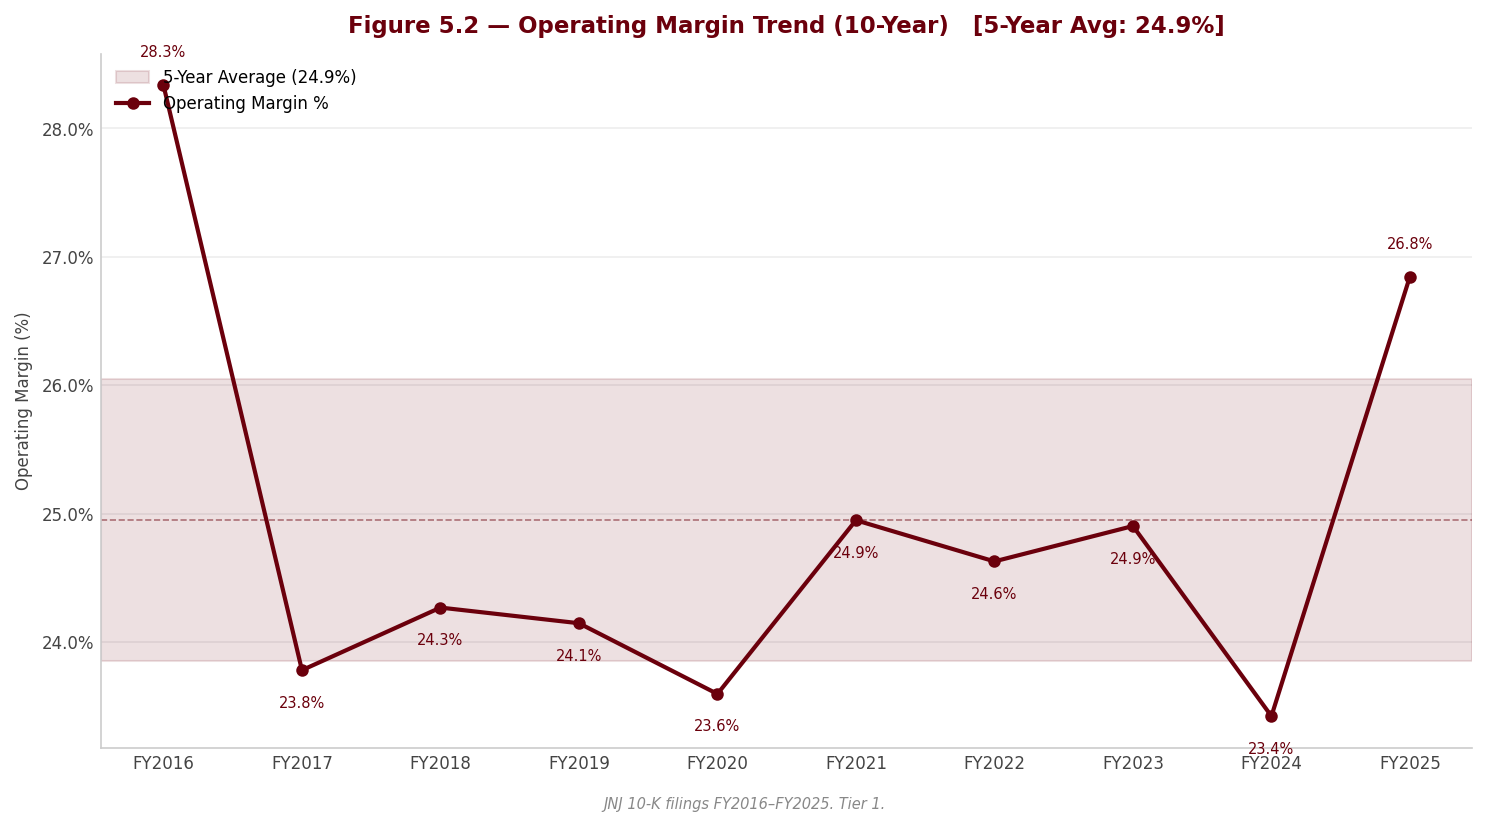
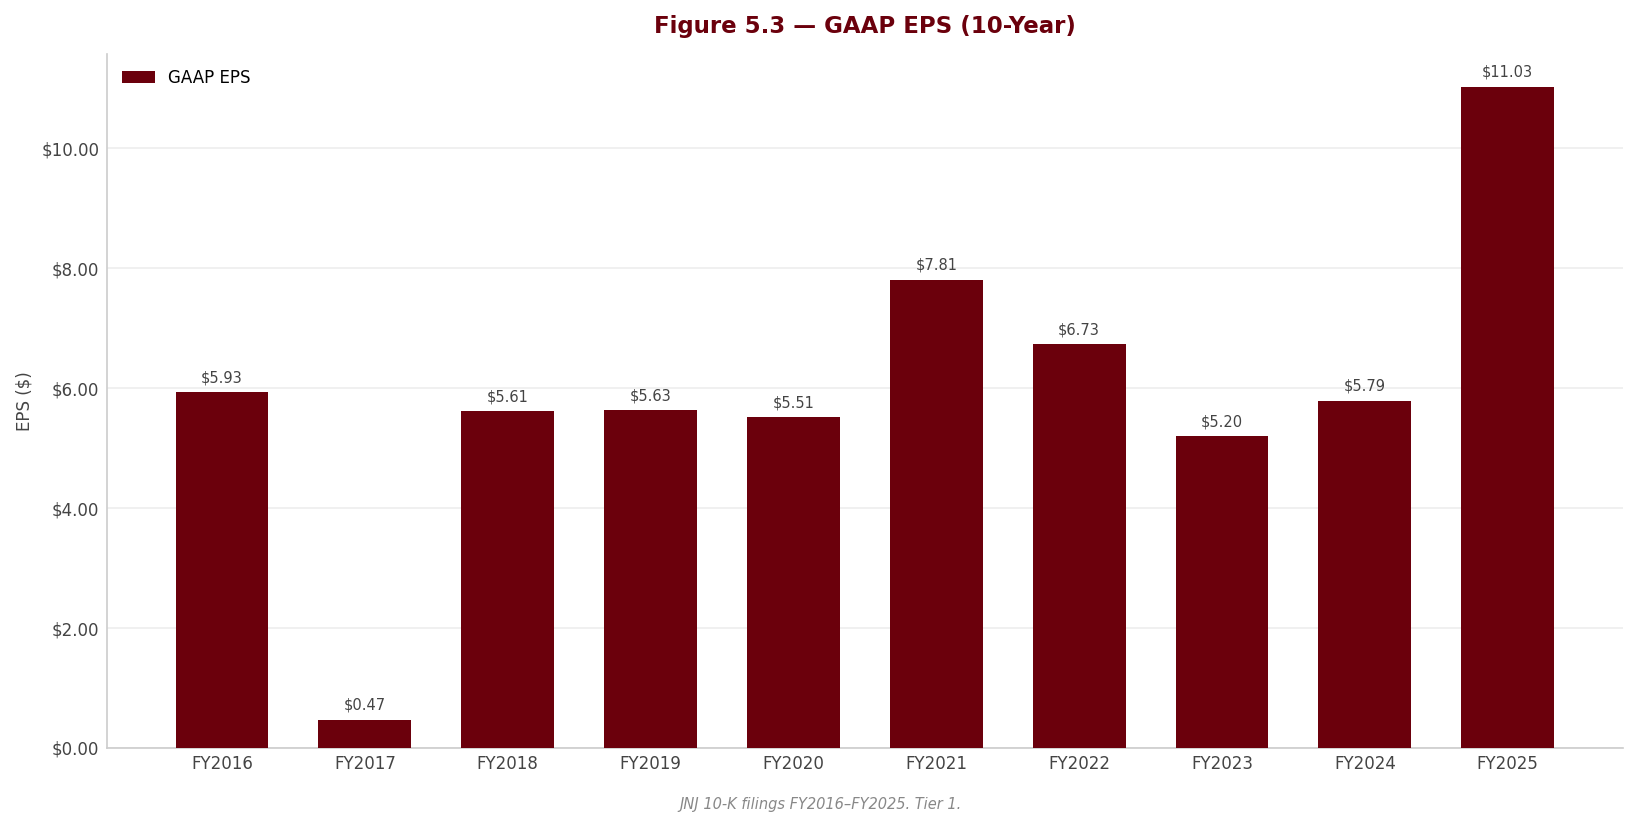
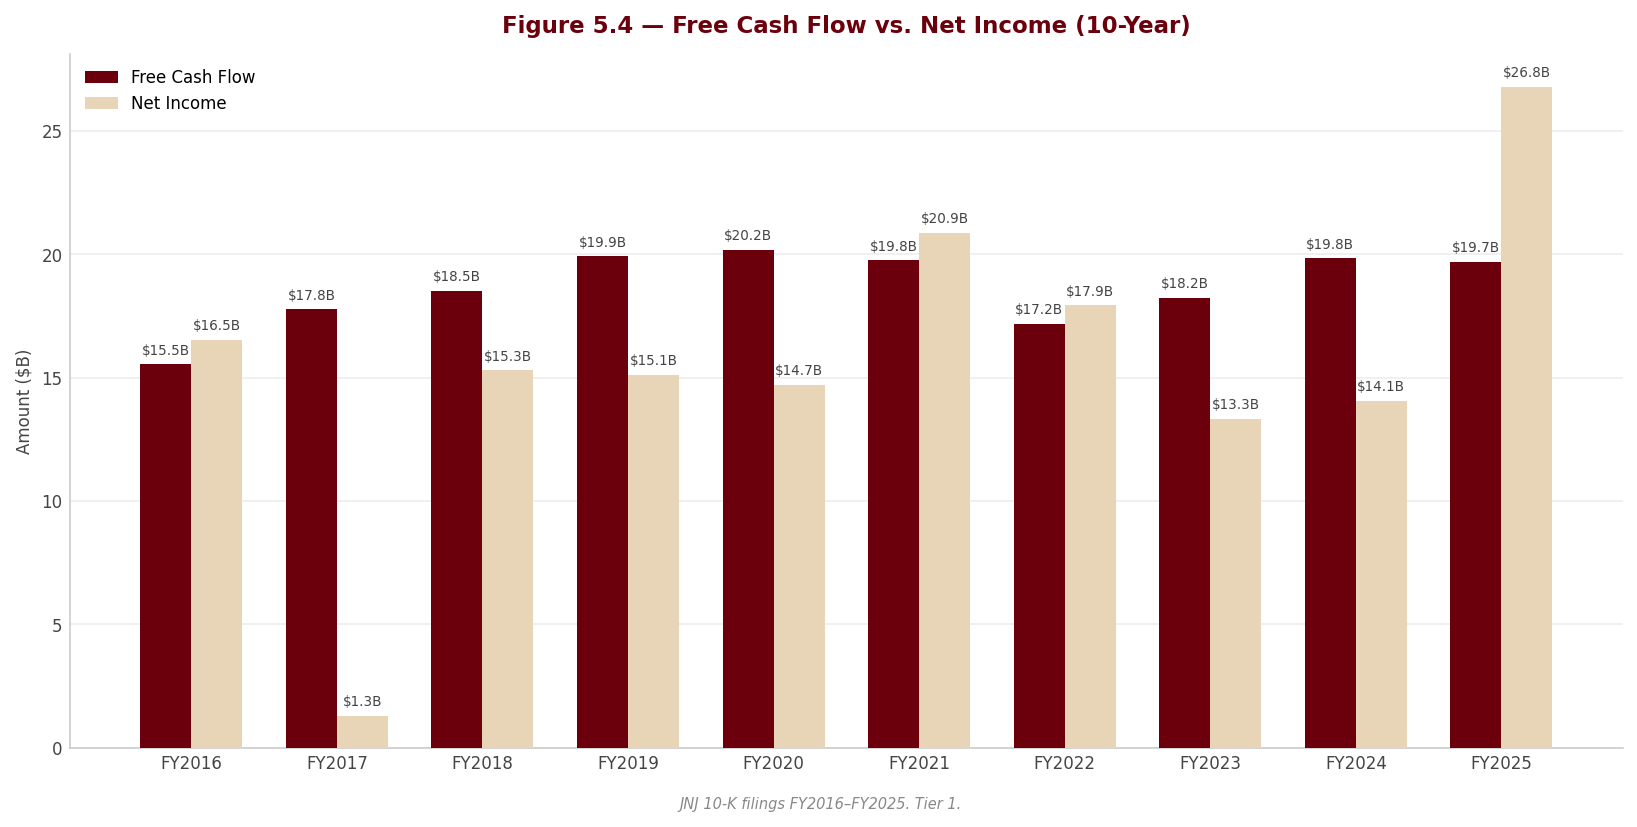
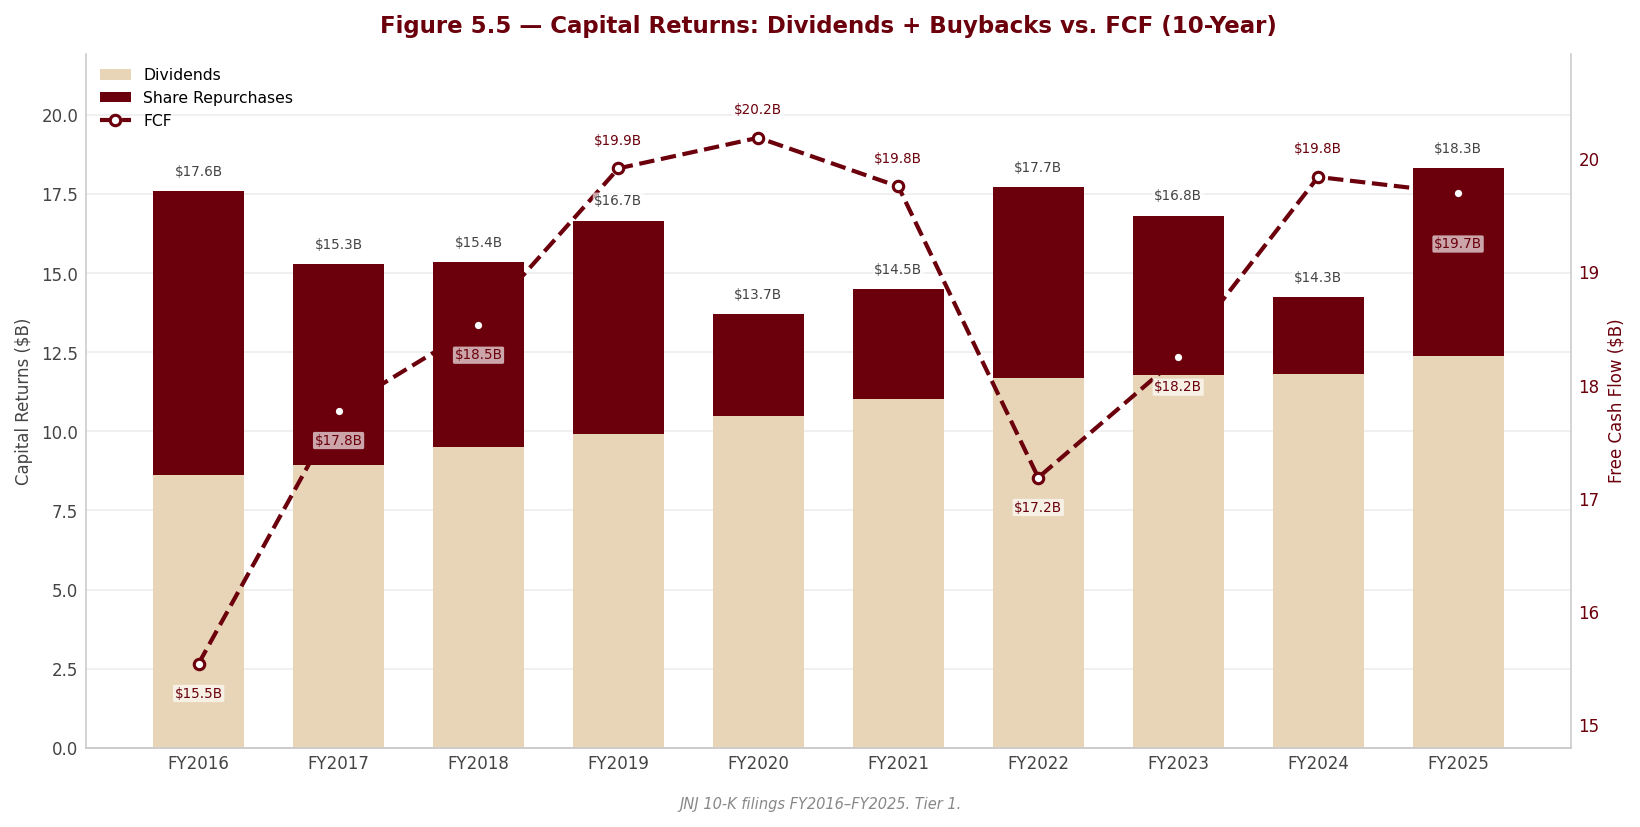
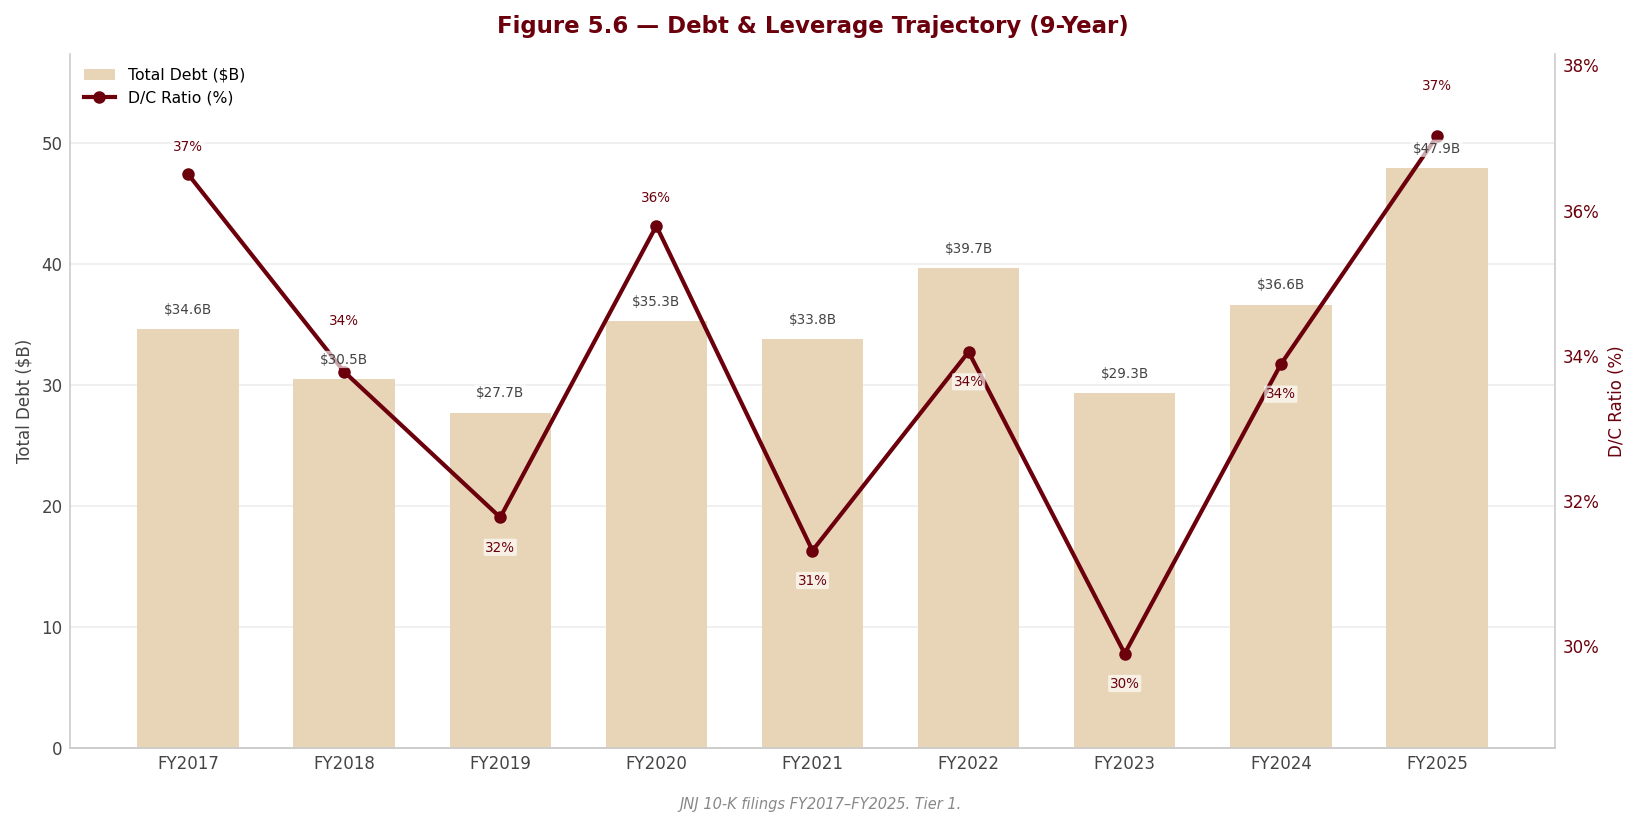
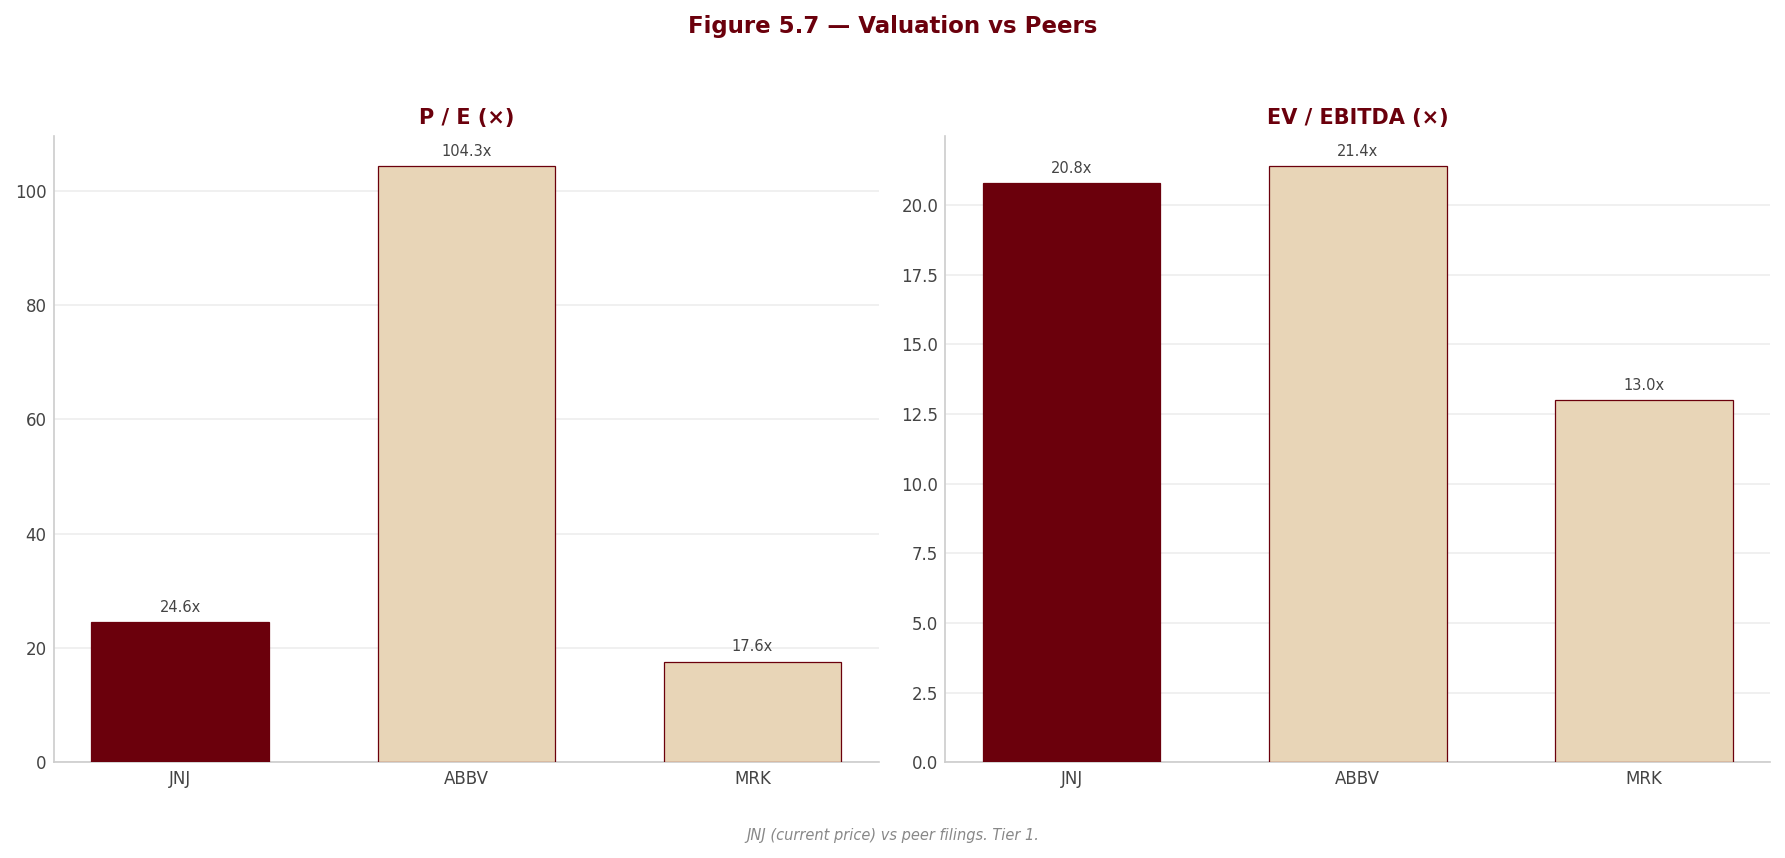
6. Valuation & Price Target withdrawn
This section stated what the shares were worth and what to do about them. It rested on an exit multiple set by hand — across the coverage it averaged 24% below where each company actually traded — so the conclusion largely restated that assumption instead of testing it. Rather than leave it standing, it has been withdrawn while the method is rebuilt.
Nothing else in this report depends on it: the financial analysis above and below is drawn from the company's own filings, and every figure links to the page it was verified against.
Section 7 — Quarterly Update: Q2 2026
sources This update covers Q2 2026 (the fiscal second quarter ended June 28, 2026). Johnson & Johnson has a December 52/53-week fiscal year-end. All standalone-quarter figures are as reported in the Q2 2026 Form 10-Q; year-over-year (YoY) comparisons are versus Q2 2025 and sequential (QoQ) comparisons versus Q1 2026. Page references throughout this section are the PDF pages of the filing copy on record, consistent with the citation convention used elsewhere in this report.
Portfolio Action
[Rating and price target withdrawn — see the note at the top.]
| Assessment | |
|---|---|
| Action | [Rating and price target withdrawn — see the note at the top.] |
| Reason | [Rating and price target withdrawn — see the note at the top.] Net income was flat (-0.1% to $5,534.0M) and diluted EPS fell 0.9% on a diluted share count up 0.9% (2,440.1M vs 2,419.1M), talc is re-accruing at $0.4 billion per quarter against a $3.7 billion reserve facing ~76,000 pending claimants, and first-half capital returns of $10.6 billion exceeded first-half FCF of $8.8 billion, with commercial paper up $3.4 billion since year-end funding the gap (10-Q pp. 12, 41, 43, 56, 61, 96). |
| Thesis intact? | [Rating and price target withdrawn — see the note at the top.] Operating strength was already in the price; it is not new information. |
| Trigger to revisit | [Rating and price target withdrawn — see the note at the top.] |
Source: JNJ Form 10-Q for the fiscal second quarter ended June 28, 2026; FL valuation model (Valuation sheet) for the rating, fair-value and price references — see Appendix A.1–A.2.
7.1 Results at a Glance
| Metric | Q2 2026 | Q2 2025 | YoY Δ | Q1 2026 | QoQ Δ |
|---|---|---|---|---|---|
| Revenue ($M) | $25,310.0M | $23,743.0M | +6.6% | $24,062.0M | +5.2% |
| Gross Profit ($M) | $17,259.0M | $16,115.0M | +7.1% | $15,956.0M | +8.2% |
| Gross Margin | 68.2% | 67.9% | +0.3 pp | 66.3% | +1.9 pp |
| EBITDA ($M) | $9,133.0M | $8,653.0M | +5.5% | $8,363.0M | +9.2% |
| EBITDA Margin | 36.1% | 36.4% | -0.3 pp | 34.8% | +1.3 pp |
| EBIT ($M) ᵃ | $7,174.0M | $6,710.0M | +6.9% | $6,359.0M | +12.8% |
| EBIT Margin | 28.3% | 28.3% | 0.0 pp | 26.4% | +1.9 pp |
| Net Income ($M) | $5,534.0M | $5,537.0M | -0.1% | $5,235.0M | +5.7% |
| Net Margin | 21.9% | 23.3% | -1.4 pp | 21.8% | +0.1 pp |
| Diluted EPS | $2.27 | $2.29 | -0.9% | $2.14 | +6.1% |
YoY Δ is computed as (CQ - PYSQ) / |PYSQ| × 100 — revenue: (25,310 - 23,743) / 23,743 × 100 = +6.6%. QoQ Δ is computed as (CQ - PQ) / |PQ| × 100 — revenue: (25,310 - 24,062) / 24,062 × 100 = +5.2%. Margins are computed as metric / revenue × 100 — gross margin CQ: 17,259 / 25,310 × 100 = 68.2% (this ties exactly to the filing’s own “Percent to Sales” column, 10-Q p. 12); EBITDA margin CQ: 9,133 / 25,310 × 100 = 36.1%; EBIT margin CQ: 7,174 / 25,310 × 100 = 28.3%; net margin CQ: 5,534 / 25,310 × 100 = 21.9%. Margin deltas are in percentage points (CQ margin - comparator margin).
ᵃ Johnson & Johnson does not present an operating-income subtotal on the face of its earnings statement. EBIT here is the workbook’s consistent definition — gross profit less SG&A less R&D: 17,259 - 6,432 - 3,653 = $7,174.0M in Q2 2026 (Q2 2025: 16,115 - 5,889 - 3,516 = $6,710.0M) — excluding interest, Other (income) expense net, and the Restructuring line, which the filing reports below these operating lines. The bridge to reported pre-tax income ties exactly: 7,174 + 219 interest income - 281 interest expense - 331 other expense - 34 restructuring = $6,747M (10-Q p. 12).
Source: JNJ Q2 2026 Form 10-Q — Consolidated Statements of Earnings, fiscal second quarter (10-Q p. 12); fiscal six months (10-Q p. 13). The Q1 2026 column is the FL workbook quarterly series (Data sheet, col. 22), which reconciles exactly to the six-month statement less the second-quarter column on every line — revenue 49,372 - 25,310 = 24,062; gross profit 33,215 - 17,259 = 15,956; net earnings 10,769 - 5,534 = 5,235; diluted EPS 4.41 - 2.27 = 2.14.
Segment results — income before tax is the Company’s stated segment profit measure
| Segment | Sales Q2 2026 ($M) | Sales Q2 2025 ($M) | YoY Δ | Income before tax Q2 2026 ($M) | Q2 2025 ($M) | YoY Δ | Margin Q2 2026 | Q2 2025 | Δ pp |
|---|---|---|---|---|---|---|---|---|---|
| Innovative Medicine | 16,384 | 15,202 | +7.8% | 6,249 | 5,552 | +12.6% | 38.1% | 36.5% | +1.6 pp |
| MedTech | 8,926 | 8,541 | +4.5% | 1,177 | 1,204 | -2.2% | 13.2% | 14.1% | -0.9 pp |
| Segment total | 25,310 | 23,743 | +6.6% | 7,426 | 6,756 | +9.9% | 29.3% | 28.5% | +0.8 pp |
| Expenses not allocated to segments ᵇ | — | — | — | (679) | (265) | +156.2% | — | — | — |
| Consolidated pre-tax | $25,310.0M | $23,743.0M | +6.6% | 6,747 | 6,491 | +3.9% | 26.7% | 27.3% | -0.6 pp |
ᵇ Unallocated amounts comprise interest (income)/expense, certain litigation expenses and general corporate items; the Q2 2026 figure includes $0.4 billion of charges for talc matters (Q2 2025: no talc charge disclosed in the equivalent footnote). This one line is why a +9.9% segment-level profit advance became a +3.9% consolidated pre-tax advance (10-Q p. 56). §
The two segment margins moved in opposite directions for identifiable reasons: Innovative Medicine’s +1.6 pp came from favourable securities fair-value changes, lower Intra-Cellular integration costs and R&D phasing, net of $0.2 billion of new supply-chain restructuring and Stelara mix; MedTech’s -0.9 pp is dominated by $0.3 billion of Orthopaedics-separation costs that did not exist in Q2 2025, plus tariffs in cost of products sold and higher R&D (10-Q pp. 56, 90). §
Source: JNJ Q2 2026 Form 10-Q — Note 9, Segments of Business (10-Q p. 56) and MD&A segment analysis (10-Q p. 90).
7.2 P&L Drivers
sources Revenue: Sales of $25,310.0M grew +6.6% YoY — +5.6% operational and +1.0% currency — while absorbing an approximate 4.6 pp drag on worldwide operational growth from the STELARA biosimilar decline; acquisitions/divestitures were a net -0.1% (10-Q p. 70). The quarter’s defining offset sits inside Immunology: STELARA fell -55.2% to $740M (a $913M loss of quarterly revenue) while TREMFYA grew +72.5% to $2,046M (a $860M gain) — the successor drug is now replacing the lost franchise almost dollar-for-dollar in-quarter (10-Q p. 46). Around that pivot, Oncology grew +17.3% to $7,406M (DARZALEX +18.9% to $4,207M, CARVYKTI +49.4% to $657M), Neuroscience grew +14.0% to $2,337M with CAPLYTA at $361M (+70.9%, acquired with Intra-Cellular on April 2, 2025 — Q2 2025 contained only its first quarter under JNJ ownership), and MedTech grew +4.5% (operational +3.6%), led by Cardiovascular +4.0% and Vision +6.0% against an Abiomed decline of -2.0% on lower U.S. procedure volumes (10-Q pp. 46, 76, 81). By geography, U.S. sales grew +7.3% and international +5.7% (operational +3.4%) (10-Q pp. 55, 70). One revenue-quality footnote deserves attention: adjustments recognised from changes in estimates of prior years’ U.S. rebate and discount liabilities ran at approximately 3.0% of U.S. Innovative Medicine revenue in Q2 2026 versus 2.6% a year ago — on segment U.S. sales of $9,979M vs $9,161M that is roughly $0.30 billion vs $0.24 billion of favourable prior-period release, a modest but growing tailwind inside reported U.S. pharma growth (10-Q p. 55).
Cost and margin: Cost of products sold of $$8,051.0M against $$7,628.0M a year ago rose +5.5%, one point slower than the +6.6% revenue growth, taking the COGS ratio to 31.8% from 32.1% and gross margin up +0.3 pp to 68.2% — operational drivers and favourable currency, net of unfavourable Stelara mix and tariffs in the MedTech business, with amortization of intangibles inside COGS easing to $1.2 billion from $1.3 billion (10-Q pp. 24, 83). The give-back was in SG&A: $6,432.0M against $5,889.0M, +9.2% — well ahead of sales — on commercial investments in both segments, worth -0.6 pp of margin (25.4% of sales vs 24.8%) (10-Q pp. 12, 84). R&D of $3,653M rose only +3.9% (14.4% of sales vs 14.8%) on Innovative Medicine expense phasing, partially offset by higher Surgery and Cardiovascular spend in MedTech (10-Q p. 84). D&A of $$1,959.0M versus $$1,943.0M was flat, so EBITDA (+5.5%) trailed EBIT (+6.9%) slightly and the EBITDA margin slipped -0.3 pp while the EBIT margin held at 28.3%. Sequentially the +1.9 pp gross-margin and EBIT-margin expansion off Q1 is favourable mix and the absence of Q1’s heavier product-mix drag — a clean operating quarter.
Below the line: Everything that separates flat net income from +6.9% EBIT growth sits in three lines. [Rating and price target withdrawn — see the note at the top.] Other (income) expense, net swung to $331M of expense from $107M — the $224M increase decomposes (in billions) into litigation +0.2 (a $0.4 billion talc charge is the quarter’s largest single item), Orthopaedics-separation costs +0.2, restructuring-related +0.2, acquisition/integration -0.2, and securities gains -0.2 (10-Q pp. 56, 88). [Rating and price target withdrawn — see the note at the top.] Net income of $5,534.0M was flat (-0.1%) as a result, and diluted EPS of $2.27 fell $0.02 (-0.9%) YoY while rising $0.13 (+6.1%) QoQ; the EPS-vs-NI gap is pure dilution — the diluted count rose +0.9% to 2,440.1M from 2,419.1M as the higher share price pulled the option overhang into the money (options excluded as anti-dilutive collapsed from 66.3M to 6.8M) (10-Q pp. 12, 43).
7.3 Balance Sheet & Cash Flow
| Metric | Q2 2026 | Q2 2025 | YoY Δ | Q1 2026 | QoQ Δ |
|---|---|---|---|---|---|
| Cash ($M) | $20,422.0M | $18,577.0M | +9.9% | $21,688.0M | -5.8% |
| Net Debt ($M) | $28,614.0M | $32,184.0M | -11.1% | $33,299.0M | -14.1% |
| Net Debt / LTM EBITDA | 0.85× ᶜ | — | — | — | — |
| Total Assets ($M) | $201,061.0M | $193,389.0M | +4.0% | $200,894.0M | +0.1% |
| Equity ($M) | $84,971.0M | $78,473.0M | +8.3% | $81,186.0M | +4.7% |
| OCF ($M) | $8,616.0M | $3,878.0M | +122.2% | $2,514.0M | +242.7% |
| CapEx ($M) ᵈ | $1,321.0M | $1,043.0M | +26.7% | $1,049.0M | +25.9% |
| FCF ($M) | $7,295.0M | $2,835.0M | +157.3% | $1,465.0M | +398.0% |
| Dividends Paid ($M) ᵈ | $3,227.0M | $3,129.0M | +3.1% | $3,131.0M | +3.1% |
YoY and QoQ percentages use the same formulas as 7.1 — net debt YoY: (28,614 - 32,184) / |32,184| × 100 = -11.1%; net debt QoQ: (28,614 - 33,299) / |33,299| × 100 = -14.1%.
ᶜ Net Debt / LTM EBITDA: LTM EBITDA = Q3 2025 $8,873.0M + Q4 2025 $7,293.0M + Q1 2026 $8,363.0M + Q2 2026 $9,133.0M = $33,662.0M (the two 2025 quarters are taken from the workbook’s standalone quarterly series, Data sheet row 20, cols 20–21, because the section-7 data pack carries only the CQ/PYSQ/PQ columns). Net Debt $28,614.0M / $33,662.0M = 0.85×. Net debt reconciles exactly to the filing: loans and notes payable $11,692M plus long-term debt $37,344M less cash and cash equivalents $20,422.0M = $28,614.0M (10-Q p. 11). The MD&A’s own “net debt position of $28.2 billion” additionally nets the $336M of current marketable securities (10-Q p. 96) — a definitional difference, not a discrepancy.
ᵈ CapEx and dividends are stored as positive magnitudes in the workbook and shown as such here; both are cash outflows. A positive Δ therefore means a larger outflow. Both tie to the filing: six-month capex of $2,370M = $1,049.0M + $1,321.0M, and six-month dividends of $6,358M = $3,131.0M + $3,227.0M at $1.30 then $1.34 per share (10-Q pp. 16, 20–21).
Source: JNJ Q2 2026 Form 10-Q — Consolidated Balance Sheets (10-Q p. 11) and Consolidated Statements of Cash Flows (10-Q pp. 20–21). Standalone-quarter cash-flow figures are derived by the pipeline from the six-month statement less the prior 10-Q’s three-month statement (OCF: 11,130 - 2,514 = 8,616).
Balance sheet note: The headline is deleveraging — net debt fell 14.1% sequentially to $28,614.0M on the quarter’s $8,616M of operating cash flow — but the composition shifted markedly toward short-term funding: loans and notes payable rose to $11,692M from $8,495M at year-end (+37.6%), including commercial paper of $9.9 billion, up from $6.5 billion at December 28, 2025, while long-term debt fell to $37,344M from $39,438M as $2,003M was repaid with no new issuance (10-Q pp. 11, 21, 41). The Company simultaneously secured a new $12.5 billion 364-day credit facility in June 2026 supporting a $20 billion commercial-paper capacity (10-Q p. 96). Working capital moved with the top line, not ahead of it: trade receivables of $19,046M are +10.9% since year-end (the six-month receivables build of $1,947M is smaller than the prior year’s $2,283M), and inventories of $15,144M are +6.7% since year-end with finished goods +7.3% to $8,405M (10-Q pp. 11, 20, 22).
Cash flow note: FCF conversion = FCF / Net Income = 7,295 / 5,534 = 131.8% in Q2 2026, against 51.2% in Q2 2025 and 28.0% in Q1 2026. The dramatic YoY improvement is real but flattered by the base: the prior-year six months carried a $6,194M increase in other assets and a $5,926M decrease in other liabilities — the cash-flow shadow of the talc-era balance-sheet unwind — versus +$1,299M and -$1,601M respectively this year, and the prior-year deferred tax provision swung from +$2,997M to -$320M (10-Q p. 20). The clean read: six-month OCF of $11,130M against six-month net earnings of $10,769M is a conversion of 103.4% — solid, ordinary, and the right basis to model, not the 122% quarterly headline.
Forensic observations (read from the filing, in order of importance):
- First-half capital returns exceeded free cash flow, and commercial paper funded the difference. Dividends of $6,358M plus share repurchases of $4,249M total $10,607M of six-month returns against six-month FCF of $8,760M ($11,130M OCF - $2,370M capex) — a $1.85 billion overrun. Over the same six months, net short-term debt proceeds were +$3,469M ($13,146M drawn, $9,677M repaid) while $2,003M of long-term debt was retired, and employee option exercises contributed an unusually large $1,531M (vs $557M) of financing inflow (10-Q pp. 20–21). [Rating and price target withdrawn — see the note at the top.]
- The talc reserve is being rebuilt in $0.4 billion quarterly instalments, and the cash demands are scheduled. After the ~$7.0 billion reversal in Q1 2025, charges for talc matters were $0.4 billion this quarter and $0.8 billion for the six months (10-Q p. 56); the reserve stands at ~$3.7 billion present value, ~40% current, against approximately 76,000 pending U.S. claimants (10-Q p. 61). Management’s own liquidity paragraph lists the funding stack explicitly: ~$3.7 billion talc, ~$0.9 billion remaining opioid settlements, and $1.7 billion of corporate bonds currently due (10-Q p. 96). Separately, a $0.8 billion Auris judgment (inclusive of interest) was paid in January 2026 (10-Q p. 65) — litigation is a recurring cash line for this company, not a contingency.
- The buyback is not a buyback. Of the $4,253M of six-month repurchases in the equity statement, only $219M occurred in Q2 (10-Q p. 16); the Part II issuer-purchases table shows just 970,250 shares bought in the quarter at an average $229.54, all under systematic plans to meet compensation-program needs, with no publicly-announced repurchase program in place (the “shares that may yet be purchased under the plans” column is nil) (10-Q p. 99). Meanwhile the option overhang grew to 92.9M potential shares from 64.6M, and the diluted count rose 0.9% YoY (10-Q p. 43). Net-net the Company is currently a share issuer through compensation, with repurchases mopping up less than the grants — the EPS decline this quarter is the visible cost.
- Restructuring is larger than the Restructuring line. Total program expense in the quarter was $276M — a new Innovative Medicine supply-chain program ($200M, mostly asset impairments, of an estimated $650–750M through 2029), Surgery ($59M) and Orthopaedics ($17M) — but only $34M appears on the face-of-P&L Restructuring line; $35M sits in cost of products sold and $207M in Other (income) expense (10-Q pp. 66–67). Anyone reading the income statement’s Restructuring line alone understates the quarter’s restructuring cost by a factor of eight.
- Intangibles are amortising down with no impairment activity: intangible assets fell to $48,229M from $50,403M at year-end and goodwill was stable at $48,479M (movement almost entirely currency, -$296M); the last annual impairment test was Q4 2025 and no interim test was triggered; scheduled amortization is ~$5.1 billion for 2026 stepping down to ~$3.5 billion by 2030 (10-Q p. 24). Six-month IPR&D impairments were $36M (10-Q p. 13) — immaterial, but a line to watch given $15,721M of indefinite-lived IPR&D on the books.
7.4 Footnote Review
sources All twelve notes to the consolidated financial statements were read in full in this session, together with the five primary statements, the whole of Item 2 (MD&A), Items 3 and 4, and Part II Items 1, 2, 5 and 6. Page references are PDF pages of the filing copy. Where a note carries both-period figures, the change assessment below is made from the amounts printed in this filing; balance-sheet notes are compared against the December 28, 2025 year-end comparatives this filing discloses.
Note 1 — Basis of presentation, accounting standards, supplier finance (10-Q p. 22) Normal recurring adjustments only. One standard adopted in fiscal 2026 — ASU 2025-07 (derivative scope exception) — with no material impact, and no new material standards pending. The supplier finance program stands at $0.7 billion of confirmed obligations (year-end: $0.8 billion), 90-day general payment terms, presented inside accounts payable. Confirmed unchanged in structure vs year-end and immaterial at 7.6% of the $9,223M accounts-payable balance (10-Q pp. 11, 22).
Note 2 — Inventories (10-Q p. 22) Total inventories $15,144M vs $14,191M at year-end (+6.7%): raw materials $2,515M (-0.6%), goods in process $4,224M (+10.3%), finished goods $8,405M (+7.3%). The build is broadly in line with 8.2% six-month sales growth and consistent with the MedTech tariff environment favouring inventory positioning; not a red flag, monitored.
Note 3 — Intangible assets and goodwill (10-Q p. 24) Treated in forensic observation 5 above. Definite-lived intangibles net $30,764M (patents/trademarks $24,815M + customer relationships $5,949M), indefinite-lived trademarks $1,744M and IPR&D $15,721M; goodwill $48,479M split Innovative Medicine $14,755M / MedTech $33,724M. Annual impairment test completed Q4 2025; movement in the half is amortization and currency only. Amortization inside COGS: $1.2 billion in the quarter (Q2 2025: $1.3 billion). No change in character; the amortization roll-down is a structural gross-margin tailwind worth ~$0.1 billion per quarter YoY.
Note 4 — Fair value measurements, derivatives, debt and cash detail (10-Q pp. 26–41) [Rating and price target withdrawn — see the note at the top.] Contingent consideration rose to $823M from $753M on $64M of additions (10-Q p. 35). Changed vs year-end in mix (CP up, LT debt down), not in character.
Note 5 — Income taxes (10-Q p. 41) [Rating and price target withdrawn — see the note at the top.] Unrecognized tax benefits stand at approximately $2.7 billion; the IRS has closed audits through 2016 and the 2017–2020 audit is ongoing; other major jurisdictions are open back to 2014. [Rating and price target withdrawn — see the note at the top.]
Note 6 — Pensions and other benefit plans (10-Q p. 42) Retirement plans swung to a net periodic credit of $19M in the quarter (Q2 2025: $16M cost) on expected asset returns of $638M outrunning service and interest cost; other benefit plans cost $155M (vs $138M). Six-month contributions were modest: $70M U.S., $10M international. Non-service components sit in Other (income) expense — part of the $0.2 billion favourable “employee benefit related” line in the MD&A bridge (10-Q p. 88). Confirmed unchanged in structure vs the year-end plan disclosures; economically a small tailwind.
Note 7 — Accumulated other comprehensive income (10-Q p. 43) AOCI improved to $(13,951)M from $(14,930)M at year-end: currency translation +$1,538M (the dollar weakened), employee benefit plans +$82M, derivatives -$641M. The $0.9 billion after-tax deferred net loss on derivatives will substantially reclassify to earnings over the next 12 months (10-Q p. 26) — a known, modest headwind to reported gross margin as hedges roll. Routine; confirmed consistent with the comprehensive-income statement (10-Q p. 14).
Note 8 — Earnings per share (10-Q p. 43) The quarter’s quiet governance datum, treated in forensic observation 3: diluted shares 2,440.1M vs 2,419.1M (+0.9%); potential option shares 92.9M vs 64.6M; anti-dilutive exclusions collapsed to 6.8M from 66.3M. Basic EPS was flat at $2.30; the entire diluted-EPS decline (-0.9%) is the option overhang coming into the money. Cover page: 2,409,898,597 shares outstanding at July 17, 2026 (10-Q p. 2).
Note 9 — Segments of business and geographic areas (10-Q pp. 44–57) Two reportable segments, unchanged; segment income before tax remains the CODM’s stated measure, and the full product-level sales table is disclosed (treated in 7.1–7.2). Beyond the headline: identifiable assets are Innovative Medicine $78,856M, MedTech $86,581M, general corporate $35,624M; six-month segment capex shows Innovative Medicine surging to $1,161M from $687M (+69.0% — capacity investment consistent with the new supply-chain restructuring) while MedTech was flat at $1,102M (10-Q p. 57). The note also carries the prior-year rebate-estimate disclosure (~3.0% vs ~2.6% of U.S. IM revenue, 7.2 above) and restates the Orthopaedics separation intent (announced October 2025, targeted completion within 18–24 months) (10-Q p. 55). Geographic mix: U.S. 57.4% of sales, +7.3% YoY (10-Q p. 57).
Note 10 — Acquisitions, divestitures and other arrangements (10-Q pp. 57–59) Three live items. (i) Firefly Bio: definitive agreement announced June 8, 2026 — $1 billion cash for a degrader-antibody-conjugate platform, closing expected fiscal Q3 2026, to join Innovative Medicine. (ii) 2025 transactions: Halda Therapeutics ($3.05 billion, December 2025 — $2.8 billion of the price sits in acquired IPR&D, i.e., pre-revenue) and Intra-Cellular ($14.5 billion, April 2025 — $8.3 billion IPR&D, $5.2 billion amortizable CAPLYTA asset, $2.9 billion goodwill); no material measurement-period adjustments in the half for either. (iii) Royalty Pharma co-funding (new, Q1 2026): up to $0.5 billion of external funding for JNJ-4804 in 2026–27, recognised as a reduction of R&D expense as services are performed (not material in the half), against approval milestones up to ~$0.5 billion plus low-single-digit royalties payable if the asset succeeds. Analytical significance: reported R&D will be structurally understated relative to gross spend on this asset, and $18.5 billion of 2025–26 M&A consideration is substantially IPR&D — future impairment risk sits there, not in goodwill.
Note 11 — Legal proceedings (10-Q pp. 61–66) — see the consolidated contingencies entry below for the full docket The talc architecture after the third bankruptcy dismissal: all talc liabilities sit in Red River Talc LLC and Pecos River Talc LLC, litigation is back in the tort system, ~$7.0 billion of reserve was reversed in Q1 2025, and the present-value reserve is now ~$3.7 billion (≈40% current), covering executed settlements, defense and other costs — not the unresolved claim body of ~76,000 plaintiffs, for which no estimate of possible loss beyond amounts accrued is given. The quarter’s genuinely new information is procedural and favourable: in the ovarian MDL, plaintiffs withdrew two specific-causation experts after the May 2026 evidentiary hearings, the Company filed a Motion to Show Cause why the MDL should not be dismissed, and in July 2026 the court granted the motion, with a case-management conference scheduled for August 2026; the Special Master’s July 2026 asbestos-testing report also granted the Company’s motion in part (10-Q pp. 61–62). Against that, the securities class action is now trial-bound — the Supreme Court denied certiorari on class certification in April 2026 (10-Q p. 62). This footnote remains the single largest interpretive risk to the equity value; the difference this quarter is that the dispersion of outcomes widened in both directions — a plausible dismissal path and a still-uncapped tail.
Note 12 — Restructuring (10-Q pp. 66–67) Treated in forensic observation 4. Three programs running: the new Innovative Medicine supply-chain program (initiated this quarter, $200M recorded, $650–750M estimated through 2029), Surgery ($59M in the quarter; ~$0.3 billion recorded of an estimated $0.6–0.7 billion, substantially complete end-2026) and Orthopaedics ($17M; ~$0.8 billion recorded of ~$1.0 billion, complete Q4 2026 — clearing the deck for the separation). Restructuring reserves at both dates were insignificant, i.e., the charges are largely non-cash impairments or paid as incurred.
Related-party transactions (10-Q pp. 22, 34, 57–59, 88) Johnson & Johnson has no controlling shareholder, and this 10-Q contains no related-party transactions note — no related-party caption appears in the notes (10-Q pp. 22–67), consistent with a widely-held S&P-10 issuer. This is documented rather than assumed. The filing’s nearest related-interest disclosures, each quantified: (i) JJDC (Johnson & Johnson Innovation — JJDC, Inc., the wholly-owned venture arm) — gains and losses on its equity investments run through Other (income) expense, net, where the definition names JJDC explicitly (10-Q p. 88); the equity-investment book was $1,635M at quarter end ($803M with readily determinable value, $832M without), with +$190M and +$40M of fair-value changes reflected in net income for the six months (10-Q p. 34), i.e., securities gains of ~$0.2 billion supported this quarter’s Other line. (ii) Supplier finance program — $0.7 billion of confirmed obligations to enrolled suppliers via third-party banks; the Company is not party to the supplier-bank arrangements and terms are unchanged (10-Q p. 22). (iii) Royalty Pharma co-funding — an arm’s-length risk-transfer contract, disclosed with its full economics (Note 10). No transaction terms changed in the quarter; there are no affiliate purchases, sales, loans or management fees to report, in Q2 2026 or Q2 2025.
Contingencies and litigation (10-Q pp. 61–66) Every named open matter, with quarter status: (1) Talc product liability — ~76,000 U.S. plaintiffs; reserve ~$3.7 billion PV (~40% current); Q2 charge $0.4 billion, 1H $0.8 billion; MDL Motion to Show Cause granted July 2026 (above). Amount at stake beyond accrual: not estimable. (2) Talc securities class action (D.N.J., 2018) — class certified, certiorari denied April 2026, expert discovery proceeding; no accrual disclosed. (3) Imerys/Cyprus settlement — approved October 2024; insurers’ appeal fully briefed at the Third Circuit, ruling pending. (4) PREZISTA/INTELENCE qui tam — 2024 jury found partial liability on off-label claims; judgment entered on the federal claims March 2025; Third Circuit ordered mediation April 2026; no amount disclosed. (5) REMICADE/SIMPONI ARIA qui tam (D. Mass.) — summary-judgment argument heard May 2026, trial scheduled November 2026. (6) DePuy Synthes False Claims Act complaint (S.D. Fla.) — new in June 2026, DOJ declined to intervene; Company defending. (7) ZYTIGA pricing qui tam — Daubert proceedings ongoing; governments declined to intervene. (8) Innovative Health v. Biosense Webster antitrust — plaintiff jury verdict May 2025 and a permanent injunction on business practices August 2025; appeal fully briefed June 2026; no damages figure disclosed in this filing. (9) STELARA biosimilar-delay antitrust class action — class certified December 2025; partial summary judgment for Janssen January 2026 (Momenta-patent claim); plaintiffs appealed to the Fourth Circuit March 2026. (10) Xoma v. Janssen (TREMFYA license) — motion to dismiss denied December 2025; a contract claim now attached to the Company’s most important growth asset. (11) Anti-Terrorism Act case (D.D.C.) — dismissal reversed; rehearing denied April 2026, so the case proceeds. (12) ERISA prescription-drug-benefits class action — judgment entered for the Company January 2026; plaintiffs appealed. (13) Auris/Fortis — closed: $0.8 billion judgment paid January 2026. (14) Patent docket — INVEGA SUSTENNA U.S. cases now fully settled or dismissed (May–June 2026) and the Canadian Supreme Court dismissed Pharmascience’s appeal in July 2026 (favourable); SPRAVATO post-trial decision pending; ERLEADA Canada trial August 2026; CAPLYTA trial vs Zydus March 2027; SIMPONI biosimilar litigation is new and active — a preliminary-injunction hearing against Accord is set for September 2026 and a second suit against Alvotech was filed June 2026; CARVYKTI UPC hearing March 2027; DARZALEX Russia unfair-competition action pending. The Company’s blanket position is unchanged: probable-and-estimable amounts are accrued; beyond that, no possible-loss range is given (10-Q p. 61).
Subsequent events (disclosed within the body of the filing — there is no dedicated subsequent-events note) The notes run 1 through 12 with no subsequent-events caption; post-quarter facts disclosed elsewhere in the filing: (i) July 15, 2026 — the Board declared the regular $1.34 quarterly dividend, payable September 8, 2026 (10-Q p. 96); (ii) July 2026 — the ovarian MDL court granted the Company’s Motion to Show Cause, and the Special Master issued the asbestos-testing report granting the Company’s motion in part (10-Q p. 62); (iii) July 2026 — the Supreme Court of Canada dismissed Pharmascience’s INVEGA SUSTENNA appeal (10-Q p. 63); (iv) the cover page reports 2,409,898,597 shares outstanding at July 17, 2026 (10-Q p. 2); (v) the report was signed July 23, 2026 by J. J. Wolk (CFO) and R. J. Decker Jr. (Controller) (10-Q p. 101). The Firefly Bio closing remained pending at the filing date, expected fiscal Q3 2026 (10-Q p. 57).
Guidance status (10-Q, Item 2 — none given) Consistent with 10-Q practice, the filing contains no revenue or EPS guidance; the forward-looking content is directional and almost all of it points down for specific franchises: STELARA biosimilars “will continue to negatively impact” sales; SIMPONI biosimilars entered the European market in the second quarter of 2026, with a potential U.S. entrant later in 2026 — “this will likely result in a reduction in future sales”; generic competition for OPSUMIT entered the U.S. market late in the second quarter of 2026, likewise (10-Q p. 78). The Orthopaedics separation remains targeted within 18–24 months of the October 2025 announcement (10-Q pp. 55, 82). Item 4 concludes disclosure controls were effective with no material ICFR changes, noting a multi-year finance-systems standardization initiative not related to any identified deficiency (10-Q p. 98). Operations in Venezuela, Argentina, Turkey and Egypt are accounted for as highly inflationary (10-Q p. 96).
7.5 What Changed This Quarter
sources - The Stelara cliff is now fully absorbed in-quarter by its own successor. STELARA fell -55.2% to $740M (-$913M YoY) while TREMFYA grew +72.5% to $2,046M (+$860M) — a net -$53M — and total Innovative Medicine still grew +7.8% with segment margin up 1.6 pp to 38.1% (10-Q pp. 46, 56). This is the strongest evidence yet for the “fortress” half of the thesis: the worst patent cliff in the company’s recent history is passing through the P&L without breaking growth or margin. - But the next erosion wave started inside this same quarter. SIMPONI biosimilars entered Europe in Q2 2026 (a $618M-per-quarter franchise, already -10.5%), a U.S. entrant is possible later in 2026, and OPSUMIT generics entered the U.S. late in the quarter ($602M per quarter, +3.4%) (10-Q pp. 46, 48, 78). [Rating and price target withdrawn — see the note at the top.] - Talc turned two-sided. New and favourable: plaintiffs withdrew two specific-causation experts, and in July 2026 the MDL court granted the Company’s Motion to Show Cause why the ovarian MDL should not be dismissed (conference August 2026) — the first genuine dismissal path since the bankruptcy strategy failed (10-Q p. 62). Unchanged and unfavourable: ~76,000 claimants, a ~$3.7 billion reserve that covers only executed settlements and defense costs, $0.4 billion of fresh charges this quarter, and no estimable range for the remainder (10-Q pp. 56, 61). The outcome distribution widened in both directions; the tail is still uncapped. [Rating and price target withdrawn — see the note at the top.] - A new $650–750M supply-chain restructuring opened in Innovative Medicine ($200M charged this quarter, mostly asset impairments, running to 2029), while Innovative Medicine capex surged +69.0% to $1,161M in the half — the segment is simultaneously writing down old capacity and building new (10-Q pp. 57, 66). [Rating and price target withdrawn — see the note at the top.] Leverage remains a non-issue at 0.85× LTM EBITDA — but the direction of travel is new. - Dilution is now visible in the print. Diluted shares +0.9% YoY turned flat net income into a -0.9% EPS decline; the option overhang is 92.9M shares, anti-dilutive exclusions collapsed from 66.3M to 6.8M, and there is no open-market repurchase program to absorb it (10-Q pp. 43, 99). - Litigation cash outflows are recurring, not contingent: $0.8 billion Auris judgment paid in January 2026; ~$0.9 billion of opioid settlement payments still ahead; ~$1.5 billion of the talc reserve is current (10-Q pp. 61, 65, 96).
7.6 Portfolio Decision
sources [Rating and price target withdrawn — see the note at the top.] [Rating and price target withdrawn — see the note at the top.] Operationally it was close to flawless: revenue +6.6% to $25,310.0M through a 4.6 pp Stelara drag, EBIT +6.9% to $7,174.0M at a held 28.3% margin, TREMFYA replacing STELARA dollar-for-dollar, net debt down to $28,614.0M at 0.85× LTM EBITDA, and 131.8% quarterly FCF conversion. That is the fortress, and the market pays 43% above our composite fair value for it. [Rating and price target withdrawn — see the note at the top.] The footnote review sharpens rather than softens the call: the talc docket now contains a genuine dismissal path (the July 2026 Motion to Show Cause) and a still-uncapped ~76,000-claimant tail behind a $3.7 billion reserve — wider dispersion, in both directions, at a price that already assumes the good tail. A quarter that strengthens the evidence for the franchise without narrowing the risk or closing a -30.2% implied return is a quarter to keep reducing into strength, not to upgrade.
What would change this view: [Rating and price target withdrawn — see the note at the top.] Continued delivery of the Q2 pattern (Innovative Medicine operational growth ≥5% through the combined STELARA/SIMPONI/OPSUMIT erosion, IM margin ≥38%) with EPS growth restored (diluted share count flat or falling) would also justify revisiting the composite fair value inputs. [Rating and price target withdrawn — see the note at the top.]
Report Versions
Every published version of this report, newest first — each one kept so a reader can see what changed and when.
| Version date | Files |
|---|---|
| 2026-08-19 Current | Model (Excel) |
| 2026-08-04 | Model (Excel) |