
Alphabet Inc.
Section 1 — Business Overview, Operations & Competitive Positioning
1.1 The Business
sources Alphabet (GOOG) is, at its economic core, a global advertising toll booth: it operates the world’s most-used search engine and largest video platform, aggregates the resulting user attention at planetary scale, and auctions advertising against it — converting queries and watch-time into high-margin, recurring cash flow. That advertising engine now funds a deliberate second act: a full-stack push into artificial intelligence spanning custom silicon, frontier models, and a fast-growing enterprise cloud.
The great majority of revenue is still monetized attention. Google Search and other properties, YouTube, and the third-party Google Network sell performance advertising (measurable, direct-response formats) and brand advertising (awareness-building video and display), with management noting that AI has underpinned its ad products — Performance Max, Demand Gen, Product Studio — for more than a decade. Around this advertising spine sit three growing, structurally lower-margin revenue streams: Google Cloud (consumption and subscription fees for infrastructure, platform, and productivity software); consumer subscriptions (YouTube TV, YouTube Music and Premium, NFL Sunday Ticket, and Google One, which now bundles access to the company’s most capable Gemini models); and platforms and devices (Google Play, and the Pixel hardware family). Alphabet Inc. generated revenue of $402,836.0M in FY2025, the culmination of a decade of near-uninterrupted expansion from $74,989.0M in FY2015 — a compounding record driven first by the migration of advertising budgets online and, more recently, by the diversification into cloud and subscriptions. The workforce is a global, highly technical talent base that management treats as its central competitive input, supported by an extended network of supplier employees, temporary staff, and contractors; competition for engineers, and specifically for AI talent, is intense enough that management identifies it as a standalone risk. The company’s Class A and Class C shares trade on the Nasdaq Global Select Market; GOOG is the non-voting Class C line, and the sector is Communication Services / Internet.
Key Information
| Item | Value |
|---|---|
| Ticker | GOOG |
| Sector / Industry | Communication Services / Internet |
| Report Date | 2026-08-19 |
| Most Recent FY Revenue | $402,836.0M |
| EBIT Margin (Most Recent FY) | 32.0% |
| Diluted Shares Outstanding | 12,230M |
| Current Price | $341.28 |
Source: Company SEC filings (10-K); see Appendix A.1.
1.2 Operating Segments
sources Alphabet reports three segments — two of them “Google,” plus everything else. This structure is itself analytically important: it separates a cash-generative, wide-moat franchise from the businesses consuming that cash.
Google Services is the engine and the source of essentially all of Alphabet’s profit. It earns revenue primarily from advertising across Google Search and other properties, YouTube, and Google Network partner sites, supplemented by consumer subscriptions, Google Play, and Pixel devices. The single variable that drives it is monetized query and watch-time volume — the product of user reach (a family of products with half-a-billion-plus users each, several exceeding two billion) and the ad price those queries and views clear at auction. Management attributes Search growth to more queries, more advertiser spend, and continual improvement in ad formats and delivery; the one soft spot is Google Network, where declining AdSense revenue makes it the segment’s laggard.
Google Cloud is the growth engine. It sells consumption-based and subscription access to infrastructure and platform services (Google Cloud Platform), the Workspace productivity suite, and an expanding AI stack — Vertex AI as a managed developer platform offering the Gemini family alongside third-party and open models, plus AI-optimized compute, cybersecurity, and agentic products such as Gemini Enterprise. Its driving variable is enterprise workload consumption, increasingly weighted toward AI training and inference. As the industry’s #3 hyperscaler behind AWS and Microsoft Azure, Cloud is where Alphabet’s massive infrastructure investment is meant to convert into a durable, contracted revenue stream — its economics are real but structurally lower-margin than advertising, a point management flags directly.
Other Bets is the option portfolio. It houses non-Google businesses at every stage from research (the X “moonshot factory”) to commercialization (Waymo, Alphabet’s autonomous-driving unit, now scaling to more US cities and entering international markets). Revenue is small and comes chiefly from autonomous transportation and internet services; the segment runs a persistent operating loss and management is explicit that these early-stage ventures carry considerable uncertainty. Some operate as independent companies with their own boards and outside investors — a structure designed to preserve venture-style upside while ring-fencing the losses.
The segments fit together as a single AI flywheel with one clear dependency. The advertising franchise funds the capital spend; that capital builds AI-optimized infrastructure — custom Tensor Processing Units (the “Ironwood” generation) alongside GPUs — which in turn powers Search and YouTube and is resold through Google Cloud; and the Gemini model family, developed on that infrastructure, is embedded across the entire product estate, from AI Overviews and AI Mode in Search to Gemini for Workspace in Cloud. The synergy is genuine: the same silicon and models serve both the consumer franchise and the enterprise business. The fragility is equally clear — the whole edifice rests on the continued profitability of advertising, and management itself cautions that it may monetize AI-enhanced Search differently from the legacy ten-blue-links model, so the very technology that widens the moat could reshape the cash flows that fund it. (Segment-level revenue and operating-income figures are developed in Section 3; this section’s data pack does not carry the segment splits.)
1.3 Geographic Exposure
sources [Rating and price target withdrawn — see the note at the top.] That translation risk is structural rather than episodic. The more consequential geographic reality is regulatory concentration rather than revenue concentration — the European Union is the source of the densest and most active antitrust and digital-markets pressure (the Digital Markets Act, ad-tech and legacy competition matters), while the United States hosts the most consequential antitrust litigation. The company also flags exposure to sanctions, tariffs, export controls, and geopolitical conflict across its international footprint. These geography-specific risks are material to the thesis but are quantified and assessed in Section 2.
1.4 Management Team
sources The leadership structure has two layers that a portfolio manager must read together: operational management and founder control. Sundar Pichai, Chief Executive Officer of both Alphabet and Google, is the operational anchor and is named in the filing as key personnel critical to overall management and strategic direction — a concentration the company itself flags as a risk, since it maintains no key-person insurance and its executives are at-will. Ruth Porat, President and Chief Investment Officer, and Chair John Hennessy round out the senior figures visible in the filing.
Above operational management sits the founders. Larry Page and Sergey Brin, through Class B shares carrying ten votes each, retain a majority of total voting power despite holding a minority of the economic equity. This is the defining governance fact of the company: strategic control — including the AI capital-spending commitments and the Other Bets loss tolerance — rests with two individuals whose voting power is structurally insulated because new stock is issued in non-voting Class C shares. The benefit is long-horizon decision-making free of activist pressure; the cost is that public shareholders have essentially no mechanism to influence direction if capital allocation disappoints. This is a feature to underwrite, not a defect to fix, but it materially shapes minority shareholders’ rights and is treated further in Section 2.
1.5 Capital Allocation Track Record
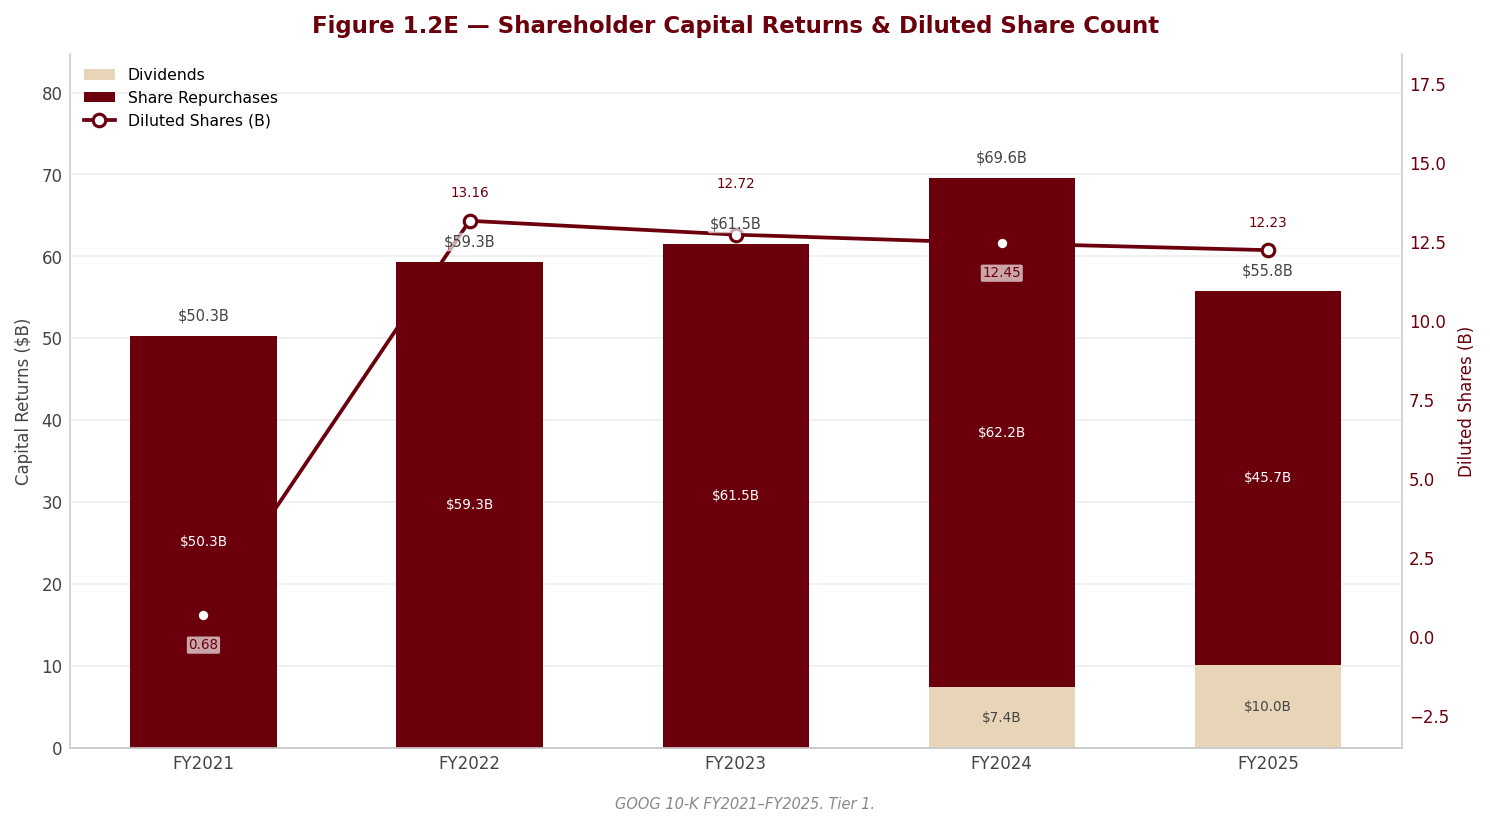
| Year | Dividends Paid ($M) | Share Repurchases ($M) | CapEx ($M) |
|---|---|---|---|
| FY2021 | — | $50,274.0M | $24,640.0M |
| FY2022 | $0.0M | $59,296.0M | $31,485.0M |
| FY2023 | $0.0M | $61,504.0M | $32,251.0M |
| FY2024 | $7,363.0M | $62,222.0M | $52,535.0M |
| FY2025 | $10,049.0M | $45,709.0M | $91,447.0M |
Source: Company FY2025 Form 10-K, Consolidated Statements of Cash Flows; Excel Data sheet.
Alphabet’s capital allocation has undergone a decisive regime change, and the direction of the CapEx column tells most of the story. For most of the past decade the company was a self-funding cash machine that returned enormous sums to shareholders through open-ended, no-expiration buybacks of Class A and Class C stock, and it added a quarterly cash dividend — since raised by the Board — to all three share classes. That return program remains intact. What has changed is the scale of reinvestment: the capital-expenditure line has stepped up sharply as management builds AI-optimized technical infrastructure — servers, networking, and data centers — and it has stated plainly that it expects to increase that spend significantly again. This is a company that, having spent years harvesting a mature advertising franchise, is now redeploying capital aggressively back into the business.
The signal is confidence, but it comes with two honest caveats a portfolio manager should carry forward. First, the reinvestment is now large enough that it compresses free cash flow, and the pressure will build as the spend rises further — capital that was formerly available for buybacks is being absorbed by the build-out. Second, and more subtly, a growing share of the infrastructure is being financed off the balance sheet: through purchase commitments, data-center leases not yet commenced, and — new this year — credit-derivative backstops and financial guarantees under which Alphabet supports the very third-party data-center and energy counterparties it contracts with (forensic flag F003). That is a meaningful shift in the quality and visibility of the capital commitment, and it means the CapEx table understates the true forward call on Alphabet’s capital. Depreciation will also accelerate materially as this asset base enters service, becoming a forward margin headwind. The mix, in short, has tilted hard from “return to shareholders” toward “invest in the business” — a bet on the AI platform shift that is defensible given the franchise’s cash generation, but one whose returns are as yet unproven and whose commitments increasingly sit outside the reported balance sheet. These capital-intensity and off-balance-sheet dynamics are quantified in Section 3.
1.6 Competitive Positioning & Moat
sources §1.6.1 Industry structure. Digital advertising and cloud computing are both winner-take-most industries governed by scale economics and network effects. In search advertising, returns accrue to the platform with the most users (which attracts the most advertisers, which funds the most product investment, which attracts more users) — a self-reinforcing loop that concentrates industry profit in one or two players. In cloud, scale drives unit-cost advantages in compute, and the leaders’ ability to fund custom silicon and frontier models is becoming the decisive competitive variable. Management characterizes its environment as marked by rapid change and formidable competition on every front — general and vertical search, ad networks, cloud providers, AI model developers, hardware platforms, and social and video networks — but the structure of these markets rewards the entrenched at-scale incumbent, and Alphabet is that incumbent in search.
§1.6.2 Competitive advantages. Alphabet’s moat rests on four reinforcing sources. (1) Scale and network effects in Search — a family of products each reaching hundreds of millions to billions of users creates an advertising liquidity and data advantage that no challenger can easily replicate. (2) A full-stack AI cost advantage — management positions its AI-optimized infrastructure, including custom TPUs (Ironwood) developed in-house, as a differentiator that lowers the cost of serving AI across both its own products and Google Cloud, an advantage few competitors possess end-to-end. (3) Brand and default distribution — the strength of the Google, YouTube, Android, and Chrome brands, and the ubiquity of those platforms, underpins user reach; tellingly, the filing flags the risk that “Google” could become generic and synonymous with “search,” an inverted testament to brand dominance. (4) Ecosystem breadth — Android, Chrome, Play, Workspace, and the device family create switching costs and multiple monetization surfaces, now unified by Gemini embedded across the estate. Each of these is supported by specific management disclosure rather than asserted bare.
§1.6.3 Competitive vulnerabilities. The moat is wide but not immune. The most acute threat is regulatory: the same scale that creates the advantage has drawn structural-remedy antitrust actions in the United States and Europe that could, in an adverse outcome, force open Search distribution and ad-tech operations — this is the auditor’s sole Critical Audit Matter and is developed in Section 2 (forensic flag F002). The second is the AI transition itself: generative AI is reshaping how users seek information, and well-funded rivals — both incumbents and model-developer challengers — are competing directly; management concedes it may monetize AI-enhanced search differently, which could pressure the very economics that fund the company. Third, the shift toward lower-margin cloud, devices, and subscriptions structurally dilutes consolidated margins over time. Fourth, the AI build-out is exposed to real physical constraints — power, water, land, and a limited supply of specialized AI chips — and to the earnings volatility of a large, reversible portfolio of non-marketable investment gains (forensic flag F001). Concentration risk on any single customer is not a vulnerability: no customer exceeds a material share of revenue.
§1.6.4 Verdict. Alphabet possesses one of the widest and most durable moats in the public equity universe — a scale-and-network-effect advertising franchise, now fused to a full-stack AI infrastructure edge — and the evidence supports long-run margin durability at the operating level. But the durability verdict carries two live asterisks that distinguish this franchise from an unqualified compounder: a genuine, unquantifiable structural-remedy risk from antitrust enforcement, and a self-imposed capital-intensity regime whose returns are unproven and whose depreciation and off-balance-sheet commitments will pressure margins and free cash flow. [Rating and price target withdrawn — see the note at the top.]
Section 2 — Key Risks & Catalysts
2.1 Downside Risks
sources Alphabet is not a balance-sheet-risk or a demand-risk story — it generates $164,713.0M of operating cash flow and holds $30,708.0M of cash and equivalents (with a far larger marketable-securities portfolio besides). The dominant risks are, in order, regulatory (a live, largely un-reserved structural-remedy overhang that the company’s own auditor singled out as its sole Critical Audit Matter), capital-allocation (a step-change into an AI capex regime funded increasingly with debt and off-balance-sheet backstops), and earnings-quality (headline profit and EPS materially flattered by reversible, non-cash marks on private equity holdings). Layered on top are two secular business risks — the disruption of the search-advertising franchise by AI-native discovery, and the cyclicality of advertising demand. The through-line is that Alphabet’s greatest sources of value (its Search/ad-tech dominance and its AI infrastructure lead) are simultaneously its greatest sources of risk.
Risk 1 — Antitrust and regulatory remedies: an unquantified, largely un-reserved structural threat to the core franchise (RED FLAG)
sources This is the single most consequential risk in the file, and it is a RED forensic flag. Ernst & Young identified “Loss Contingencies” as the sole Critical Audit Matter in its FY2025 opinion — the auditor’s formal statement that the estimation of legal and regulatory losses is the hardest, most judgment-laden area of the financial statements. The exposure has moved from theoretical to partly realized. In the U.S. Search case, the D.C. District Court entered a final judgment in December 2025 imposing distribution restrictions and requiring Google to share certain search data with, and offer syndication to, competitors; Google appealed in January 2026 and the government cross-appealed in February 2026 — so the remedy is defined but not final. More dangerous is the DOJ ad-tech case: after an April 2025 finding that Google’s publisher tools unfairly excluded rivals, a remedies proceeding concluded with closing arguments in November 2025, and the government is seeking structural remedies — i.e., a forced break-up or divestiture of the ad-tech stack — which management concedes “could have a material adverse effect” and for which it “cannot estimate a possible loss.” Because the loss is not estimable, it is unaccrued: any adverse structural or damages ruling would be an un-reserved hit. Alongside these sit the already-charged items — a large EU ad-tech “self-preferencing” fine (satisfied with bank guarantees rather than cash, and on appeal), a finalized privacy settlement, EU Digital Markets Act non-compliance findings on Search and Play, and the Epic/Play injunction — which pushed accrued fines and settlements sharply higher and inflated FY2025 G&A. The correct reading is that recurring fines are now a running cost of doing business under continuous multi-jurisdiction antitrust pressure, while the structural-remedy cases are a discrete, un-modellable tail that could force open the Search and ad-tech moats.
Probability: High (recurring fines) / Low-to-Medium (a forced structural break-up) | Timeframe: 1–3 years (appeals and the pending ad-tech remedy) | Quantified potential impact: The visible, accrued portion already depresses reported operating margin through G&A; the consequential portion — structural divestiture of ad-tech or forced data-sharing that erodes Search’s competitive advantage — is not quantifiable because management states no loss can be estimated and nothing is reserved.
Risk 2 — Capital-intensity regime change and off-balance-sheet backstops (RED FLAG)
sources Alphabet has shifted into a materially more capital-hungry, obligation-heavy regime to fund its AI build-out — a RED forensic flag. Capital expenditure jumped from $52,535.0M to $91,447.0M (now running at 22.7% of revenue), and management has guided that 2026 investment will “significantly increase” again. The concern is not the on-balance-sheet spend alone — which the cash flows can absorb — but the growing web of commitments and contingencies stacked around it: a large book of purchase commitments (the majority short-term), tens of billions of data-center leases that have not yet commenced, and, most notably, a new notional book of credit derivatives — from zero a year ago — that backstop third-party data-center leases against counterparty default over agreement periods of up to fifteen years, plus financial guarantees supporting counterparties’ procurement of power-project equipment. In substance, Alphabet is increasingly financing and credit-guaranteeing the very third-party infrastructure and energy counterparties it also contracts with. Note 1’s disclosure of investments made “at or near the same time” as commercial arrangements with the same counterparties signals ecosystem-funding circularity that lowers the quality of some infrastructure and Cloud demand. Three consequences follow: free cash flow is being compressed by the capex surge and will compress further in 2026; the off-balance-sheet backstops crystallize into real liabilities precisely in a downturn — the same macro that would soften Cloud demand and strain infrastructure counterparties; and, because there was no depreciation useful-life change this year (servers remain at a six-year life), the wave of assets not yet in service will drive an accelerating, un-cushioned depreciation charge against margins as it enters service.
Probability: High (FCF compression and depreciation drag are near-certain) / Low (backstop crystallization) | Timeframe: Immediate and ongoing | Quantified potential impact: FCF was $73,266.0M in FY2025 and is set to compress further as capex rises again in 2026; the backstop and guarantee obligations are contingent and would only convert to cash outflows under counterparty default.
Risk 3 — Earnings quality: reported profit and EPS flattered by reversible, non-cash investment marks (RED FLAG)
sources Reported FY2025 earnings materially overstate Alphabet’s core, repeatable earning power — a RED forensic flag with direct valuation consequences. Other income (expense), net was dominated by large gains on equity securities, the bulk of which were unrealized mark-ups on privately held companies carried under the measurement alternative and re-marked to fair value off observable transactions for similar securities (Level 2/3 inputs involving significant judgment). These gains are non-operating, overwhelmingly non-cash, and inherently reversible — the same portfolio produced net losses as recently as 2023. They account for a meaningful slice of pre-tax income of $158,826.0M and, tax-effected, for a large share of the headline diluted-EPS increase — so much of the 34.5% EPS growth reflects portfolio revaluation rather than operating improvement. A subsequent-event disclosure that a further mark of comparable magnitude to the entire full-year 2025 equity gain was recognized in a single month of January 2026 — explicitly “subject to change” — underscores how lumpy and one-directional these AI-cycle marks have become. [Rating and price target withdrawn — see the note at the top.] In a private-market repricing, OI&E becomes a source of downside earnings volatility, not upside.
Probability: Medium-to-High (some reversal or mark-down of an AI-cycle private book is likely over a cycle) | Timeframe: 1–2 years | Quantified potential impact: A downward remeasurement would reverse through OI&E and could swing reported EPS materially without any change in the operating business; the effect is not separately modellable because the marks depend on unobservable, judgment-based inputs.
Risk 4 — AI-native disruption of the Search-advertising franchise
sources Search advertising remains Alphabet’s profit engine, and the same AI wave the company is riding also threatens the query-and-ten-blue-links economics that underpin it. Management is re-architecting Search around AI Overviews and AI Mode, and cautions in its own MD&A that it “may monetize these differently” from historical formats — a candid admission that the revenue-per-query and margin profile of AI-answered search is unproven and could be lower. The competitive risk is that users shift discovery to conversational AI assistants (whether Alphabet’s own Gemini app or third-party frontier models), compressing the volume of monetizable commercial queries or the number of ad slots per session. Because Search & other advertising is disproportionately high-margin, even a modest structural shift in monetization or query mix would hit consolidated operating margin harder than its revenue share implies. This risk compounds Risk 1: if antitrust remedies simultaneously loosen Google’s grip on default search distribution, the franchise faces disruption from both the demand side (AI substitution) and the distribution side (remedies) at once.
Probability: Medium | Timeframe: 1–3 years (transition) to 3–5 years (full monetization clarity) | Quantified potential impact: Not precisely quantifiable; the sensitivity is to Search monetization per query and to the mix shift toward lower-margin AI-answered and non-advertising revenue, which management flags as a downward pressure on operating margin.
Risk 5 — Advertising cyclicality and macro sensitivity
sources A large majority of Alphabet’s revenue is advertising, and advertiser spending correlates with the broader economy; management explicitly warns that many advertisers, publishers, and partners can terminate at any time and that spending tracks economic conditions. Revenue grew 15.1% in FY2025, but that growth rests on a demand base that is discretionary and pro-cyclical. A downturn would hit advertising and, given the company’s relatively fixed cost base and rising infrastructure operating costs, would deleverage margins quickly. The macro exposure is amplified this cycle because a demand slowdown would arrive at the same moment the capex and depreciation ramp is peaking (Risk 2) and could pressure the infrastructure counterparties Alphabet has backstopped — a correlated stress rather than an isolated one. International trade volatility, FX translation (Alphabet reports in dollars while transacting in many currencies), and geopolitical disruption add further, if secondary, cyclical exposure.
Probability: Medium (a cyclical ad slowdown at some point is likely) | Timeframe: Event-driven; any recession window | Quantified potential impact: A cyclical ad-revenue slowdown would deleverage the largely fixed cost base and rising infrastructure costs, compressing operating margin; magnitude depends on the depth and duration of any downturn.
2.2 Upside Catalysts
sources The catalyst set is genuine and, unlike the risks, is weighted toward compounding operational improvements rather than binary events — which is the more durable kind of upside. [Rating and price target withdrawn — see the note at the top.]
Catalyst 1 — Google Cloud scale and margin inflection
sources Cloud is the clearest value-creation catalyst. It is the fastest-growing segment, it has already inflected from loss-making to profitable, and it sits on a large, Cloud-heavy revenue backlog that gives multi-year visibility into the durability of that growth. As consumption of AI-optimized infrastructure (custom TPUs and Vertex AI) scales across a fixed data-center base, incremental Cloud revenue should carry improving incremental margins, lifting both segment operating income and — over time — consolidated margin mix. The pending all-cash Wiz acquisition (cloud security) and the Intersect acquisition (data-center/energy) would deepen the platform if they close. The catalyst materializes as sustained rapid, market-leading Cloud growth converting into expanding segment operating margin.
Probability: High | Timeframe: 1–3 years | Monitoring trigger: Sequential Cloud operating-margin expansion, backlog conversion into recognized revenue, and closing of the Wiz and Intersect deals.
Catalyst 2 — Gemini and AI monetization across Search and the ecosystem
sources Alphabet’s full-stack AI position — proprietary TPUs, frontier Gemini models embedded across products reaching billions of users, and a fast-growing Cloud channel — is the mirror image of Risk 4: the same transition that threatens legacy Search is also the largest monetization opportunity in the company’s history. If AI Overviews, AI Mode, and the Gemini app expand commercial query volume, deepen engagement, and open new ad and subscription formats (including paid Gemini tiers within Google One), Alphabet could monetize AI-native discovery at or above legacy Search economics rather than below. [Rating and price target withdrawn — see the note at the top.]
Probability: Medium | Timeframe: 1–3 years | Monitoring trigger: Disclosed Search revenue-per-query or query-growth commentary holding or improving as AI features scale; growth in paid Gemini/One subscriptions; enterprise Gemini adoption in Cloud.
Catalyst 3 — Capital returns: buybacks that more than offset dilution, plus a growing dividend
sources Alphabet returns capital at scale and in a shareholder-accretive way. In FY2025 it repurchased $45,709.0M of stock — more than offsetting the $24,953.0M of stock-based compensation, so the share count is falling rather than diluting — and it paid $10,049.0M in dividends after raising the quarterly payout during the year, under open-market programs with no expiration. With $30,708.0M of liquidity and strong cash generation even amid the capex ramp, the capacity for continued buybacks and dividend growth is a steady, mechanical support to per-share value. The buyback also disproportionately benefits public Class C holders, whose economic stake compounds as the count shrinks.
Probability: High | Timeframe: Immediate and ongoing | Monitoring trigger: Declining diluted share count, further dividend increases, and buyback pace sustained above SBC.
Catalyst 4 — Waymo and Other Bets commercialization (optional / longer-dated)
Waymo is the maturing option within Other Bets: management describes it expanding to more cities, entering international markets, and scaling operations, and a post-year-end investment round (majority-funded by Alphabet) reset its valuation upward. Other Bets remains loss-making and Waymo’s economics are unproven at scale, so this is a lower-probability, longer-dated catalyst rather than a near-term earnings driver — but a genuine one, offering embedded optionality that the current valuation largely ignores.
Probability: Low-to-Medium | Timeframe: 3–5 years | Monitoring trigger: Waymo geographic/ride-volume expansion, a narrowing Other Bets operating loss, or an external valuation-marking event.
2.3 Risk & Catalyst Summary
| # | Item | Type | Probability | Timeframe | Status | Monitoring Trigger |
|---|---|---|---|---|---|---|
| 1 | Antitrust / structural-remedy overhang (auditor’s sole CAM) | Risk | High (fines) / Low–Med (break-up) | 1–3 yrs | Active | DOJ ad-tech remedy judgment; Search appeal outcome; EU/DMA actions |
| 2 | AI-capex regime change & off-balance-sheet backstops | Risk | High (FCF/depr.) / Low (backstops) | Immediate & ongoing | Active | 2026 capex guidance; FCF trend; depreciation ramp; backstop notional |
| 3 | Earnings quality — reversible non-cash investment marks | Risk | Med–High | 1–2 yrs | Monitoring | OI&E swings; downward remeasurements of non-marketable book |
| 4 | AI-native disruption of Search advertising | Risk | Medium | 1–5 yrs | Latent | Search query-growth / monetization-per-query commentary |
| 5 | Advertising cyclicality & macro sensitivity | Risk | Medium | Event-driven | Latent | Ad-revenue growth deceleration; macro/advertiser-spend signals |
| 6 | Google Cloud scale & margin inflection | Catalyst | High | 1–3 yrs | Active | Cloud operating-margin expansion; backlog conversion; Wiz/Intersect close |
| 7 | Gemini / AI monetization across Search & ecosystem | Catalyst | Medium | 1–3 yrs | Active | Search monetization holding; paid Gemini/One growth; enterprise adoption |
| 8 | Capital returns — buybacks > dilution + dividend growth | Catalyst | High | Immediate & ongoing | Active | Falling share count; dividend increases; buyback pace vs SBC |
| 9 | Waymo / Other Bets commercialization | Catalyst | Low–Medium | 3–5 yrs | Latent | Waymo expansion; narrowing Other Bets loss; valuation event |
Source: Company SEC filings (10-K) and forensic footnote review; see Appendix A.1.
2.4 Risk Interdependencies
sources The risks do not sit in isolation; the danger is in their correlation. The most damaging combination is a simultaneous strike on the Search franchise from two directions: an adverse antitrust remedy that loosens Google’s default-search distribution and forces data-sharing (Risk 1) landing at the same time as AI-native discovery erodes the volume and monetization of commercial queries (Risk 4). Individually each is survivable; together they would attack the highest-margin profit pool from both the distribution and demand sides at once, with no offsetting lever. A second, financial, correlation links the capex regime to the ad cycle: the off-balance-sheet backstops and guarantees (Risk 2) are designed to crystallize on counterparty default, and infrastructure/energy counterparties are most likely to default in the same macroeconomic downturn that would depress advertising demand (Risk 5) — so a recession would hit revenue, deleverage a cost base swollen by the depreciation ramp, and convert contingent liabilities to cash outflows simultaneously. Finally, the earnings-quality risk (Risk 3) amplifies any of the above: because reported EPS is propped up by reversible AI-cycle investment marks, a private-market repricing would arrive precisely when the operating business is under pressure, compounding a headline earnings decline with a non-operating one. The practical conclusion is that Alphabet’s risks are positively correlated to the macro and AI cycle, which is why the valuation is anchored to free cash flow and a normalized, gains-excluded earnings base rather than to reported profit.
2.5 ESG & Regulatory Exposure
sources Governance. Alphabet is founder-controlled through a tri-class share structure: Class B shares carry ten votes, Class A one vote, and the publicly traded Class C none. Founders Larry Page and Sergey Brin hold the substantial majority of Class B and thereby a majority of total voting power, and because RSUs settle in non-voting Class C, share issuance does not dilute their control. This is a governance feature to price, not an active malfeasance flag — the forensic review found no related-party value-extraction structure in the 10-K (the substantive related-person detail resides in the proxy, which was not part of this filing). Public Class C holders bear the full economic cost of the sizeable stock-based compensation program while having no vote, and standard anti-takeover provisions (blank-check preferred, no written consent, advance-notice rules, Delaware’s business-combination statute) further insulate control. The practical implication is that shareholders cannot force strategic change through the ballot; capital-allocation discipline depends on management’s own judgment.
Regulatory. Regulatory exposure is the defining ESG issue and overlaps directly with Risk 1: continuous antitrust scrutiny across the U.S. (DOJ Search and ad-tech), the EU (ad-tech fine, legacy Shopping/Android/AdSense matters, DMA non-compliance findings on Search and Play), and Asia (Australian and Japanese Search settlements/orders), plus a widening thicket of AI-specific law (the EU AI Act and a wave of U.S. state AI bills), privacy regimes (GDPR and numerous U.S. state laws, with ongoing uncertainty over cross-border data-transfer mechanisms), content-moderation obligations (the EU Digital Services Act, plus pressure on Section 230 and DMCA safe harbors), and digital-services and global-minimum-tax developments (OECD Pillar Two). Management states plainly that compliance may be onerous, could raise costs, could limit or force redesign of products, and could affect its competitive position.
Environmental and social. The AI build-out carries a rising and disclosed environmental footprint: management flags that its ability to scale is increasingly constrained by the availability of power, water, and land, that energy supply is globally constrained by AI-compute demand, and that infrastructure operating costs — depreciation, energy, and network capacity — are expected to increase significantly. On the social axis, the company identifies AI-development risks (harmful content, inaccuracy, bias, IP infringement, minor-protection and privacy issues), cybersecurity exposure (regular attacks including from nation-state actors, increasingly AI-enabled), and human-capital dependence on retaining scarce AI talent and key personnel — with Sundar Pichai specifically flagged as critical to management and strategic direction.
Section 3 — Financial Analysis & Historical Performance
sources Three-Statement Linkage Confirmation: - Net Income ties (Income Statement → Cash Flow Statement): Confirmed. Reported net income ($132,170.0M) is the opening line of the cash-flow statement, from which operating cash flow of $164,713.0M is built. The gap between the two — operating cash flow exceeds net income by a wide margin in every year — is driven by the large non-cash add-backs discussed below (depreciation, stock-based compensation, and, critically in FY2025, the reversal of non-cash investment gains). - Cash ties (Balance Sheet → Cash Flow Statement): Confirmed. Cash and equivalents on the balance sheet ($30,708.0M) reconcile as the ending balance of the cash-flow statement. - Retained Earnings reconciliation (Beg RE + NI - Dividends = End RE): Confirmed with the expected buyback adjustment. The simple identity — beginning retained earnings ($245,084.0M) plus net income ($132,170.0M) less dividends ($10,049.0M) — does not close to ending retained earnings ($324,055.0M) on its own, because Alphabet retires the shares it repurchases and charges a large portion of the repurchase cost ($45,709.0M) directly to retained earnings rather than to additional paid-in capital. Once repurchases are included, the statement reconciles; the discontinuity is an artefact of share retirement, not an accounting break.
3.1A Income Statement
Source: Company SEC filings (10-K); figures per the FL model — see Appendix A.1–A.2. Per-share and share-count figures are restated for Alphabet’s 20-for-1 stock split (ex-date July 15, 2022) so the full history is comparable; as-reported (pre-split) figures are preserved in the Excel model and Appendix.
CAGR Summary
| Metric | 3Y CAGR | 5Y CAGR | 10Y CAGR |
|---|---|---|---|
| Revenue | 12.5% | 17.2% | 18.3% |
| EBITDA | 18.3% | 22.3% | 19.9% |
| Net Income | 30.1% | 26.8% | 23.2% |
| Diluted EPS | 33.3% | 29.8% | 25.2% |
| FCF | 6.9% | 11.3% | 16.0% |
Source: Company SEC filings (10-K); figures per the FL model — see Appendix A.1–A.2.
3.1B Income Statement — Analysis
sources The revenue story — a re-acceleration built on mix, not a single lever. Alphabet’s top line grew 15.1% to $402,836.0M in FY2025, the second consecutive year of re-acceleration after the post-pandemic air-pocket of 9.8% (FY2022) and 8.7% (FY2023). Read across the full history, the pattern is instructive: growth vaulted to 41.2% in the FY2021 advertising snap-back, decelerated as that comparison normalized and the digital-ad market softened, then re-accelerated to 13.9% and 15.1% as Google Cloud reached escape velocity and AI-enhanced Search sustained the core. The five-year revenue CAGR of 17.2% remains comfortably ahead of the three-year 12.5%, confirming that FY2022–FY2023 was a cyclical trough rather than a structural break in the growth algorithm. [Rating and price target withdrawn — see the note at the top.] The analytically important nuance, flagged by management itself, is that the fastest-growing revenue — Cloud, subscriptions, platforms, and devices — carries structurally lower and more variable margins than advertising, with devices in particular a drag; the very success of the diversification therefore dilutes the blended margin mix even as it lengthens the growth runway. (Segment-level revenue and operating-income figures are not carried in this section’s data pack; the segment narrative is developed in Section 1.)
The margin trajectory — gross margin up, operating margin capped. Gross margin expanded steadily from 56.9% to 59.7%, a genuine sign of scale and mix improvement even against rising traffic-acquisition and content-acquisition costs and a sharply higher depreciation load inside cost of revenue. The more revealing story is one level down: EBIT margin was 32.0% in FY2025 — essentially flat versus 32.1% in FY2024 despite 15.1% revenue growth. For a business with Alphabet’s operating leverage, a flat operating margin on double-digit revenue growth is not benign; it means the incremental gross-profit dollars were consumed below the gross line. Three culprits explain the capped operating margin, and each is discussed as a Major Mover below: a step-change in legal and regulatory charges inside G&A, a step-change in depreciation, and continued growth in stock-based compensation. This is a structural shift in the operating-cost base, not a one-quarter blip — and it is why the 32.0% operating margin, not the headline net margin, is the honest measure of FY2025 operating performance.
Major Mover 1 — The AI depreciation wave has arrived in the P&L. D&A rose to $21,136.0M in FY2025 from $15,311.0M, a sharp increase driven purely by the growth of the asset base rather than by any accounting change. This is a forensic point of some importance (F007): contrary to a common concern, Alphabet made no extension to the useful lives of servers or network equipment in FY2025 — so, unlike some prior periods across the sector, the FY2025 operating margin received no depreciation tailwind from an estimate change. The 32.0% operating margin is therefore “clean” of any life-extension cushion. The flip side is a forward headwind: with capital expenditure surging (Major Mover 4) and a large stock of assets not yet in service still awaiting depreciation, this line is set to accelerate against revenue with no remaining useful-life lever to soften it. Structural, and directionally worsening.
Major Mover 2 — Legal and regulatory charges are now a recurring cost of doing business (Forensic RED, F002). General and administrative expense stepped up materially in FY2025, and management attributes the increase largely to two items booked within the year: a European Commission ad-tech fine accrued in the third quarter and a legal settlement accrued in the second quarter. These charges depressed the reported operating margin directly. The auditor identified Loss Contingencies as its single Critical Audit Matter — the highest-risk estimation area in the entire filing — and accrued fines and settlements in short-term liabilities rose sharply year-over-year. The correct analytical treatment is to regard these charges as recurring-in-nature rather than one-off: Alphabet operates under continuous, multi-jurisdiction antitrust pressure (the DOJ Search matter reached final judgment and is on appeal; the DOJ ad-tech matter awaits a remedies judgment in which the government seeks structural remedies that management states could be materially adverse, with no loss estimable and therefore unreserved). For Section 3 purposes, the visible, accrued portion is already compressing operating margin; the larger, unquantified structural-remedy risk is carried in Section 2. This is a permanent feature of the cost base, not a temporary one.
Major Mover 3 — Stock-based compensation keeps climbing and now carries a valuation-driven charge (Forensic YELLOW, F004). SBC (as reported in the cash-flow statement) rose to $24,953.0M from $22,785.0M, extending a multi-year climb from $15,376.0M in FY2021. Embedded in FY2025 R&D is a valuation-based employee-compensation charge tied to Waymo, a non-cash, estimate-driven item that will recur and fluctuate as Other Bets private valuations are reset (Waymo’s post-year-end funding round, largely Alphabet-funded, will reset that valuation again). SBC is a real, recurring economic cost — on the order of the mid-single-digits as a share of revenue — and analysts using any SBC-added-back cash metric should treat it as a genuine expense. The offsetting discipline is that repurchases (Section 3.3) exceed SBC, so dilution is more than covered and the diluted share count is falling; the cost is borne by shareholders in cash rather than in dilution. Structural and recurring.
Major Mover 4 — Reported net income and EPS are flattered by non-operating investment gains (Forensic RED, F001) — the single most important earnings-quality caveat in this report. Here is the wedge that a portfolio manager must not miss. EBIT grew from $112,390.0M to $129,039.0M, but pre-tax income grew far faster, from $119,815.0M to $158,826.0M. That gap — the difference between modest operating-profit growth and a much larger jump in pre-tax income — sits almost entirely in other income (expense), net, and is overwhelmingly composed of gains on equity securities, the majority of which are unrealized mark-ups on privately held (non-marketable) companies re-valued off observable AI-cycle transactions. The fingerprint is unmistakable in the margins: EBIT margin was flat year-over-year at 32.0%, yet net margin jumped to 32.8% from 28.6%, and reported EPS grew 34.5%. A large share of that headline EPS growth is investment-portfolio revaluation, not operating improvement. [Rating and price target withdrawn — see the note at the top.] Temporary and reversible — the defining quality caveat of FY2025.
[Rating and price target withdrawn — see the note at the top.] Each of these is exposed to policy or share-price change: the FDII benefit is already narrowing under enacted law, the SBC benefit is stock-price-dependent, and OECD global-minimum-tax adoption abroad is a forward risk. Separately, July-2025 US tax legislation (immediate expensing of domestic R&E plus accelerated depreciation) delivered a genuine but non-repeating operating-cash-flow timing benefit in FY2025 and swung the deferred-tax line to an expense while roughly halving the net deferred-tax asset. [Rating and price target withdrawn — see the note at the top.]
Quality of earnings — summary. The affirmative comfort is real: accounting policies, revenue recognition, segment definitions, and depreciation lives are all unchanged year-over-year, the auditor’s opinion is clean on both the financials and internal control, and there is no restatement — so the reported revenue and operating trends are economically real (F008, F011). The interpretive issues are concentrated and specific: (a) the ~non-operating investment gains that flatter net income and EPS (F001); (b) the legal charges inside G&A that are recurring-in-nature (F002); (c) the tax attributes and OBBBA timing benefit that will not repeat (F005); and (d) SBC as a genuine, growing cost (F004). One presentation note (F006): Google Network advertising revenue is reported gross (as principal), so the associated traffic-acquisition cost sits in cost of revenue; because the Network line is the one declining ad stream, this gross presentation modestly flatters the reported revenue base relative to economic value.
[Rating and price target withdrawn — see the note at the top.]
3.2A Balance Sheet
Source: Company SEC filings (10-K); figures per the FL model — see Appendix A.1–A.2. Inventory is not separately disclosed in the later years shown and is immaterial to Alphabet’s asset base.
3.2B Balance Sheet — Analysis
sources Asset composition — the balance sheet is being rebuilt around physical infrastructure. The defining balance-sheet event of the period is the transformation of Alphabet from a cash-and-securities-heavy franchise into an increasingly PP&E-heavy one. Net property and equipment rose to $246,597.0M in FY2025 from $171,036.0M — and from $97,599.0M only four years earlier — while total assets grew to $595,281.0M from $450,256.0M. PP&E is now the largest single asset class, the direct balance-sheet counterpart to the AI/data-center capital programme discussed in the cash-flow analysis. Goodwill, by contrast, remained modest at $33,380.0M — Alphabet’s growth has been overwhelmingly organic, and the balance sheet carries little acquisition-related intangible risk today (that will change in FY2026 as the pending Wiz and Intersect acquisitions close and add material goodwill, a forward comparability and impairment watch item, per F011). This is a cash-rich, capital-intensifying balance sheet, not an acquisition-driven one.
Leverage trajectory — a deliberate, low-risk step-up, not a solvency signal (Forensic GREEN, F010). For most of the period Alphabet ran in a net-cash position, with net debt negative in FY2021 through FY2024. In FY2025 that inverted: total debt jumped to $48,543.0M from $14,182.0M as Alphabet issued a large tranche of senior unsecured notes, pushing reported net debt to $17,835.0M. Two points keep this firmly in the “strength” column. First, the reported net-debt figure nets only cash and equivalents ($30,708.0M); Alphabet also holds a substantial marketable-securities portfolio not captured in that line, leaving the group in a deep net-cash position on a total-liquidity basis. Second, the debt is deliberate pre-funding for the capital programme and the pending acquisitions: it is laddered over decades with minimal near-term maturities, carries no financial maintenance covenants, and is dwarfed by operating cash generation. Net debt/EBITDA of 0.1x and debt/equity of 0.1x remain negligible by any standard. The binding constraints on this equity are regulatory and capital-intensity, not leverage.
Working capital — clean, with no earnings-quality trigger. Receivables grew to $62,886.0M, broadly in line with revenue; there is no receivables build outpacing sales that would hint at aggressive revenue recognition, and inventory is immaterial (Alphabet is not a working-capital-intensive business). The current ratio of 2.0x remains comfortably above unity. There is no working-capital red flag; the balance-sheet story is entirely about the PP&E build and its financing, not about receivables or payables management.
⚠ Items to Watch. (1) If net debt/EBITDA exceeds -0.1x on a sustained basis and the marketable-securities buffer is drawn down to fund capital spending, the fortress-balance-sheet premium that underpins the low cost of capital would begin to erode — though from 0.1x that is a distant risk. (2) A sharp write-down of the non-marketable equity book (F001) would reduce total assets and equity directly, feeding through the return and Altman metrics below. (3) The FY2026 close of the pending acquisitions will introduce goodwill and integration/impairment risk that the FY2025 balance sheet does not yet carry.
3.3A Cash Flow Statement
| FY2021 | FY2022 | FY2023 | FY2024 | FY2025 | |
|---|---|---|---|---|---|
| Cash from Operations ($M) | $91,652.0M | $91,495.0M | $101,746.0M | $125,299.0M | $164,713.0M |
| — Depreciation & Amortization ($M) | $12,441.0M | $15,928.0M | $11,946.0M | $15,311.0M | $21,136.0M |
| — Stock-Based Compensation ($M) | $15,376.0M | $19,362.0M | $22,460.0M | $22,785.0M | $24,953.0M |
| Capital Expenditures ($M) | $24,640.0M | $31,485.0M | $32,251.0M | $52,535.0M | $91,447.0M |
| Free Cash Flow ($M) | $67,012.0M | $60,010.0M | $69,495.0M | $72,764.0M | $73,266.0M |
| FCF Margin | 26.0% | 21.2% | 22.6% | 20.8% | 18.2% |
| FCF / Share | $4.94 | $4.56 | $5.46 | $5.85 | $5.99 |
| FCF Conversion (FCF/NI) | 88.1% | 100.1% | 94.2% | 72.7% | 55.4% |
| CapEx / Revenue | 9.6% | 11.1% | 10.5% | 15.0% | 22.7% |
| CapEx / D&A | 2.0x | 2.0x | 2.7x | 3.4x | 4.3x |
| Dividends Paid ($M) | — | $0.0M | $0.0M | $7,363.0M | $10,049.0M |
| Share Repurchases ($M) | $50,274.0M | $59,296.0M | $61,504.0M | $62,222.0M | $45,709.0M |
Source: Company SEC filings (10-K); figures per the FL model — see Appendix A.1–A.2.
3.3B Cash Flow — Analysis
sources Operating cash flow is the cleaner story — and it is excellent. This is where the earnings-quality caveats of Section 3.1 resolve in Alphabet’s favour. Operating cash flow rose to $164,713.0M in FY2025 from $125,299.0M — genuine, cash-backed growth, precisely because the cash-flow statement strips out the non-cash investment gains that flatter reported net income. Where reported net income is inflated by the mark-to-market gains (F001), operating cash flow adds them back as non-cash and is therefore the honest gauge of the operating engine. Note, however, one temporary tailwind inside FY2025 OCF: the July-2025 tax legislation front-loaded deductions (immediate R&E expensing plus accelerated depreciation), a genuine but non-repeating timing benefit (F005) that should be normalized out when extrapolating cash generation. The five-year OCF CAGR of 20.4% captures a business converting scale into cash with remarkable consistency.
CapEx — the regime change, and the compression of free cash flow (Forensic RED, F003). The pivotal cash-flow event is the near-doubling of capital expenditure to $91,447.0M from $52,535.0M — and from just $24,640.0M in FY2021. CapEx/revenue leapt to 22.7% from 9.6% at the start of the period, and CapEx/D&A reached 4.3x — the company is now spending more than four times its depreciation charge, an unambiguous signal of aggressive growth investment rather than maintenance or harvest. The consequence is stark and must be stated plainly: despite operating cash flow nearly doubling over the period, free cash flow was essentially flat — $73,266.0M in FY2025 versus $67,012.0M in FY2021 — because the entire incremental cash generation was absorbed by the capital programme. FCF conversion (FCF/net income) collapsed from 88.1% to 55.4%, and FCF margin fell to 18.2% from 26.0%. This is where the cash is being consumed. Management has guided that capital spending will “significantly increase” again, so FCF compression is set to continue near-term. Beyond the on-balance-sheet spend sits a large and partly new off-balance-sheet obligation stack — purchase commitments, data-center leases not yet commenced, and, newly, credit-derivative backstops of third-party data-center leases plus energy guarantees (F003) — meaning Alphabet is increasingly financing and backstopping the very infrastructure counterparties it contracts with. These do not hit FCF today, but they crystallize into real obligations if those counterparties default in a downturn — a contingent risk correlated with the same macro that would soften Cloud demand.
Capital allocation waterfall — reinvestment now leads, buybacks remain large, a young dividend. The mix of uses has shifted decisively toward reinvestment. Across the period, capital expenditure has grown from a fraction of buybacks to the dominant call on cash. Share repurchases remained substantial but stepped down to $45,709.0M in FY2025 from $62,222.0M — an implicit acknowledgment that the capital programme now takes priority. Buybacks nonetheless continue to exceed stock-based compensation, so the diluted share count fell to 12,230M and per-share metrics benefit from a genuine, not cosmetic, reduction in the count. The dividend, initiated only in FY2024, grew to $10,049.0M in FY2025 — a deliberately modest commitment that signals capital-return maturity without constraining the reinvestment budget. Given the scale and returns of the AI/Cloud opportunity set (returns analysis below), tilting the mix toward reinvestment is the correct allocation decision — provided the incremental capital continues to earn the returns Alphabet has historically achieved, which is the central question the ROIC analysis must answer.
⚠ Items to Watch. (1) If FCF conversion falls below 55.4% — i.e., capex growth continues to outrun operating cash flow — the equity story shifts from “cash machine” to “capital-intensive growth bet,” changing the valuation framework materially. (2) If CapEx/D&A stays above 4.3x for several more years without a commensurate acceleration in Cloud revenue and margin, it would raise the risk that infrastructure is being built ahead of realized demand. (3) Crystallization of the off-balance-sheet backstops in a downturn would convert a contingent exposure into a cash call precisely when cash flow is most pressured.
3.4 Returns Analysis
| FY2021 | FY2022 | FY2023 | FY2024 | FY2025 | |
|---|---|---|---|---|---|
| ROIC | 28.9% | 25.4% | 27.7% | 31.8% | 28.7% |
| ROE | 32.1% | 23.6% | 27.4% | 32.9% | 35.7% |
| ROA | 22.4% | 16.6% | 19.2% | 23.5% | 25.3% |
| Interest Coverage | 227.5x | 209.6x | 273.7x | 419.4x | 175.3x |
Source: Company SEC filings (10-K); figures per the FL model — see Appendix A.1–A.2.
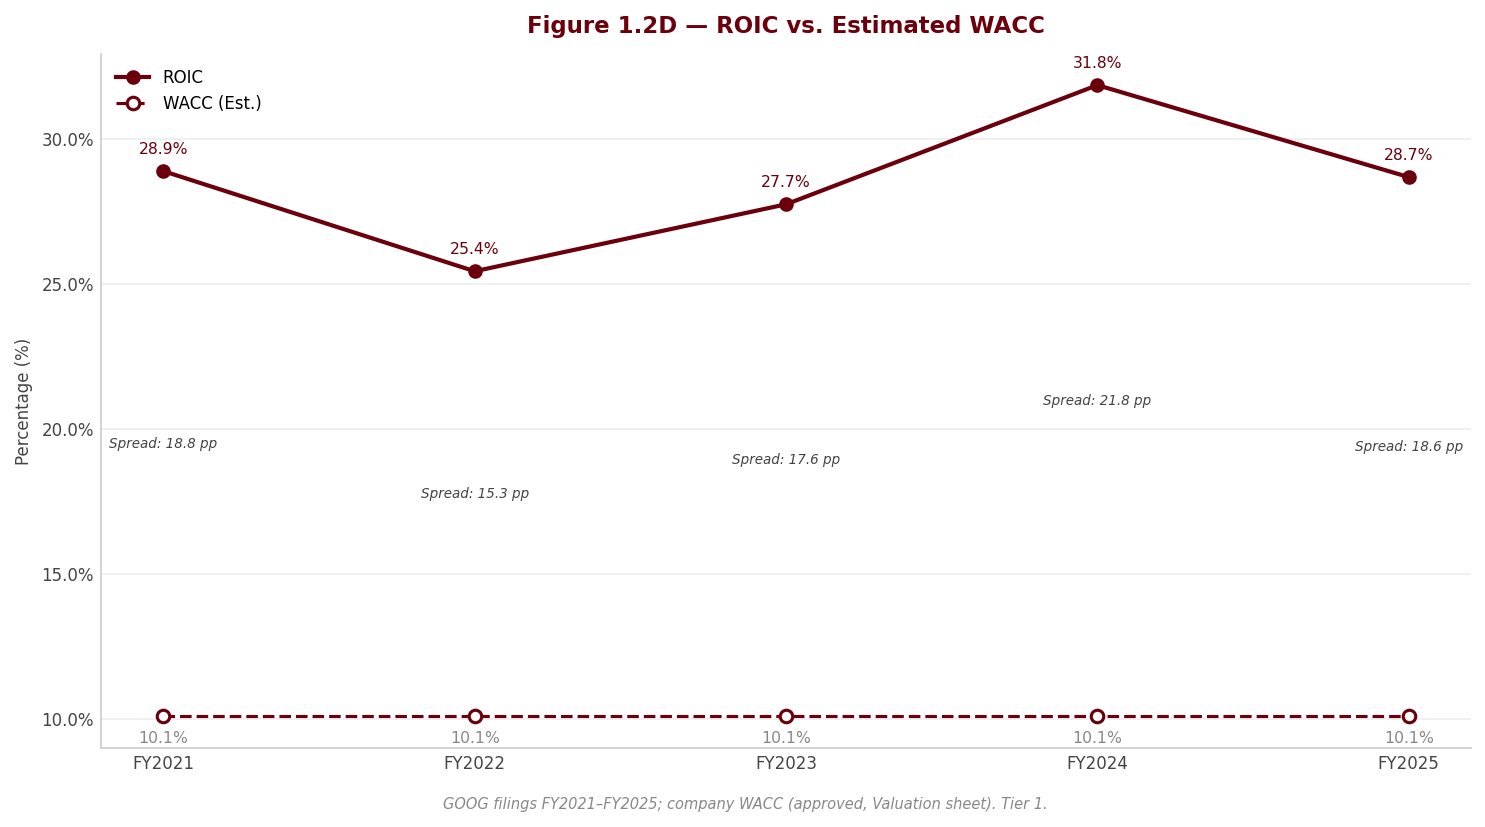
ROIC — the number that matters most, and it is exceptional. Return on invested capital was 28.7% in FY2025, and has held in a remarkably tight, high band across the cycle — 28.9% (FY2021), 25.4% (FY2022), 27.7% (FY2023), 31.8% (FY2024). Against a cost of capital in the high-single-digit to low-double-digit range, Alphabet earns an ROIC roughly three times its WACC — an enormous, durable economic spread that is the quantitative signature of a wide-moat franchise and the single strongest argument for continued reinvestment. The critical forward question is whether the surge in invested capital (the PP&E build) can sustain this spread: incremental returns on AI/data-center capital are unproven relative to the near-costless-to-scale advertising economics that produced the historical ROIC, and the FY2025 ROIC already reflects a modest step-down from the FY2024 peak as the capital base outgrew NOPAT. A gradual normalization of ROIC toward — but still well above — WACC is the reasonable base case; a collapse in the spread is the bear case that reinvestment must disprove. One caveat: because reported returns are computed off a net income that includes the investment gains (F001), the FY2025 ROE in particular is somewhat flattered — the operating return on capital is the more stable and more relevant measure. Interest coverage of 175.3x — down from 419.4x only because of the new debt issuance, and still vast — confirms that leverage poses no return-eroding risk.
DuPont decomposition — a margin story, not a leverage story. Decomposing FY2025 ROE of 35.7% into its drivers: net margin of 32.8%, asset turnover of 0.77x (computed on average assets, per the DuPont convention — the period-end asset-turnover figure used in the Section 5 benchmarking is slightly lower), and an equity multiplier of 1.41x. The composition is telling. The equity multiplier is very low — Alphabet generates a mid-thirties ROE with almost no financial leverage, a rare and high-quality combination that means the return is earned operationally rather than manufactured through the balance sheet. Asset turnover is moderate and structurally declining as the asset-heavy AI build inflates the denominator, a headwind to ROE that reinvestment must overcome through margin and growth. That leaves net margin as both the primary driver of the ROE level and the swing factor — and here the earnings-quality caveat returns with force: the FY2025 net margin is elevated by the non-operating investment gains (F001), so a portion of the ROE improvement to 35.7% is portfolio revaluation rather than operating enhancement. Strip the gains, and the underlying operating ROE is high but more stable than the headline suggests. The swing factor for future ROE is therefore twofold: the trajectory of the (volatile) net margin and the drag from falling asset turnover as capital intensity rises.
3.5 Altman Z-Score (Most Recent FY)
| Component | FY2023 | FY2024 | FY2025 |
|---|---|---|---|
| X1 (Working Capital / Total Assets) | 0.223 | 0.166 | 0.174 |
| X2 (Retained Earnings / Total Assets) | 0.525 | 0.544 | 0.544 |
| X3 (EBIT / Total Assets) | 0.209 | 0.250 | 0.217 |
| X4 (Equity / Total Liabilities) | 2.381 | 2.597 | 2.307 |
| X5 (Revenue / Total Assets) | 0.764 | 0.777 | 0.677 |
| Z-Score | 3.02 | 3.22 | 2.90 |
| Zone | Safe | Safe | Safe |
Source: Company SEC filings (10-K); figures per the FL model — see Appendix A.1–A.2.
Interpretation — the score is riding the safe-zone boundary; the decline is mechanical, not a solvency signal. Alphabet’s Altman Z-Score eased to 2.90 in FY2025 from 3.22 in FY2024 and 3.02 in FY2023. The workbook computes the score on the Altman Z′ (private-firm) coefficients, whose own boundaries place the safe zone above 2.90 and the grey zone between 1.23 and 2.90; the FY2025 print sits fractionally above the 2.90 line — essentially on the boundary. A score riding a threshold this closely carries no information in its own right: a rounding difference in any single input would nudge it a hair to either side of the line and flip the classification without the underlying credit picture changing at all. It is neither the comfortable safe-zone reading of prior years nor a grey-zone warning; it is a boundary print, and what matters is the direction and cause of the multi-year drift, both of which are mechanical. The decline is concentrated in two components, neither of which reflects deteriorating solvency. The first is X5 (revenue/total assets), which fell as total assets ballooned faster than revenue during the data-center capex programme (F003) — a growing, cash-generative asset base drives this ratio down and the score with it, exactly backwards to the economic reality. The second is X4 (book equity/total liabilities), which compressed as total liabilities rose on the debt issuance that pre-funds the capital build; in this Z′ formulation X4 is book equity over total liabilities and is entirely price-independent — the move has nothing to do with the share price and everything to do with more liabilities sitting beneath an equity base that grew more slowly. The X2 component (retained earnings/total assets) remains high, reflecting a company that has funded its growth from decades of accumulated internal earnings rather than external capital.
The deeper point is that the Altman model was calibrated on leveraged industrial manufacturers, not on a net-cash technology platform, and it is poorly specified for a company like Alphabet. A boundary-riding print sits on top of a balance sheet that carries a substantial marketable-securities buffer leaving the group in a deep net-cash position on a total-liquidity basis (F010), interest coverage that remains vast even after the FY2025 debt issuance, and operating cash flow and free cash flow measured in the tens of billions. A model that places such a company within a hair of its “safe” boundary is measuring asset-turnover intensity and the accounting mix of the balance sheet, not the probability of financial distress — which here is negligible. The honest reading is that the score carries no signal at this level: the binding risks to this equity are regulatory (F002) and the return earned on the capital-intensity build (F003), not solvency, and the balance sheet itself remains a source of strength rather than of investment risk. The component to watch is not the headline Z but X5: were revenue growth to lag the asset build further, the ratio — and the score — would keep drifting lower for the same benign, mechanical reason, and could carry the print across the 2.90 line into the grey band without any change in the underlying solvency it purports to measure.
4. Valuation withdrawn
This section stated what the shares were worth and what to do about them. It rested on an exit multiple set by hand — across the coverage it averaged 24% below where each company actually traded — so the conclusion largely restated that assumption instead of testing it. Rather than leave it standing, it has been withdrawn while the method is rebuilt.
Nothing else in this report depends on it: the financial analysis above and below is drawn from the company's own filings, and every figure links to the page it was verified against.
Section 5 — Financial Metrics & Peer Benchmarking
5.1 Peer Selection
sources No listed company is a clean mirror of Alphabet. Alphabet is a conglomerate whose economics are dominated by a search-and-advertising monopoly-class franchise, layered with a fast-scaling hyperscale-cloud business and a portfolio of loss-making “Other Bets.” We therefore benchmark it against the two large-cap US technology franchises that each overlap one of its two core profit engines, rather than against a broad and misleading “internet” basket. Meta Platforms, Inc. (META) is the purest read on the digital-advertising engine that still generates the large majority of Alphabet’s profit: like Alphabet it monetises attention across owned-and-operated properties, reports under US GAAP, and — critically for a clean comparison — closes its fiscal year on the same December date. Microsoft Corporation (MSFT) is the most relevant read on the cloud-and-AI-infrastructure engine (Azure vs. Google Cloud) and on the capital-intensity and returns profile of a scaled software-plus-cloud franchise.
The set has two limitations the reader should hold in mind. First, it is deliberately narrow — two peers, not four — because the alternatives degrade comparability rather than improve it: Amazon’s AWS is a fair cloud comparator but its consolidated financials are dominated by low-margin retail, and Apple’s hardware-led model shares almost none of Alphabet’s cost structure. A two-name set of genuinely comparable franchises is more informative than a four-name set padded with poor proxies. Second, and most importantly, Microsoft reports on a June fiscal year, so its FY2025 figures are dated roughly six months before Alphabet’s and Meta’s December-2025 balance date; every Microsoft comparison in this section is time-lagged and should be read as directional. This is the single most load-bearing caveat in the tables that follow and is detailed in 5.7.
| Peer | Ticker | Exchange | Filing Type | Accounting Standard | Fiscal Year End | Comparability Note |
|---|---|---|---|---|---|---|
| Meta Platforms, Inc. | META | Nasdaq | 10-K | US GAAP | December | Calendar-aligned (Dec) and US GAAP — cleanest comparison; but ads-only cost base makes gross margin definitionally higher (see 5.7). |
| Microsoft Corporation | MSFT | Nasdaq | 10-K | US GAAP | June | June year-end — FY2025 ends ~6 months before Alphabet’s; all figures time-lagged and directional only (see 5.7). |
Source: Peer-company SEC filings; comparability notes in 5.7 — see Appendix A.1.
5.2 Profitability Comparison
sources Comparative: Most Recent Full Fiscal Year
| Metric | Alphabet Inc. | Meta Platforms, Inc. | Microsoft Corporation |
|---|---|---|---|
| Revenue ($M) | $402,836.0M | $200,966.0M | $281,724.0Mᵗ |
| Gross Margin | 59.7% | 82.0%ᵍ | 68.8%ᵗ |
| EBITDA Margin | 37.3% | 50.7% | 57.7%ᵗ |
| EBIT Margin | 32.0% | 41.4% | 45.6%ᵗ |
| Net Margin | 32.8%ⁿ | 30.1%ⁿ | 36.1%ᵗ |
| FCF Margin | 18.2% | 22.9% | 25.4%ᵗ |
Source: Peer-company SEC filings; comparability notes in 5.7 — see Appendix A.1.
Flag legend: ᵐ = market-sourced (market capitalisation as of ~Aug 2026 against fiscal-year fundamentals); ᵗ = Microsoft fiscal-period lag (~6 months; June 30 year-end — directional only, see 5.7); ᵍ = gross-margin cost-of-revenue definition difference (see 5.7); ⁿ = net-income-based metric distorted by a non-operating or one-off item (see 5.7). EBITDA is not disclosed by any of the three companies; all EBITDA margins are analyst-computed from operating income plus depreciation and amortisation.
Peer figures: Meta Platforms, Inc. (10-K, FY2025) and Microsoft Corporation (10-K, FY2025 (Jun)).
Historical: Alphabet Inc. Own 5-Year Progression
| Metric | FY2021 | FY2022 | FY2023 | FY2024 | FY2025 |
|---|---|---|---|---|---|
| Gross Margin | 56.9% | 55.4% | 56.6% | 58.2% | 59.7% |
| EBITDA Margin | 35.4% | 32.1% | 31.3% | 36.5% | 37.3% |
| EBIT Margin | 30.6% | 26.5% | 27.4% | 32.1% | 32.0% |
| Net Margin | 29.5% | 21.2% | 24.0% | 28.6% | 32.8% |
| FCF Margin | 26.0% | 21.2% | 22.6% | 20.8% | 18.2% |
Source: Peer-company SEC filings; comparability notes in 5.7 — see Appendix A.1.
The profitability comparison must be read from the operating line, not the top of the income statement. On gross margin Alphabet (59.7%) screens below both Microsoft (68.8%) and Meta (82.0%), but this ranking is largely definitional rather than economic: Alphabet carries very large traffic-acquisition costs (payments to distribution partners), plus YouTube content and hardware costs, inside cost of revenue, whereas Meta’s cost of revenue is a narrow digital-ads infrastructure base and Microsoft’s reflects a software-plus-cloud mix. The gross-margin gap is therefore substantially an artefact of what each company classifies as COGS (see 5.7, C004) — it is not evidence that Alphabet’s underlying business is less profitable.
The cleaner operating comparison is EBIT margin, where the differences are real. Alphabet’s 32.0% operating margin sits below Meta’s 41.4% and Microsoft’s 45.6%. Two structural drags explain most of the gap and are genuine, not accounting: Alphabet consolidates the loss-making “Other Bets” portfolio, and FY2025 operating income absorbed sizeable European Commission and privacy-related legal charges inside G&A (see 5.7 and Section 3). Even so, Alphabet’s own five-year progression is the more important story for this holding — EBIT margin has rebuilt materially over the past five years to 32.0% and EBITDA margin has expanded to 37.3%, evidence of operating leverage as the business scaled.
The one figure a reader should discount is net margin. Alphabet’s 32.8% net margin sits above its own 32.0% EBIT margin — an inversion that is only possible because FY2025 net income was flattered by large non-operating, largely non-cash gains on the company’s securities portfolio (a RED earnings-quality finding detailed in 5.7 and Section 3). Alphabet’s net-margin “lead” is not operational and should not be read as one. Meta’s net margin (30.1%), by contrast, is depressed this year by a one-time tax charge; its operating margins are the clean read on its profitability. Microsoft’s 36.1% net margin is the least distorted of the three but is on the older June-2025 base.
5.3 Returns Comparison
sources Comparative: Most Recent Full Fiscal Year
| Metric | Alphabet Inc. | Meta Platforms, Inc. | Microsoft Corporation |
|---|---|---|---|
| ROIC | 28.7% | 24.4%ⁿ | 29.7%ᵗ |
| ROE | 35.7%ⁿ | 27.8%ⁿ | 29.6%ᵗ |
| ROA | 25.3%ⁿ | 16.5%ⁿ | 16.5%ᵗ |
| Asset Turnover | 0.68x | 0.55x | 0.46xᵗ |
Source: Peer-company SEC filings; comparability notes in 5.7 — see Appendix A.1.
Historical: Alphabet Inc. Own 5-Year Progression
| Metric | FY2021 | FY2022 | FY2023 | FY2024 | FY2025 |
|---|---|---|---|---|---|
| ROIC | 28.9% | 25.4% | 27.7% | 31.8% | 28.7% |
| ROE | 32.1% | 23.6% | 27.4% | 32.9% | 35.7% |
| ROA | 22.4% | 16.6% | 19.2% | 23.5% | 25.3% |
Source: Peer-company SEC filings; comparability notes in 5.7 — see Appendix A.1.
Returns on capital are where Alphabet’s franchise quality is most visible, and where all three names screen as exceptional businesses. On ROIC the three cluster in a similar high-return band — Alphabet at 28.7%, Meta at 24.4%, Microsoft at 29.7% — each a multiple of the ~10.09% weighted-average cost of capital. [Rating and price target withdrawn — see the note at the top.] Two comparability points temper a literal ranking. Alphabet’s ROIC is taken from the internal model (Metrics sheet); the peer ROICs are analyst-computed on a consistent debt-plus-equity-less-cash basis, so cross-company ROIC is directional rather than precise. [Rating and price target withdrawn — see the note at the top.]
ROE and ROA should be read with more caution still. Alphabet’s headline ROE (35.7%) and ROA (25.3%) are both inflated by the same non-operating securities gains that distort net margin — they overstate the return the operating business actually earned. Meta’s ROE and ROA are, conversely, understated by its one-time tax charge. The cleanest structural observation is asset turnover, where Alphabet (0.68x) leads both Meta (0.55x) and Microsoft (0.46x). Microsoft’s lower turnover and ROA are not operational underperformance: its balance sheet carries a large acquired goodwill-and-intangibles base (chiefly Activision Blizzard) that inflates assets and depresses both ratios (see 5.7, C005). Alphabet’s asset base is comparatively goodwill-light, which is why it converts each dollar of assets into more revenue than either peer.
The more important lens is Alphabet’s own trajectory. The ROIC progression from 28.9% in FY2021 to 28.7% in FY2025 confirms the operating improvement is structural and not a single good year. The watch item — developed in Section 3 — is that the current AI-infrastructure capital cycle is enlarging the invested-capital and asset base rapidly, which will pressure these return ratios going forward even if operating profit keeps growing.
5.4 Leverage & Liquidity Comparison
sources Comparative: Most Recent Full Fiscal Year
| Metric | Alphabet Inc. | Meta Platforms, Inc. | Microsoft Corporation |
|---|---|---|---|
| Net Debt / EBITDA | 0.1x | -0.2x | -0.3xᵗ |
| Total Debt / Equity | 0.1x | 0.3x | 0.1xᵗ |
| Interest Coverage | 175.3x | 71.5x | 53.9xᵗ |
| Current Ratio | 2.0x | 2.6x | 1.4xᵗ |
| FCF Margin | 18.2% | 22.9% | 25.4%ᵗ |
Source: Peer-company SEC filings; comparability notes in 5.7 — see Appendix A.1.
All three companies are effectively unlevered, cash-rich franchises for which balance-sheet risk is negligible; the differences here are matters of capital-structure preference, not solvency. One number in the table is a comparability trap that must be flagged. Alphabet’s Net Debt / EBITDA reads 0.1x — marginally positive — but this is computed on the model’s convention of cash and equivalents only. The peer figures net each company’s full cash-plus-marketable-securities holdings, and on that same like-for-like basis Alphabet holds a substantial net-cash position, the largest of the three, once its sizeable marketable-securities portfolio is included. Read correctly, Alphabet is not more levered than Meta (-0.2x) or Microsoft (-0.3x); it is the least levered. This convention gap is disclosed in 5.7 (C005).
The remaining ratios reinforce the fortress-balance-sheet picture. Alphabet’s total debt-to-equity of 0.1x is the lowest of the set, below Meta’s 0.3x and comparable to Microsoft’s 0.1x. Interest coverage of 175.3x dwarfs both peers (71.5x and 53.9x) — a function of Alphabet’s very small interest burden relative to operating income — and the current ratio of 2.0x sits comfortably between Meta’s more liquid 2.6x and Microsoft’s tighter 1.4x. The honest critique of Alphabet’s balance sheet is not that it carries too much debt but arguably too little: with this cash generation and coverage, the capital structure is conservative to the point of being sub-optimal, leaving substantial unused debt capacity. The single soft spot is free-cash-flow conversion: Alphabet’s FCF margin (18.2%) is the lowest of the three, below Meta (22.9%) and Microsoft (25.4%), because the AI-capex surge is compressing free cash flow even as operating profit grows — a genuine operating finding, not an accounting artefact, taken up in 5.6.
5.5 Valuation Multiples Comparison
sources Comparative: Current Price
| Metric | Alphabet Inc. | Meta Platforms, Inc. | Microsoft Corporation |
|---|---|---|---|
| EV/EBITDA | 27.9x | 13.7xᵐ | 20.9xᵐ ᵗ |
| P/E | 31.6xⁿ | 23.5xᵐ ⁿ | 33.9xᵐ ᵗ |
| FCF Yield | 1.8% | 3.3%ᵐ | 2.1%ᵐ ᵗ |
Source: Peer-company SEC filings; comparability notes in 5.7 — see Appendix A.1.
All peer valuation multiples are market-sourced (market capitalisation as of ~Aug 2026 against fiscal-year fundamentals) and subject to change with price movements. See 5.7 (C006).
Historical: Alphabet Inc. EV/EBITDA (period-end price)
| FY2021 | FY2022 | FY2023 | FY2024 | FY2025 |
|---|---|---|---|---|
| 21.4x | 12.8x | 18.5x | 18.5x | 25.7x |
Source: Peer-company SEC filings; comparability notes in 5.7 — see Appendix A.1.
The valuation comparison carries the most interpretive hazard in this section, and the reported P/E is actively misleading for Alphabet. At 31.6x Alphabet’s headline P/E looks broadly in line with Microsoft (33.9x) and richer than Meta (23.5x) — but Alphabet’s earnings denominator is inflated by the large non-operating securities gains flagged as a RED earnings-quality issue (5.7, C002). Strip those gains out and Alphabet’s operating P/E is higher than the 31.6x screen implies: Alphabet is not as cheap as its reported P/E suggests. Meta’s 23.5x cuts the other way — its earnings denominator is depressed by a one-time tax charge, so on normalised earnings Meta is cheaper than its optically high P/E; the two distortions push in opposite directions and make a raw P/E ranking meaningless. Microsoft’s 33.9x is additionally stale, struck on June-2025 earnings roughly thirteen to fourteen months behind the current market cap.
For this peer set, therefore, we lean on the cash-flow- and enterprise-value-based measures, which are the least distorted. On EV/EBITDA Alphabet (27.9x) is the most expensive of the three — well above Meta (13.7x) and Microsoft (20.9x, and stalest) — and it is also expensive against its own history: current EV/EBITDA of 27.9x compares with a five-year range that ran from 12.8x to 25.7x on period-end prices. The FCF yield tells the same story from the cash side: Alphabet’s 1.8% is the thinnest of the three, below Meta (3.3%) and Microsoft (2.1%), because the capex surge is holding back free cash flow. The net read is that Alphabet is priced at a premium to peers on the cleanest operating multiples and above its own recent history — a premium that must be justified by superior durability and growth rather than by a flattering reported P/E. Every multiple here pairs an ~Aug-2026 market capitalisation with fiscal-year fundamentals, so none should be treated as a current LTM or consensus figure (5.7, C006).
5.6 Efficiency Comparison
| Metric | Alphabet Inc. | Meta Platforms, Inc. | Microsoft Corporation |
|---|---|---|---|
| Days Sales Outstanding | 52 days | 36 days | 91 daysᵗ |
| Days Inventory Outstanding | - | — | 4 daysᵗ |
| Days Payables Outstanding | 23 days | 90 days | 115 daysᵗ |
| Cash Conversion Cycle | 30 days | -54 days | -21 daysᵗ |
| CapEx / Revenue | 22.7% | 34.7% | 22.9%ᵗ |
Source: Peer-company SEC filings; comparability notes in 5.7 — see Appendix A.1.
Working-capital efficiency is a minor swing factor for all three — none carries meaningful inventory (each is a digital/software franchise), so the cash conversion cycle is driven by receivables against payables. Alphabet collects in 52 days, faster than Microsoft’s 91 days but slower than Meta’s 36 days; both peers run structurally negative cash conversion cycles (Meta -54 days, Microsoft -21 days) because they stretch payables far longer than they extend credit to customers. Alphabet’s own payables cycle (23 days) is shorter, and its cash conversion cycle is not computed on a like-for-like payables basis in the model, so this row is directional; the practical point is that working capital is not a material value driver for any of the three and does not differentiate them.
The efficiency line that matters is capital intensity. Capex as a share of revenue is the clearest expression of the AI-infrastructure arms race all three are running. [Rating and price target withdrawn — see the note at the top.] The genuine finding — and it is an operating one, not a comparability artefact — is that Alphabet’s capex has roughly tripled over three years, and it is this surge, more than any working-capital difference, that explains why Alphabet’s FCF margin now trails both peers (5.4). The forward tension is that this spending both funds the Cloud growth that supports the premium valuation and, per Section 3, seeds an accelerating depreciation charge and continued free-cash-flow compression. It is the central operating question in the peer comparison: whether the heaviest capital cycle in the company’s history converts into durable returns or simply resets the return base lower.
5.7 Comparability Caveats
sources This peer comparison is only as honest as its caveats. The following material issues affect how each table above should be read; none is buried, and none is contradicted by the commentary.
C001 — Microsoft’s June fiscal year (MATERIAL; affects every Microsoft figure). Microsoft closes its fiscal year on 30 June, so its FY2025 ended roughly six months before Alphabet’s and Meta’s December-2025 balance date. Every Microsoft figure in Sections 5.2–5.6 is therefore approximately two calendar quarters stale relative to the other two companies, and its market-based multiples (5.5) are stalest of all — pairing an ~Aug-2026 market capitalisation with June-2025 fundamentals, a gap of roughly thirteen to fourteen months. Over the second half of calendar 2025 Microsoft’s Azure and AI/Copilot revenue grew strongly, so its FY2025 revenue, margins and cash flows understate its position as of Alphabet’s balance date. All Microsoft comparisons are marked ᵗ and should be treated as directional, not contemporaneous.
C002 — Alphabet’s net income is inflated by non-operating investment gains (MATERIAL, RED; affects Alphabet net margin, ROE, ROA and P/E). Alphabet’s FY2025 net income and pre-tax income are materially flattered by large, largely non-cash gains on its debt and equity securities — the bulk of them unrealised mark-ups on privately held companies whose valuations rest on management judgment and observable transactions in an AI-driven private-market repricing. These gains are the reason Alphabet’s net margin (32.8%) exceeds its EBIT margin (32.0%), and they inflate its ROE, ROA and (by lifting the earnings denominator) deflate its reported P/E. They are volatile and reversible — the same portfolio produced net losses as recently as 2023. Every net-income-based Alphabet metric is marked ⁿ. The reader should lean on Alphabet’s EBIT margin, EBITDA margin and ROIC — which use operating income and are clean — for cross-company operating comparisons, and should not credit Alphabet’s net-margin or P/E screen to operating performance.
[Rating and price target withdrawn — see the note at the top.] Meta’s optically high P/E (23.5x) reflects a tax-depressed denominator, not an expensive stock — on normalised earnings Meta is cheaper than the screen implies. Meta’s affected metrics are marked ⁿ.
C004 — Gross margin is not defined consistently across the three (MATERIAL; affects the gross-margin row). Alphabet carries traffic-acquisition costs, YouTube content and hardware costs inside cost of revenue; Meta’s cost of revenue is a narrow digital-ads infrastructure base with R&D and most operating costs below the line; Microsoft’s reflects a software-plus-cloud mix. The resulting gross-margin ranking (Alphabet 59.7% below Microsoft 68.8% below Meta 82.0%) is driven substantially by classification, not underlying profitability. Meta additionally prints no gross-profit subtotal, so its figure is analyst-computed (marked ᵍ). Gross margin should not be used to rank these companies; EBIT and EBITDA margin are the cleaner profitability measures.
C005 — Balance-sheet composition and the net-cash convention (INFORMATIONAL to MATERIAL; affects ROA, asset turnover and Net Debt/EBITDA). Microsoft’s asset base carries a large acquired goodwill-and-intangibles stack (chiefly Activision Blizzard), which structurally depresses its ROA (16.5%) and asset turnover (0.46x) relative to Alphabet’s comparatively goodwill-light base — a genuine M&A/capital-structure difference, not operational weakness. Separately, and importantly for 5.4: Alphabet’s Net Debt/EBITDA (0.1x) is computed on cash and equivalents only, whereas the peer figures net full cash-plus-marketable-securities. On the same basis Alphabet holds the largest net-cash position of the three. ROIC for the peers uses a consistent debt-plus-equity-less-cash definition; Alphabet’s ROIC is model-computed, so cross-company ROIC is directional.
C006 — All valuation multiples are hybrids (MATERIAL; affects every figure in 5.5). Market capitalisations are aggregator-sourced (Tier 2) as of approximately 3 August 2026, while the fundamentals are each company’s fiscal comparison period. For Alphabet and Meta (December-2025 fundamentals) the market-cap-to-fundamental gap is about seven months; for Microsoft (June-2025 fundamentals) it is about thirteen to fourteen months. No multiple should be read as a current LTM or consensus figure; peer multiples are marked ᵐ and Microsoft’s additionally ᵗ. Combined with C002 and C003, this is why we anchor the valuation read on EV/EBITDA and FCF yield rather than reported P/E.
C007 — The capex-intensity comparison is valid and material (INFORMATIONAL; affects 5.4 and 5.6). All three are in a heavy AI/data-center capital-spending cycle, so the capex-intensity and FCF-margin gaps are real findings, not artefacts. Meta is the most capital-intensive at 34.7% of revenue; Alphabet (22.7%) and Microsoft (22.9%) are similar and lower. Alphabet’s FCF margin (18.2%) is the lowest of the three despite the largest revenue base, because its capex has roughly tripled over three years — a genuine strategic finding, subject to the reminder that Microsoft’s ratios sit on the older June-2025 base.
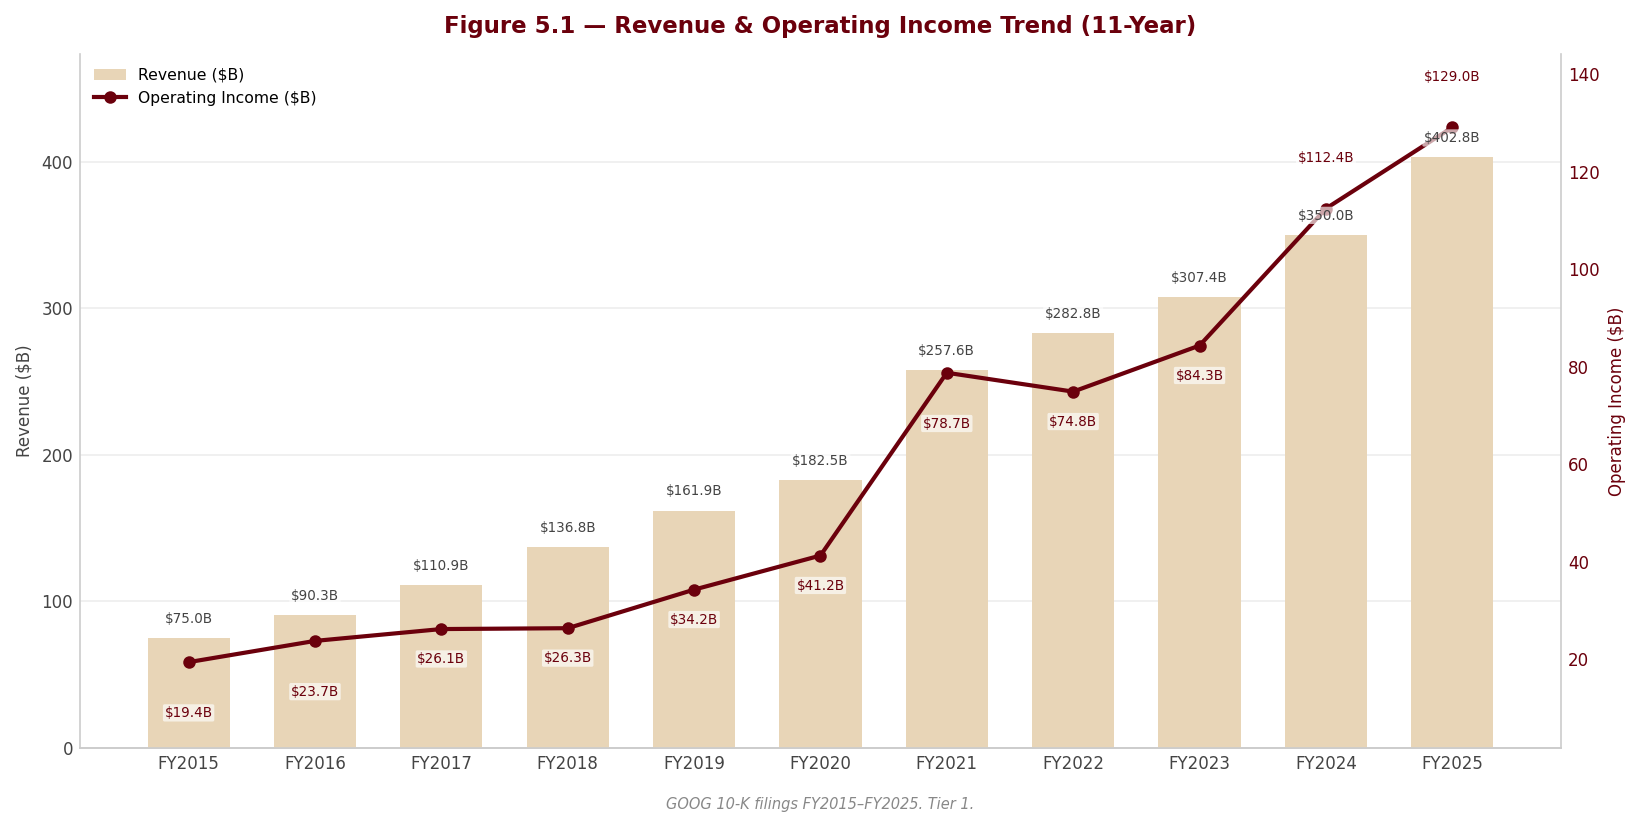
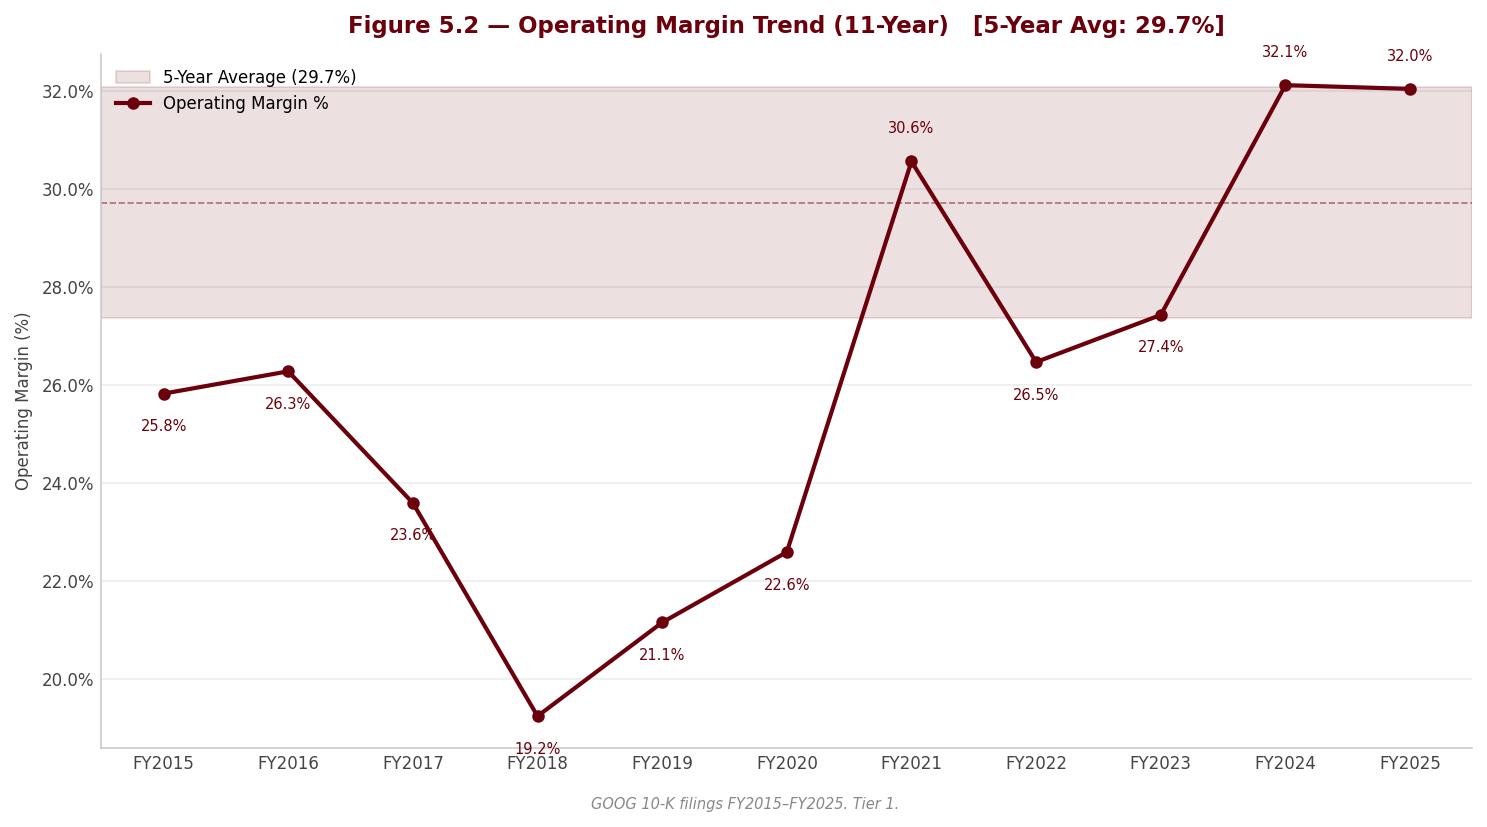
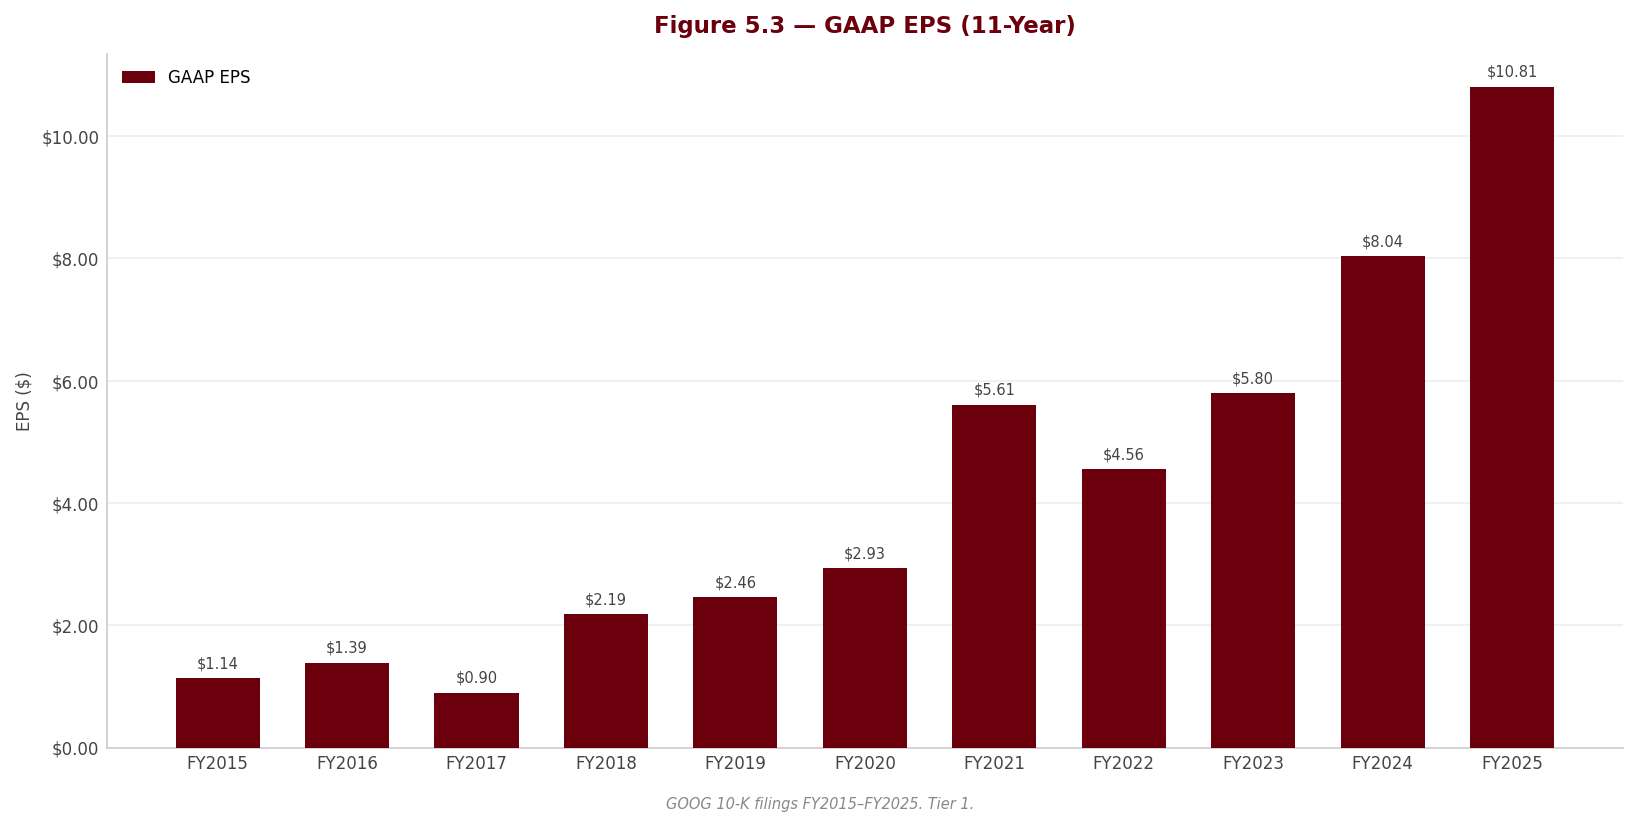
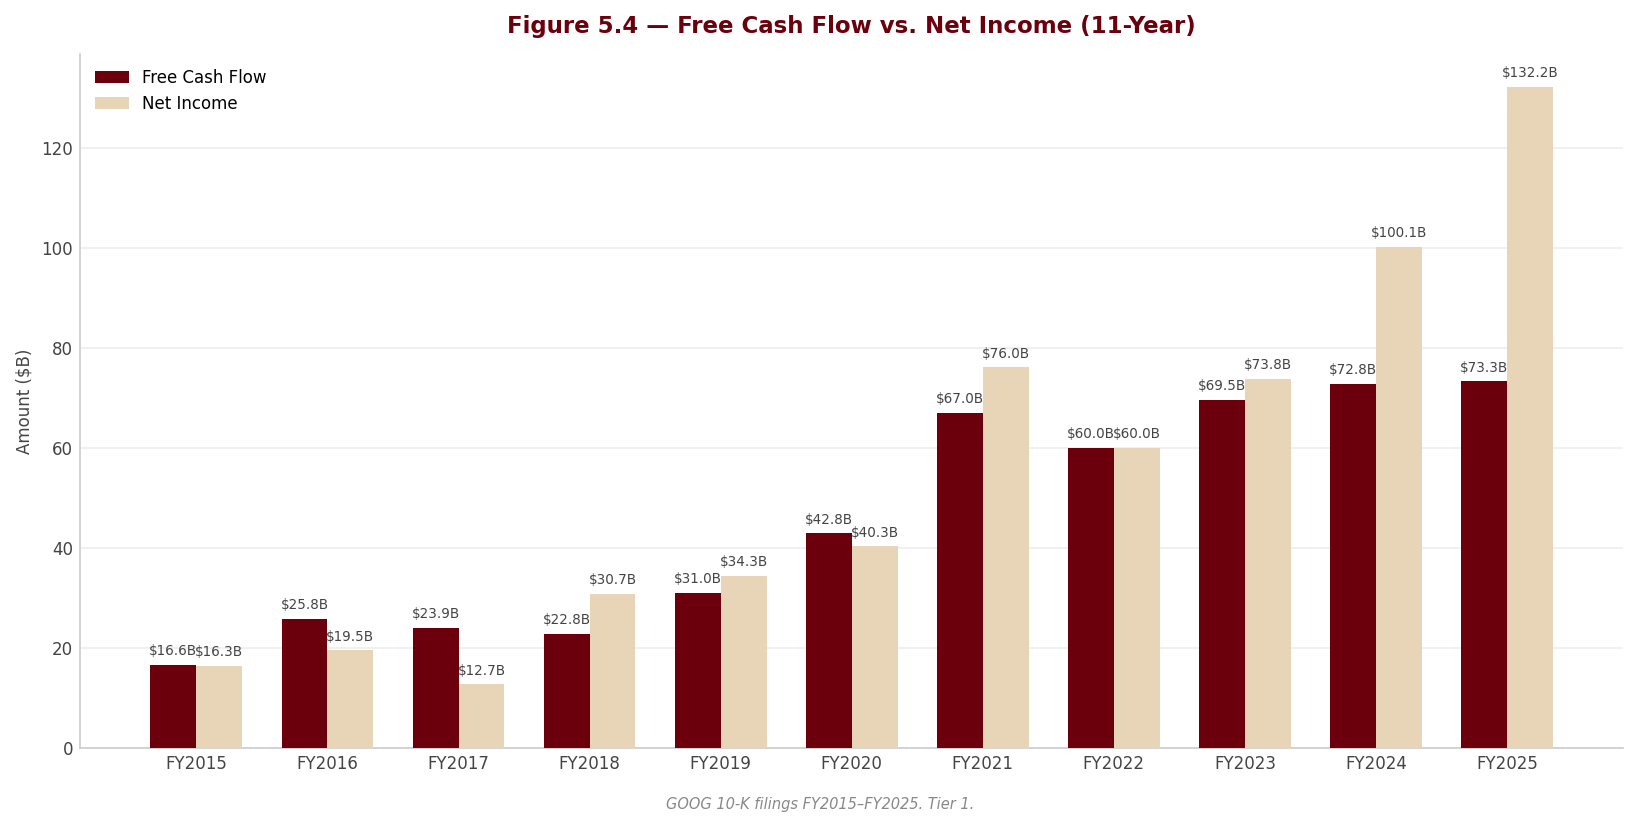
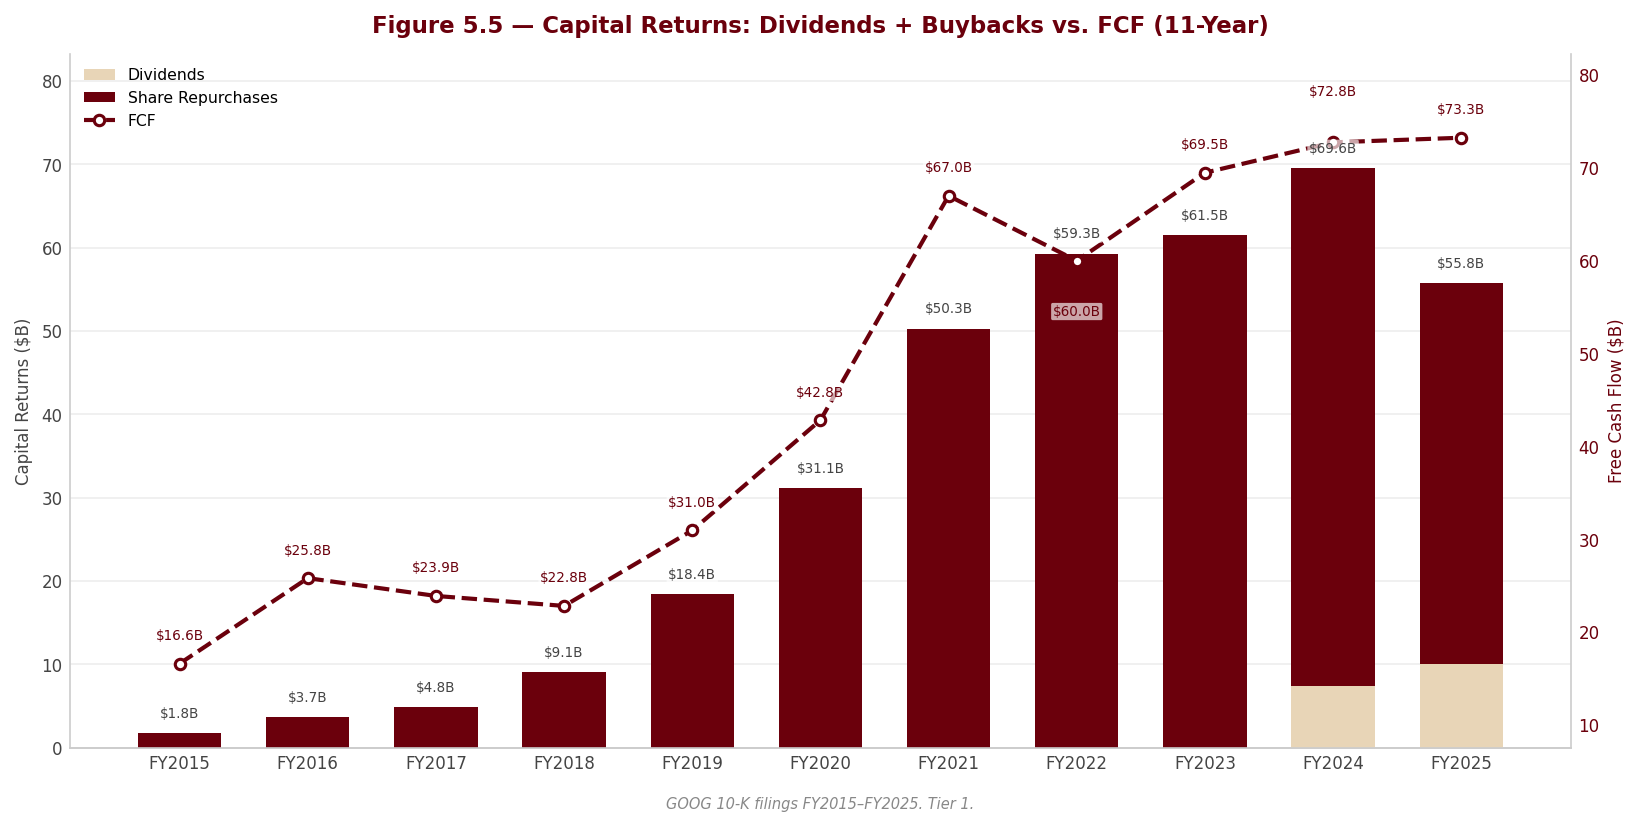
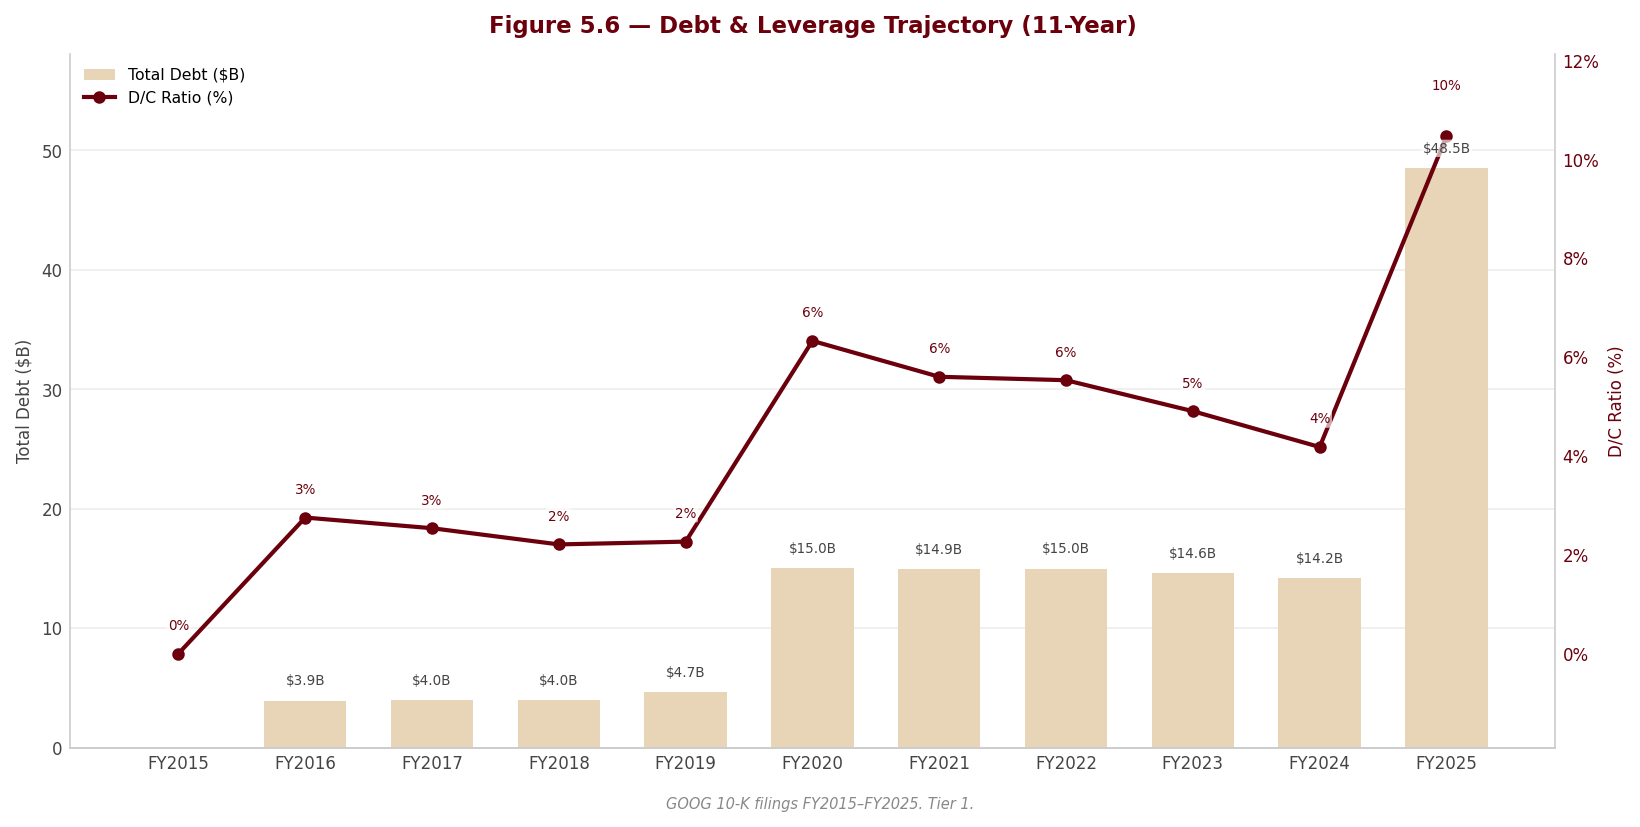
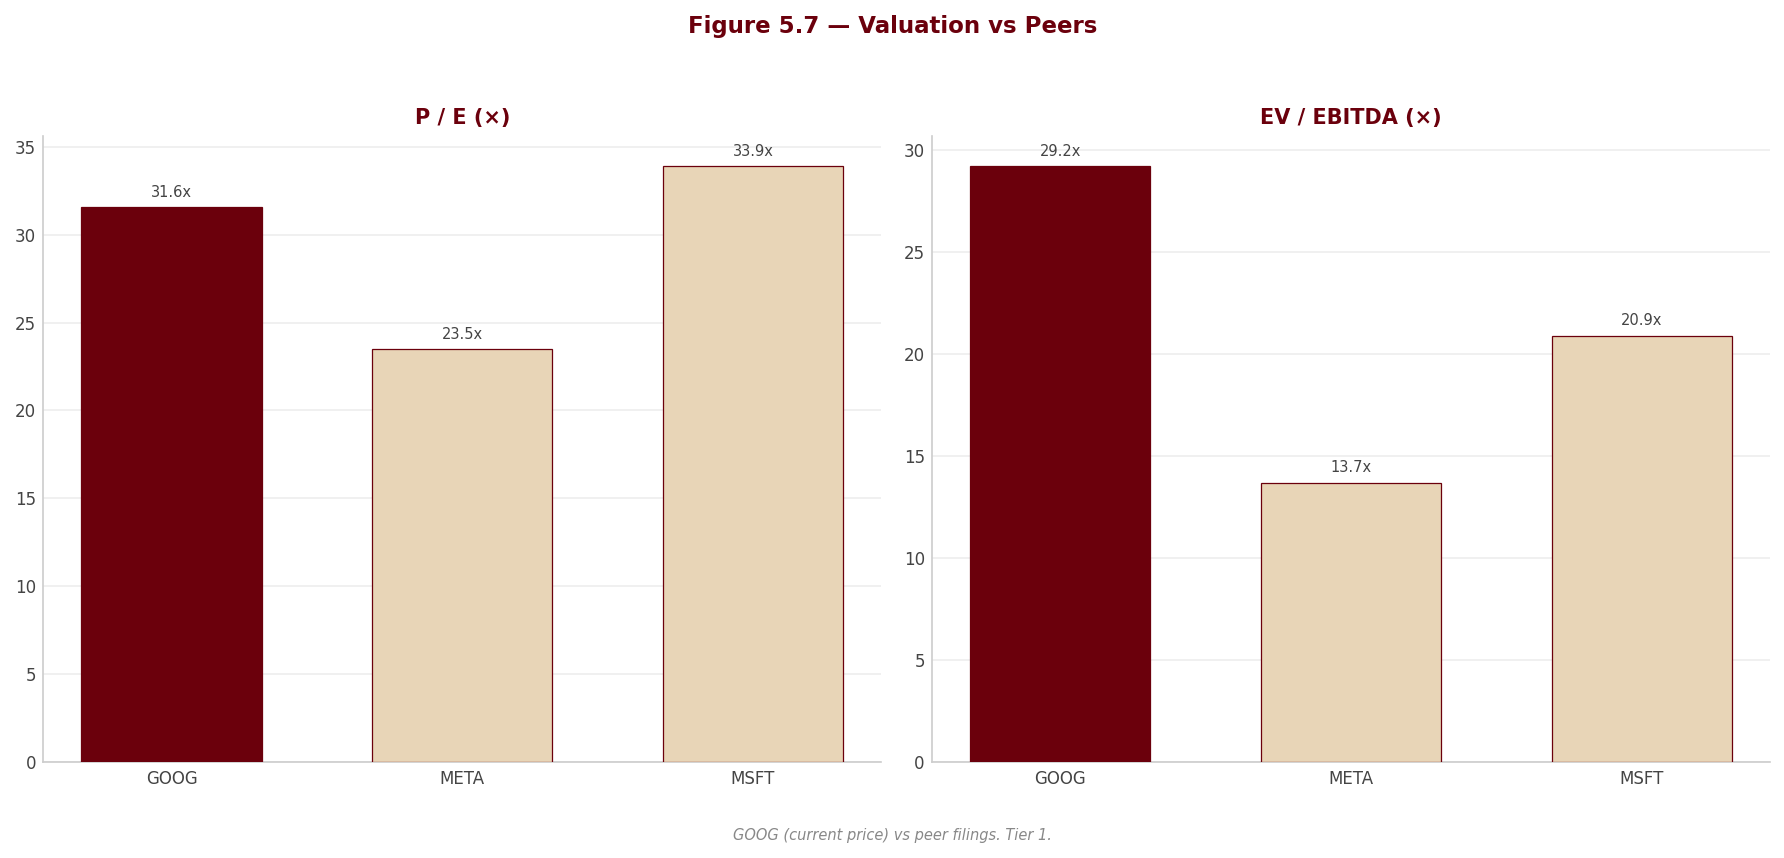
6. Valuation & Price Target withdrawn
This section stated what the shares were worth and what to do about them. It rested on an exit multiple set by hand — across the coverage it averaged 24% below where each company actually traded — so the conclusion largely restated that assumption instead of testing it. Rather than leave it standing, it has been withdrawn while the method is rebuilt.
Nothing else in this report depends on it: the financial analysis above and below is drawn from the company's own filings, and every figure links to the page it was verified against.
Section 7 — Quarterly Update: Q2 2026
Portfolio Action
[Rating and price target withdrawn — see the note at the top.]
| Assessment | |
|---|---|
| Action | [Rating and price target withdrawn — see the note at the top.] |
| Reason | Operating income rose +30.4% YoY to $40,770.0M with Google Cloud revenue +81.8% and its operating margin expanding to 35.6% (from 20.7%), confirming the core thesis — but free cash flow turned negative at -$5,855.0M as CapEx doubled to $44,924.0M, offsetting the operating strength. |
| Thesis intact? | PARTIALLY — the operating thesis (Search/YouTube ad resilience and the Google Cloud profitability inflection) strengthened, but the quarter marks a decisive shift to a capital-consuming, externally-financed, negative-FCF regime and headline EPS of $9.11 is overwhelmingly non-operating investment marks. |
| Trigger to revisit | [Rating and price target withdrawn — see the note at the top.] |
7.1 Results at a Glance
| Metric | Q2 2026 | Q2 2025 | YoY Δ | Q1 2026 | QoQ Δ |
|---|---|---|---|---|---|
| Revenue ($M) | $119,796.0M | $96,428.0M | +24.2% | $109,896.0M | +9.0% |
| Gross Profit ($M) | $73,853.0M | $57,389.0M | +28.7% | $68,625.0M | +7.6% |
| Gross Margin | 61.6% | 59.5% | +2.1 pp | 62.4% | -0.8 pp |
| EBITDA ($M) | $47,874.0M | $36,269.0M | +32.0% | $46,178.0M | +3.7% |
| EBITDA Margin | 40.0% | 37.6% | +2.4 pp | 42.0% | -2.1 pp |
| EBIT ($M) | $40,770.0M | $31,271.0M | +30.4% | $39,696.0M | +2.7% |
| EBIT Margin | 34.0% | 32.4% | +1.6 pp | 36.1% | -2.1 pp |
| Net Income ($M) | $112,193.0M | $28,196.0M | +297.9% | $62,578.0M | +79.3% |
| Net Margin | 93.7% | 29.2% | +64.4 pp | 56.9% | +36.7 pp |
| Diluted EPS | $9.11 | $2.31 | +294.4% | $5.11 | +78.3% |
YoY Δ formula: (CQ - PYSQ) / |PYSQ| × 100 — e.g. Revenue (119,796 - 96,428) / 96,428 × 100 = +24.2%. QoQ Δ formula: (CQ - PQ) / |PQ| × 100 — e.g. Revenue (119,796 - 109,896) / 109,896 × 100 = +9.0%. Margin formula: line / Revenue × 100 — e.g. Gross Margin CQ 73,853 / 119,796 × 100 = 61.6%; margin Δ in percentage points (pp).
Note: The +297.9% net-income and +294.4% EPS jumps are almost entirely non-operating — Other income (expense), net of $97,983M (vs $2,662M) drove them; core operating income rose +30.4%. See 7.2.
Source: Alphabet Inc. Form 10-Q, quarter ended June 30, 2026, Consolidated Statements of Income (p. 9). Margins and deltas are analyst-computed from data-pack figures.
7.2 P&L Drivers
sources Revenue: The +24.2% YoY / +9.0% QoQ top-line gain was led by Google Cloud, up +81.8% to $24,768M — the quarter in which Alphabet began recognizing external TPU-system revenue (10-Q p. 21, p. 48) — and by Google Services +15% (+$12.0B), where Google Search & other grew +16.8% to $63,271M and YouTube ads +12.9% to $11,055M on higher advertiser spend and a +13% rise in paid clicks (cost-per-click +3%), while Google Network fell -$51M to $7,303M (10-Q p. 21, p. 47–48). The Cloud revenue backlog jumped to $513.9B (of $519.5B total remaining performance obligations) from $242.8B at year-end 2025, underpinning the durability of Cloud demand (10-Q p. 22).
[Rating and price target withdrawn — see the note at the top.] Gross margin expanded +2.1 pp YoY and EBIT margin +1.6 pp to 34.0%; the structural driver is Google Cloud, whose segment operating margin inflected to 35.6% (operating income $8,814M) from 20.7% a year ago (operating income $2,826M), while Google Services operating income rose +19.6% to $39,544M (10-Q p. 40, p. 49).
Below the line: Interest expense rose to $1,278.0M CQ from $261.0M PYSQ on the debt build (10-Q p. 43); a $1.5B PriceRunner/Klarna legal charge hit Google Services G&A (plus $581M of related interest in OI&E), and new mandatory-convertible-preferred dividends of $86M were deducted from income available to common (10-Q p. 46, p. 9). [Rating and price target withdrawn — see the note at the top.]
7.3 Balance Sheet & Cash Flow
| Metric | Q2 2026 | Q2 2025 | YoY Δ | Q1 2026 | QoQ Δ |
|---|---|---|---|---|---|
| Cash ($M) | $55,911.0M | $21,036.0M | +165.8% | $38,063.0M | +46.9% |
| Net Debt ($M) | $44,253.0M | $3,571.0M | +1,139.2% | $41,436.0M | +6.8% |
| Net Debt / LTM EBITDA | —ᵃ | — | — | — | — |
| Total Assets ($M) | $921,983.0M | $502,053.0M | +83.6% | $703,919.0M | +31.0% |
| Equity ($M) | $640,480.0M | $362,916.0M | +76.5% | $478,746.0M | +33.8% |
| OCF ($M) | $39,069.0M | $27,747.0M | +40.8% | $45,790.0M | -14.7% |
| CapEx ($M) | $44,924.0M | $22,446.0M | +100.1% | $35,674.0M | +25.9% |
| FCF ($M) | -$5,855.0M | $5,301.0M | -210.5% | $10,116.0M | -157.9% |
| Dividends Paid ($M) | $2,689.0M | $2,543.0M | +5.7% | $2,542.0M | +5.8% |
YoY/QoQ formulas as in 7.1 — e.g. CapEx YoY (44,924 - 22,446) / 22,446 × 100 = +100.1%; FCF QoQ (-5,855 - 10,116) / |10,116| × 100 = -157.9%.
ᵃ Net Debt / LTM EBITDA is shown as an em dash because a trailing-twelve-month EBITDA cannot be assembled from the data-pack placeholders: the pack carries only the current quarter (Q2 2026), the prior sequential quarter (Q1 2026), and the prior-year same quarter (Q2 2025), which do not form four consecutive quarters. Deriving LTM would require hard-typing the Q3 2025 and Q4 2025 figures, which is not permitted. Context: leverage is not a binding constraint — Net Debt of $44,253.0M (this model nets only cash & equivalents against debt) is trivial against a single-quarter EBITDA of $47,874.0M, and the 10-Q shows $242.5B of cash, cash equivalents and marketable securities versus $98.2B of long-term debt (10-Q p. 7).
Source: Alphabet Inc. Form 10-Q, quarter ended June 30, 2026, Consolidated Balance Sheets (p. 7) and Consolidated Statements of Cash Flows (p. 14). Deltas are analyst-computed from data-pack figures.
Balance sheet note: Total assets rose +31.0% QoQ to $921,983.0M, driven by the March-2026 close of the $29.5B Wiz acquisition (goodwill to $57,828M from $33,380M; intangibles to $9,105M) and by the investment portfolio — non-marketable securities reached $131.5B and marketable securities $186.6B, the latter now including SpaceX shares reclassified as marketable (10-Q p. 7, p. 15, p. 29). Long-term debt roughly doubled to $98,165M (from $46,547M at year-end 2025) after $20.0B of USD and $31.8B of foreign-currency note issuance in H1 2026, and equity climbed +33.8% QoQ to $640,480.0M on retained earnings plus $30.5B of common-stock and $19.0B of preferred issuance (10-Q p. 7, p. 25, p. 34).
Cash flow note: FCF conversion = FCF / Net Income = -5,855 / 112,193 × 100 = -5.2%, a figure distorted by the ~$98B of largely non-cash investment gains inflating net income; the operative fact is that CapEx of $44,924.0M exceeded operating cash flow of $39,069.0M, producing the first negative quarterly FCF of -$5,855.0M. OCF still grew +40.8% YoY, but CapEx doubled (+100.1% YoY) on the AI technical-infrastructure build, and management expects to “significantly increase” that investment again in 2026 (10-Q p. 14, p. 52).
7.4 Footnote Review
sources Note 1 — Summary of Significant Accounting Policies (10-Q p. 16–21) Confirms no material changes to significant accounting policies versus the FY2025 10-K except the addition of a Business Combinations critical estimate (for Wiz/Intersect) and prior-period reclassifications to conform to current presentation. Three disclosure-only standards are pending and not yet adopted — ASU 2024-03 (expense disaggregation, 2027/2028), ASU 2025-06 (internal-use software, 2028), and newly ASU 2026-02 (environmental credits, 2028). Analytical significance: year-over-year comparability of the core statements is intact; no revenue-timing, depreciation, or segment redefinition is masking the trends.
Note 2 — Revenues (10-Q p. 21–22) Disaggregated revenue confirms Google Cloud $24,768M (+81.8% YoY) and Google advertising $81,629M. The revenue backlog rose to $519.5B, of which $513.9B is Google Cloud — up from $242.8B (Cloud-heavy) at year-end 2025, with just over 50% expected within 24 months; deferred revenue rose to $10.1B from $8.6B. Note the methodology change (elected in Q1 2026) to include contracts with an original term of one year or less, which lifts the reported backlog. Analytical significance: the >2× backlog jump is the strongest forward-demand signal in the filing and directly supports the Cloud growth thesis, though part of the increase is a presentation change.
Note 3 — Financial Instruments (10-Q p. 22–31) This is the quarter’s dominant footnote. Gain (loss) on equity securities in OI&E was $99,031M (vs $1,286M PYSQ), of which the unrealized net gain on non-marketable measurement-alternative securities was $77,354M and the unrealized gain on marketable/other equity securities was $21,399M — driven by SpaceX (now $80.0B short-term-restricted + $14.1B long-term-restricted marketable equity) and a private company. Non-marketable measurement-alternative carrying value reached $124.3B (of which $87.9B was remeasured in the quarter, Level 2), with cumulative upward adjustments of $85,732M (from $44,485M at year-end 2025). Off-balance-sheet derivative notionals grew sharply: credit-derivative data-center backstops to $43,785M (from $16,940M) and a new $20,000M equity-derivative funding commitment (from $0). Analytical significance: ~$99B of pre-tax income this quarter is non-operating, largely non-cash, reversible mark-to-market on illiquid holdings — it must be stripped from any measure of core earnings power, and it is a source of future downside volatility.
Note 4 — Leases (10-Q p. 35–37) Total lease cost was $1,679M for the quarter (from $1,318M). Critically, leases not yet commenced — primarily data centers — carry $85.2B of future payments (up from $58.5B at year-end 2025), commencing 2026–2031, plus a new ~$5.8B short-term lease commencing Q3 2026. Analytical significance: a large and growing off-balance-sheet future obligation tied to the AI build; not yet on the balance sheet but a committed forward cash and depreciation call.
Note 5 — Variable Interest Entities (10-Q p. 37–39) Unconsolidated-VIE future funding commitments rose to $21.9B (from $1.1B), including the $20.0B equity-derivative capital commitment to a private company through 2030. Data-center credit backstops and energy financial guarantees are provided to VIEs where Alphabet is not the primary beneficiary. Analytical significance: confirms the infrastructure-counterparty circularity flagged in the FY2025 forensic review is scaling materially.
Note 6 — Debt (10-Q p. 39–40) Total face value of long-term debt reached $101,085M (carrying $98,165M) from $49,085M, after issuing $20.0B USD notes (Q1) and multi-currency notes (£5.5B, CHF3.1B, €9.0B, C$8.5B, ¥576.5B). Notes are senior unsecured, rank equally, and carry no financial maintenance covenants; only $1,999M is the current portion. Commercial paper outstanding is $0; credit facilities are $11.7B with $1.3B drawn. Analytical significance: a deliberate, low-cost debt-funded pre-position for the CapEx build; leverage remains comfortably covered but interest expense is now rising ($1,278.0M vs $261.0M).
Note 7 — Supplemental Financial Statement Information (10-Q p. 40–43) Property & equipment, net was $321,212.0M, with assets not yet in service surging to $122,814M (from $78,592M) — a forward depreciation load awaiting service; ~60% of technical-infrastructure assets are servers/network equipment. Accrued fines and settlements rose to $17,356M (from $15,594M). OI&E detail confirms interest income $1,430M, interest expense ($1,278M), and the $99,031M equity-securities gain. Noncontrolling interests grew to $7.1B. Analytical significance: the assets-not-yet-in-service jump signals an accelerating depreciation headwind to margins as the build enters service.
Note 8 — Acquisitions and Divestitures (10-Q p. 43–45) Wiz closed March 11, 2026 for $29.5B (goodwill $22,705M, intangibles $8,300M, into Google Cloud); Intersect (renewable energy) closed March 10, 2026 for $5.9B. GFiber was classified held-for-sale (primarily $7.1B of P&E) pending a late-2026 contribution into a new entity ($1.5B cash + $2.0B note + 49.99% stake). Analytical significance: Wiz materially inflates Cloud goodwill/intangibles and adds FY2026 integration risk; the GFiber divestiture modestly de-risks Other Bets.
Note 9 — Goodwill and Intangible Assets (10-Q p. 45–47) Goodwill rose to $57,828M (Google Cloud $31,520M post-Wiz) from $33,380M; net intangibles to $9,105M. Quarterly intangible amortization was $367M. No impairment. Analytical significance: comparability watch item for FY2026, but no impairment risk flagged this quarter.
Note 10 — Commitments and Contingencies (10-Q p. 47–55) (litigation detailed under “Contingencies and litigation” below) Purchase commitments and other contractual obligations were $707.0B per the note ($811.0B including open POs per MD&A, $200.7B short-term), primarily technical-infrastructure and inventory supply agreements plus energy take-or-pay and content licenses. Financial guarantees carry $7.6B maximum potential future payments, with an additional ~$24.1B of future backstops agreed. Analytical significance: an obligation stack that has grown to multiples of annual revenue, tightening the linkage between the thesis and sustained AI/Cloud demand.
Note 11 — Stockholders’ Equity (10-Q p. 55–57) (capital return detailed under “Related-party” and 7.5 below) Documents the June-2026 capital raises: a $20.5B public common-stock offering, a $10.0B Berkshire Hathaway private placement, $19.0B of 6.25% mandatory convertible preferred (converting ~May 2029), $1.0B of capped calls to limit dilution, and a new $40.0B ATM program (unused at quarter-end). The dividend was raised 5% to $0.22/quarter (declared April 2026); there were no share repurchases. Analytical significance: a decisive pivot from returning capital to raising it — dilutive and leverage-adding — to fund the AI build.
Note 12 — Net Income Per Common Share (10-Q p. 58–60) Two-class method plus if-converted treatment of the new preferred; consolidated diluted shares of 12,309 million (10-Q p. 59) and diluted EPS of $9.11. Preferred dividends of $86M are deducted in arriving at income available to common. Analytical significance: dilution from the preferred and equity raises is now embedded in the diluted count; immaterial this quarter but growing.
Note 13 — Compensation Plans (10-Q p. 61) [Rating and price target withdrawn — see the note at the top.] Analytical significance: SBC is a real, growing recurring cost (~6.7% of revenue), and with no buybacks this quarter it was not offset by repurchases as in prior periods.
Note 14 — Income Taxes (10-Q p. 61) [Rating and price target withdrawn — see the note at the top.] Gross unrecognized tax benefits were $12.1B ($10.3B would affect the ETR). OECD Pillar Two had no material effect this period. Analytical significance: the ETR increase is mechanically tied to the (reversible) investment gains, not a structural operating-tax change; the deferred-tax liability build mirrors the unrealized nature of the gains.
Note 15 — Information about Segments and Geographic Areas (10-Q p. 61–65) Segment operating income: Google Services $39,544M (from $33,063M), Google Cloud $8,814M (from $2,826M), Other Bets loss $(1,799)M (from $(1,246)M), Alphabet-level activities $(5,789)M (from $(3,372)M, reflecting shared AI R&D). Analytical significance: the Cloud operating-income tripling and margin inflection are the standout, partly offset by a widening Alphabet-level AI-R&D drag.
This 10-Q contains no separate Subsequent Events note; post-quarter events are disclosed within Notes 10 and 11 and MD&A (see “Subsequent events” below).
Related-party transactions (10-Q p. 34, p. 55–57, p. 60) Alphabet discloses no controlling-shareholder value-extraction arrangement (no management fees, intercompany pricing, or asset transfers). The material related-investor transaction this quarter is the $10.0B private placement to an affiliate of Berkshire Hathaway (National Indemnity Company) on June 4, 2026 — 14 million Class A and 14 million Class C shares under a the separate valuation(a)(2) exemption, at the same prices as the concurrent public offering ($355.1982 Class A / $351.8018 Class C), i.e., arm’s-length; a related registration-rights agreement was filed (10-Q p. 34, p. 60, Exhibits 10.04–10.05). No comparable related-party transaction existed in Q2 2025 (PYSQ), where the only equity activity was $13,263M of buybacks and $2,543M of dividends (10-Q p. 11). Founder voting control via the ten-vote Class B stock is unchanged (835 million Class B shares outstanding at July 15, 2026; 10-Q p. 2). Governance items: director John Hennessy terminated a Rule 10b5-1 plan (up to 8,400 Class C / 4,200 Class A shares) on June 22, 2026, and new Principal Accounting Officer Marsida Saraci has a pre-existing plan (~1,804 Class C shares); both are routine (10-Q p. 60). Terms: the Berkshire placement is a one-time capital raise, not a recurring arrangement.
Contingencies and litigation (10-Q p. 47–55) The antitrust/regulatory overhang remains the auditor’s highest-risk area and is now partly crystallizing: - DOJ Search (D.C.): Final judgment entered December 2025 imposing distribution restrictions and search-data-sharing/syndication requirements; Google appealed January 2026 and the DOJ/states cross-appealed February 2026. Status vs. prior quarter: on appeal, unchanged in substance (10-Q p. 51). - DOJ Advertising Technology (E.D. Va.): April-2025 ruling found Google’s publisher tools “unfairly excluded rivals”; a remedies proceeding was held September 2025 with November 2025 closing arguments; a final judgment is awaited. “The DOJ’s remedy proposal includes structural remedies that could have a material adverse effect on our business,” and “we cannot estimate a possible loss.” A separate E.D. Texas state case follows. This is the single largest un-quantified, unreserved tail risk (10-Q p. 51). - EU ad-tech “self-preferencing”: €3.0B EC fine (September 2025); Google recognized a $3.5B charge in Q3 2025 and posted bank guarantees; appeal pending (10-Q p. 51). - EU Android: The European Court of Justice denied Google’s appeal in July 2026; the €4.1B decision is now final and Google made a $5.2B cash payment (fine plus interest) in July 2026 — a previously-accrued item now paid (10-Q p. 49, p. 46). - EU AdSense for Search: The €1.5B fine was annulled by the General Court (September 2024); the EC’s appeal remains pending (10-Q p. 49). - PriceRunner/Klarna (Sweden): In July 2026 the Stockholm court awarded ~$2.1B; Google recognized $2.1B in Q2 2026 ($1.5B principal in Google Services G&A + $581M interest/costs in OI&E) and appealed (10-Q p. 53, p. 46). - Epic/Google Play: Settled in March 2026; Google withdrew its Supreme Court petition and, in July 2026, the parties jointly withdrew the motion to modify the injunction — a de-escalation vs. prior quarters (10-Q p. 51–52). - EU DMA (Play and Search): Preliminary non-compliance findings (March 2025); “cannot reasonably estimate a probable loss” (10-Q p. 52). Accrued legal and regulatory fines/settlements stand at $17.4B (from $15.6B at year-end 2025) (10-Q p. 42, p. 54). Analytical significance: realized costs are climbing ($5.2B paid, $2.1B accrued this quarter), while the DOJ ad-tech structural-remedy risk remains un-modellable.
Subsequent events (10-Q — disclosed within Notes 10–11 and MD&A) Post-June-30-2026 events disclosed: (i) the EU Android ECJ denial (July 2, 2026) and the $5.2B fine-plus-interest cash payment in July 2026 (10-Q p. 49, p. 46); (ii) the PriceRunner decision issued July 2026 (accrued in Q2 2026) and Google’s appeal (10-Q p. 53); (iii) Epic and Google jointly withdrawing the motion to modify the injunction in July 2026 (10-Q p. 52); and (iv) the July-2026 Board declaration of a $12.15/share dividend on each Series A/B mandatory convertible preferred (payable August 15, 2026) and a $0.22/share common dividend (payable September 14, 2026) (10-Q p. 35).
7.5 What Changed This Quarter
sources - Google Cloud profitability inflected. Cloud revenue rose +81.8% to $24,768M and segment operating income tripled to $8,814M, lifting Cloud operating margin to 35.6% from 20.7% a year ago (10-Q p. 40, p. 48). This is the clearest confirmation yet that Cloud can scale into a high-margin business — central to the growth-and-margin thesis. - Cloud backlog more than doubled to $513.9B (of $519.5B total) from $242.8B at year-end 2025 (10-Q p. 22), materially extending forward Cloud revenue visibility — though partly boosted by a Q1-2026 methodology change that now includes short-duration contracts. - Free cash flow turned negative for the first time, -$5,855.0M, as CapEx doubled YoY to $44,924.0M and exceeded OCF of $39,069.0M (10-Q p. 14, p. 52); with 2026 CapEx set to rise further, the equity is now a capital-consumer, changing the FCF profile that underpins valuation. - Capital-allocation pivot from returns to raises. Alphabet executed zero buybacks (vs $28.3B in H1 2025) and instead raised ~$105B in H1 2026 — $56.2B debt (total debt proceeds, of which $51.8B long-term notes), $30.5B common (incl. a $10.0B Berkshire private placement), and $19.0B mandatory convertible preferred — plus a new $40.0B ATM program (10-Q p. 14, p. 34–35). This is dilutive and leverage-adding and signals the build is outrunning internally generated cash. - Reported earnings are dominated by reversible marks. Net income of $112,193.0M and EPS of $9.11 were driven by $99,031M of equity-securities gains in OI&E (mostly unrealized SpaceX and a private company); non-marketable measurement-alternative carrying value reached $124.3B (10-Q p. 27, p. 43). [Rating and price target withdrawn — see the note at the top.] - Off-balance-sheet and contingent obligations scaled sharply: purchase commitments to $811.0B, credit-derivative data-center backstops to $43,785M (from $16,940M), leases-not-commenced to $85.2B, plus a new $20.0B equity-derivative funding commitment (10-Q p. 20, p. 37, p. 54) — raising demand-quality and contingent-liability risk tied to the AI build. - Legal costs began to crystallize: a $5.2B EU Android fine paid in July 2026 and a $2.1B PriceRunner charge accrued in Q2 2026, with accrued fines/settlements at $17.4B; the DOJ ad-tech structural-remedy risk remains unquantified and unreserved (10-Q p. 49, p. 51, p. 53).
7.6 Portfolio Decision
sources [Rating and price target withdrawn — see the note at the top.] The operating results this quarter reinforce the fundamental case: revenue grew +24.2% to $119,796.0M, operating income +30.4% to $40,770.0M, Search & other ads +16.8% and YouTube ads +12.9% confirmed ad resilience, and Google Cloud delivered the thesis-critical inflection — +81.8% revenue growth with segment operating margin expanding to 35.6% from 20.7% and a backlog now above $513.9B. [Rating and price target withdrawn — see the note at the top.] The footnote review adds a crystallizing legal cost ($5.2B Android fine paid, $2.1B PriceRunner accrued, $17.4B accrued fines) and an un-modellable DOJ ad-tech structural-remedy risk. Net: the operating thesis is intact and strengthening, but the FCF, financing, and earnings-quality shifts are material enough to warrant staying invested without adding.
What would change this view: - Upgrade condition: Google Cloud sustains >30% revenue growth with segment operating margin above 35% for two-plus consecutive quarters AND free cash flow returns positive as CapEx growth decelerates — evidence the AI build is converting to durable, cash-generative returns. [Rating and price target withdrawn — see the note at the top.]
Report Versions
Every published version of this report, newest first — each one kept so a reader can see what changed and when.
| Version date | Files |
|---|---|
| 2026-08-19 Current | Model (Excel) |
| 2026-08-03 | Model (Excel) |