
General Dynamics
Section 1 — Business Overview, Operations & Competitive Positioning
sources
1.1 The Business
sources General Dynamics designs, builds and services high-end, long-cycle defense and business-aviation hardware — nuclear-powered submarines and surface warships, land-combat vehicles and munitions, defense-technology products and services, and Gulfstream business jets — and earns its returns by winning multi-year, largely sole-source or duopoly programs and then executing them on fixed-price and cost-reimbursement contracts recognized over their long operating cycles.
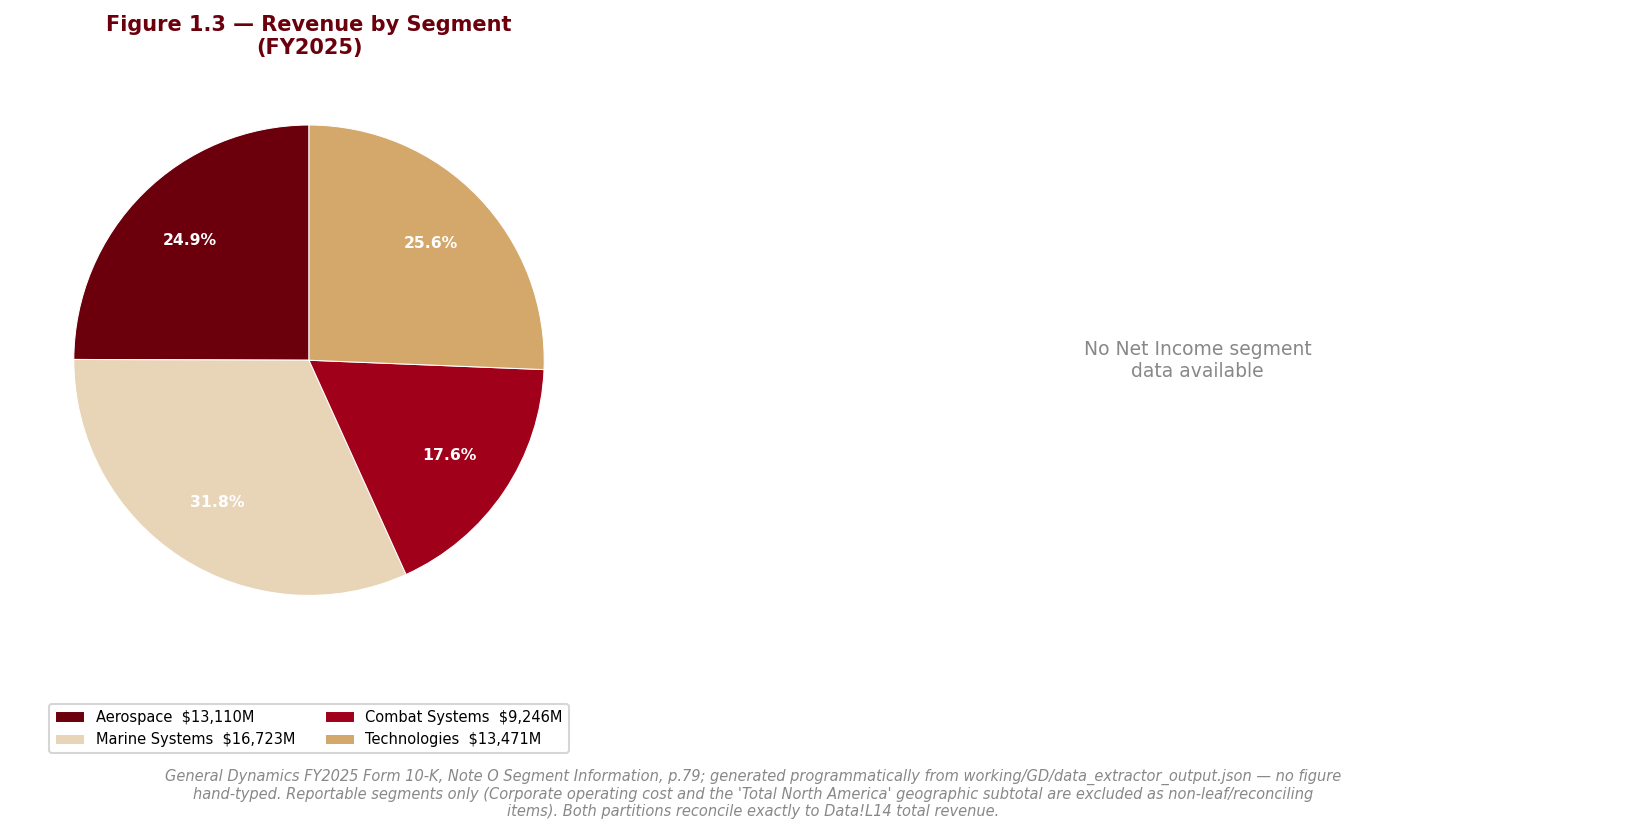
The company reports through four operating segments — Aerospace, Marine Systems, Combat Systems and Technologies, the latter three collectively the defense segments — under a deliberately decentralized model in which each business unit owns its own strategy and results and a lean corporate center sets governance and allocates capital. Revenue is heavily concentrated with the U.S. government, which supplies the large majority of the consolidated total, with the Department of War the primary customer; the balance comes from other U.S. government agencies, U.S. commercial buyers (chiefly business jets) and non-U.S. customers, including sales to foreign governments routed through the Foreign Military Sales program. Most recent full-year revenue was $52,550.0M, generated by a global workforce numbering in the low hundreds of thousands — a highly specialized, partly unionized base whose skilled-labor supply management repeatedly ties to its ability to execute the shipbuilding ramp. The economics are those of an incumbent prime: leadership positions on foundational, decades-long programs convert into durable, visible revenue when the company performs, but production work is largely fixed-price, placing cost-overrun risk on the company. The shares trade on the NYSE under GD.
On the operating evidence the business is executing well: revenue has compounded steadily over the past five years to a record $52,550.0M in FY2025, up from $38,469.0M in FY2021, with all four segments contributing and Marine Systems and Aerospace both ramping into a backlog management describes as a record and materially above the prior year. That strength, however, is largely reflected in the price. [Rating and price target withdrawn — see the note at the top.] The tension that defines the thesis is straightforward — the operating business is performing and the backlog gives multi-year visibility, but the market has already paid for it, and the residual return is asymmetric to the downside once the earnings-quality and tail-risk caveats developed below and in Sections 2, 3 and 6 are attached.
Key Information
| Item | Value |
|---|---|
| Ticker | GD |
| Sector / Industry | Industrials / Aerospace & Defense |
| Report Date | 2026-08-05 |
| Most Recent FY Revenue | $52,550.0M |
| EBIT Margin (Most Recent FY) | 10.2% |
| Diluted Shares Outstanding | 272M |
| Current Price | $385.76 |
Source: Company SEC filings (10-K); see Appendix A.1.
1.2 Operating Segments
sources Aerospace is Gulfstream plus Jet Aviation — the design, manufacture and service of business jets. Its revenue model is distinct from the rest of the company: new-aircraft revenue is recognized at a point in time, when the customer takes delivery of the fully outfitted aircraft, so reported revenue swings with the number and cabin-mix of deliveries in the period, while aircraft services accrue as work progresses. The single economic variable that drives the segment is the mix and cadence of ultra-large-cabin, large-cabin and mid-cabin deliveries, now turning over as the all-new G700 and G800 replace the prior flagship family. Alongside new aircraft, a large and growing installed base feeds a global maintenance, repair and overhaul network and Jet Aviation’s FBO and completions footprint — an annuity that widens as the fleet grows.
Marine Systems — Electric Boat, Bath Iron Works and NASSCO — is the leading designer and builder of nuclear-powered submarines and a critical element of the U.S. defense industrial base. Revenue is recognized over time on a cost-to-cost basis, so period revenue tracks construction volume. The driver is the multi-decade Navy submarine build-up: Electric Boat is prime on both the Columbia-class ballistic-missile boat (carrying the government’s highest acquisition priority) and the Virginia-class attack boat, with Bath building Flight III Arleigh Burke destroyers and NASSCO the auxiliary fleet. This is the growth engine of the defense franchise, but it is capacity- and supply-chain-constrained, and it is also the lowest-margin of the four businesses — the source of the structural margin point developed in 1.6.
Combat Systems — Land Systems, European Land Systems and Ordnance and Tactical Systems — builds wheeled and tracked combat vehicles, weapon systems, energetics and munitions, also over time. Its drivers are vehicle and munitions volume: sole-source production of the Abrams tank and Stryker for the U.S. Army (with the next-generation M1E3 and the optionally-manned XM30 in development), a market-leading international light-armored-vehicle position, and a munitions/propellant business running hot on sustained conflict demand. One large international tracked-vehicle contract inside this segment carries a management-flagged variable-consideration risk that is material enough to surface in the thesis and is detailed in Section 2.
Technologies — GDIT and Mission Systems — provides IT modernization, cyber, cloud and defense electronics across thousands of contracts, none individually material to the segment. Its driver is federal IT and defense-electronics spending. It is the most defensive in composition but the most exposed to the current downside in the federal environment: revenue growth decelerated in FY2025 and management disclosed direct impact from 2025 federal staff reductions, contract terminations, award delays and a government shutdown — relevant both to the mix and to the goodwill sensitivity noted in Sections 2 and 3.
As a system these are a portfolio, not an integrated whole: the decentralized model means synergies are modest and the businesses largely stand alone. The operating flywheel is instead the backlog — long-cycle awards converting into visible multi-year revenue when the company executes — which is genuine and record-high. The fragility is on the margin line rather than the top line: the two fastest-growing areas, Marine Systems and Technologies, are the two lowest-margin, so the same mix shift that drives revenue structurally dilutes group profitability.
1.3 Geographic Exposure
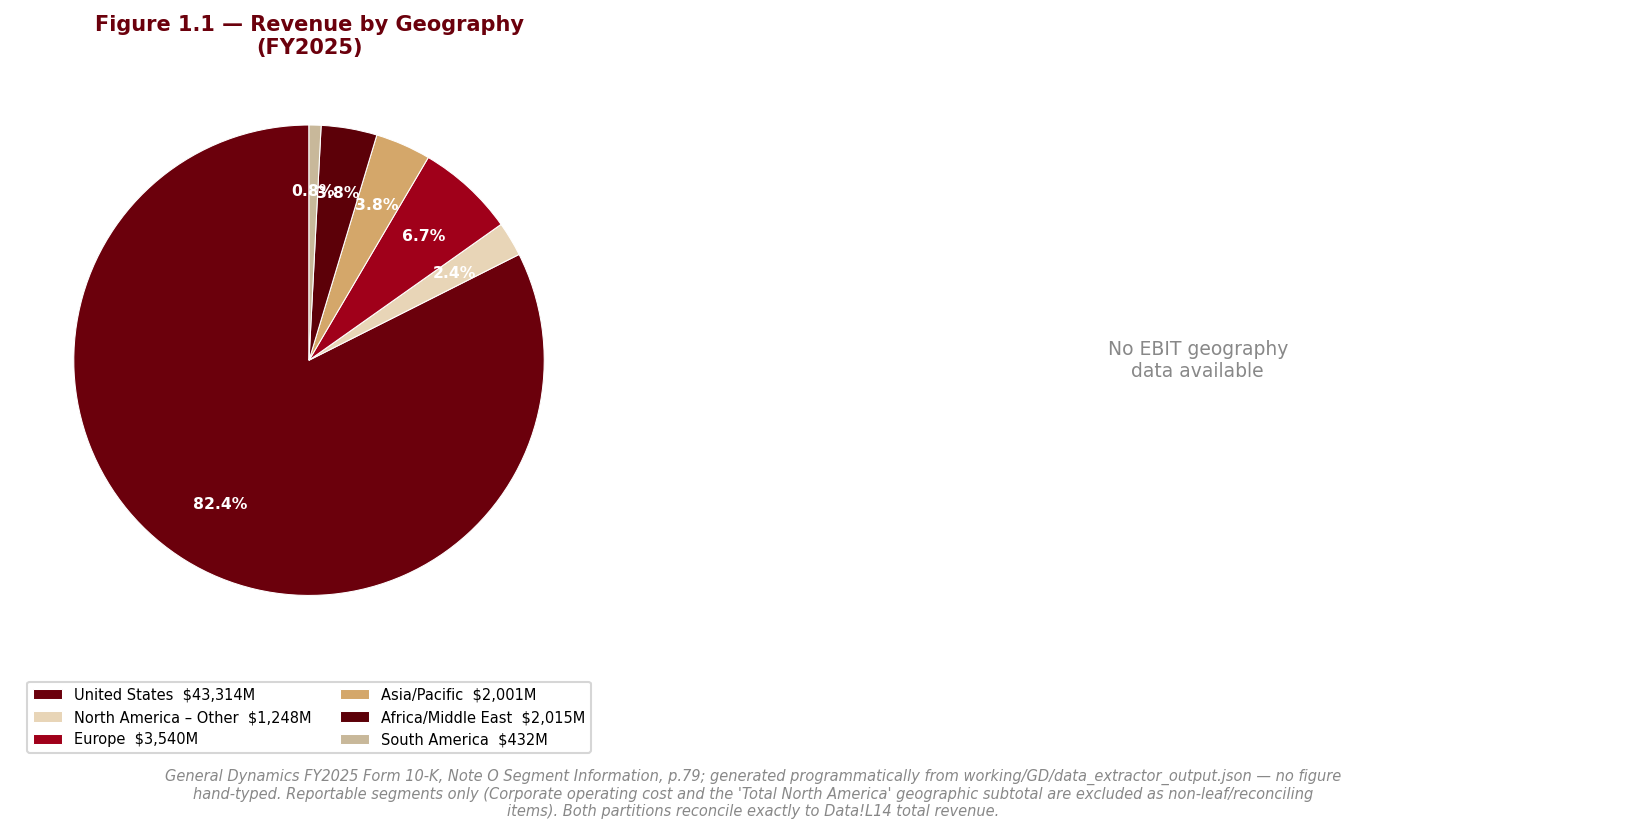
sources The company is overwhelmingly a U.S. business by customer: the large majority of consolidated revenue comes from the U.S. government, with the remainder split among U.S. commercial buyers and non-U.S. government and commercial customers. International exposure is concentrated in two places — Aerospace, where non-U.S. commercial revenue is primarily business-jet exports and worldwide aircraft services and where a meaningful share of the aircraft backlog is held by customers outside North America (even as U.S. customers remain the majority of both orders and backlog), and Combat Systems’ European land businesses, which are seeing elevated demand tied to the regional threat environment. Foreign Military Sales are contracted through and paid by the U.S. government, which absorbs the foreign customer’s collection risk. Currency exposure is modest and hedged, arising chiefly in the Canadian dollar, euro and Swiss franc. The geography-specific operational risks — appropriations and continuing-resolution dependence at home, and offset, export-control and political exposure abroad — are treated in Section 2.
1.4 Management Team
sources The leadership picture this year is one of internal continuity with a visible succession step. The anchor remains long-tenured CEO Novakovic, alongside CFO Kuryea; the notable change is the elevation of Danny Deep to President of the company late in the year, having risen through Global Operations and, before that, Combat Systems and Land Systems — an insider promotion that positions a credible internal successor rather than importing risk from outside. In parallel, Jason Aiken, a former long-serving chief financial officer, now holds an expanded operating role across both Combat Systems and Mission Systems. The bench is therefore deep and home-grown, which suits a business whose competitive edge is program execution over decades. The one item to watch is span of control: concentrating two sizeable, distinct businesses — a defense vehicle-and-munitions segment and a defense-electronics unit — under a single executive is an efficiency bet that raises the cost of a misstep in either. This is a governance watch item, not a concern.
1.5 Capital Allocation Track Record
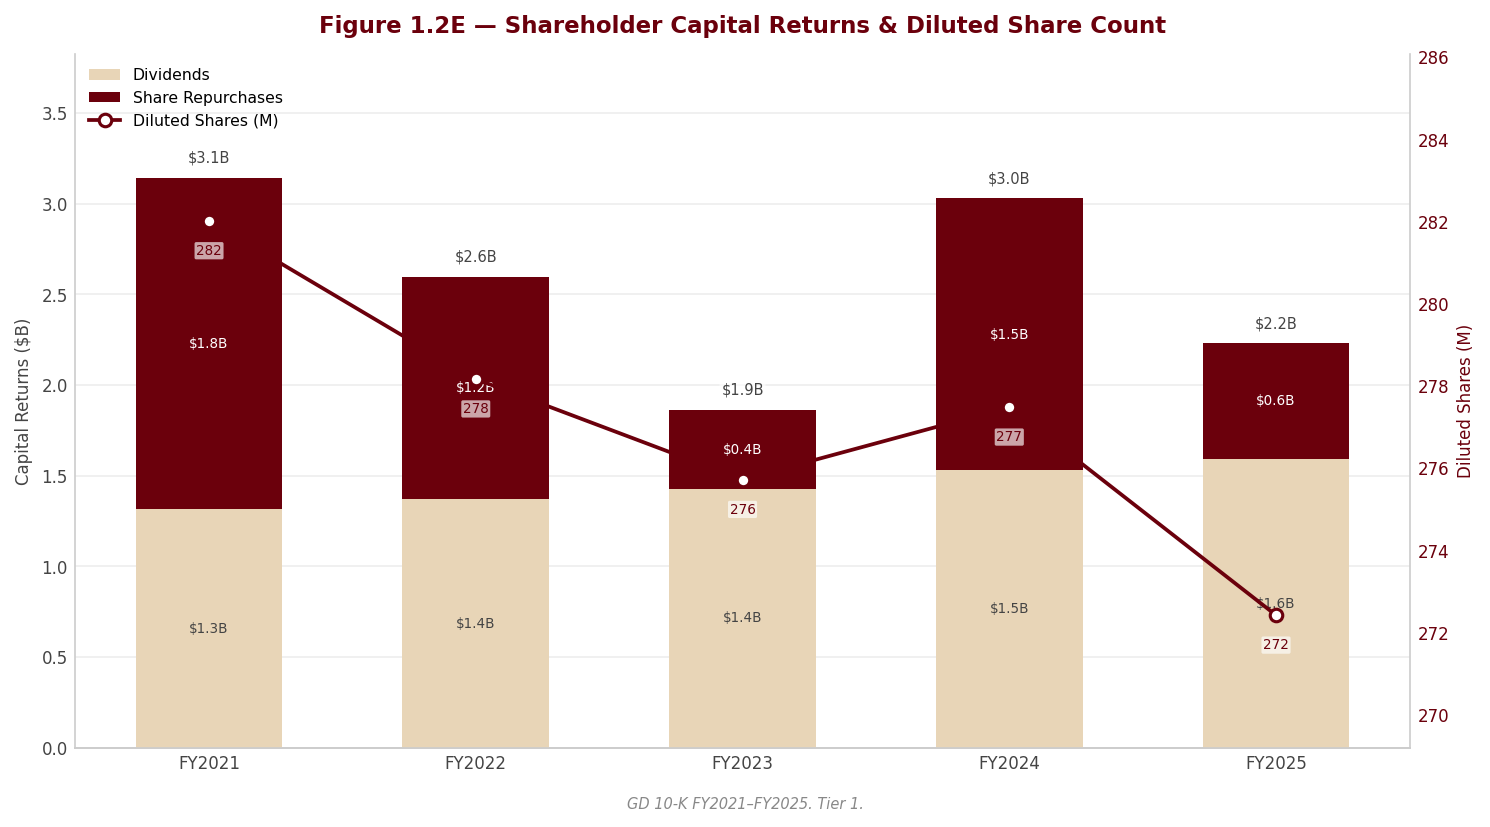
| Year | Dividends Paid ($M) | Share Repurchases ($M) | CapEx ($M) |
|---|---|---|---|
| FY2021 | $1,315.0M | $1,828.0M | $887.0M |
| FY2022 | $1,369.0M | $1,229.0M | $1,114.0M |
| FY2023 | $1,428.0M | $434.0M | $904.0M |
| FY2024 | $1,529.0M | $1,501.0M | $916.0M |
| FY2025 | $1,593.0M | $637.0M | $1,161.0M |
Source: Company SEC filings (10-K); see Appendix A.1.
Management’s stated priorities — reinvestment first, then a predictable dividend, then strategic acquisitions, with buybacks used opportunistically and primarily to offset dilution — are visible in the numbers and signal disciplined confidence rather than financial engineering. The dividend was raised again in FY2025, extending a long, unbroken streak of annual increases, with the payout ratio (37.8%) and total shareholder-return yield (2.4%) both left at levels that leave ample room for reinvestment. Repurchases were sized primarily to cover dilution from vesting and exercises and were well below the prior year’s level — a deliberate step-down that tells you management would rather fund the business than shrink the share count at today’s valuation. That reinvestment is real: capital expenditure stepped up materially to build shipyard capacity for the multi-decade Navy submarine ramp and to expand Gulfstream and munitions facilities, running well ahead of depreciation and therefore representing genuine growth investment rather than mere asset replacement. Read together, the mix is confident but not stretched — capital is flowing into the business and out to shareholders in steady dividends, with buybacks held back rather than used to flatter per-share metrics.
1.6 Competitive Positioning & Moat
sources §1.6.1 Industry structure. Returns in defense contracting accrue to incumbents on foundational, long-cycle programs. The winners are the primes that already hold the position, because the barriers to displacing them are severe: sole-source or duopoly designations on critical platforms, the industrial-base criticality of assets like the submarine yards, security clearances and program heritage, and the capital intensity of the facilities. Once a prime is performing on a decades-long program, the long operating cycle itself becomes the moat — competition happens at the award, not year to year. Business aviation is more contested and more cyclical, competed on aircraft performance, cabin, safety, service and price, but there too an installed base and a renewed product line create switching costs and a services annuity.
§1.6.2 Competitive advantages. General Dynamics’ advantages are concrete and program-specific rather than generic. Electric Boat is prime and lead yard on every Navy nuclear-submarine program, including the top-priority Columbia class — a position no competitor can replicate. Land Systems is the sole-source producer of both the Abrams tank and the Stryker for the U.S. Army, and OTS holds a global lead in large- and medium-caliber ammunition and propellants. Gulfstream has just completed a nearly two-decade renewal of its entire fleet, fielding the longest-range, fastest aircraft in their classes with a large and growing installed base behind them. The clearest single piece of evidence for the moat is the backlog: it grew materially year over year to a record with a defense book-to-bill well above one-to-one and an Aerospace book-to-bill above one even as revenue grew strongly — demand and switching costs made visible.
§1.6.3 Competitive vulnerabilities. The moat protects position, not profitability, and it has real soft spots. Revenue is heavily concentrated in the U.S. government, exposing the company to appropriations timing, continuing-resolution and shutdown risk and to shifts in spending priorities. Roughly half of U.S. government revenue is fixed-price, placing cost-overrun risk on the company at a moment when the shipbuilding supply chain and skilled-labor market are visibly strained. Technologies is directly exposed to the federal IT-spending cuts already biting. The largest unquantified exposure carried through the reporting year — a no-poach antitrust class action against the shipyards seeking trebled damages, which had worsened over 2025 as an appeals court revived a dismissed complaint — has since been extinguished: the plaintiffs dismissed the case against General Dynamics with prejudice in May 2026, so it can no longer be refiled, and as nothing was ever accrued there is no earnings effect — a genuine, if late-breaking, improvement to the risk profile. That leaves the international tracked-vehicle contract in Combat Systems as the remaining live, unquantified tail risk, where management itself warns a shortfall in variable consideration is reasonably possible against a concentrated unbilled receivable unwinding into early 2028 — the one item here flagged RED by the forensic review and detailed in Section 2; the point for positioning is that it is not reflected in the numbers a reader sees.
§1.6.4 Verdict. This is a high-quality, genuinely moated franchise whose margin ceiling has structurally reset lower. The sole-source and duopoly positions are durable and the record backlog is real, but the mix shift toward lower-margin shipbuilding means group operating margin (10.2%) runs structurally below the low-teens the company earned before its portfolio shifted — and the recent improvement should not be read as a return to former profitability. That reading is reinforced by earnings quality: a meaningful slice of FY2025’s operating-earnings growth came from net favorable estimate-at-completion adjustments — well above the prior year’s swing and one of the auditor’s two critical audit matters, disclosed only on a net basis — so the margin gain is not clean operating leverage and should be discounted accordingly, as Section 3 develops. [Rating and price target withdrawn — see the note at the top.] Full risk and valuation treatment follows in Section 2.
Section 2 — Key Risks & Catalysts
sources
2.1 Downside Risks
sources This section’s risk assessment is stated as of General Dynamics’ most recent interim filing — the Q2 FY2026 10-Q, for the quarter ended July 5, 2026 — rather than the FY2025 10-K on which the rest of this report is built. The distinction is material and deliberate: the single most consequential risk carried in the annual filing, an antitrust no-poach class action, was dismissed with prejudice against the company after year-end and is therefore no longer a live exposure (it is retained, de-escalated, as Risk 5 below to record that a genuine unquantified risk existed at the 10-K date and how it was extinguished). A reader comparing this section to the annual filing should understand that the difference reflects a real, subsequent improvement in the risk profile, not a change of view on the same facts.
On the current information, General Dynamics’ dominant risks are estimation and contingency risk on long-cycle contracts and policy risk on its U.S.-government customer, not operational or financial-leverage risk; the balance sheet is sound and liquidity is not in question. One item below is graded RED — a single Combat Systems contract whose variable-consideration estimate management itself flags as reasonably possible to fall short with a material unfavorable impact, and which is only partially de-risked in the reported numbers. The remainder are the structural exposures of a U.S. defense prime, made specific to this company and this moment.
Risk 1 — International tracked-vehicle contract: management-flagged “material unfavorable” variable-consideration risk (RED)
sources With the antitrust matter resolved after year-end (Risk 5), this is now the primary risk in the file. Within Combat Systems, a large, long-term contract with an international customer for tracked vehicles carries estimated revenue that includes variable consideration management explicitly warns may not be realized. In its own words: “We have a large, long-term contract with an international customer for tracked vehicles in which our estimates for contract revenue include variable consideration. It is reasonably possible that the actual amount of variable consideration realized could be less than our estimate, which could have a material unfavorable impact on our results of operations.” (Note B — Revenue, Contract Estimates, p.61). The reason this is not academic is that revenue and profit have already been recognized over time on those estimates, and the same contract carries a large, concentrated net unbilled receivable balance — the accrued, not-yet-billed portion — that is expected to decline materially only as deliveries run through early 2028 (Note F — Unbilled Receivables, p.68). If the variable consideration proves too high, the company would face the double hit of a receivable write-down and a negative estimate-at-completion catch-up flowing straight through Combat Systems earnings; concentration in a single contract removes any portfolio cushion. The concentration is sharpened by a year-over-year disclosure change: the prior-year filing named two contracts carrying this variable-consideration warning (the U.S. Navy Virginia-class submarines and the tracked vehicles), whereas the FY2025 filing names the tracked-vehicle contract alone (Note B, p.61 versus the prior-year note) — most likely a favorable resolution on the submarine side, but it leaves the remaining named estimation risk resting on this one contract. This risk is the more pointed because it is corroborated independently: KPMG identified the estimates used to recognize revenue on select long-term defense contracts as one of its two critical audit matters. As a linked watch item, the quality of the current year’s earnings is relevant here — net favorable estimate-at-completion catch-up adjustments contributed a meaningful share of the year’s operating-earnings growth, close to triple the prior-year swing, and are disclosed only on a net basis with no gross favorable/unfavorable split (developed in Section 3); estimate releases of that size can reverse, and this is exactly the contract where management has told us they might.
Probability: Medium | Timeframe: Immediate to 1–2 years (unbilled balance unwinds through early 2028) | Quantified potential impact: Not sized by management, but a shortfall would hit Combat Systems revenue, margin and the concentrated unbilled receivable simultaneously — a “material unfavorable impact” on the company’s own characterization.
Risk 2 — U.S.-government customer concentration and appropriations / continuing-resolution / shutdown risk
sources The large majority of consolidated revenue comes from the U.S. government, with the Department of War the primary customer — a concentration that makes federal budget mechanics a first-order risk rather than a macro footnote. Government contracts are not always fully funded at inception; the annual appropriations process can be delayed or disrupted, and when a budget is not enacted by the start of the fiscal year, parts of the government shut down or operate under a continuing resolution at prior-year levels, stalling program funding and — just as damaging for a backlog-conversion story — the timing of new awards. This is not hypothetical for General Dynamics: management disclosed that it entered the new fiscal year with the government operating under a continuing resolution with a near-term expiration, and that its outlook assumes the budget is approved without significant delay or another prolonged shutdown. The mechanism that turns this into earnings risk is straightforward — because Congress appropriates on a fiscal-year basis while contract performance spans years, future revenue on multi-year programs is conditioned on continuing appropriations, and any lapse or reprioritization can reduce program funding and content. It would materialize on a failed appropriations round, a prolonged shutdown, or a shift in spending priorities away from the company’s platforms. §
Probability: Medium-High (a near-term CR expiration is disclosed) | Timeframe: Immediate | Quantified potential impact: Not directly sized; a prolonged shutdown or funding lapse would slow revenue recognition and award timing across the defense segments, with the effect concentrated first in the services businesses.
Risk 3 — Technologies goodwill concentration on a stale quantitative test, in the segment most exposed to federal cuts
sources The company’s largest single goodwill block sits in the Technologies reporting unit — the majority of total goodwill and a sum equivalent to a large fraction, well over half, of total shareholders’ equity — and this unit has been impaired before. The concern is not the existence of the goodwill but the freshness of the support for it: the last quantitative fair-value test on Technologies was performed in the fourth quarter of 2022, at which point management states fair value exceeded carrying value by only a limited margin, and every year since has relied on qualitative assessment alone, with the same headroom description repeated verbatim. Management’s disclosure is precise about the vintage: it states the Technologies reporting unit’s estimated fair value exceeded its carrying value only modestly at the time of its last quantitative assessment in the fourth quarter of 2022; its qualitative assessments this year presented no indicators of impairment (Note A / Note H — Goodwill; Critical Accounting Policies, p.59). That measurement should be read as a three-year-old figure, not a current one — and it describes the very segment now under the most adverse demand pressure: revenue growth decelerated, margin edged down, 2026 margin is guided lower, and management disclosed direct impact from 2025 federal staff reductions, contract modifications and terminations, award delays and a government shutdown that fell largely on the IT services business. Given the block’s size relative to equity, even a modest impairment would be material to book value and reported earnings. It would materialize if federal IT-spending cuts persist and a fresh quantitative test — which we would press management to run — comes in below the stale cushion.
Probability: Low-Medium (no impairment indicated to date; the demand backdrop is deteriorating) | Timeframe: 1–2 years | Quantified potential impact: A non-cash impairment would flow through earnings and book value; the exposure is large relative to equity, so the sensitivity is material even for a partial write-down.
Risk 4 — Fixed-price execution amid strained shipyard supply chains, skilled-labor scarcity, a single-source airframe disruption, and tariffs
sources Roughly half of U.S. government revenue is fixed-price, which places cost-overrun risk squarely on the company at precisely the moment its cost environment is most stressed. Three specific pressures converge. First, the multi-decade Navy submarine ramp is running into a shipbuilding supply chain management describes as strained by post-pandemic demographic and capacity issues, and into a skilled-labor market where demand for specialized shipyard workers can exceed supply — management repeatedly ties execution of the shipbuilding build-up to its ability to attract, train and retain those people, and warns that where it relies on only one or two sources of supply, disruption could impair its ability to meet commitments. Second, Aerospace’s ramp of the new Gulfstream family has been held back by residual supplier delays, including at an Israel-based supplier of mid-cabin airframes affected by the regional conflict — a single-source geopolitical exposure sitting directly on the delivery cadence that drives Aerospace revenue recognition. Third, tariffs and inflationary pressures modestly reduced Aerospace operating margin during the year; management states tariffs have not been material to date but that their duration and extent continue to evolve. Separately, the company carries a multi-billion-dollar book of off-balance-sheet letters of credit, bank guarantees and surety bonds in the ordinary course, and some Gulfstream customers hold options to trade in aircraft at a guaranteed value — a contingent, market-sensitive exposure that a downturn in the pre-owned business-jet market could turn from immaterial into a reduction of new-aircraft revenue. Any of these turns a fixed-price contract from a margin into a loss; the risk materializes through cost growth, schedule slip on a constrained input, or a jet-market downturn.
Probability: Medium (these are active, disclosed frictions, not tail events) | Timeframe: Immediate to 1–2 years | Quantified potential impact: Not individually sized; on fixed-price work, cost growth is absorbed by the company and compresses segment margin directly, with the submarine ramp and Aerospace delivery cadence the two most exposed lines.
Risk 5 — Antitrust “no-poach” class action: a material unquantified exposure at the annual-filing date, resolved after year-end (dismissed with prejudice)
sources At the FY2025 10-K date this was the single most important risk in the file, and it is retained here — rather than deleted — because a reader must understand both that a genuine, material, unquantified exposure existed through the reporting year and how it has since been resolved. A putative Sherman Act class action alleged that General Dynamics and certain subsidiaries conspired with other companies not to solicit each other’s naval architects and marine engineers, suppressing their compensation; the plaintiffs sought to represent a broad class over many years and demanded trebled monetary damages. The matter escalated during 2025: on May 9, 2025 the Fourth Circuit reversed the District Court’s dismissal and remanded the case, and on September 11, 2025 the defendants petitioned the U.S. Supreme Court for certiorari — at which point management stated it could not estimate a range of reasonably possible loss yet conceded a possible material impact, and, critically, no accrual was ever recorded. The status has since changed decisively: on May 18, 2026 the plaintiffs dismissed the case against General Dynamics and its subsidiaries with prejudice, meaning it cannot be refiled against the company (GD Q2 FY2026 10-Q, Commitments and Contingencies, p.19). The financial consequence is symmetric and clean: because nothing was ever accrued, the extinguishment produces no charge and, equally, no gain or reserve release — it removes a tail risk from the reported picture without moving reported earnings in either direction. This is a genuine improvement in the risk profile relative to the annual filing, and it is the principal reason this section’s risk assessment differs from the FY2025 10-K. We flag it, without overstating it, as a de-risking event rather than a source of upside. §
Probability: Resolved (dismissed with prejudice as to General Dynamics) | Timeframe: Extinguished after year-end | Quantified potential impact: None going forward; the exposure was never accrued, so its resolution has no profit-and-loss effect in either direction.
2.2 Upside Catalysts
sources The catalyst set is genuinely favorable, and the risk profile improved after year-end with the dismissal of the antitrust matter; even so, the remaining RED contingency — the tracked-vehicle variable-consideration estimate — is unquantified and only partially de-risked in the reported numbers, and most of the catalysts below are already visible in a record backlog and therefore substantially priced. We present four catalysts and judge the overall balance as roughly symmetric rather than clearly positive, and we do not manufacture a longer list for false balance.
Catalyst 1 — Backlog conversion and sustained book-to-bill
sources The clearest support for the forward numbers is the record backlog, materially above the prior year, with a defense book-to-bill well above one-to-one and an Aerospace book-to-bill above one even as revenue grew strongly. This is the operating flywheel: long-cycle awards converting into visible, multi-year revenue as the company executes. It matters because it de-risks the top line for years and shows up as steady revenue recognition and continued backlog coverage; management expects to recognize a substantial share of remaining performance obligations as revenue in the coming year. It is the most durable catalyst precisely because it is order-driven rather than a definitional artifact.
[Rating and price target withdrawn — see the note at the top.]
Catalyst 2 — Gulfstream certification and delivery cadence
sources Aerospace has just completed a nearly two-decade renewal of the entire Gulfstream family, with the G800 recently entering service after certification and the G700 the year before, and the G400 and announced G300 still to come. The catalyst is the delivery ramp and the associated margin lift: because new-aircraft revenue is recognized at delivery and new models carry lower margins early in their production lots before improving down the learning curve, a clean acceleration of ultra-large-cabin deliveries — combined with the drop in R&D that follows completed certification — expands both Aerospace revenue and margin, as it began to this year. It materializes as delivery counts rise and the mid-cabin airframe supply constraint eases.
Probability: Medium-High | Timeframe: 1–2 years | Monitoring trigger: Rising quarterly aircraft deliveries and cabin mix, FAA/international certification milestones on the G400 and G300, and resolution of the Israel-based airframe supply delay.
Catalyst 3 — Submarine build-rate progress
sources The multi-decade Navy submarine build-up — Columbia-class (the government’s highest acquisition priority) and Virginia-class, both prime to Electric Boat — is the structural growth engine of the defense franchise, evidenced this year by large combined Navy submarine awards feeding the record backlog. [Rating and price target withdrawn — see the note at the top.] It is real but capacity- and supply-chain-gated, which is why it is a catalyst and a risk at once. §
Probability: Medium (execution- and supply-chain-dependent) | Timeframe: 3–5 years | Monitoring trigger: Delivery-schedule adherence on Columbia and Virginia boats, Marine Systems margin trend, and evidence the shipyard workforce and supplier base are scaling as planned.
Catalyst 4 — Capital returns and a supportive federal budget outcome
sources Capital returns provide a steady, lower-variance catalyst: the dividend was raised again this year, extending a long, unbroken streak of annual increases, and repurchase authorization remains, with buybacks currently sized only to offset dilution — leaving optional upside if management chooses to lean in. Layered on top is the two-sided federal budget swing factor: management’s guidance publicly notes administration support for further defense-spending increases in an upcoming fiscal year, so a clean appropriations outcome with higher defense funding would convert directly into award activity — the mirror image of Risk 2. We treat this as a catalyst only conditionally, because the same variable is a downside risk if the budget stalls.
Probability: Medium | Timeframe: Immediate to 1–2 years | Monitoring trigger: Continued annual dividend increases and any step-up in buyback activity above dilution coverage; enactment of appropriations without a prolonged shutdown and with defense funding at or above expectation.
2.3 Risk & Catalyst Summary
| # | Item | Type | Probability | Timeframe | Status | Monitoring Trigger |
|---|---|---|---|---|---|---|
| 1 | International tracked-vehicle contract variable-consideration shortfall | Risk | Medium | Immediate–2 yrs | Active | Unbilled receivable unwind through early 2028; any negative EAC catch-up or write-down |
| 2 | U.S.-government concentration / appropriations / CR / shutdown | Risk | Medium-High | Immediate | Active | Appropriations enactment; CR expiration; award-timing slippage |
| 3 | Technologies goodwill on a stale 2022 quantitative test | Risk | Low-Medium | 1–2 yrs | Monitoring | Fresh quantitative impairment test; Technologies revenue/margin trend |
| 4 | Fixed-price execution: shipyard supply chain, skilled labor, airframe supplier, tariffs | Risk | Medium | Immediate–2 yrs | Active | Cost/schedule performance; airframe supply resolution; tariff scope |
| 5 | Antitrust no-poach class action (dismissed with prejudice after year-end) | Risk | Resolved | Extinguished | Resolved | None required; recorded for completeness and prior-period comparability |
| 6 | Backlog conversion and sustained book-to-bill | Catalyst | High | Ongoing | Active | Book-to-bill above one-to-one; backlog holding at record |
| 7 | Gulfstream certification and delivery cadence | Catalyst | Medium-High | 1–2 yrs | Active | Rising deliveries and cabin mix; G400/G300 certification |
| 8 | [Rating and price target withdrawn — see the note at the top.] | Catalyst | Medium | 3–5 yrs | Monitoring | Columbia/Virginia schedule adherence; Marine margin recovery |
| 9 | Capital returns and supportive federal budget outcome | Catalyst | Medium | Immediate–2 yrs | Active | Dividend increases; buyback step-up; clean appropriations |
Source: Company SEC filings (FY2025 10-K and Q2 FY2026 10-Q) and forensic footnote review; see Appendix A.1.
2.4 Risk Interdependencies
sources These risks are not independent draws; several share a common root in the U.S. federal budget and in long-term-contract estimation, and it is their correlation that makes them dangerous. The post-year-end dismissal of the antitrust matter (Risk 5) actually lightens the interdependency load — that exposure had drawn on the same scarce, specialized shipyard-labor pool at the center of the fixed-price execution risk, so its removal severs one linkage — but the remaining ties are real. The tightest is between Risk 1 and the earnings-quality watch item behind it: the tracked-vehicle variable-consideration warning and the net favorable estimate-at-completion releases that padded this year’s operating-earnings growth are the same phenomenon viewed from two sides — reliance on management estimates on long-cycle contracts. A reversal on the flagged contract would not only cut Combat Systems revenue and its concentrated unbilled receivable; it would arrive precisely as the favorable-estimate tailwind that flattered the prior year turns, so the swing would be doubly visible. A second cluster ties Risk 2 to Risk 3: a prolonged shutdown or appropriations failure would land first and hardest on the services businesses, which is exactly where the Technologies goodwill sits — a sustained federal IT-spending contraction could simultaneously depress Technologies revenue and undermine the stale 2022 fair-value cushion supporting its goodwill, turning a policy event into a book-value impairment. A third link ties Risk 2 to Risk 4: the same budget stress that slows funding also tightens the environment in which fixed-price programs must absorb cost growth, so a weak appropriations outcome and an already-strained shipyard supply chain would compound. The disproportionately damaging scenario is the simultaneous one — a stalled budget that hits Technologies and its goodwill test while an adverse turn on the tracked-vehicle contract coincides with the reversal of this year’s favorable estimate releases — because each of those items is either unaccrued or only lightly cushioned today, so their combined arrival would strike earnings and book value at once, from items a reader of the headline numbers cannot currently see.
2.5 ESG & Regulatory Exposure
sources The governance and social profile is, on the disclosed evidence, clean at the structural level. On governance, General Dynamics is widely held with no controlling shareholder, KPMG issued an unqualified opinion on both the financial statements and internal control over financial reporting, and a full read of the footnotes surfaced no material related-party transactions in the 10-K — the remaining Item 13 relationship detail resides in the not-yet-filed 2026 proxy and should be reviewed there. The one social/governance matter that was genuinely live at the annual-filing date — the no-poach antitrust action, an allegation of coordinated suppression of skilled employees’ pay — has since been dismissed with prejudice against the company (Risk 5), removing it as an active exposure; what remains, and is not resolved by that dismissal, is the underlying human-capital dependency itself: a partly unionized, highly specialized workforce whose availability management repeatedly ties to execution of the shipbuilding ramp, so labor relations and skilled-labor supply remain a material social factor, not a boilerplate one.
On the regulatory side, the operative framework is the one that governs any prime: U.S. government contracts are subject to the Federal Acquisition Regulation and Cost Accounting Standards and to routine audits of cost, performance, internal controls, purchasing, estimating and accounting systems, where an adverse finding can bring delayed or non-reimbursed costs, penalties, and — at the extreme — suspension or debarment from government business. Aerospace adds a distinct regulatory gate: each new Gulfstream model must earn a type certificate and each aircraft a certificate of airworthiness, making certification timing a direct control on new-aircraft introductions and on the Aerospace catalyst above. Environmentally, the company retains a climate-change risk factor — noting that carbon pricing, stricter emissions limits or shifting demand and reputational patterns could raise costs and capital expenditure — while its site remediation and compliance costs are largely recoverable as allowable costs under U.S. government contracts, and management judges its reasonably-possible additional environmental loss beyond amounts recorded not to be material. Cybersecurity is a standing, filing-specific exposure given the classified and sensitive systems the company designs and manages: management discloses it has experienced incidents that were not material to date but warns that a future breach could challenge its eligibility for sensitive or classified work — a reputational and revenue risk unique to a cleared defense contractor.
Section 3 — Financial Analysis & Historical Performance
sources
Three-Statement Linkage Confirmation (verified against the FL model before writing): - Net Income ties (Income Statement → Cash Flow Statement): Confirmed. Reported net earnings of $4,210.0M on the Consolidated Statement of Earnings is the identical figure that opens the operating-cash-flow reconciliation; the two statements articulate without adjustment. - Cash ties (Balance Sheet → Cash Flow Statement): Confirmed. Year-end cash and equivalents of $2,333.0M on the balance sheet equals the ending cash balance carried by the Statement of Cash Flows. - Retained Earnings reconciliation (Beg RE + NI - Dividends = End RE): Confirmed to within a modest residual. Opening retained earnings of $41,487.0M plus net earnings of $4,210.0M less dividends of $1,593.0M reconciles to closing retained earnings of $44,080.0M; the small residual is consistent with the ordinary difference between dividends declared (which reduce retained earnings) and dividends paid (the cash-flow figure), and with other routine equity movements. No linkage break.
A presentation caveat governs the historical series and is developed in 3.1B: General Dynamics re-presented its operating-earnings subtotal following a Q4-2020 pension accounting-principle change. FY2018–FY2025 are stated on the restated basis and are mutually comparable; FY2016–FY2017 remain as originally reported and are not strictly comparable to them; FY2015 carries headline figures only. Net earnings, tax, interest and EPS are unaffected on either basis — only the operating subtotal moved.
3.1A Income Statement
Source: GD FY2025 Form 10-K, Consolidated Statement of Earnings. Tier 1. YoY growth rates, margins and EBITDA are analyst-computed (underlined).
CAGR Summary
| Metric | 3Y CAGR | 5Y CAGR | 10Y CAGR |
|---|---|---|---|
| Revenue | 10.1% | 6.7% | 5.2% |
| EBITDA | 7.2% | 4.6% | - |
| Net Income | 7.5% | 5.9% | 3.3% |
| Diluted EPS | 8.2% | 7.0% | 5.2% |
| FCF | 4.5% | 6.5% | - |
Source: Company SEC filings (10-K); figures per the FL model — see Appendix A.1–A.2.
3.1B Income Statement — Analysis
sources The revenue story — a genuine, order-backed acceleration, not a price illusion. General Dynamics grew revenue to a record $52,550.0M in FY2025 from $38,469.0M in FY2021, and the shape of that path is the important part. Growth was low-single-digit early in the window — 1.4% in FY2021 and 2.4% in FY2022 — before inflecting sharply to 7.3%, 12.9% and 10.1% across FY2023–FY2025. [Rating and price target withdrawn — see the note at the top.] Crucially for a defense prime, this is volume, not price: revenue in three of the four segments is recognized over time on a cost-to-cost basis, so reported growth tracks physical construction and delivery volume rather than pricing, and management attributes the acceleration to double-digit growth in both Aerospace and Marine Systems. It is also order-backed rather than pulled forward — backlog closed the year at a record, materially above the prior year, on genuine awards (large combined Virginia- and Columbia-class submarine awards, sizeable international vehicle awards and strong Gulfstream order activity). Our forensic review confirms the backlog definition and segment composition are unchanged year over year, so the growth is not a definitional artifact.
The margin trajectory — stabilisation at a structurally lower level, not a recovery. This is the single most important interpretive point in the section, and it is easy to get wrong. EBIT margin sits at 10.2% in FY2025 and has held in a tight band around 10.2% across the whole FY2021–FY2025 window (10.8%, 10.7%, 10.0%, 10.1%, 10.2%) — visibly below the 13.7% recorded as recently as FY2017. This step-down is structural mix, not operational deterioration, and part of the apparent break is a presentation change that must be disclosed rather than read as a decline. Two things happened around 2018. First, General Dynamics changed the presentation of its operating-earnings subtotal following a Q4-2020 pension accounting-principle change; FY2018 onward in this model are stated on the restated basis and are fully comparable with one another, whereas FY2016–FY2017 remain as originally reported and are not strictly comparable — so the optical FY2017→FY2018 margin step should not be read as an operating collapse. Second, and more durably, the revenue mix shifted decisively toward lower-margin shipbuilding: Marine Systems is now the largest segment by revenue, and its long-cycle, cost-to-cost submarine construction carries structurally thinner margins than the legacy business. The steady erosion of gross margin — from 16.7% in FY2021 to 15.1% in FY2025 — is the same mix effect visible one line higher. The correct framing for a portfolio manager is therefore stabilisation at a lower structural level: the FY2024→FY2025 tick up from 10.1% to 10.2% is a modest, mix- and efficiency-driven firming, not the beginning of a march back toward former double-digit-teens profitability, which the current revenue mix will not support.
Major Movers.
-
Aerospace ramp and self-help (structural). The clearest positive driver. Additional G700 deliveries and initial G800 deliveries — largely offsetting the wind-down of the prior flagship — lifted manufacturing revenue, while a larger installed base drove services. Margin benefited from a richer ultra-large-cabin delivery mix and from lower R&D expense as G800 certification completed. This is largely structural: new-program margins improve as production efficiencies are realised and certification spend rolls off, so the direction of travel here supports the group EBIT margin of 10.2%. The offset to monitor is that management notes tariffs modestly reduced Aerospace margin during the year.
-
Marine Systems volume — the growth engine and the structural margin anchor. Revenue rose primarily on increased Virginia- and Columbia-class submarine volume. This is the business driving the top-line acceleration, but it is also the lowest-margin of the four, which is precisely why revenue can grow double-digit while consolidated EBIT margin stays anchored near 10.2%. Margin here improved year over year because the prior year had absorbed the unfavourable impact of supplier cost growth — a genuine operational tailwind as that 2024 drag annualised out.
-
Combat Systems — international demand, favourable mix, but the estimation-risk contract sits here. Revenue rose modestly on higher munitions/propellant output and higher international wheeled- and tracked-vehicle volume in Europe, partly offset by lower U.S. vehicle revenue (the M10 Booker termination and lower Stryker volume, part-offset by higher XM30). Operating margin improved on favourable program mix. The quality caveat belongs here and is developed below: one large international tracked-vehicle contract inside this segment carries the RED-flagged variable-consideration risk.
-
Net favourable estimate-at-completion (EAC) adjustments (temporary — quality caveat, see below). A portion of the year’s operating-earnings growth came from a larger net favourable cumulative catch-up on contract estimates rather than current-period operational performance. This is a durability qualifier on the margin firming, not an operational driver, and is quantified in the quality-of-earnings discussion.
-
Technologies deceleration (structural headwind). Revenue grew only modestly and segment margin edged down, with 2026 margin guided lower. Management disclosed direct impact from 2025 federal staff reductions, contract terminations, award delays and a government shutdown, largely in the IT services business. This is the one segment leaning against the group, and it is the reason the goodwill sensitivity flagged in Section 2 matters.
Below the operating line, the story is clean. Interest expense has been broadly stable at $402.0M as debt has fallen (developed in 3.2B), and — because deleveraging held EBIT growth ahead of interest — interest coverage has risen to 13.3x from 9.7x over the window. [Rating and price target withdrawn — see the note at the top.] Net income reached $4,210.0M and diluted EPS $15.45, the latter flattered further by a steadily shrinking share count (272M, down from 282M): 5-year EPS CAGR of 7.0% sits above the 5-year net-income CAGR of 5.9%, the buyback wedge.
Quality of earnings. Three points, weighted by materiality. First, and most important for FY2025: net favourable EAC cumulative catch-up adjustments contributed a meaningful share of the year’s operating-earnings growth — close to triple the prior-year swing and a meaningful share of the total operating-earnings increase — and General Dynamics discloses only the net figure, with no split between gross favourable and gross unfavourable catch-ups. This is one of KPMG’s two critical audit matters. The read-through is that a portion of the FY2025 margin firming reflects a larger net estimate release rather than current-period execution, and releases of this size can reverse — a risk that is not academic given that the RED-flagged tracked-vehicle contract (Section 2) is exactly where management has told us its variable-consideration estimate could prove too high. We would treat the underlying, EAC-adjusted margin as modestly below the reported 10.2%. Second, the comparability of the operating line is intact: our forensic review confirms the non-service pension/OPEB component continues to sit below operating earnings in “Other, net,” with no new accounting-principle change in FY2025 — so operating earnings are being neither flattered nor depressed by a pension reclassification. Third, the disclosure change on Marine Systems is a mild positive: the prior-year filing named two contracts carrying the variable-consideration warning (Virginia-class submarines and the tracked vehicles); this year names the tracked-vehicle contract alone, most likely signalling a favourable resolution on the submarine side, consistent with the segment’s margin improvement.
⚠ Items to Watch. (1) If consolidated EBIT margin falls back below 10.0% — the low of the recent band — it would signal that the Aerospace/Marine mix and efficiency tailwinds have exhausted and the shipbuilding drag is winning, and would require re-basing our operating-leverage assumptions. (2) If net favourable EAC adjustments continue to rise as a share of operating-earnings growth, or reverse to net unfavourable, treat the reported margin as lower quality and haircut it accordingly. (3) A negative catch-up on the tracked-vehicle contract would hit Combat Systems margin and the concentrated unbilled receivable simultaneously (3.2B).
3.2A Balance Sheet
Source: GD FY2025 Form 10-K, Consolidated Balance Sheet. Tier 1. Net debt, ratios and book value per share are analyst-computed (underlined).
3.2B Balance Sheet — Analysis
sources Asset composition — goodwill-heavy, moderately capital-intensive, and increasingly inventory-weighted. The defining feature of General Dynamics’ balance sheet is the size of its intangible base: goodwill and intangibles of $21,009.0M against total assets of $57,249.0M and shareholders’ equity of only $25,622.0M — i.e., goodwill exceeds book equity. This is the residue of the acquisition-built defense franchise (chiefly the CSRA-era build-out of Technologies), and it is the reason the goodwill concern is a balance-sheet issue as much as a segment issue: as detailed in Section 2, the majority of that goodwill sits in Technologies on a three-year-stale Q4-2022 quantitative test, in the segment now under the most federal-spending pressure — an impairment there would land directly on the $25,622.0M equity base. We do not restate the goodwill risk here; we flag that its materiality is amplified precisely because equity is thin relative to it. Beyond goodwill, the operating balance sheet is moderately capital-intensive — PP&E has grown to $7,525.0M from $5,417.0M as the shipyards invest in capacity for the submarine ramp — and increasingly inventory-weighted: inventory has climbed to $9,232.0M from $5,340.0M, overwhelmingly Aerospace work-in-process as Gulfstream builds ahead of the G700/G800 delivery cadence. That inventory build is a growth signal, not a warning, but it is the swing item in working capital and warrants the monitoring below.
Leverage trajectory — a multi-year, deliberate deleveraging that is now essentially complete. This is one of the clearest positives in the financial profile and it is consistent with management’s stated capital-allocation priority of returning the balance sheet to strength post-CSRA. Total debt has fallen every year, to $8,013.0M in FY2025 from $11,495.0M in FY2021, while equity has risen to $25,622.0M. The two effects compound in the ratios: net debt is down to $5,680.0M, net-debt/EBITDA has collapsed to 0.9x from 2.0x, and debt/equity has more than halved to 0.3x from 0.7x. With net-debt/EBITDA now at 0.9x, General Dynamics has meaningful balance-sheet capacity that it is not using — a source of optionality for buybacks, M&A or accelerated shareholder returns. Our forensic review of the debt note finds no maturity wall (only a modest slice is current, which management intends to refinance), substantial committed, undrawn credit facilities, no commercial paper outstanding, and full covenant compliance. The single, disclosed sensitivity is refinancing cost: the near-term maturities and any new issuance refinance at higher coupons, which management guides will lift 2026 net interest expense — a modest earnings headwind, not a solvency question. There are no covenant concerns in the forensic memo.
Working capital — genuinely improving, with one concentrated caveat. The cash conversion cycle has behaved well through the ramp. Receivables have actually fallen to $2,406.0M even as revenue grew double-digit, driving days-sales-outstanding sharply lower to 19 days from 29 days — the opposite of the receivables-outpacing-revenue pattern that would flag aggressive revenue recognition, and a genuine positive on collections. Days-payable has also come down (to 25 days from 35 days), so the net cash-conversion-cycle improvement to 72 days is more modest than DSO alone suggests, and the cycle remains long — characteristic of a long-cycle manufacturer carrying large inventory. The one caveat is concentration, not aggregate deterioration: as developed in Section 2 and tied to the FY2025 EAC discussion above, a large net unbilled receivable is concentrated in the single international tracked-vehicle contract that management has flagged for variable-consideration risk, and it is expected to unwind only as deliveries run through early 2028. That is where a working-capital problem would show up first — as a receivable write-down accompanying a negative estimate catch-up — even while the headline receivables trend looks pristine.
⚠ Items to Watch. (1) A reversal of the deleveraging — net-debt/EBITDA climbing back toward 1.8x — would only concern us if it funded value-dilutive M&A rather than buybacks; at current levels the balance sheet is a source of strength, not risk. (2) Watch inventory: if it keeps building faster than Aerospace deliveries convert it, days-inventory (78 days) would lengthen and consume the operating cash the delivery ramp is supposed to release. (3) Any drawdown of the concentrated unbilled receivable below its carried value would confirm the tracked-vehicle estimation risk in hard numbers.
3.3A Cash Flow Statement
| FY2021 | FY2022 | FY2023 | FY2024 | FY2025 | |
|---|---|---|---|---|---|
| Cash from Operations ($M) | $4,271.0M | $4,579.0M | $4,710.0M | $4,112.0M | $5,120.0M |
| — Depreciation & Amortization ($M) | $890.0M | $884.0M | $863.0M | $886.0M | $924.0M |
| Capital Expenditures ($M) | $887.0M | $1,114.0M | $904.0M | $916.0M | $1,161.0M |
| Free Cash Flow ($M) | $3,384.0M | $3,465.0M | $3,806.0M | $3,196.0M | $3,959.0M |
| FCF Margin | 8.8% | 8.8% | 9.0% | 6.7% | 7.5% |
| FCF / Share | $12.00 | $12.46 | $13.80 | $11.52 | $14.53 |
| FCF Conversion (FCF/NI) | 103.9% | 102.2% | 114.8% | 84.5% | 94.0% |
| CapEx / Revenue | 2.3% | 2.8% | 2.1% | 1.9% | 2.2% |
| CapEx / D&A | 1.0x | 1.3x | 1.0x | 1.0x | 1.3x |
| Dividends Paid ($M) | $1,315.0M | $1,369.0M | $1,428.0M | $1,529.0M | $1,593.0M |
| Share Repurchases ($M) | $1,828.0M | $1,229.0M | $434.0M | $1,501.0M | $637.0M |
Source: GD FY2025 Form 10-K, Consolidated Statement of Cash Flows. Tier 1. Free cash flow, conversion and per-share/intensity ratios are analyst-computed (underlined).
3.3B Cash Flow — Analysis
sources Quality of operating cash flow — high, and improving. Operating cash flow reached $5,120.0M in FY2025, a record and comfortably ahead of net earnings of $4,210.0M. That the business earns cash is not in doubt; the more useful question is whether it converts, and here the multi-year evidence is reassuring. Free cash flow of $3,959.0M represents roughly 94.0% of net income, and over FY2021–FY2025 conversion has generally run at or above 100% — 103.9%, 102.2% and 114.8% in the first three years — with FY2024 the one soft year (84.5%) as the Aerospace inventory build for the Gulfstream ramp absorbed cash. FY2025’s recovery to 94.0% shows that build beginning to release as deliveries accelerate. This is the right place to flag the seasonality management itself emphasises: the company’s first-quarter operating cash flow is characteristically weak or negative because of the same Gulfstream inventory build, so a single soft quarter is a working-capital timing artifact, not a deterioration — the full-year figure is the one that matters. FCF per share of $14.53 underpins the shareholder-return capacity discussed below.
CapEx analysis — a genuine, but disciplined, investment cycle. Capital expenditure of $1,161.0M is elevated relative to history and runs above depreciation, with CapEx/D&A at 1.3x — above the 1.0x line that separates growth investment from harvest mode. This is deliberate and identifiable: the spend is the shipyard capacity expansion for the submarine build-up that management says it will continue. What keeps it from being a concern is that the intensity is modest in absolute terms — CapEx is only 2.2% of revenue — so General Dynamics is funding a real growth cycle while still converting the large majority of operating cash into free cash flow. This is growth investment inside a business that does not need to consume its cash flow to grow, which is the desirable combination.
Capital allocation — a shareholder-return machine, with dividends the anchor and buybacks the swing. The waterfall over the past five years is unambiguous. The first and most protected use of cash is the dividend, which has risen every year to $1,593.0M and absorbs only 37.8% of net earnings — a well-protected, growing payout with a decade of increases behind it. Buybacks are the swing variable, and their year-to-year volatility is the tell: repurchases have ranged from $434.0M in a debt-paydown year to $1,828.0M in a return-heavy one, and printed $637.0M in FY2025 — management flexes buybacks around the priority of debt reduction and dividend growth. That priority ordering — deleverage first, dividend always, buyback with what remains — is exactly what the falling debt balance in 3.2B reflects, and it has been the right mix for a mature, cash-generative franchise with a limited need to reinvest: the modest CapEx intensity means there is no large internal-reinvestment opportunity competing for the cash, so returning it is the correct default. The residual question for the equity is one of upside rather than sustainability — with net leverage now at 0.9x, the balance sheet could support a materially larger buyback than FY2025’s, and the pace at which management chooses to deploy that capacity is a swing factor for per-share returns.
⚠ Items to Watch. (1) If full-year FCF conversion falls below the FY2024 trough of 84.5% for a reason other than a one-off inventory build, it would signal the delivery ramp is not releasing working capital as expected. (2) If CapEx/D&A pushes materially above 1.3x without a commensurate step-up in shipbuilding revenue, investment intensity would be outrunning its return. (3) Buybacks staying near the low end of their range while net leverage sits below 0.9x would represent under-utilised balance-sheet capacity.
3.4 Returns Analysis
| FY2021 | FY2022 | FY2023 | FY2024 | FY2025 | |
|---|---|---|---|---|---|
| ROIC | 13.1% | 12.8% | 12.5% | 13.8% | 14.6% |
| ROE | 19.6% | 18.7% | 16.6% | 17.4% | 17.7% |
| ROA | 6.4% | 6.7% | 6.2% | 6.8% | 7.4% |
| Interest Coverage | 9.7x | 10.8x | 10.6x | 12.2x | 13.3x |
Source: Company SEC filings (10-K); figures per the FL model — see Appendix A.1–A.2.
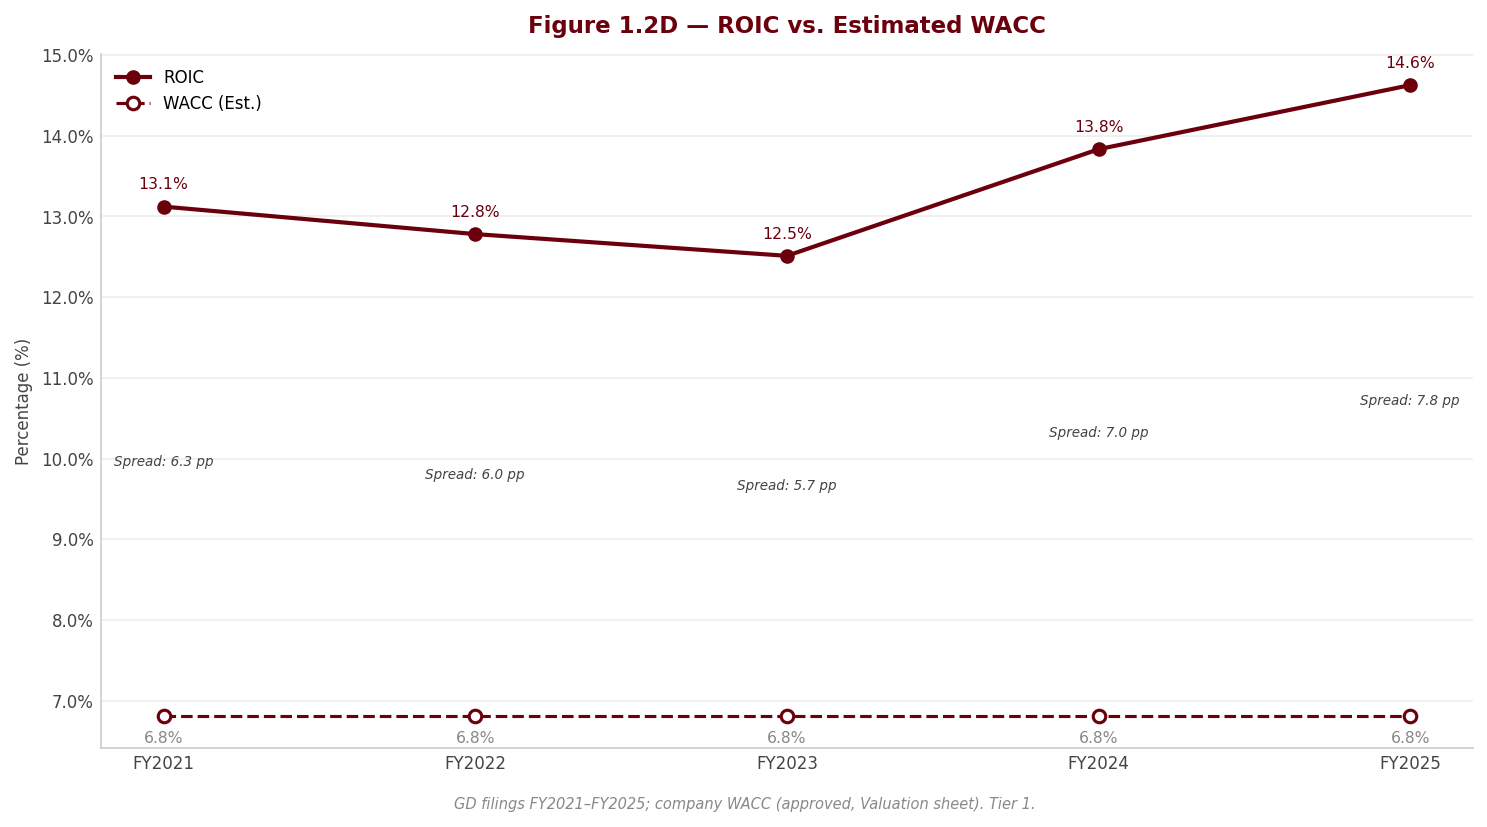
ROIC — the number that matters most, and it is comfortably value-creative and rising off its trough. Return on invested capital of 14.6% in FY2025 is the single most important long-term metric in this section, and it sits well above any reasonable estimate of the company’s cost of capital — the WACC — so General Dynamics is creating economic value, not just accounting earnings, at the margin. The trajectory is as important as the level. ROIC compressed through the post-CSRA years to a trough of 12.5% in FY2023 as the large goodwill-laden acquisition sat in the invested-capital base against the lower-margin revenue mix, but it has since inflected upward to 13.8% and 14.6% as revenue accelerated against a slowly growing capital base and margins firmed. The spread over WACC is therefore widening, not narrowing — the constructive signal. The one structural qualifier: because the $21,009.0M goodwill block is permanently embedded in invested capital, GD’s ROIC will always read lower than an asset-light peer’s, and a Technologies impairment (Section 2) would, perversely, raise reported ROIC by shrinking the capital base — a reminder to read the level in the context of how the capital was assembled.
DuPont decomposition — deleveraging is the swing factor pulling ROE down even as the operating business improves. ROE of 17.7% resolves into a net margin of 8.0%, asset turnover of 0.93x, and an equity multiplier of 2.37x. The instructive part is what has moved. Net margin has been remarkably stable near 8.0% throughout the window — it is the steady base, not the driver of change. Asset turnover has actually improved to 0.93x as revenue outgrew the asset base — a tailwind to ROE. The swing factor, unambiguously, is the equity multiplier: it has fallen from a post-CSRA peak of 3.69x to 2.37x as the deliberate deleveraging (3.2B) rebuilt equity and retired debt. In other words, the drift down in ROE from 28.9% in the pre-deleveraging years to 17.7% today is not an erosion of business quality — margins and turnover are stable-to-improving — it is the arithmetic of a safer balance sheet. That is a higher-quality 17.7% ROE than the leverage-inflated 28.9% it replaced, and it is the correct way to read the trend: management traded financial-leverage-inflated returns for balance-sheet resilience, and the underlying operating returns (ROA up to 7.4%) are moving the right way underneath.
3.5 Altman Z-Score (Most Recent FY)
| Component | FY2023 | FY2024 | FY2025 |
|---|---|---|---|
| X1 (Working Capital / Total Assets) | 0.131 | 0.117 | 0.130 |
| X2 (Retained Earnings / Total Assets) | 0.716 | 0.742 | 0.770 |
| X3 (EBIT / Total Assets) | 0.077 | 0.086 | 0.094 |
| X4 (Equity / Total Liabilities) | 0.636 | 0.652 | 0.810 |
| X5 (Revenue / Total Assets) | 0.771 | 0.854 | 0.918 |
| Z-Score | 1.98 | 2.11 | 2.29 |
| Zone | Gray | Gray | Gray |
Source: Company SEC filings (10-K); figures per the FL model — see Appendix A.1–A.2.
Interpretation — a “gray-zone” score that understates a genuinely investment-grade credit, but trending the right way. The Altman Z-Score reads 2.29 in FY2025, up steadily from 1.98 in FY2023 and 2.11 in FY2024, and by the model’s thresholds sits in the “gray” zone, just below the model’s 2.90 “safe” boundary. Two points keep this from being a credit warning. First, the direction is unambiguously improving — the score has climbed toward the safe boundary each year, driven by exactly the trends documented above: rising retained earnings (X2) from consistent profitability, improving asset turnover (X5) as revenue accelerated, and a much stronger equity-to-liabilities ratio (X4) from the deleveraging. Second, and more important, the model structurally understates the credit quality of a capital-intensive, goodwill-heavy defense prime: the low asset-turnover term (X5) and the large asset base that carries the acquired goodwill both drag the score mechanically, even though they reflect a durable, sole-source franchise rather than distress. The independent evidence contradicts any distress reading entirely — net leverage of 0.9x, 13.3x interest coverage, substantial undrawn committed facilities, full covenant compliance and no maturity wall (per the debt note and the forensic debt review). The correct conclusion for credit risk is therefore benign: the gray-zone score is an artifact of the model’s bias against asset-heavy balance sheets, the trend is toward the safe boundary, and the real-world credit metrics are firmly investment-grade.
4. Valuation withdrawn
This section stated what the shares were worth and what to do about them. It rested on an exit multiple set by hand — across the coverage it averaged 24% below where each company actually traded — so the conclusion largely restated that assumption instead of testing it. Rather than leave it standing, it has been withdrawn while the method is rebuilt.
Nothing else in this report depends on it: the financial analysis above and below is drawn from the company's own filings, and every figure links to the page it was verified against.
Section 5 — Financial Metrics & Peer Benchmarking
sources
5.1 Peer Selection
sources The peer set is built from the large U.S. defense primes, because General Dynamics’ investment case is a defense-prime case: a portfolio of long-cycle, cost-to-cost government programs whose economics are set by contract structure and mix, not by end-market pricing. Five primes are carried in the quantitative comparison below, chosen for genuine business overlap and scale proximity. Lockheed Martin Corporation (LMT) and Northrop Grumman Corporation (NOC) are the closest like-for-like comparators — large, U.S.-centric, predominantly pure-defense platforms with the same customer, the same contract-accounting regime and the same long-cycle backlog dynamics. L3Harris Technologies, Inc. (LHX) is the mid-cap prime, weighted to defense electronics and C6ISR, and — importantly for clean comparison — the peer that, with GD, places non-service pension below operating income on the same basis. RTX Corporation (RTX) is included for scale and diversification reference rather than as a clean read-across: roughly half of its revenue is commercial aerospace (Collins and Pratt & Whitney), so its margins, returns and multiples are driven substantially by commercial-aero economics and the very large goodwill from the 2020 UTC–Raytheon combination. We treat RTX as a boundary case throughout, not a core defense comparable. Huntington Ingalls Industries, Inc. (HII) is the pure-play naval shipbuilder.
HII is the single most useful comparison in the set, and it is worth being explicit about why. As the only near-pure shipbuilder among the primes, it is the closest read-across to GD’s Marine Systems segment — and, because it is almost entirely shipbuilding, it carries the lowest margins in the group by a wide margin. That makes HII the visible endpoint of the mix shift Section 3 identified as the structural cause of GD’s lower operating margin: it shows directly what whole-company economics look like when Navy shipbuilding is the entire business rather than the largest of four segments. With HII in the tables below, a reader can see the destination that GD’s revenue-mix drift is pointing toward, and can therefore judge for themselves how much of GD’s margin step-down is structural mix rather than execution.
The set’s principal limitations are stated up front and developed in 5.7: the primes look far more alike on headline operating margin than they are, because they place pension FAS/CAS credits and non-service pension expense in different lines; LMT’s book equity is small and pension-eroded, which distorts its returns and leverage ratios; and RTX is not a defense-margin comparable at all. On the cleaner axes — fiscal-period and accounting basis — the set is homogeneous: all five peers report under US GAAP in USD with December fiscal year-ends, so there are no IFRS translation or currency-comparability adjustments to make. The only period nuance is L3Harris’s 52/53-week year, which for FY2025 ended January 2, 2026 — an immaterial offset from GD’s December 31 close.
| Peer | Ticker | Exchange | Filing Type | Accounting Standard | Fiscal Year End | Comparability Note |
|---|---|---|---|---|---|---|
| Lockheed Martin Corporation | LMT | NYSE | 10-K | US GAAP | December | Closest pure-defense comparator; operating margin boosted by an above-the-line CAS/FAS pension credit and returns distorted by a small, pension-eroded equity base — see 5.7. |
| Northrop Grumman Corporation | NOC | NYSE | 10-K | US GAAP | December | Pure-defense comparator; FY2025 operating income includes a divestiture gain — ex-gain margin noted in 5.7. |
| RTX Corporation | RTX | NYSE | 10-K | US GAAP | December | Boundary case: roughly half commercial aerospace; margins, returns and multiples are not a defense read-across — see 5.7. |
| L3Harris Technologies, Inc. | LHX | NYSE | 10-K | US GAAP | December | Cleanest structural comparator on pension placement (below operating income, as GD); 52/53-week year ended Jan 2, 2026 — immaterial. |
| Huntington Ingalls Industries, Inc. | HII | NYSE | 10-K | US GAAP | December | Pure naval shipbuilder — GD’s closest Marine Systems read-across; structurally lowest margins in the set, a genuine business-model difference (not a presentation artifact) — see 5.7. |
Source: Peer-company SEC filings; comparability notes in 5.7 — see Appendix A.1.
5.2 Profitability Comparison
sources Comparative: Most Recent Full Fiscal Year (FY2025)
| Metric | General Dynamics Corp | Lockheed Martin Corporation | Northrop Grumman Corporation | RTX Corporation | L3Harris Technologies, Inc. | Huntington Ingalls Industries, Inc. |
|---|---|---|---|---|---|---|
| Revenue ($M) | $52,550.0M | $75,048.0M | $41,954.0M | $88,603.0Mʳ | $21,865.0M | $12,484.0M |
| Gross Margin | 15.1% | 10.2%ⁿ | 19.8% | 20.1%ʳ | 25.7% | 12.7% |
| EBITDA Margin | 12.0% | 12.5%ᵖ | 14.3%ᵍ | 15.4%ʳ | 15.2% | 7.9% |
| EBIT Margin | 10.2% | 10.3%ᵖ | 10.8%ᵍ | 10.5%ʳ | 9.7% | 5.3% |
| Net Margin | 8.0% | 6.7% | 10.0% | 7.6%ʳ | 7.3% | 4.8% |
| FCF Margin | 7.5% | 9.2% | 7.9% | 9.0%ʳ | 12.3% | 6.4% |
Source: Peer-company SEC filings; comparability notes in 5.7 — see Appendix A.1.
Superscript legend (issues detailed in 5.7): ᵖ operating result boosted by an above-the-line CAS/FAS pension credit (LMT); ⁿ “Gross profit” struck after that credit — not a cost-of-sales margin (LMT); ᵍ operating income includes a divestiture gain (NOC; ex-gain operating margin falls back to roughly GD’s level); ʳ roughly-half commercial-aerospace mix — not a defense read-across (RTX); ᵐ market-sourced. HII carries no distortion marker — its low margin is a genuine business-model difference, discussed below. GD’s cost of sales excludes G&A (shown separately), so gross-margin lines are only directionally comparable across the group.
Historical: General Dynamics Corp Own 5-Year Progression
| Metric | FY2021 | FY2022 | FY2023 | FY2024 | FY2025 |
|---|---|---|---|---|---|
| Gross Margin | 16.7% | 16.8% | 15.8% | 15.4% | 15.1% |
| EBITDA Margin | 13.1% | 12.9% | 12.1% | 11.9% | 12.0% |
| EBIT Margin | 10.8% | 10.7% | 10.0% | 10.1% | 10.2% |
| Net Margin | 8.5% | 8.6% | 7.8% | 7.9% | 8.0% |
| FCF Margin | 8.8% | 8.8% | 9.0% | 6.7% | 7.5% |
Source: Peer-company SEC filings; comparability notes in 5.7 — see Appendix A.1.
The single most important point in this section must be made before any margin is ranked: the deceptively tight operating-margin cluster is not a like-for-like comparison. GD’s EBIT margin of 10.2% sits in a tight band with LMT (10.3%), NOC (10.8%), RTX (10.5%) and LHX (9.7%) — but the composition of each differs materially. LMT’s operating result is boosted by a large unallocated CAS-over-FAS pension credit struck above the operating line, with its non-service FAS pension expense sitting below it; NOC’s includes a divestiture gain that, once removed, brings its operating margin back to roughly GD’s own level; RTX’s includes other income and, more fundamentally, reflects commercial-aero economics rather than defense; only GD and LHX place non-service pension consistently below operating income on the same basis. Read correctly, the honest conclusion is that GD is a genuinely mid-pack operator among the diversified primes on a clean basis — neither the margin laggard the raw ordering might suggest nor a standout — and its position looks better, not worse, once LMT’s pension boost and NOC’s gain are neutralized.
HII is where the peer table earns its place, because it makes Section 3’s central argument visible. At 5.3% EBIT margin, HII sits well outside the diversified-prime cluster — the lowest in the group — and it does so for a single, clean reason: it is almost entirely Navy shipbuilding, the lowest-margin defense activity there is. That is precisely the business Section 3 identified as the structural anchor on GD’s consolidated margin. GD’s Marine Systems has become its largest segment by revenue, and its long-cycle, cost-to-cost submarine construction carries HII-like economics; the more GD’s mix tilts toward shipbuilding, the more its blended margin is pulled from the diversified-prime level toward HII’s pure-shipbuilding level. Seen this way, GD’s 10.2% is not evidence of weak execution — it is a diversified prime sitting above the shipbuilding floor that HII marks out, with Aerospace and Combat Systems holding the blend up. This is the cleanest external corroboration available for the “structural mix, not deterioration” reading in Section 3, and it is the reason HII belongs in the table rather than in a footnote.
On gross margin the comparison is looser still and should not be leaned on. LMT’s printed 10.2% “Gross profit” is struck after the same +CAS/FAS credit and is not a cost-of-sales margin, so it is not rankable against the others (5.7). GD’s own gross margin of 15.1% is computed on a cost-of-sales basis that excludes G&A, and its multi-year drift lower — from 16.7% in FY2021 — is the same shipbuilding-mix effect documented in Section 3, not a comparability artifact. Where GD stands out constructively is net margin: at 8.0% it is ahead of LMT, RTX, LHX and HII, and behind only NOC, whose 10.0% is itself flattered by the divestiture gain — a reflection of GD’s low interest burden (Section 3.2B) converting a mid-pack operating margin into a strong bottom line. GD’s FCF margin of 7.5% is the one soft spot, the second-lowest in the group and above only HII; this is the working-capital and capacity-capex signature of the submarine/Gulfstream ramp described in Section 3.3, not a structural cash-conversion deficiency, and it is the metric to watch as the ramp matures.
5.3 Returns Comparison
sources Comparative: Most Recent Full Fiscal Year (FY2025)
| Metric | General Dynamics Corp | Lockheed Martin Corporation | Northrop Grumman Corporation | RTX Corporation | L3Harris Technologies, Inc. | Huntington Ingalls Industries, Inc. |
|---|---|---|---|---|---|---|
| ROIC | 14.6% | 23.0%ᵈ | 11.5%ᵍ | 7.3%ʳ | 5.7% | 6.6% |
| ROE | 17.7% | 74.6%ᵈ | 25.1%ᵍ | 10.3%ʳ | 8.2% | 11.9% |
| ROA | 7.4% | 8.4% | 8.1% | 3.9%ʳ | 3.9% | 4.7% |
| Asset Turnover | 0.92x | 1.25x | 0.82x | 0.52xʳ | 0.53x | 0.98x |
Source: Peer-company SEC filings; comparability notes in 5.7 — see Appendix A.1.
Superscript legend: ᵈ capital-structure artifact — LMT’s small, pension-eroded equity mechanically inflates ROE/ROIC/D-E (5.7); ᵍ modestly flattered by NOC’s divestiture gain; ʳ commercial-aerospace mix and merger goodwill (RTX).
Historical: General Dynamics Corp Own 5-Year Progression
| Metric | FY2021 | FY2022 | FY2023 | FY2024 | FY2025 |
|---|---|---|---|---|---|
| ROIC | 13.1% | 12.8% | 12.5% | 13.8% | 14.6% |
| ROE | 19.6% | 18.7% | 16.6% | 17.4% | 17.7% |
| ROA | 6.4% | 6.7% | 6.2% | 6.8% | 7.4% |
Source: Peer-company SEC filings; comparability notes in 5.7 — see Appendix A.1.
On the returns metric that matters most, GD leads the group once the distortions are stripped out. Return on invested capital of 14.6% comfortably exceeds the 6.81% cost of capital — GD is creating economic value, and the spread is widening (Section 3.4). Against peers, GD’s ROIC is the highest on a clean basis: LMT’s headline 23.0% is a capital-structure artifact of a tiny, pension-eroded equity base, not superior operating performance, and cannot be ranked against GD at face value; NOC’s 11.5% is modestly flattered by its divestiture gain; RTX’s 7.3%, LHX’s 5.7% and HII’s 6.6% all sit well below GD, dragged respectively by commercial-aero economics, heavy merger goodwill, and shipbuilding’s thin margins on a sizeable asset base. The correct read is that GD converts capital into returns as well as or better than any diversified prime in the set, and does so off a full book-equity base — the higher-quality version of the same result.
ROE tells the complementary story and requires the same discipline. GD’s 17.7% is mid-pack and, per Section 3.4, is a higher-quality figure than it was pre-deleveraging — the drift down over five years reflects a safer balance sheet (a falling equity multiplier), not eroding profitability. The peers above it are not cleanly above it: LMT’s 74.6% is the extreme low-equity distortion (5.7) and NOC’s 25.1% is gain-assisted, while RTX (10.3%), LHX (8.2%) and HII (11.9%) all sit below GD. On ROA — the leverage-neutral view — GD’s 7.4% is competitive with LMT and NOC and well ahead of the commercial-aero-diluted RTX and LHX and of HII. Asset turnover of 0.92x places GD mid-pack — below LMT’s higher-turning book and marginally below HII’s (0.98x), above NOC, and far above the goodwill-laden RTX (0.52x) and LHX. The through-line: GD’s returns profile is a legitimate strength of the investment case, and it is understated by any naive ranking that takes LMT’s inflated ratios at face value.
5.4 Leverage & Liquidity Comparison
sources Comparative: Most Recent Full Fiscal Year (FY2025)
| Metric | General Dynamics Corp | Lockheed Martin Corporation | Northrop Grumman Corporation | RTX Corporation | L3Harris Technologies, Inc. | Huntington Ingalls Industries, Inc. |
|---|---|---|---|---|---|---|
| Net Debt / EBITDA | 0.9x | 1.9x | 1.9x | 2.2xʳ | 3.0x | 1.9x |
| Total Debt / Equity | 0.3x | 3.2xᵈ | 0.9x | 0.6x | 0.6x | 0.5x |
| Interest Coverage | 13.3x | 6.9x | 6.8x | 5.3x | 3.5x | 6.3x |
| Current Ratio | 1.4x | 1.1x | 1.1x | 1.0x | 1.2x | 1.1x |
| FCF Margin | 7.5% | 9.2% | 7.9% | 9.0%ʳ | 12.3% | 6.4% |
Source: Peer-company SEC filings; comparability notes in 5.7 — see Appendix A.1.
Superscript legend: ᵈ D/E inflated by LMT’s small, pension-eroded equity base — not a solvency signal (5.7); ʳ RTX metrics reflect commercial-aerospace scale and merger balance sheet.
GD carries the lowest net leverage in the group, and this is a real, unambiguous strength rather than a comparability quirk. Net-debt/EBITDA of 0.9x sits below the entire peer set — LMT (1.9x), NOC (1.9x) and HII (1.9x) form the next tier, closely bunched, with RTX (2.2x) and LHX (3.0x) more levered — and it corroborates the multi-year deleveraging documented in Section 3.2B. GD’s total-debt/equity of 0.3x is among the lowest on a meaningful basis, in the same low cluster as HII (0.5x), LHX (0.6x) and RTX (0.6x); LMT’s 3.2x is not a like-for-like reading, because it is inflated by the same small, pension-eroded equity denominator that distorts its returns (5.7), not by heavier borrowing. On coverage, GD’s interest coverage of 13.3x sits at the strong end of a peer range running from LHX’s 3.5x up through HII (6.3x), NOC (6.8x) and LMT (6.9x) — consistent with GD carrying both the lowest net debt and a rising EBIT base. Current ratios are tightly clustered and broadly uniform across the group, including HII (1.1x), a common feature of contract-billing balance sheets, so the liquidity differences here are immaterial. The strategic read is the one from Section 3: GD’s balance sheet is the least stretched in its peer group and holds unused capacity — optionality for buybacks or M&A — that the peers, RTX and LHX in particular, do not.
5.5 Valuation Multiples Comparison
sources Comparative: Current Price
| Metric | General Dynamics Corp | Lockheed Martin Corporation | Northrop Grumman Corporation | RTX Corporation | L3Harris Technologies, Inc. | Huntington Ingalls Industries, Inc. |
|---|---|---|---|---|---|---|
| EV/EBITDA | 17.5xᵐ | 16.3xᵐ | 15.0xᵐ | 23.7xᵐʳ | 18.9xᵐ | 14.9xᵐ |
| P/E | 25.0xᵐ | 27.1xᵐ | 18.7xᵐ | 43.6xᵐʳ | 33.1xᵐ | 21.0xᵐ |
| FCF Yield | 3.8%ᵐ | 5.1%ᵐ | 4.2%ᵐ | 2.7%ᵐʳ | 5.0%ᵐ | 6.2%ᵐ |
Source: Peer-company SEC filings (operating figures); market data per Appendix A.1 — comparability notes in 5.7.
All valuation multiples are ᵐ market-sourced, priced to the August 4, 2026 close; EBITDA is operating income plus D&A from each filing (no non-GAAP adjustments), so basis is mixed — market prices over filing-based operating figures. ʳ RTX multiples reflect commercial-aerospace recovery expectations, not defense.
Historical: General Dynamics Corp EV/EBITDA (period-end price)
| FY2021 | FY2022 | FY2023 | FY2024 | FY2025 |
|---|---|---|---|---|
| 13.6x | 15.4x | 15.5x | 14.1x | 15.5x |
Source: FL model (period-end prices) — see Appendix A.1.
The raw multiple gap overstates how cheap GD is, and the honest read requires the caveats attached. At 17.5x EV/EBITDA GD sits mid-pack — above the cheapest names, HII (14.9x) and NOC (15.0x), and below RTX (23.7x) and LHX (18.9x). But RTX’s premium is a commercial-aerospace-recovery multiple, not a defense multiple, so the apparent discount to it is not a defense-peer discount at all; strip RTX out and GD trades broadly in line with the diversified-prime pack rather than at a clear discount to it. On P/E, GD’s 25.0x is below LMT (27.1x), RTX (43.6x) and LHX (33.1x) and above NOC (18.7x) and HII (21.0x) — again mid-pack, and the names trading richer are precisely those whose earnings carry an offsetting distortion (LMT’s pension geometry, RTX’s commercial cyclicality). GD’s FCF yield of 3.8% is the tell against a cheapness thesis: it is below every peer except RTX (HII 6.2%, LMT 5.1%, LHX 5.0%, NOC 4.2%), reflecting the ramp-phase capex and working capital that hold GD’s current FCF conversion below its through-cycle level.
[Rating and price target withdrawn — see the note at the top.]
5.6 Efficiency Comparison
| Metric | General Dynamics Corp | Lockheed Martin Corporation | Northrop Grumman Corporation | RTX Corporation | Huntington Ingalls Industries, Inc. |
|---|---|---|---|---|---|
| Days Sales Outstanding | 19 days | 19 days | 12 days | 61 daysʳ | 10 days |
| Days Inventory Outstanding | 78 days | 19 days | 14 days | 69 daysʳ | 7 days |
| Days Payables Outstanding | 25 days | 19 days | 35 days | 82 daysʳ | 19 days |
| Cash Conversion Cycle | 72 days | 18 days | -9 days | 48 daysʳ | -1 days |
| CapEx / Revenue | 2.2% | 2.2% | 3.5% | 3.0% | 3.2% |
Source: Peer-company SEC filings; comparability notes in 5.7 — see Appendix A.1.
Superscript legend: ʳ RTX’s cycle is especially distorted — its receivables tag bundles contract assets and it carries large commercial-aero inventory, so its CCC is not comparable to the others. Working-capital metrics are low-signal across all defense primes under long-term-contract accounting (5.7); HII shown as the pure-shipbuilding reference.
Working-capital comparisons across defense primes are low-signal, and GD’s longer cycle should be read as a business-model feature, not an inefficiency. GD’s cash conversion cycle of 72 days is the longest of the group shown, driven by inventory days of 78 days — the Gulfstream work-in-process and long-cycle shipbuilding documented in Section 3.2B. The contrast with HII is instructive precisely because it is not an efficiency verdict: HII, the pure shipbuilder, runs a very short — even negative — cash conversion cycle (-1 days) with minimal inventory days (7 days), because Navy shipbuilding is billed continuously through progress payments under cost-to-cost recognition, so the customer effectively finances the work-in-process. GD’s Marine Systems shares that billing dynamic, but GD’s consolidated cycle is dominated instead by Aerospace: Gulfstream builds finished inventory ahead of delivery, which is why GD’s DIO and CCC look nothing like HII’s despite the shared shipbuilding exposure. This is the working-capital caveat (5.7, item 6) made concrete — under long-term-contract accounting these balances split into contract assets (unbilled receivables) and contract liabilities (advances, milestone billings) that simple DSO/DIO/DPO ratios ignore, so cross-peer CCC differences largely reflect billing structure and inventory model rather than efficiency. RTX is the extreme case and is not comparable at all. The one clean, favorable GD signal here is the direction, not the level: as Section 3.2B shows, GD’s DSO of 19 days has fallen sharply through the ramp even as revenue accelerated — the opposite of the receivables-outpacing-revenue pattern that would flag aggressive revenue recognition. On capital intensity, GD’s CapEx/Revenue of 2.2% is broadly in line with the primes — modest in absolute terms and, per Section 3.3, a deliberate shipyard-capacity cycle rather than a structural asset-intensity disadvantage.
5.7 Comparability Caveats
sources The defense primes look far more alike on headline margin than they are. The following issues are material to how every table above should be read; none is a data error, and none has been “corrected” in the figures — the reported values are shown as filed, with the interpretation supplied here.
1. Pension FAS/CAS geography differs across the group — the single biggest issue (affects LMT, NOC, RTX, LHX; metrics: gross, EBIT and EBITDA margin). The primes place pension CAS credits and non-service FAS pension expense in different income-statement lines, so the deceptively tight operating-margin cluster conceals different accounting geographies. LMT is the critical case: its operating profit is boosted by a large unallocated CAS-over-FAS pension credit struck above the operating line, with its non-service FAS pension expense sitting below it — so LMT’s operating margin is not clean like-for-like with GD’s. NOC and RTX carry non-service pension (and, for RTX, other income) below or around operating income with their own placements; only GD and LHX place non-service pension consistently below operating income on the same basis. A naive operating-margin ranking across this group is therefore misleading, which is why 5.2 states the caveat before presenting the numbers.
2. LMT’s printed gross margin is not a cost-of-sales margin (affects LMT; metric: gross margin). LMT’s reported “Gross profit” (10.2% of sales) is struck after the same +CAS/FAS pension credit and after impairment/other charges — it is not revenue minus cost of sales. Measured on the peers’ basis it would be materially lower. It is flagged NOT_CLEANLY_COMPARABLE and must not be ranked against NOC, RTX, LHX, HII or GD; where it appears in 5.2 it carries the ⁿ marker for exactly this reason.
3. RTX is roughly half commercial aerospace (affects RTX; all metrics). Collins Aerospace and Pratt & Whitney make RTX roughly half commercial by revenue, with Raytheon the defense segment. Its margins, asset turnover (0.52x), ROIC (7.3%), ROA (3.9%) and its premium multiples (EV/EBITDA 23.7x, P/E 43.6x) are shaped by commercial-aero economics and the very large goodwill from the 2020 UTC–Raytheon merger — not by defense operating dynamics. RTX is a scale and diversification reference only; its low returns and high multiples are neither a defense read-across nor evidence about GD.
4. NOC’s operating result includes a divestiture gain (affects NOC; EBIT/EBITDA margin, ROIC, ROE). NOC’s FY2025 operating income includes a pre-tax gain on the sale of its training-services business; excluding it, NOC’s operating margin falls back to roughly GD’s own level rather than sitting ahead of it — and its ROE (25.1%) and ROIC (11.5%) are modestly flattered by the same item. This is why NOC’s operating and returns figures carry the ᵍ marker.
5. LMT’s ROE, ROIC and D/E are capital-structure artifacts, not superior performance (affects LMT; ROE, ROIC, D/E). LMT’s total equity is very small, eroded by a large accumulated other-comprehensive pension loss in AOCI and years of buybacks. This mechanically inflates its ROE to 74.6%, ROIC to 23.0% and D/E to 3.2x. These are correctly reported relationships, but they are denominator distortions, not operating strength; they must not be read as LMT out-returning GD, which earns 17.7% ROE and 14.6% ROIC on a full book-equity base. For LMT we anchor on margin- and EBIT/EBITDA-based comparisons instead, and mark the affected cells ᵈ.
6. Working-capital and cash-conversion metrics are low-signal across the group (affects all peers; DSO, DIO, DPO, CCC). Long-term-contract accounting splits balances into contract assets (unbilled receivables) and contract liabilities (advances, billings in excess) that DSO/DIO/DPO/CCC ignore, so cross-peer working-capital comparisons carry little information about efficiency. HII illustrates the point rather than contradicting it — its very short, negative cash conversion cycle reflects continuous Navy progress billings, not superior working-capital management. RTX is especially distorted — its receivables tag bundles contract assets and it carries large commercial-aero inventory, producing a CCC that is not comparable to the shipbuilder/contract-billing profiles of the others. The 5.6 comparison is therefore directional only.
7. Valuation multiples are market-sourced and mixed-basis (affects all peers; EV/EBITDA, P/E, FCF yield). The multiples in 5.5 pair market prices as of the August 4, 2026 close with filing-based operating figures; EBITDA is operating income plus D&A with no non-GAAP adjustments, and enterprise value adds net debt from each filing to market capitalization. These are single-source market figures, not primary-filing hard numbers, and move with prices — the ᵐ marker denotes this throughout.
8. Fiscal-period and accounting basis are otherwise clean. All five peers report under US GAAP in USD with December fiscal year-ends, so there are no IFRS translation or currency-comparability adjustments — no ᶠ markers are required for this set. The only period nuance is LHX’s 52/53-week year, which for FY2025 ended January 2, 2026, an immaterial offset from GD’s December 31 close; LHX FY2025 operating income also absorbs a modest goodwill/asset impairment. GD’s own cost of sales excludes G&A (presented separately), so gross-margin lines are only directionally comparable across the group even before the LMT-specific issue above.
9. HII’s low margin is a genuine business-model difference, not a presentation artifact — and the distinction matters (affects HII; EBIT/EBITDA/net margin). This is the caveat a reader is most likely to get wrong, so it is worth stating plainly. HII, the pure naval shipbuilder, carries the lowest operating, EBITDA and net margins in the set — but for a completely different reason than the distortions above. Its low margin is real: it reflects the economics of fixed-price-incentive and cost-type U.S. Navy shipbuilding, where the work itself is thin-margin, and it is the correct benchmark for GD’s own Marine Systems and the endpoint of GD’s mix shift (5.2). It is emphatically not a comparability artifact of the LMT kind — there is no pension credit inflating it, no divestiture gain, no accounting geography to unwind. Where LMT’s headline operating margin should be marked down toward reality (its pension credit flatters it) and its returns disregarded (its equity base distorts them), HII’s low margin should be taken at face value as a genuine feature of shipbuilding. HII therefore carries no distortion superscript, precisely because there is nothing to adjust; a reader must not lump HII’s honestly-low margin together with LMT’s artificially-supported one.
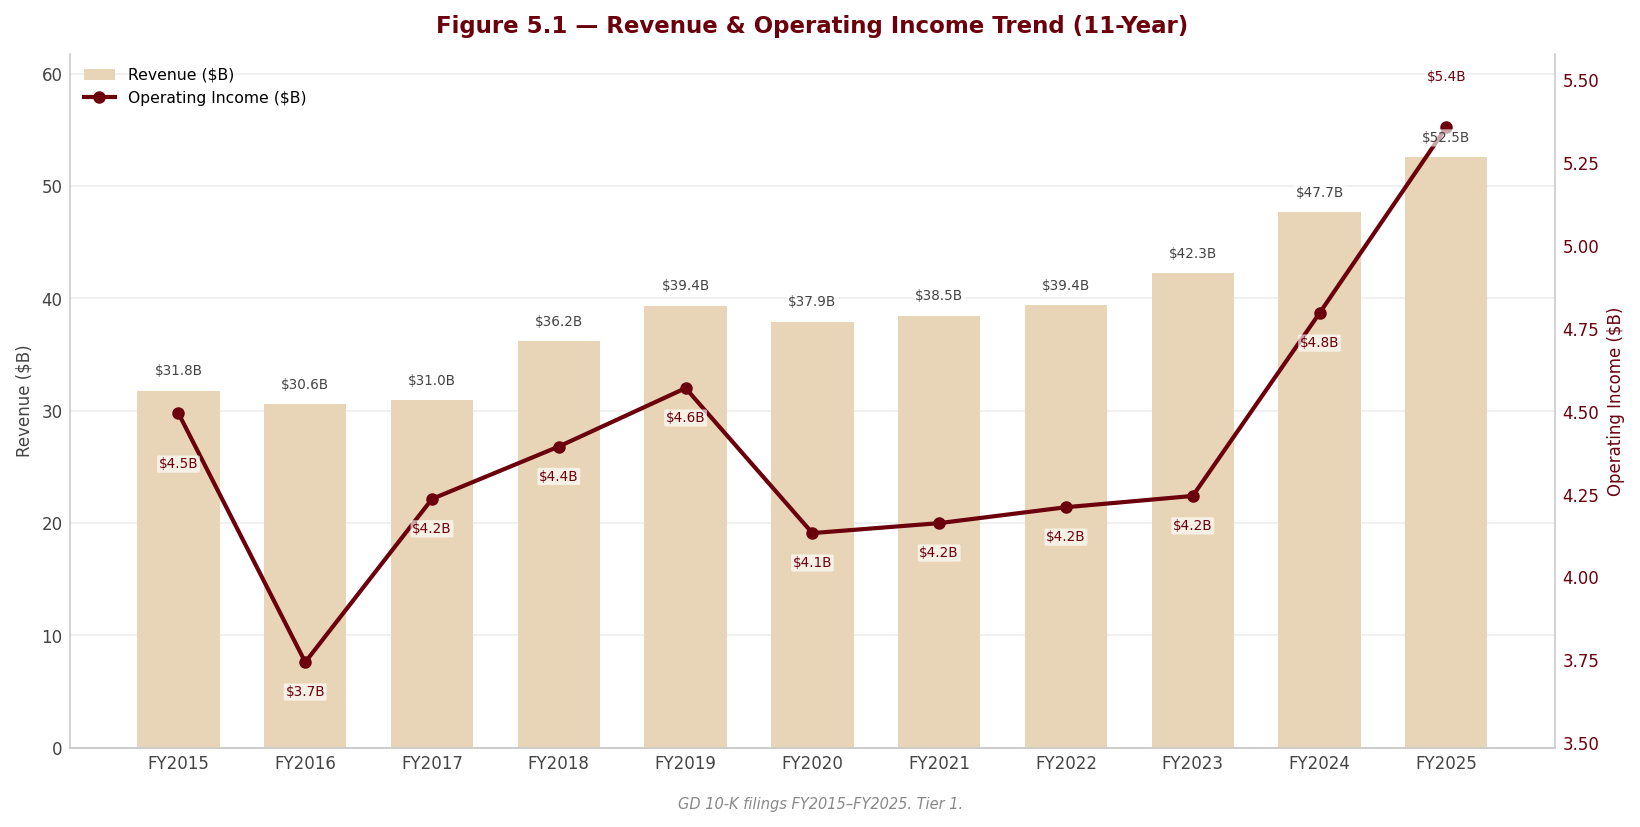
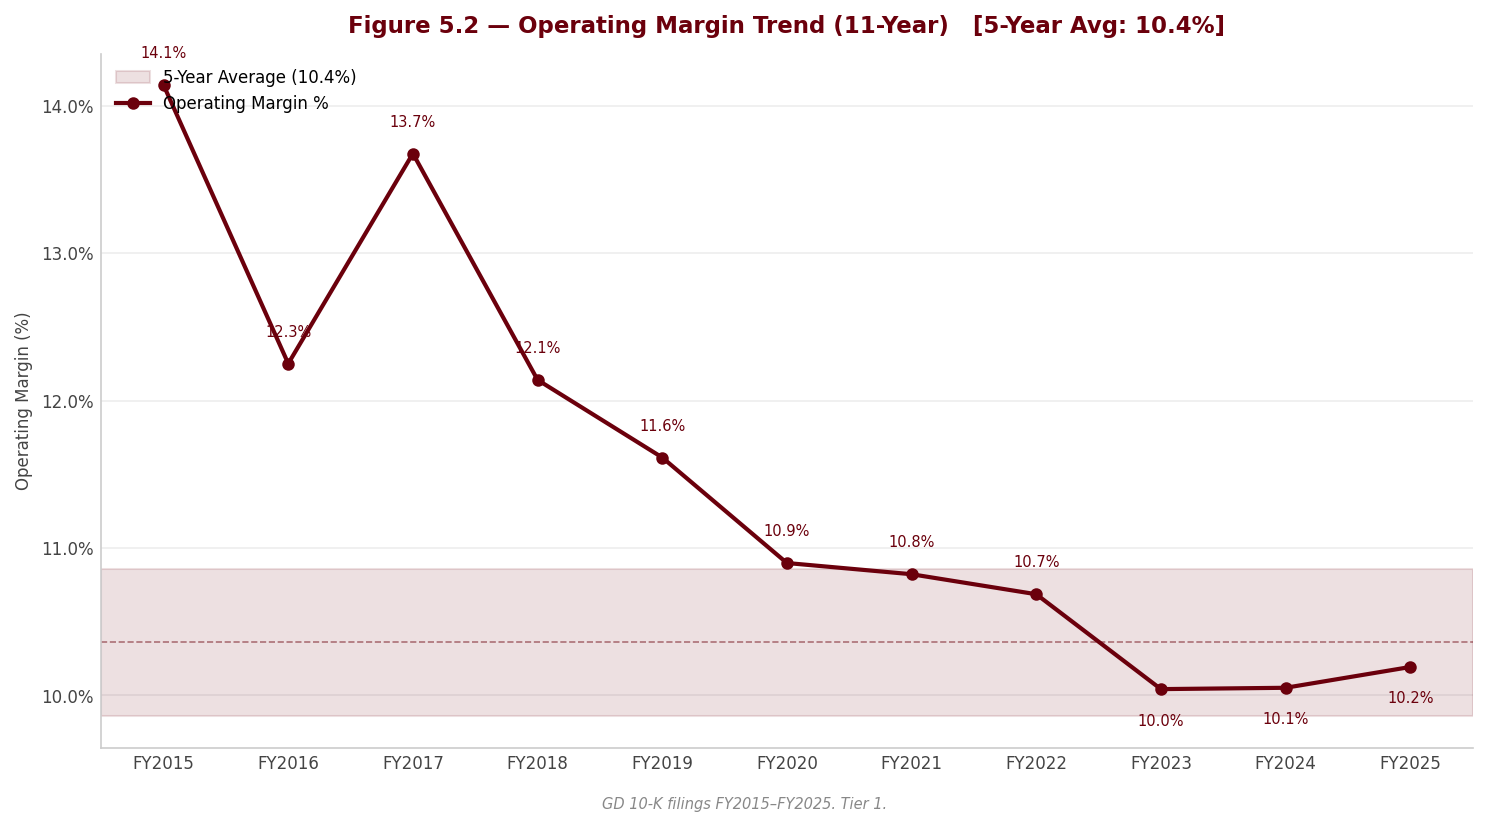
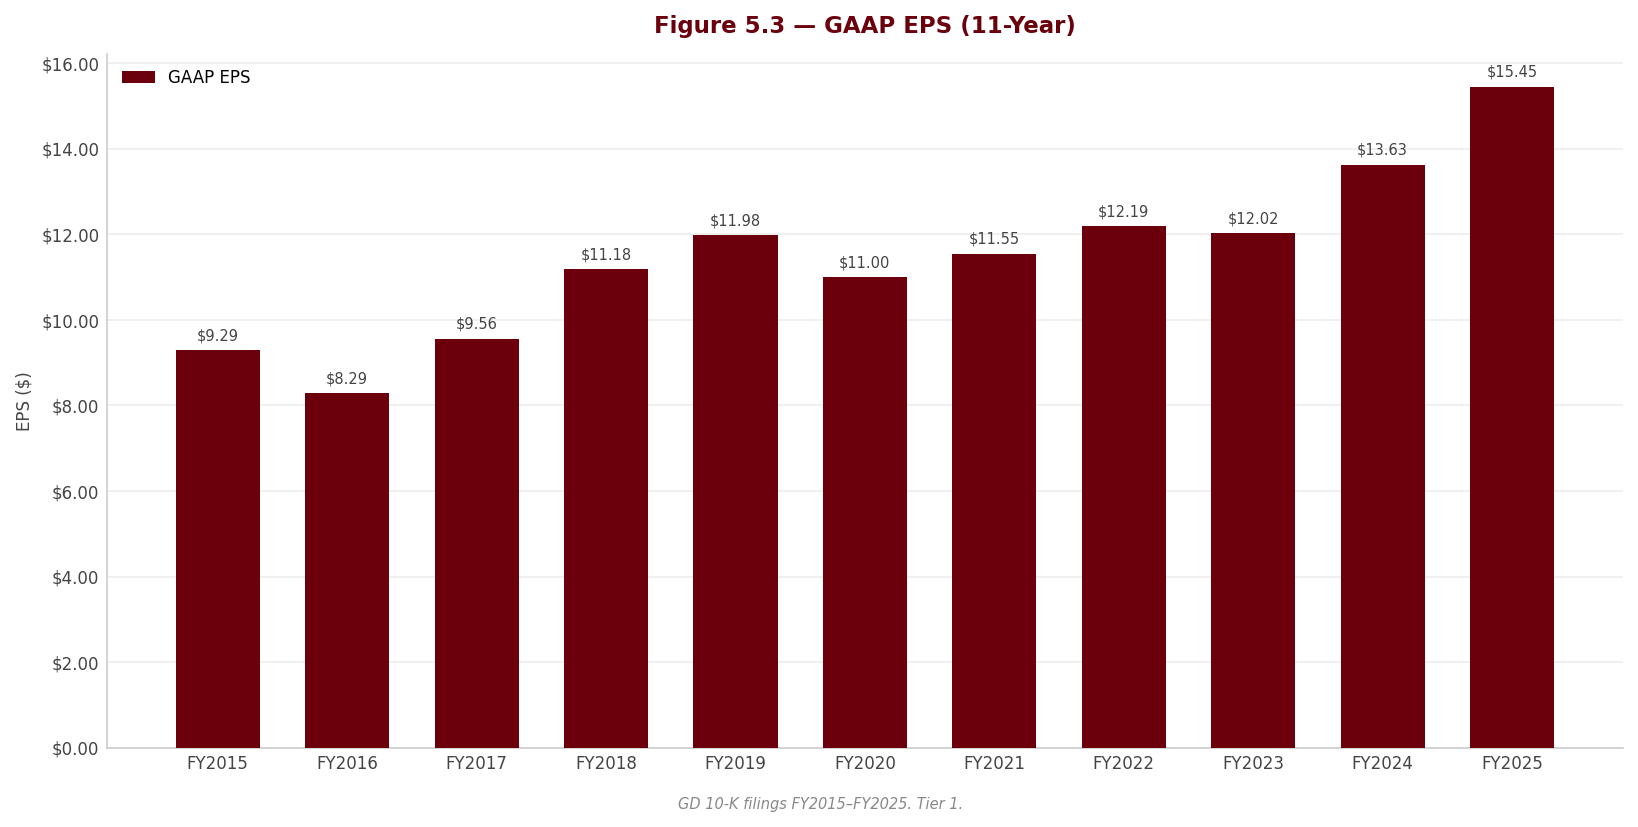
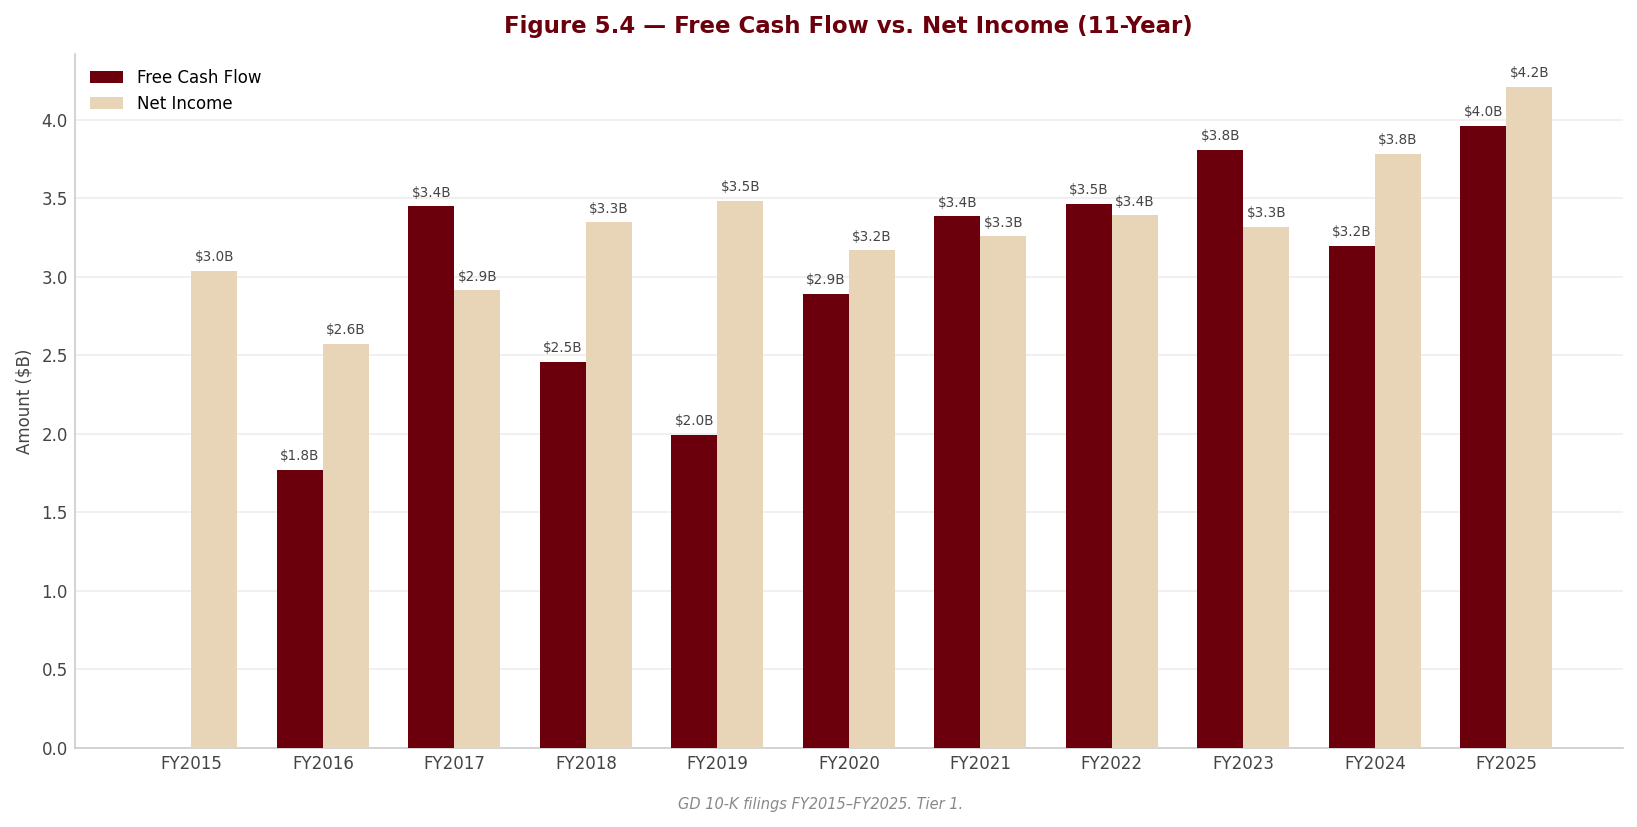
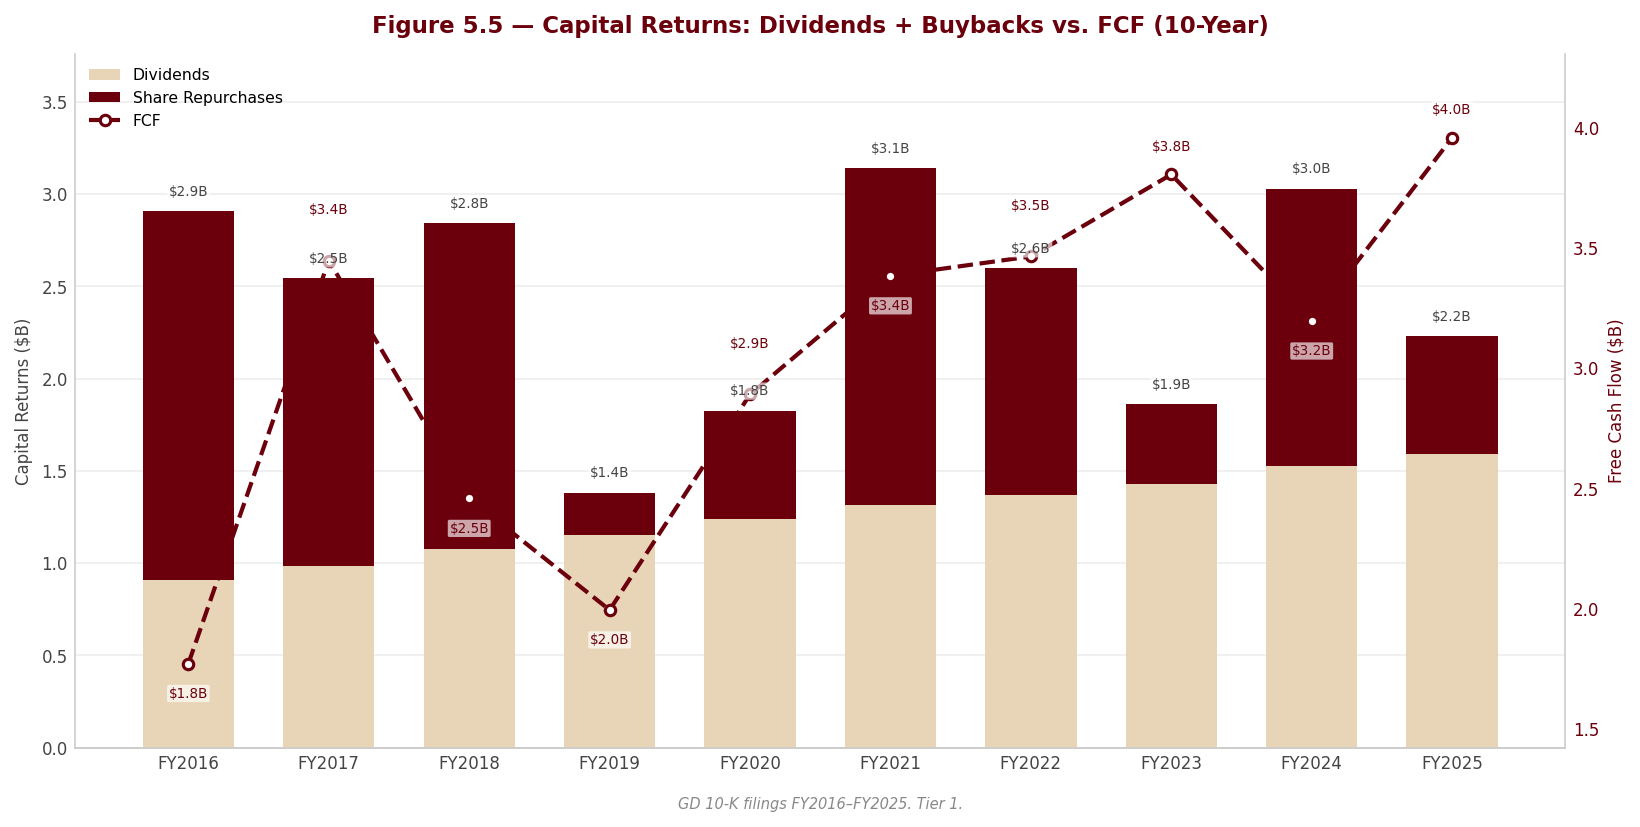
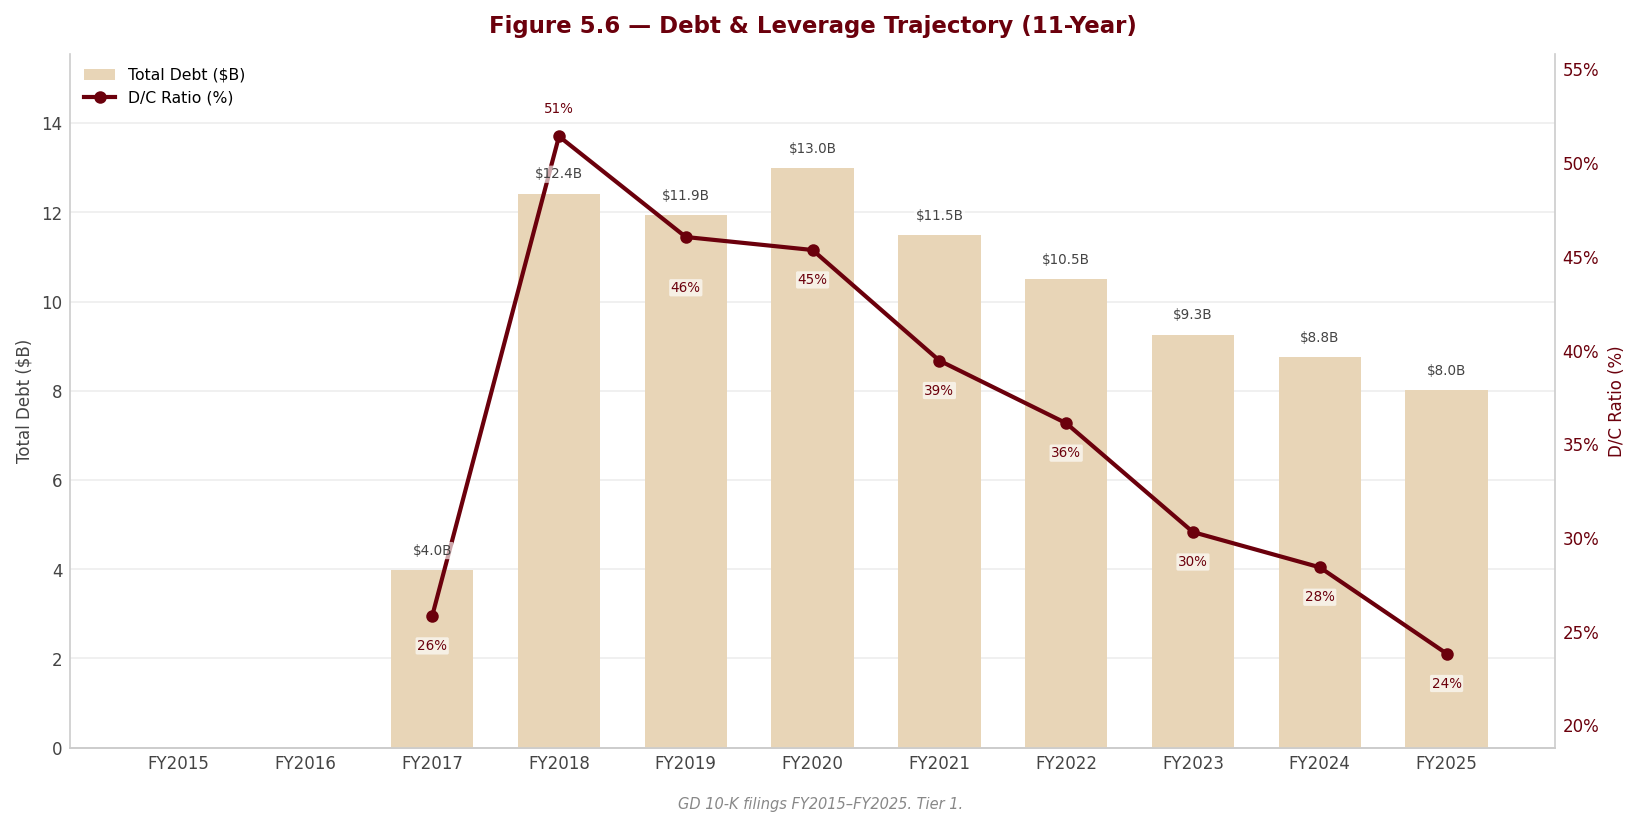
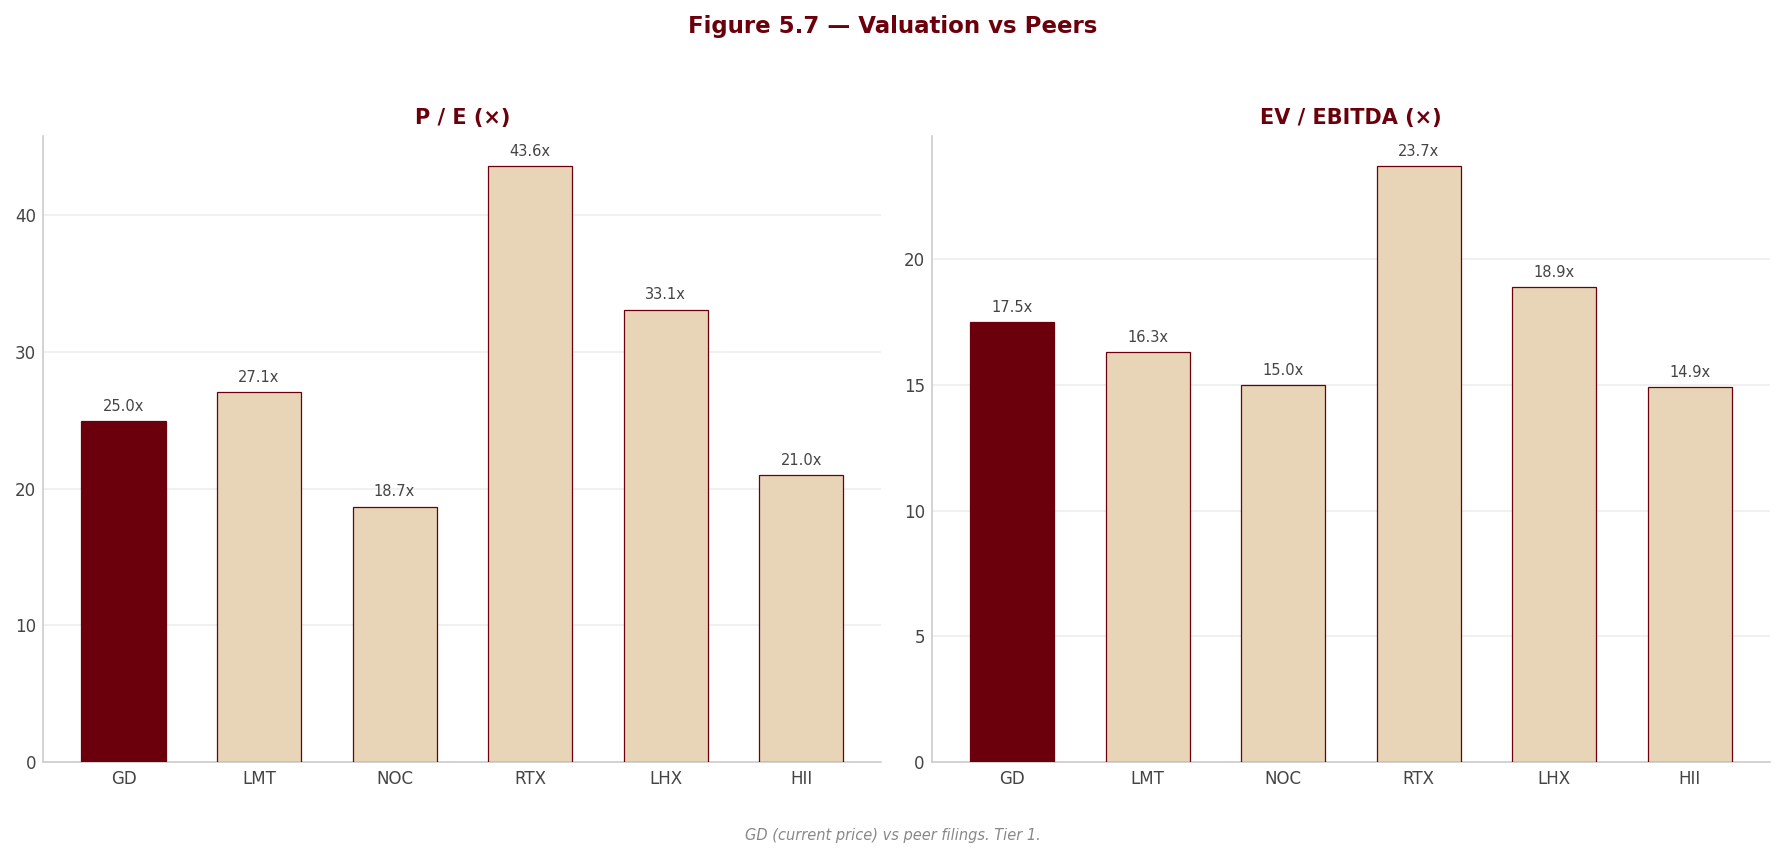
6. Valuation & Price Target withdrawn
This section stated what the shares were worth and what to do about them. It rested on an exit multiple set by hand — across the coverage it averaged 24% below where each company actually traded — so the conclusion largely restated that assumption instead of testing it. Rather than leave it standing, it has been withdrawn while the method is rebuilt.
Nothing else in this report depends on it: the financial analysis above and below is drawn from the company's own filings, and every figure links to the page it was verified against.
Section 7 — Quarterly Update: Q2 FY2026
Portfolio Action
sources [Rating and price target withdrawn — see the note at the top.]
| Assessment | |
|---|---|
| Action | [Rating and price target withdrawn — see the note at the top.] |
| Reason | [Rating and price target withdrawn — see the note at the top.] |
| Thesis intact? | YES — and strengthened on two of the separate valuation’s three caveats: the no-poach antitrust class action was dismissed with prejudice against General Dynamics on 18 May 2026 (10-Q p. 19), and the quarter’s margin expansion carried no EAC assistance. The valuation caveat is untouched. |
| Trigger to revisit | The international tracked-vehicle unbilled receivable, still $1.3 billion and unchanged from 31 December 2025 despite management’s stated expectation that it would decline (10-Q p. 17). [Rating and price target withdrawn — see the note at the top.] |
Source: Form 10-Q for the quarterly period ended 5 July 2026; FL valuation model (Valuation sheet) for the fair-value and price references — see Appendix A.1–A.2.
7.1 Results at a Glance
| Metric | Q2 FY2026 | Q2 FY2025 | YoY Δ | Q1 FY2026 | QoQ Δ |
|---|---|---|---|---|---|
| Revenue ($M) | $14,094.0M | $13,041.0M | +8.1% | $13,481.0M | +4.5% |
| Gross Profit ($M) ᵃ | $2,183.0M | $1,949.0M | +12.0% | $2,143.0M | +1.9% |
| Gross Margin | 15.5% | 14.9% | +0.5 pp | 15.9% | -0.4 pp |
| EBITDA ($M) | $1,691.0M | $1,528.0M | +10.7% | $1,652.0M | +2.4% |
| EBITDA Margin | 12.0% | 11.7% | +0.3 pp | 12.3% | -0.3 pp |
| EBIT ($M) | $1,460.0M | $1,305.0M | +11.9% | $1,420.0M | +2.8% |
| EBIT Margin | 10.4% | 10.0% | +0.4 pp | 10.5% | -0.2 pp |
| Net Income ($M) | $1,160.0M | $1,014.0M | +14.4% | $1,125.0M | +3.1% |
| Net Margin | 8.2% | 7.8% | +0.5 pp | 8.3% | -0.1 pp |
| Diluted EPS | $4.24 | $3.74 | +13.4% | $4.10 | +3.4% |
YoY Δ is computed as (CQ - PYSQ) / |PYSQ| × 100 — revenue: (14,094 - 13,041) / 13,041 × 100 = +8.1%. QoQ Δ is computed as (CQ - PQ) / |PQ| × 100 — revenue: (14,094 - 13,481) / 13,481 × 100 = +4.5%. Margins are computed as metric / revenue × 100 — gross margin CQ: 2,183 / 14,094 × 100 = 15.5%; EBITDA margin CQ: 1,691 / 14,094 × 100 = 12.0%; EBIT margin CQ: 1,460 / 14,094 × 100 = 10.4%; net margin CQ: 1,160 / 14,094 × 100 = 8.2%. Margin deltas are in percentage points (CQ margin - comparator margin).
ᵃ General Dynamics does not present a gross-profit line. Gross profit here is revenue less product and service operating costs ($7,337M + $4,574M = $11,911.0M in Q2 FY2026), excluding the separately reported G&A line of $723.0M; EBIT is struck after G&A and therefore equals the reported operating earnings of $1,460.0M (10-Q p. 3). §
Source: Form 10-Q for the quarterly period ended 5 July 2026 — Consolidated Statement of Earnings (10-Q p. 3); Q1 FY2026 column from the FL workbook quarterly series (Data sheet, col. 22), which reconciles to the six-month statement (10-Q p. 4) less the three-month column.
Segment results
| Segment | Revenue Q2 FY2026 ($M) | Revenue Q2 FY2025 ($M) | YoY Δ | Revenue Q1 FY2026 ($M) ᵇ | QoQ Δ | Op. Earnings Q2 FY2026 ($M) | Op. Earnings Q2 FY2025 ($M) | YoY Δ | Op. Margin Q2 FY2026 | Op. Margin Q2 FY2025 | Δ pp |
|---|---|---|---|---|---|---|---|---|---|---|---|
| Aerospace | 3,525 | 3,062 | +15.1% | 3,279 | +7.5% | 510 | 403 | +26.6% | 14.5% | 13.2% | +1.3 pp |
| Marine Systems | 4,660 | 4,220 | +10.4% | 4,343 | +7.3% | 342 | 291 | +17.5% | 7.3% | 6.9% | +0.4 pp |
| Combat Systems | 2,290 | 2,283 | +0.3% | 2,283 | +0.3% | 318 | 324 | -1.9% | 13.9% | 14.2% | -0.3 pp |
| Technologies | 3,619 | 3,476 | +4.1% | 3,576 | +1.2% | 339 | 332 | +2.1% | 9.4% | 9.6% | -0.2 pp |
| Corporate | — | — | — | — | — | (49) | (45) | +8.9% ᶜ | — | — | — |
| Total | $14,094.0M | $13,041.0M | +8.1% | $13,481.0M | +4.5% | $1,460.0M | $1,305.0M | +11.9% | 10.4% | 10.0% | +0.4 pp |
ᵇ Note L presents segment results for the three- and six-month periods only; the Q1 FY2026 column is the six-month figure less the three-month figure (Aerospace $6,804M - $3,525M = $3,279M, and so on). The four derived segment revenues sum to $13,481M and the derived segment operating earnings less $38M of Q1 corporate cost sum to $1,420M — reconciling exactly to $13,481.0M and $1,420.0M.
ᶜ Corporate is a net cost and is shown in parentheses; a positive Δ therefore means a larger cost, not an improvement. Corporate operating costs rose to $49M from $45M (10-Q p. 33) — a $4M headwind to group operating earnings, against full-year guidance of approximately $180M.
Source: Form 10-Q for the quarterly period ended 5 July 2026 — Note L, Segment Information (10-Q p. 22), and Review of Operating Segments (10-Q pp. 30–33).
Two segments produced 85.8% of the $1,053M revenue increase (Aerospace $463M, Marine Systems $440M) and 101.9% of the $155M operating-earnings increase (Aerospace $107M, Marine Systems $51M), with Combat Systems (-$6M) and Corporate (-$4M) offsetting. §
7.2 P&L Drivers
sources Revenue: All four segments grew, but the increase is concentrated: Aerospace added $463M (+15.1%) on 41 Gulfstream deliveries versus 38, split $338M aircraft manufacturing on “the number and mix of aircraft deliveries” and $125M aircraft services on higher FBO activity and maintenance demand (10-Q p. 30); Marine Systems added $440M (+10.4%), of which $281M is U.S. Navy ship construction on “increased material and labor volume on Columbia-class submarine construction and higher throughput on the John Lewis-class (T-AO-205) fleet replenishment oiler” and $159M is engineering and repair services (10-Q p. 31). Combat Systems was flat at +$7M because $95M of weapon systems and munitions growth (artillery production) and $38M of international military vehicles were almost entirely cancelled by a $126M decline in U.S. military vehicles on lower Army demand and the termination of the M10 Booker programme (10-Q p. 32). Technologies added $143M, $112M of it C5ISR (10-Q p. 33). Cost-reimbursement revenue rose to $4,251M from $3,800M and fixed-price to $8,870M from $8,477M, so the mix shifted 1.0 pp toward the lower-risk, lower-fee cost-reimbursement type (10-Q p. 13).
Cost and margin: COGS of $11,911.0M in Q2 FY2026 versus $11,092.0M in Q2 FY2025 grew +7.4% against revenue at +8.1%, worth +0.5 pp of gross margin; G&A of $723.0M against $644.0M grew +12.3%, taking G&A to 5.1% of revenue from 4.9% and giving back 0.2 pp — which is precisely the bridge from the +0.5 pp gross-margin gain to the +0.4 pp EBIT-margin gain (management’s “40 basis points”, 10-Q p. 29). D&A of $231.0M in Q2 FY2026 versus $223.0M in Q2 FY2025 rose only +3.6% on a 8.1% larger revenue base, so EBITDA margin expanded less (+0.3 pp) than EBIT margin. The margin movement is structural rather than accounting-driven: net favourable EAC catch-up adjustments contributed $29M of operating earnings this quarter against $31M in Q2 FY2025 (10-Q p. 11), so the estimate-release contribution fell $2M while operating earnings rose $155M — 100% of the increase was non-EAC. Sequentially, EBIT margin slipped 0.2 pp from Q1 FY2026’s 10.5% because Q1 carried $54M of EAC benefit (the $83M six-month figure less this quarter’s $29M) against $29M here.
Below the line: Interest, net of $49.0M fell 44.3% from $88.0M on the absence of commercial paper (none outstanding at 5 July 2026) and $500M of notes repaid in June 2026, a $39M tailwind that was partly offset by Other, net swinging to $(4)M from $15M — a $19M headwind driven by the pension non-service components, where net periodic pension cost rose to $23M from $7M (10-Q pp. 26, 35). [Rating and price target withdrawn — see the note at the top.]
7.3 Balance Sheet & Cash Flow
| Metric | Q2 FY2026 | Q2 FY2025 | YoY Δ | Q1 FY2026 | QoQ Δ |
|---|---|---|---|---|---|
| Cash ($M) | $4,333.0M | $1,523.0M | +184.5% | $3,654.0M | +18.6% |
| Net Debt ($M) | $3,183.0M | $7,189.0M | -55.7% | $4,360.0M | -27.0% |
| Net Debt / LTM EBITDA | 0.5× | — | — | — | — |
| Total Assets ($M) | $60,163.0M | $56,888.0M | +5.8% | $59,029.0M | +1.9% |
| Equity ($M) | $26,826.0M | $23,580.0M | +13.8% | $26,079.0M | +2.9% |
| OCF ($M) | $1,880.0M | $1,598.0M | +17.6% | $2,155.0M | -12.8% |
| CapEx ($M) ᵈ | $234.0M | $198.0M | +18.2% | $203.0M | +15.3% |
| FCF ($M) | $1,646.0M | $1,400.0M | +17.6% | $1,952.0M | -15.7% |
| Dividends Paid ($M) ᵈ | $429.0M | $402.0M | +6.7% | $405.0M | +5.9% |
YoY and QoQ percentages use the same formulas as 7.1 — net debt YoY: (3,183 - 7,189) / |7,189| × 100 = -55.7%; net debt QoQ: (3,183 - 4,360) / |4,360| × 100 = -27.0%.
ᵈ CapEx and dividends are stored as positive magnitudes in the workbook and shown as such here; both are cash outflows. A positive Δ therefore means a larger outflow.
Net Debt / LTM EBITDA: LTM EBITDA = Q3 FY2025 $1,557.0M + Q4 FY2025 $1,704.0M + Q1 FY2026 $1,652.0M + Q2 FY2026 $1,691.0M = $6,604.0M (the two 2025 quarters are taken from the workbook’s standalone quarterly series, Data sheet row 20, cols 20–21, because the section-7 data pack carries only the CQ/PYSQ/PQ columns). Net Debt $3,183.0M / $6,604.0M = 0.5×. Net debt itself reconciles to the filing: total debt of $7,516M less cash of $4,333.0M (10-Q pp. 6, 18).
Source: Form 10-Q for the quarterly period ended 5 July 2026 — Consolidated Balance Sheet (10-Q p. 6) and Consolidated Statement of Cash Flows (10-Q p. 7); standalone-quarter cash-flow figures derived by the pipeline from the six-month statement less the prior 10-Q’s three-month statement.
Balance sheet note: The material movement is deleveraging: cash rose to $4,333.0M from $2,333M at 31 December 2025 while total debt fell to $7,516M from $8,013M after the June 2026 repayment of $500M of 1.150% notes from cash on hand, leaving no commercial paper outstanding and net debt at $3,183.0M — down 27.0% in a single quarter and 55.7% year over year (10-Q pp. 6, 18). On the asset side, unbilled receivables rose $875M to $9,255M and inventories fell $135M to $9,097M as the Gulfstream build released into the 79 six-month deliveries, while customer advances and deposits rose $1,210M to $11,034M — the single largest balance-sheet change and the reason the cash build is not a pure earnings artefact (10-Q pp. 6, 17).
Cash flow note: FCF conversion = FCF / Net Income = $1,646.0M / $1,160.0M = 141.9% in Q2 FY2026, against 138.1% in Q2 FY2025 and 173.5% in Q1 FY2026; on a six-month basis the filing reports operating cash flow at 177% and free cash flow at 157% of net earnings (10-Q p. 39). Cash did more than track earnings, but the composition warrants a discount: of the $2,585M six-month improvement in operating cash flow (to $4,035M from $1,450M), $1,062M is the swing in customer advances and deposits and $463M is the swing in the deferred income tax provision (a $365M non-cash charge this year against a $98M benefit last year) — together 59.0% of the improvement, neither of which is earnings conversion (10-Q p. 7). [Rating and price target withdrawn — see the note at the top.]
7.4 Footnote Review
sources Page references are the printed page numbers of the Form 10-Q for the quarterly period ended 5 July 2026. Every note (A through O) was read in full in this session, together with Part II Items 1 through 6.
Note A — Summary of Significant Accounting Policies (10-Q p. 9) Basis of consolidation is unchanged: wholly and majority-owned subsidiaries, all intercompany balances eliminated, contract assets and liabilities classified current per industry practice. The note restates that fiscal quarters are typically 13 weeks and that first- and fourth-quarter day counts vary because the fiscal year ends 31 December — the basis for the 186-day versus 180-day six-month comparison in 7.3. Gross PP&E rose to $15,408M from $15,130M with accumulated depreciation of $7,833M against $7,605M, giving net PP&E of $7,575.0M versus $7,525M. Recent accounting pronouncements are stated as not expected to be material. Confirmed unchanged in substance vs. Q2 FY2025 (10-Q p. 9); no accounting-policy change affects comparability this quarter.
Note B — Revenue (10-Q pp. 10–15) The material content is the estimate-at-completion disclosure and it is the single most thesis-relevant item in this filing. Aggregate adjustments in contract estimates increased revenue by $78M (Q2 FY2025: $55M), operating earnings by $29M (Q2 FY2025: $31M) and diluted EPS by $0.08 (Q2 FY2025: $0.09); six-month figures are $135M / $83M / $0.24 against $133M / $62M / $0.18 (10-Q p. 11). “No adjustment on any one contract was material.” Changed favourably vs. Q2 FY2025 at the quarterly level and unfavourably at the six-month level: the quarterly EAC contribution fell from 2.4% of operating earnings to 2.0%, so none of the $155M operating-earnings increase came from estimate releases — the direct answer to Section 3’s earnings-quality caveat and to the separate valuation’s upgrade trigger 2. But the six-month contribution rose to 2.9% from 2.4%, which locates the entire increase in Q1 FY2026 ($54M against $31M). The tracked-vehicle variable-consideration warning is repeated verbatim from the 10-K: “It is reasonably possible that the actual amount of variable consideration realized could be less than our estimate, which could have a material unfavorable impact on our results of operations” (10-Q p. 11) — unchanged, still unquantified, still unaccrued. Total backlog (remaining performance obligations) is $136.5 billion, with approximately 50% expected in revenue by year-end 2027 and a further 30% by year-end 2029 (10-Q p. 10). Over-time revenue was 75% of the total against 76% in Q2 FY2025; point-in-time 25% against 24% — a 1 pp shift toward Gulfstream delivery-based recognition. Revenue recognised from the opening contract-liability balance was $2.5 billion for the quarter and $5.3 billion for the six months, against $2.1 billion and $4.7 billion (10-Q p. 15). Disaggregation shows U.S. government revenue of $9,480M against $9,021M and non-U.S. commercial revenue of $1,650M against $1,178M, the latter a 40.1% increase concentrated in Aerospace (10-Q p. 14).
Note C — Earnings Per Share (10-Q p. 15) Basic weighted average shares 270,156 thousand against 268,138 thousand; the dilutive effect of options and restricted stock/RSUs 3,366 thousand against 2,807 thousand; diluted 273,522 thousand against 270,945 thousand. Antidilutive options excluded totalled 1,027 thousand for the quarter against 1,814 thousand. Changed vs. Q2 FY2025 and it matters: the diluted count is up 0.9% year over year, not down. Section 3 documented a five-year EPS CAGR running ahead of the net-income CAGR on the buyback wedge; at the current repurchase pace that wedge is now a small headwind, and it explains why EPS grew 13.4% against net income at 14.4%.
Note D — Income Taxes (10-Q p. 16) The net deferred tax liability increased to $1,310M from $937M at 31 December 2025 (deferred tax asset flat at $19M, deferred tax liability $1,329M against $956M) — a $373M increase consistent with the $365M deferred provision in the cash-flow statement. The company remains in the IRS Compliance Assurance Process (Bridge Plus phase) with federal returns examined through 2024. Unrecognised tax benefits are stated as not material at 5 July 2026, with no positions reasonably possible to vary significantly over the next 12 months. Pillar Two is stated as not expected to be material because the company does not have material operations in sub-15% jurisdictions. [Rating and price target withdrawn — see the note at the top.] Changed vs. Q2 FY2025 in one respect worth noting: the tax charge is increasingly deferred rather than paid — six-month cash income tax payments were $273M against a total provision of $491M (10-Q pp. 7, 4). This is a timing benefit to cash, not an earnings-quality flag, but it is the mechanical reason the reported 177% six-month OCF-to-earnings ratio overstates durable conversion.
Note E — Unbilled Receivables (10-Q pp. 16–17) Net unbilled receivables rose to $9,255M from $8,380M at 31 December 2025; gross unbilled revenue $46,106M against $43,059M, less advances and progress billings of $36,851M against $34,679M. The Combat Systems international tracked-vehicle contract accounts for $1.3 billion at both 5 July 2026 and 31 December 2025, with management stating “We currently expect this balance to decline as contract deliveries continue” (10-Q p. 17). Unchanged vs. the 10-K balance — and that is the finding. Section 2 graded this a RED risk on the combination of a management-flagged variable-consideration estimate and a concentrated unbilled position expected to unwind through early 2028; two quarters into 2026 the balance has not begun to unwind while total unbilled receivables grew 10.4% against six-month revenue growth of 9.1%. Not a deterioration, but not the de-risking the 10-K language implied either. This is the single most important item to track next quarter.
Note F — Inventories (10-Q p. 17) Total inventories fell to $9,097M from $9,232M: work in process $5,824M against $5,938M and raw materials $3,149M against $3,248M, both consistent with 79 six-month Gulfstream deliveries drawing down the production-lot build. Two small lines moved the other way — finished goods to $77M from $18M and pre-owned aircraft to $47M from $28M. Changed vs. year-end in the right direction on the aggregate. The pre-owned balance is immaterial at 0.5% of inventory but is the line that would signal softening business-jet demand through trade-ins, and it is worth watching alongside the trade-in commitment disclosure in Note J.
Note G — Goodwill and Intangible Assets (10-Q pp. 17–18) Goodwill fell to $20,927M from $21,009M, the $81M reduction “consisted primarily of adjustments for foreign currency translation” plus a $1M purchase-price-allocation adjustment; there was no impairment charge. Technologies carries $14,515M of the total (against $14,523M), still net of $1.8 billion of accumulated impairment losses. Net intangibles fell to $1,281M from $1,375M; amortisation expense was $43M for the quarter and $87M for the six months, identical in both years. No change to the separate valuation’s book-value sensitivity: Technologies goodwill equals 54.1% of the $26,826.0M of shareholders’ equity, and no fresh quantitative impairment test is disclosed in an interim filing, so the stale-cushion concern documented in Section 2 stands exactly as written.
Note H — Debt (10-Q p. 18) [Rating and price target withdrawn — see the note at the top.] A further $500M of 2.125% notes matures in August 2026, which management “currently plan[s] to repay… using cash on hand.” No commercial paper was outstanding at 5 July 2026. The $4 billion committed bank credit facility expires in March 2027 and may be renewed or replaced. The maturity ladder is well spread, with no single year above $1,000M and the longest notes running to April 2050. On covenants the filing states: “Our financing arrangements contain a number of customary covenants and restrictions. We were in compliance with all covenants and restrictions on July 5, 2026.” No covenant level or actual ratio is disclosed — the filing gives compliance status only, so no headroom calculation is possible from this document. Changed vs. [Rating and price target withdrawn — see the note at the top.] The credit facility expiry is the one forward item to diarise.
Note I — Other Liabilities (10-Q p. 19) Total other current liabilities rose to $3,601M from $3,288M (salaries and wages $1,174M against $1,125M; dividends payable $431M against $407M; lease liabilities $330M against $299M; workers’ compensation $240M against $236M). Total other noncurrent liabilities rose to $8,312M from $7,824M, with lease liabilities at $1,633M against $1,477M and retirement benefits falling to $1,071M from $1,134M. Customer deposits on commercial contracts — the noncurrent Gulfstream deposit balance — edged down to $2,607M from $2,649M. Read against the $1,210M increase in current customer advances and deposits, the composition of the order book’s cash is shifting toward near-term deliveries, which is consistent with a 1.5-to-1 Aerospace book-to-bill converting quickly rather than with deposits building for distant slots.
Note J — Commitments and Contingencies (10-Q pp. 19–21) — see also the dedicated litigation entry below Beyond litigation, the note discloses: environmental matters, where the company expects a significant percentage of remediation and compliance costs to remain allowable and recoverable under U.S. government contracts and judges neither its recorded liability nor the range of reasonably possible additional loss to be material; government-contract audits and investigations, including requests for equitable adjustment, judged resolvable without material impact; letters of credit, bank guarantees and surety bonds totalling approximately $2.1 billion at 5 July 2026; Gulfstream aircraft trade-in commitments, where “the estimated change in fair market values from the date of the commitments was not material”; and product warranties, where the liability rose to $678M from $656M over six months on $78M of warranty expense (against $66M) and $58M of payments (against $63M). Warranty expense grew 18.2% against six-month revenue growth of 9.1% — a small absolute number (0.28% of six-month revenue against 0.26%) but the first quantitative sign of cost on delivered product outpacing volume, and worth carrying forward.
Note K — Shareholders’ Equity (10-Q p. 21) Six-month repurchases were 0.9 million shares for $319M, against 2.4 million shares for $600M in the prior-year period — a 46.8% reduction in capital returned via buyback, with 5.8 million shares (2.2% of shares outstanding) remaining authorised. Dividends declared were $1.59 per share for the quarter and $3.18 for the six months, against $1.50 and $3.00; dividends paid were $429.0M and $834M against $402.0M and $785M. The March 2026 increase to $1.59 was the 29th consecutive annual increase (10-Q p. 38). Accumulated other comprehensive loss widened to $(583)M from $(483)M, driven by foreign currency translation falling to $714M from $873M, partly offset by retirement plans’ funded status improving to $(1,296)M from $(1,366)M. Changed vs. Q2 FY2025: the dividend is intact and growing at 6.0% per share, but the buyback has been cut to dilution coverage only and is no longer covering it — which is why the diluted share count rose (Note C). the separate valuation’s upgrade trigger 5 (buybacks stepped up materially) has moved away from being met.
Note L — Segment Information (10-Q pp. 22–23) Four operating segments, unchanged; segment profitability measured on operating earnings, which exclude net interest and other income and expense — no change to segment composition or measurement basis vs. Q2 FY2025, so the year-over-year segment comparison in 7.1 is clean. Segment detail: capital expenditures of $234M against $198M, with Marine Systems taking $117M of the total (against $112M) and Combat Systems up 83.3% to $33M from $18M; D&A of $231M against $223M; identifiable assets of $60,163.0M against $57,249M at year-end, of which Corporate rose to $6,001M from $3,758M — that $2,243M increase is the cash build, and it means the operating segments’ identifiable assets were broadly flat, with Aerospace actually falling to $16,681M from $16,815M on the inventory release.
Note M — Fair Value (10-Q pp. 23–24) No significant non-financial assets or liabilities measured at fair value at either date. [Rating and price target withdrawn — see the note at the top.] On a fair-value basis the debt burden is smaller than the balance sheet shows, which reinforces rather than qualifies the deleveraging read. Marketable securities held in trust and other investments total $267M; cash flow hedge assets are $76M against liabilities of $82M. [Rating and price target withdrawn — see the note at the top.]
Note N — Derivative Financial Instruments and Hedging Activities (10-Q pp. 24–25) Notional forward exchange contracts outstanding were $8.2 billion against $8.5 billion at year-end; marketable securities in trust $212M against $216M; cash and equivalents $4.3 billion against $2.3 billion. The company states that gains and losses on non-qualifying derivatives, amounts reclassified from AOCL on qualified hedges, and the translation of non-U.S. operations’ revenue and earnings were all not material for the three- and six-month periods in both years, and that no material fair-value or net-investment hedges were designated. Confirmed unchanged in policy and substance vs. Q2 FY2025 (10-Q pp. 24–25). Note that the $159M six-month negative foreign currency translation adjustment ran through AOCL, not earnings — so the euro-denominated Combat Systems growth cited in the segment discussion is a real-volume story, not an FX one.
Note O — Retirement Plans (10-Q p. 26) Net periodic pension cost rose to $23M for the quarter from $7M (six months: $47M against $16M), driven by the net actuarial loss rising to $50M from $27M and the expected return on plan assets falling to $179M from $185M, partly offset by interest cost falling to $137M from $150M. Other post-retirement benefits remain a credit of $(8)M against $(9)M. Changed vs. Q2 FY2025 — a $16M quarterly headwind — but it sits below the operating line. The note restates that the non-service component is reported in other income (expense), confirming Section 3’s finding that pension geography is unchanged and that operating earnings are neither flattered nor depressed by a reclassification. This is the mechanical driver of Other, net swinging to $(4)M from $15M. The FAR/CAS recovery mechanism on government contracts is unchanged, with the deferred credit still in other noncurrent liabilities.
Related-party transactions (10-Q pp. 9, 40–41) General Dynamics has no controlling shareholder and this 10-Q contains no related-party transactions note — the same finding Section 2 recorded from the 10-K, where a full footnote read surfaced no material related-party transactions. This is documented rather than assumed: the basis-of-consolidation policy states only that the statements include wholly owned and majority-owned subsidiaries with all intercompany balances and transactions eliminated (10-Q p. 9), and the balance sheet carries no noncontrolling-interest or equity-method line at either date (10-Q p. 6). The only intra-group relationship the filing quantifies is the guarantor structure. The combined obligor group (the parent plus the 100%-owned guarantor subsidiaries) reported six-month revenue of $11,022M against full-year 2025 revenue of $20,716M and net earnings of $588M against $839M; its cash was $2,088M against $482M at year-end, total assets $13,954M against $11,290M and total liabilities $14,106M against $13,822M (10-Q pp. 40–41). Total obligor liabilities exceed total obligor assets by $152M, because the presentation excludes the group’s net investment in and earnings of non-guarantor subsidiaries; holders of the notes have a direct claim only against the parent and the guarantors. That is a structural-subordination disclosure, not a solvency signal — consolidated equity is $26,826.0M — but it is the one place the filing quantifies an intra-group relationship, and the obligor group’s liability coverage did not improve year on year. No related-party terms changed because there are none to change.
Contingencies and litigation (10-Q pp. 19–21, 43) 1. No-poach antitrust class action (Sherman Act, naval architects and marine engineers). Filed 6 October 2023 in the Eastern District of Virginia against General Dynamics, certain subsidiaries and other companies, alleging a conspiracy not to solicit each other’s naval architects and marine engineers and seeking trebled monetary damages, attorneys’ fees and equitable relief for a class running back to 1 January 2000. The Fourth Circuit reversed the District Court’s dismissal on 9 May 2025; defendants petitioned for certiorari on 11 September 2025; and “On May 18, 2026, the plaintiffs dismissed with prejudice the case against General Dynamics and its subsidiaries” (10-Q p. 19). This is the largest single change vs. the 10-K and vs. [Rating and price target withdrawn — see the note at the top.] Amount at stake: previously unbounded and unaccrued (no range was estimable, so nothing was ever recorded); now nil for this defendant, with no accrual to release and therefore no earnings effect in either direction. 2. Other claims and proceedings incidental to the ordinary course — government investigations and claims, environmental, asbestos-related and employee-related matters. No amounts stated; management believes potential liabilities individually or in aggregate will not be material (10-Q p. 19). Unchanged vs. Q2 FY2025. 3. Environmental / PRP designations — no amount at stake disclosed; costs largely recoverable as allowable contract costs; neither the recorded liability nor the reasonably possible additional loss judged material (10-Q pp. 19–20). Unchanged. 4. Government contract audits, REAs and claims — no amount disclosed; expected to resolve without material impact (10-Q p. 20). Unchanged. 5. Unregistered securities matter (new this quarter). Up to approximately 300,000 shares were offered and sold to participants in three General Dynamics 401(k) plans without registration under the Securities Act of 1933. The shares were pre-existing shares bought on the open market by a third-party administrator, so the company received no proceeds and the shares were already treated as outstanding. A Form S-8 was filed on 1 July 2026 and a rescission offer is intended for participants who purchased between 1 July 2025 and 30 June 2026; the company does not expect a material impact (10-Q pp. 43–44). No accrual disclosed. This is a compliance lapse rather than a financial exposure — at the June average price of $346.62, 300,000 shares is roughly $104M of gross rescission scope before any offset, and the rescission price would be netted against current value — but it is new, it is a controls observation, and Item 4 nonetheless concluded disclosure controls were effective with no change in internal control over financial reporting during the quarter (10-Q p. 41). 6. Letters of credit, bank guarantees and surety bonds** of approximately $2.1 billion, plus payment/performance guarantees of subsidiaries (10-Q p. 20). Off-balance-sheet, ordinary course, unchanged in character.
Part II Item 1 adds nothing beyond Note J, and Item 1A states there have been no material changes to the risk factors from the 2025 Form 10-K (10-Q p. 43) — so Section 2 remain the operative risk register, less the extinguished antitrust matter.
Subsequent events (10-Q pp. 18, 38, 43–44) There is no dedicated subsequent-events note in this filing, and none is required to be flagged; the notes run A through O and end with retirement plans (10-Q p. 26). [Rating and price target withdrawn — see the note at the top.] Item 5 confirms no director or officer adopted or terminated a Rule 10b5-1 or non-Rule 10b5-1 trading arrangement during the quarter (10-Q p. 44). The report was signed 29 July 2026 (10-Q p. 45).
7.5 What Changed This Quarter
sources [Rating and price target withdrawn — see the note at the top.] A treble-damages exposure that was unbounded, unaccrued and escalating is now closed for this defendant, so the first limb of that third caveat is relieved outright — the second, the tracked-vehicle variable-consideration exposure, is not (see the bullet below). Because nothing was ever accrued, there is no P&L effect — the gain is entirely in the removal of a left-tail outcome from the distribution. - The quarter’s margin expansion was earned, not released. Net favourable EAC adjustments added $29M to operating earnings against $31M a year ago (10-Q p. 11) — 2.0% of operating earnings against 2.4% — while operating earnings rose $155M and operating margin rose to 10.4% from 10.0%. That is 100% of the increase from operating performance, precisely the evidence the separate valuation’s upgrade trigger 2 demanded. The qualification: at six months the EAC contribution rose to $83M from $62M, so Q1 FY2026 alone carried $54M against $31M. One clean quarter, not yet a clean year. - The international tracked-vehicle unbilled receivable has not started to unwind: $1.3 billion at 5 July 2026, identical to 31 December 2025, against management’s stated expectation of decline (10-Q p. 17). Section 2’s second RED risk is therefore unchanged in size while total unbilled receivables grew 10.4% to $9,255M against six-month revenue growth of 9.1%. No write-down and no negative EAC, but no de-risking either — and this is the contract where management repeats that realised variable consideration “could be less than our estimate.” - Backlog rose to $136,498M from $130,840M at the end of Q1 FY2026, with funded backlog up to $104,111M from $98,120M (10-Q p. 36). Aerospace booked at 1.5-to-1 in the quarter and defense at 1.4-to-1, driven by Virginia-class submarine construction and armoured combat support vehicle awards (10-Q pp. 36–37). the separate valuation’s upgrade trigger 3 — book-to-bill sustained above one-to-one alongside rising Gulfstream deliveries (41 against 38) and Marine Systems margin recovery (7.3% from 6.9%) — is met on every limb. - Net debt fell to $3,183.0M, 0.5× LTM EBITDA, from $7,189.0M a year ago, after $500M of notes repaid from cash and no issuance at all in the six months (against $696M of commercial paper and $747M of notes in the prior-year period). Section 5’s finding that GD carries the lowest net leverage in the peer group is reinforced, and the debt’s fair value sits $548M below carrying value (10-Q p. 24). [Rating and price target withdrawn — see the note at the top.] - The buyback wedge has reversed. Six-month repurchases were $319M against $600M, and the diluted share count rose 0.9% to 273,522 thousand (10-Q pp. 15, 21). EPS grew 13.4% against net income at 14.4%. Section 3 documented a five-year EPS CAGR flattered by shrinking share count; at this pace that support is gone, and the separate valuation’s upgrade trigger 5 has moved further out of reach even as the balance sheet capacity to fund it has grown. - Six-month operating cash flow of $4,035M (177% of net earnings) is materially lower quality than the headline. Of the $2,585M improvement, $1,062M is the swing in customer advances and deposits and $463M the swing in the deferred tax provision — 59.0% from customer prepayment and a non-cash charge rather than earnings conversion (10-Q p. 7). Customer advances are real cash but unwind into future revenue without future cash. This is why the separate valuation’s upgrade trigger 4 — full-year FCF conversion sustained above one-to-one as the Gulfstream inventory build releases — is not yet demonstrated on this evidence: the headline ratio clears the bar, but the composition does not yet prove it is the inventory release doing the work. Section 3’s Q1 seasonality caveat also did not apply this year: Q1 FY2026 operating cash flow was a positive $2,155.0M against negative $148M in Q1 FY2025. - Combat Systems is the one segment going backwards: revenue +0.3% and operating margin down to 13.9% from 14.2% on programme mix, as $126M of lost U.S. military vehicle revenue (lower Army demand and the M10 Booker termination) absorbed $95M of munitions growth and $38M of international vehicle growth (10-Q p. 32). Full-year guidance of approximately 13.8% implies no second-half recovery. This is the segment that also holds the tracked-vehicle exposure and $2,790M of goodwill. - A new securities-law compliance item: approximately 300,000 shares sold to 401(k) participants without registration, an S-8 filed 1 July 2026 and a rescission offer intended (10-Q pp. 43–44). Not financially material on the company’s assessment and not accrued, but it is new, and it arrived in a quarter where management concluded disclosure controls were effective with no ICFR change (10-Q p. 41). - Technologies goodwill of $14,515M still equals 54.1% of shareholders’ equity, with no interim impairment test disclosed and goodwill down only $81M on foreign currency translation (10-Q pp. 17–18). Segment revenue grew 4.1% and margin slipped to 9.4% from 9.6%, in line with the approximately 9.4% full-year guide. the separate valuation’s book-value sensitivity is unchanged — neither confirmed nor relieved by this filing.
7.6 Portfolio Decision
sources [Rating and price target withdrawn — see the note at the top.] This quarter did the two things the bull case needed and none of the things the bear case needed, and it still does not close the valuation gap. [Rating and price target withdrawn — see the note at the top.] Backlog rose to $136,498M with Aerospace booking at 1.5-to-1, and net debt fell to $3,183.0M — 0.5× LTM EBITDA. [Rating and price target withdrawn — see the note at the top.] The most disciplined reading of the price is the company’s own: General Dynamics repurchased 292,894 shares in June 2026 at an average of $346.62 (10-Q p. 43) — within 1% of our composite fair value and 10.1% below the current quote. A quarter that improves the quality of a thesis without improving its price is a quarter to hold through, not to add to. [Rating and price target withdrawn — see the note at the top.]
What would change this view: [Rating and price target withdrawn — see the note at the top.] Either the price comes to the value, or the value rises on two clean quarters plus visible de-risking of the last RED exposure. [Rating and price target withdrawn — see the note at the top.]
Report Versions
Every published version of this report, newest first — each one kept so a reader can see what changed and when.
| Version date | Files |
|---|---|
| 2026-08-19 Current | Model (Excel) |
| 2026-08-10 | Model (Excel) |
| 2026-08-06 | Model (Excel) |
| 2026-08-05 | Model (Excel) |