
Diamondback Energy
Section 1 — Business Overview, Operations & Competitive Positioning
1.1 The Business
sources Diamondback Energy is a pure-play Permian Basin oil and gas producer: it drills, completes and operates its own wells across a large, contiguous acreage position in West Texas and southeastern New Mexico, and sells the resulting oil, natural gas and natural gas liquids into the market at prevailing prices. It is a price-taker in a commodity it cannot influence, so its economics are governed by two things it can influence — the cost of getting a barrel out of the ground and the depth and quality of the drilling inventory it holds — and one it cannot: the price of oil.
Substantially all of the company’s revenue comes from the sale of its own oil, gas and NGL production, and the portfolio is oil-weighted. Reported revenue reached $15,026.0M in FY2025, up from $11,066.0M in FY2024 and $8,412.0M in FY2023 — a step-change that is not organic. It reflects the first full year of the Endeavor Energy Resources acquisition (closed September 2024), layered on the Double Eagle acquisition (Midland Basin, closed April 2025). Set against a longer arc — $446.7M in FY2015 rising through $3,964.0M in FY2019 and $6,797.0M in FY2021 — the trajectory is one of serial, acquisition-led expansion rather than steady organic compounding, and the reader should treat the pre-2024 and post-2024 periods as different companies in scale, share count and cost base. A portion of the FY2025 top line is also low-margin third-party oil bought and resold to fill transportation commitments, so headline revenue somewhat overstates the size of the underlying production business; that distinction is developed in Section 3.
Measured in the units the business actually runs on — barrels — the scale-up is even starker than the dollar figures suggest. Average daily production rose from 33,098 BOE/d in FY2015 to 598,284 BOE/d in FY2024 and 921,036 BOE/d in FY2025; on a full-year basis the company lifted 336.2 MMBOE in FY2025, against 219.0 MMBOE the prior year and just 12.1 MMBOE a decade earlier. The proved reserve base tells the same story: 3,617.9 MMBOE at year-end FY2025, versus 3,557.4 MMBOE at FY2024 and 156.9 MMBOE in FY2015. The largest single steps — the leap in reserves into FY2024 and the near-doubling of daily volumes into FY2025 — line up with the Endeavor and Double Eagle closings, not with a drill-bit acceleration, and confirm what the revenue arc already implies: this is an acquisition-built production base, consistent with the serial M&A described above.
One characteristic of that base should be stated plainly, because it sits in mild tension with how the company presents itself. Diamondback describes itself as an oil-weighted producer, and it is — but oil’s share of total production has drifted down steadily across the history, from 75.0% of volumes in FY2015 to 60.0% in FY2020 and 54.0% in FY2025, with the balance in natural gas and NGLs. This is a genuine feature of the asset base rather than a rounding detail: a falling oil cut changes the character of the revenue stream, since a barrel of oil equivalent made up of gas and NGLs is worth far less than one made up of crude. What the declining oil weighting implies for realised value per barrel is left to Section 3; here it is enough to record that the portfolio is somewhat less oil-weighted than it once was.
The plainest window on the company’s economics is what it actually receives per unit at the wellhead. In FY2025 Diamondback realised $64.04 per barrel of oil, $0.89 per Mcf of natural gas and $17.88 per barrel of NGLs — each figure stated before the effect of derivative settlements, i.e. unhedged, a distinction that matters because hedging materially changed the cash outcome in some years. Oil realisations swing widely with the cycle, from $36.41 in the FY2020 trough to $93.85 at the FY2022 peak; gas realisations are more volatile still, having fallen as low as $0.32 per Mcf in FY2024. Because oil remains the dominant revenue contributor despite the mix shift, it is the oil realisation that governs the business.
Operating Profile
| Metric | FY2021 | FY2022 | FY2023 | FY2024 | FY2025 |
|---|---|---|---|---|---|
| Production (MMBOE) | 137.0 | 140.9 | 163.4 | 219.0 | 336.2 |
| Oil % of production | 60.0% | 58.0% | 59.0% | 56.0% | 54.0% |
| Realized oil, unhedged ($/Bbl) | $66.19 | $93.85 | $75.68 | $73.52 | $64.04 |
| Proved reserves (MMBOE) | 1,789.0 | 2,033.0 | 2,177.8 | 3,557.4 | 3,617.9 |
Source: Company SEC filings (10-K), including the Supplemental Oil & Gas Operations (Unaudited) disclosure; see Appendix A.1.
Diamondback is listed on the Nasdaq under the ticker FANG. [Rating and price target withdrawn — see the note at the top.] The company is run as a single upstream business with no reportable segments beyond it.
The one accounting feature a reader must carry into the rest of this report is the full cost method. Under it, Diamondback capitalizes essentially all of its acquisition, exploration and development costs into a single pool, and every quarter it runs a “ceiling test” that caps the carrying value of that pool at the present value of its proved reserves computed on a trailing-twelve-month average SEC price. When that trailing price falls, the cap falls with it, and any excess book value is written off as a non-cash impairment — even if operations, wells and reserves are performing normally. That reserve base is no longer an abstraction: it stands at 3,617.9 MMBOE of proved reserves at year-end FY2025, and the ceiling test caps the book value of the oil and gas pool against the present value of exactly those barrels at the trailing average price. In FY2025 that mechanic produced exactly such a charge, which collapsed reported operating income and depressed the EBIT margin shown in the Key Information table below; it was driven by the trailing SEC oil price falling year-on-year, and it is not closed — a further material ceiling-test charge has since been recorded in the first quarter of 2026. The write-down did not reduce cash flow, and it is the reason the balance sheet carries no goodwill (E&P purchase price is absorbed into oil and gas property values rather than left as a residual). This is analysed in full in Section 3, but the framing matters here so the reader does not mistake an accounting catch-up for an operating failure.
Key Information
| Item | Value |
|---|---|
| Ticker | FANG |
| Sector / Industry | Energy / Oil & Gas Exploration & Production |
| Report Date | 2026-08-20 |
| Most Recent FY Revenue | $15,026.0M |
| EBIT Margin (Most Recent FY) | 8.4% |
| Diluted Weighted-Average Shares | 289M |
| Current Price | $208.45 |
Source: Company SEC filings (10-K); see Appendix A.1.
1.2 Operating Segments
sources Diamondback reports a single reportable segment — upstream (exploration and production). This is not a presentation choice that hides a diversified business; it reflects economic reality. There is one economic engine here — producing oil and gas from the Permian — and the single variable that drives it is the realized price of oil, given the portfolio’s oil weighting. The workbook’s segment scaffold carries an “All Other” / midstream line (labelled “Midstream Operations” in older filings), but it does not represent a genuine second business with independent economics, and no analytical weight should be placed on the split. The company is best understood as one segment, full stop.
The one structural nuance worth flagging is Viper Energy, a separately publicly traded mineral and royalty subsidiary that Diamondback controls and therefore consolidates in full, but of which it owns only a minority economic interest on a fully diluted basis. Viper’s mineral interests underlie a large royalty footprint across the Midland and Delaware basins — a portion of which Diamondback itself operates — and Viper runs its own debt, equity offerings and M&A. Because it is consolidated in full while a large and growing share of its economics belongs to Viper’s outside public shareholders, the consolidated revenue, reserves, debt and cash flow shown throughout this report overstate what actually accrues to Diamondback stockholders. The structure is qualitative context here; the size of the non-controlling interest and its effect on per-share economics is quantified in Section 3.
The system, then, is simple and tightly coupled: a large operated upstream base generating production and cash flow, with a capital-light royalty vehicle (Viper) layered on top capturing a fee-like slice of Permian activity. The synergy is that the two are concentrated in the same rock the company knows best; the fragility is that both are exposed to the same single commodity and the same single basin, so there is no internal diversification to cushion a downturn.
1.3 Geographic Exposure
sources Geographic exposure is the defining fact of this business: essentially all of Diamondback’s producing properties sit in the Permian Basin — the Spraberry and Wolfcamp of the Midland Basin (where the bulk of the acreage lies) and the Wolfcamp and Bone Spring of the Delaware Basin — spanning West Texas and southeastern New Mexico. Revenue is effectively entirely domestic and US-dollar denominated, so there is no meaningful foreign-currency exposure. The concentration is deliberate and, management argues, an operational strength (contiguous acreage, one operating environment, shared infrastructure); it is simultaneously the company’s single largest risk, since regional takeaway constraints, regional regulation (including produced-water disposal and induced-seismicity restrictions), regional labour and service-cost pressure, and severe regional weather all hit the entire asset base at once. That concentration risk is developed in Section 2; here it is enough to note that this is a single-basin, single-commodity company with no geographic hedge.
1.4 Management Team
sources Diamondback is run by a founder-influenced executive team whose principal asset, on management’s own telling, is deep operational experience in horizontal drilling and completions in the Permian — the capability the company argues reduces execution risk and underpins its low-cost claim. There was no CEO change in the period and no restatement, so leadership continuity is intact through a period of intense M&A. The reserve-governance process is a point of quality: reserves are estimated internally and independently audited by Ryder Scott across the entirety of the proved base, with quarterly review, senior sign-off and Audit Committee oversight, and a stated policy that no employee’s compensation is tied to the volume of reserves booked — a sensible control given that the reserve base is the company’s real asset.
The clear governance risk sits above the executive team rather than within it. Following the Endeavor combination, the former Endeavor equityholders (including the SGF holder group) hold a very large block of Diamondback stock and, under a stockholders agreement, appointed multiple directors to the board and secured consent rights over certain corporate actions — a de facto blocking position for a single, concentrated holder bloc. That bloc has also been a related-party seller, with the company repurchasing stock directly from it. This is a minority-protection and control-concentration concern rather than an operating one, and it is treated in depth in Section 2. Two structural thinness points round out the picture: the company has no employment agreements with its executives and maintains no key-person life insurance, and it acknowledges that many key responsibilities rest with a small number of individuals — a bench that is thinner than the company’s scale would suggest.
1.5 Capital Allocation Track Record
| Year | Dividends Paid ($M) | Share Repurchases ($M) | CapEx ($M) |
|---|---|---|---|
| FY2021 | $312.0M | $431.0M | $1,487.0M |
| FY2022 | $1,572.0M | $1,098.0M | $1,938.0M |
| FY2023 | $1,444.0M | $840.0M | $2,701.0M |
| FY2024 | $1,578.0M | $959.0M | $2,867.0M |
| FY2025 | $1,156.0M | $2,010.0M | $3,523.0M |
Source: Company SEC filings (10-K); see Appendix A.1.
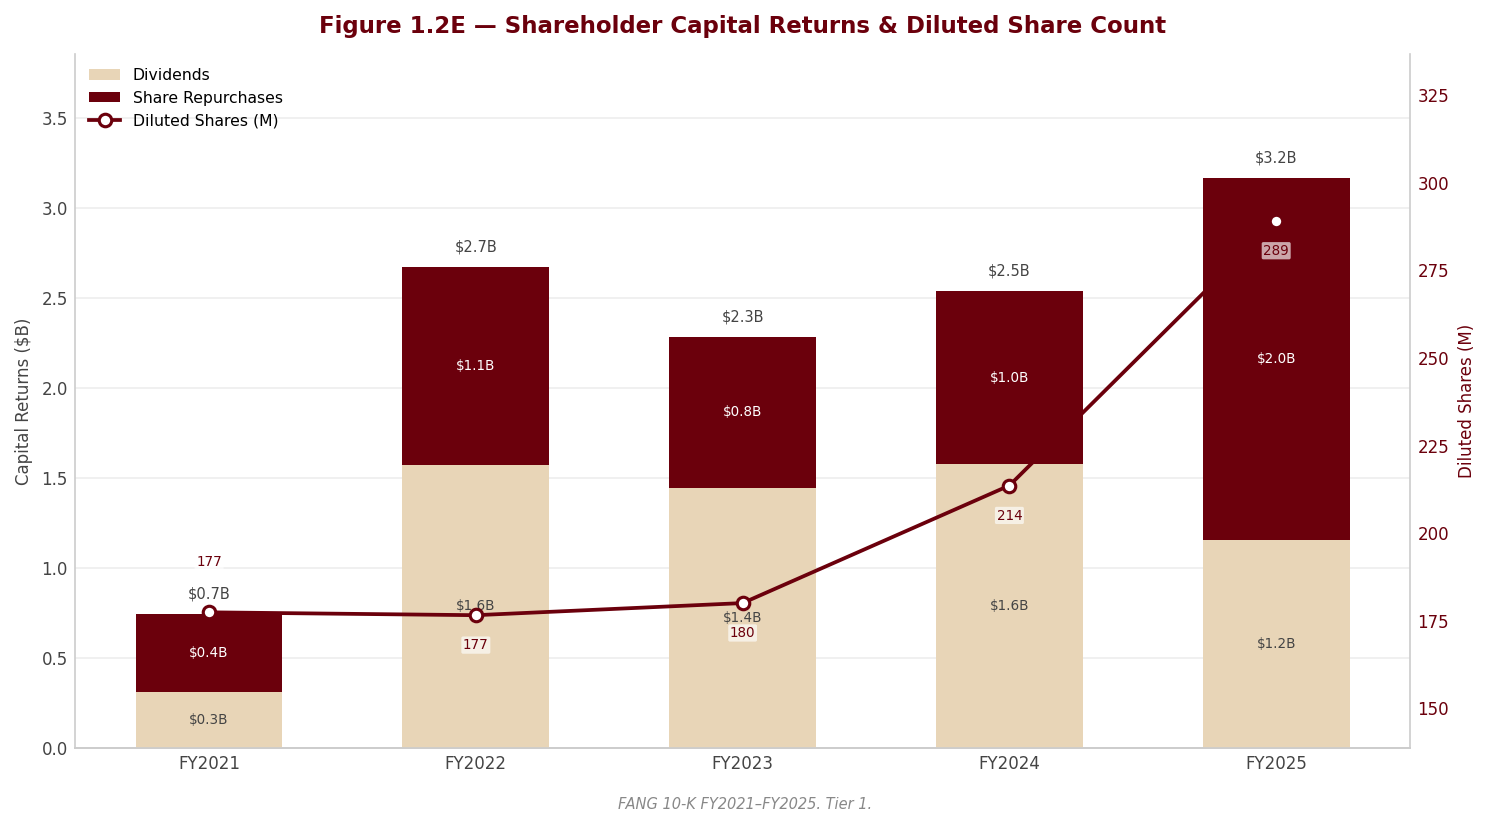
Management frames its capital-allocation policy as a formal return-of-capital commitment: distribute at least a defined minimum share of quarterly adjusted free cash flow through a sustainable and growing base dividend, plus variable dividends and opportunistic buybacks, with the remainder directed to debt reduction. The most telling signal in that framework is what management changed. In early 2024 it deliberately reduced the return-of-capital commitment percentage specifically to accelerate repayment of the debt taken on for Endeavor and Double Eagle — an explicit tilt away from shareholder distributions and toward deleveraging. It nonetheless raised the buyback authorization during 2025, and directed part of that program toward repurchasing stock from the related Endeavor/SGF holder bloc. The net read is a management team prioritising balance-sheet repair after a debt-and-stock-funded acquisition spree, while keeping the base dividend as the sacrosanct floor and treating variable dividends and buybacks as the discretionary swing — a policy management itself stresses can vary sharply quarter to quarter with the oil price.
Two cautions apply to the CapEx column. First, it captures organic development spending only; it excludes the far larger cash outlays on property acquisitions (Endeavor, Double Eagle and, at Viper, Sitio), so the table materially understates total capital deployed and confirms that Diamondback’s growth has been acquisition-led rather than drill-bit-led. [Rating and price target withdrawn — see the note at the top.] In short, capital is being spent to hold the base flat and to pay down acquisition debt, not to grow volumes, and the acquired cost basis is itself now the source of the impairment discussed below.
1.6 Competitive Positioning & Moat
1.6.1 Industry structure
sources Exploration and production is a price-taking commodity business with no product differentiation and no pricing power: every operator sells effectively the same barrel into the same market at the same price. Returns are therefore not competed for on price but on cost — the lowest-cost operators earn a margin at prices that push higher-cost operators into losses — and on the quality and duration of drilling inventory, since a producing well declines steeply and reserves must be continually replaced through the drill bit or through acquisition or the business liquidates itself. The industry is cyclical and capital-intensive, and the durable winners are the operators who hold long, low-cost inventory and, critically, avoid destroying capital by overpaying at the top of the cycle. That last point frames the Diamondback case directly.
1.6.2 Competitive advantages
sources Diamondback’s advantages are real but bounded, and each rests on a specific disclosure. The clearest is scale plus contiguity: a large, largely contiguous Permian position that enables a “manufacturing” style of development — centralised production and fluid-handling facilities, batch drilling, shared infrastructure — that lowers unit cost. Reinforcing it is a high degree of operational control: management operates the large majority of its acreage and holds a high average working interest, which it argues lets it manage costs, dial the pace of development up or down with the oil price, and control the gathering and marketing of production. Management further positions the company as a low-cost operator that captured completion-and-drilling efficiencies to offset 2025 service inflation and targets what it calls an industry-leading breakeven — claims that are management’s own characterisations, and are treated as such. The company also points to a multi-year inventory of identified horizontal locations (extended in 2025 by delineation of the Barnett/Woodford zone), and to Viper’s capital-light mineral/royalty stream as a fee-like layer on top of the operated business. Taken together these constitute a genuine relative-cost-and-scale advantage within the Permian.
1.6.3 Competitive vulnerabilities
sources The vulnerabilities are structural and, in FY2025, visible in the numbers. The overriding one is commodity-price sensitivity: none of the cost advantages insulate reported results from a fall in oil, and the full-cost ceiling-test mechanism converts a price decline directly into a large non-cash write-down. That is not hypothetical — the FY2025 impairment is precisely this event, and management has flagged that it is not a one-off: a further material ceiling-test charge was already reasonably likely, and has since materialised, in the first quarter of 2026. Second, the acquisition-led model carries its own hazard: the Endeavor deal was struck at top-of-cycle oil economics and largely funded in stock, and the FY2025 impairment is in substance the accounting catch-up to marking that cost basis down to a lower trailing price — a caution on management’s acquisition timing, not just on the oil price. Third, and most corrosive to the “long, durable inventory” story, the reserve base showed a large downward revision in the period and organic reserve replacement fell short of the volumes it produced; part of that revision was a management-driven de-booking of locations tied to a changed development plan, not merely a price effect — a signal that some of the inventory underpinning the growth narrative is less economic than previously carried. Finally, single-basin concentration and the concentrated Endeavor/SGF ownership bloc (Section 2) remove the diversification and governance buffers a larger, more dispersed peer would have.
1.6.4 Verdict
sources Diamondback has a real but narrow moat: a genuine low-cost, high-operatorship scale position in the best US oil basin, which should let it out-earn higher-cost operators through the cycle and survive prices that impair weaker peers. But it is a cost-and-scale advantage inside a price-taking commodity, not an economic moat that confers pricing power or protects returns, and FY2025 demonstrated the limit directly — the ceiling-test impairment and the negative reserve revision show that neither the cost position nor the inventory depth insulates reported earnings, book value or the resource base from the oil price. Long-run margin durability is therefore bounded above by the commodity and, on the evidence of the reserve revision, is not fully protected by the inventory the company holds. The independent auditor’s sole critical audit matter — the estimation of proved reserves as it drives depletion, impairment and acquisition accounting — is a useful third-party marker that the reserve-and-impairment sensitivity flagged here is the genuine locus of risk in this business, not a modelling artefact.
Section 2 — Key Risks & Catalysts
2.1 Downside Risks
sources Diamondback is a single-commodity, single-basin business, so its risk profile is dominated not by competitive threat or technological disruption but by the price of oil — and, unusually, by an accounting mechanism that now converts a falling oil price directly into a reported loss of book value. The risks below are ranked by materiality to the investment case, not by the order in which the filing lists them. The two most important are a live, recurring impairment mechanic and a deteriorating reserve base; neither is a generic sector risk, and both were visible in the FY2025 numbers rather than hypothetical.
Risk 1 — Commodity price, now with an accounting transmission channel that is actively firing
sources Diamondback accounts for its oil and gas properties under the full-cost method, and every quarter it runs a ceiling test that caps the carrying value of its property pool at the present value of proved reserves computed on a trailing-twelve-month average SEC price. When that trailing price falls, the cap falls with it, and the excess book value is written off as a non-cash impairment — even when wells, reserves and operations are performing normally. This is a RED forensic finding, and the reason it dominates the risk list is that the mechanism is no longer a tail scenario: it fired in FY2025, collapsing reported operating income, and it fired again in the first quarter of FY2026. Management has ruled out a further charge only for the immediately following quarter — not beyond it — and has retained the standing warning that continued declines in the trailing price could force additional material write-downs. The key analytical point is that this is a recurring, ongoing risk, not a past event that has cleared. Because the charge is non-cash it does not touch operating cash flow, so the danger to the equity is second-order but real: each write-down is the accounting system confirming that the acquired cost basis exceeds current-price economics, it compresses book value and any earnings-based valuation, and — because commodity-price weakness is what triggers it — it tends to arrive precisely when the rest of the business is also under pressure. The observable early warning is entirely public and mechanical: the trailing-twelve-month unweighted first-of-month SEC oil price relative to the deck used in prior quarters. If it keeps sliding, another charge is close to arithmetic.
Probability: High | Timeframe: Immediate | Quantified potential impact: Non-cash to cash flow, but directly reduces reported EBIT, net income and book equity; a further trailing-price decline mechanically forces additional charges of a magnitude the company itself declines to bound beyond the coming quarter.
Risk 2 — Reserve replacement and the quality of the drilling inventory
sources This is, in our judgement, the single most important and least obvious risk in the report, and it is a RED forensic finding. In FY2025 Diamondback recorded a large downward revision to previously booked reserves. Critically, only part of that revision was price-driven. A comparable share came from management de-booking drilling locations from its own corporate development plan — that is, removing inventory it had previously carried as economic — together with negative well-performance revisions. Netting extensions and discoveries against those revisions and against the year’s production, organic reserve replacement fell short of what the company produced, and the SEC standardized measure of the reserve base declined even though substantial acquisitions were folded in during the year. For an exploration and production company the reserve base is the asset, and it is disclosed outside the audited financial statements where a casual reader will miss it. The reason this ranks above single-basin concentration is that it is a different and more serious signal than the impairment: a price-driven write-down reverses if oil recovers, but a management-driven de-booking of locations is a statement about inventory depth and quality that does not simply un-happen when the price rises. It undercuts the “long, durable, low-cost inventory” narrative that underpins the growth case, and it corroborates rather than offsets the impairment. It should not be conflated with the ceiling-test charge, and it should not be softened. The early warning is the next annual reserve reconciliation: whether the negative revisions recur, whether the development-plan downgrades continue, and whether organic replacement recovers back above the volumes produced.
Probability: Medium | Timeframe: 1–2 years | Quantified potential impact: Erodes the resource base that anchors terminal value; a repeat sub-100% organic replacement year, with further development-plan de-bookings, would force a structurally lower long-run production and cash-flow trajectory independent of the oil price.
Risk 3 — Single-basin, single-commodity concentration
sources Every producing property Diamondback owns sits in the Permian Basin, and the portfolio is oil-weighted, so the company has no geographic or commodity diversification to cushion a localized shock. This is specific and consequential, not boilerplate, because the Permian carries a distinct and currently active set of pressure points that hit the entire asset base simultaneously: regional takeaway-capacity constraints and basis differentials that can force curtailment or unfavourable delivery terms; produced-water disposal limits and induced-seismicity restrictions, where the Texas Railroad Commission has already curtailed injection volumes, suspended some permits and imposed a moratorium on new disposal wells in parts of the basin; water-availability constraints in a drought-exposed region where fracturing is water-intensive; and concentrated exposure to regional service-cost inflation and labour scarcity in a high-activity area. Because management elsewhere presents the same concentration as an operational strength — contiguous acreage, one operating environment, shared infrastructure — the reader should hold both truths at once: the concentration that lowers unit cost in good conditions removes all diversification in bad ones. The early warning signs are region-specific: widening Midland/Gulf-Coast basis, new or expanded Railroad Commission disposal restrictions in the counties where Diamondback operates, and rising per-well completion costs as basin activity competes for the same rigs, sand and crews.
Probability: Medium | Timeframe: 1–2 years | Quantified potential impact: A basin-wide takeaway or disposal shock would curtail a large share of production at once, with no offsetting geography; effect flows through volumes and realized prices rather than a single line item.
Risk 4 — Governance concentration and the ownership overhang
sources Following the Endeavor combination, the former Endeavor equityholders — including the SGF holder vehicle — hold a large minority block of Diamondback stock, and this is a RED forensic finding with two distinct edges. On one side is control concentration: under a stockholders agreement the bloc nominated and appointed multiple directors and secured consent rights over certain corporate actions, amounting to a de facto blocking position for a single concentrated holder whose interests may diverge from those of dispersed public shareholders — a classic minority-protection concern. The company has also directed buyback cash toward repurchasing stock directly from this related bloc, inside its authorized program, in the same period it was taking an impairment; and it routes recurring capitalized and operating spend to the related Deep Blue water joint venture under a long-dated dedication, with follow-on capital and contingent payments still to come. On the other side is a share-price overhang: the bloc is selling down, its stake has been declining through secondary offerings and the company’s own repurchases, and management itself discloses that further sales — or the mere perception of them — could depress the stock. The two edges pull in opposite directions for the equity: the sell-down gradually dilutes the governance concentration but simultaneously caps the share price until it is complete. The early warning is straightforward to track: the bloc’s disclosed ownership percentage, the cadence of related-party repurchases and secondaries, and any change to the board-nomination or consent rights as ownership thresholds are crossed.
Probability: High | Timeframe: Immediate | Quantified potential impact: Not an earnings risk but a control and valuation risk; a persistent, telegraphed sell-down is a standing overhang on the multiple, while the consent rights constrain strategic flexibility (mergers, large issuances, change of control).
Risk 5 — Leverage and the acquisition treadmill
sources Diamondback’s debt rose materially to fund the Endeavor and Double Eagle acquisitions, and management explicitly reduced its return-of-capital commitment in order to accelerate paying that debt down — a deliberate tilt away from shareholder distributions toward balance-sheet repair. The more structural version of this risk sits underneath the leverage. In each of the last several years the company has spent more cash buying properties than it has spent drilling its own acreage, while — per Risk 2 — not fully replacing reserves organically. That combination frames acquisitions less as an opportunistic choice and more as a recurring requirement: if organic drilling does not replace produced reserves, the company must keep buying inventory to hold the asset base flat, which in turn re-loads the balance sheet and re-inflates the cost pool that is failing the ceiling test. Each large, top-of-cycle, partly debt-funded deal therefore risks seeding the next impairment. Layered on top are roughly several billion dollars of off-balance-sheet take-or-pay transportation and purchase commitments plus firm oil-delivery obligations, whose shortfall-fee risk rises exactly when weak prices or volumes would make curtailment attractive. The mitigant, and it is real, is that the maturity profile is well laddered with no near-term wall, the revolver is undrawn, covenant headroom is wide, and management has been actively retiring debt early — so this is a strategic and returns risk, not a solvency or liquidity risk. The early warning is the balance of uses of cash: another large acquisition announced into a weak-price environment, a rising net-debt trajectory, or a further cut to the return-of-capital percentage.
Probability: Medium | Timeframe: 1–2 years | Quantified potential impact: Constrains free cash available for distribution and re-loads impairment-prone book value with each deal; off-balance-sheet commitments add to the true leverage picture and reduce flexibility in a downturn.
2.2 Upside Catalysts
sources The catalyst set here is deliberately modest, and honesty requires stating the asymmetry: the risks materially outnumber and outweigh the catalysts. Diamondback is a price-taker whose single largest swing factor — the oil price — is outside its control, so most genuine upside is either the absence of a bad outcome (no further impairment, reserves stabilising) or a capital-allocation decision, rather than a discrete value-creating event the company can manufacture. We present the catalysts we can support from the filings, and we do not invent others for balance.
Catalyst 1 — Ceiling-test relief: the next test passes without a further charge
sources The most immediate positive would be the trailing-twelve-month SEC oil price stabilising or recovering enough that the next quarterly ceiling test does not force another write-down. Because the same mechanism that makes the impairment a dominant risk also works in reverse, a firming price deck would remove the recurring headline charge, stop the compression of book value, and let reported earnings converge back toward the underlying cash-generative reality of the business. Management has already ruled out a charge for the coming quarter; confirmation of that, followed by clean subsequent tests, would be the clearest signal the acute phase has passed.
Probability: Medium | Timeframe: Immediate | Monitoring trigger: The trailing-twelve-month unweighted first-of-month SEC oil price holding at or above the deck used in the prior quarter, and each quarterly filing reporting no further ceiling-test impairment.
Catalyst 2 — Reserve base stabilises and organic replacement recovers above the produced volume
sources The counterpart to Risk 2: if the next annual reserve disclosures show the negative revisions abating, no repeat of the development-plan de-bookings, and organic reserve replacement recovering back above the volumes produced, it would materially rebuild confidence in inventory depth and quality — the part of the thesis the FY2025 revision damaged most. This matters more than a single strong production quarter, because it speaks to the durability of the asset rather than the pace of near-term output. It would also lend support to any terminal-value assumption in the valuation, which the current reserve trajectory does not.
Probability: Low | Timeframe: 1–2 years | Monitoring trigger: The next annual reserve reconciliation showing smaller or no downward revisions, no further corporate-development-plan location downgrades, a stabilising or rising standardized measure, and organic replacement back above 100%.
Catalyst 3 — The ownership overhang clears
sources As the Endeavor/SGF bloc continues to sell down, the standing overhang on the share price gradually lifts, and the governance concentration — the multiple board seats and consent rights — dilutes as ownership crosses the relevant thresholds. A completed or substantially completed exit, ideally on terms that do not route further large repurchases to the related seller, would remove both the supply overhang and the minority-protection discount that a concentrated, consent-holding block imposes on the multiple.
Probability: Medium | Timeframe: 1–2 years | Monitoring trigger: Continued declines in the bloc’s disclosed ownership, orderly secondary placements absorbed by the market, and any relaxation or expiry of the board-nomination and consent rights as ownership thresholds fall.
Catalyst 4 — Capital-return normalisation and Deep Blue optionality
sources Two smaller, more discretionary positives. First, once the acquisition debt is paid down toward management’s target, the company has room to restore the return-of-capital percentage it deliberately cut — a base-dividend increase and a resumption of variable returns or buybacks would be a tangible signal that the balance-sheet-repair phase is over, though it is contingent on a supportive price deck. Second, the Deep Blue water venture carries follow-on capital commitments and contingent payments; clarity on how those crystallise, and on the economics of the long-dated water dedication, could resolve a piece of related-party uncertainty either way. Neither is a large-magnitude catalyst, and the capital-return lever is double-edged because a weaker price deck would suppress exactly the free cash flow that funds it.
Probability: Medium | Timeframe: 1–2 years | Monitoring trigger: A restored or raised return-of-capital commitment percentage, base-dividend increases, resumed variable returns, and disclosure on Deep Blue follow-on funding and contingent-payment outcomes.
2.3 Risk & Catalyst Summary
| # | Item | Type | Probability | Timeframe | Status | Monitoring Trigger |
|---|---|---|---|---|---|---|
| 1 | Full-cost ceiling-test impairment (price-driven, recurring) | Risk | High | Immediate | Active | Trailing-12-month SEC oil price vs prior-quarter deck; each quarter’s impairment disclosure |
| 2 | Reserve revision & sub-100% organic replacement | Risk | Medium | 1–2 years | Active | Annual reserve reconciliation; development-plan downgrades; standardized measure |
| 3 | Single-basin / single-commodity Permian concentration | Risk | Medium | 1–2 years | Latent | Basis differentials; Railroad Commission disposal/seismicity rules; regional cost inflation |
| 4 | Governance concentration & ownership overhang (Endeavor/SGF bloc) | Risk | High | Immediate | Active | Bloc ownership %; related-party buybacks/secondaries; board & consent-right changes |
| 5 | Leverage & the acquisition treadmill | Risk | Medium | 1–2 years | Monitoring | Uses-of-cash mix; net-debt trajectory; return-of-capital %; new deals into weak prices |
| 6 | Ceiling test passes without a further charge | Catalyst | Medium | Immediate | Monitoring | Stable/rising trailing SEC price; clean quarterly ceiling tests |
| 7 | Reserve base stabilises, organic replacement recovers | Catalyst | Low | 1–2 years | Monitoring | Smaller/no negative revisions; replacement back above 100% |
| 8 | Ownership overhang clears | Catalyst | Medium | 1–2 years | Monitoring | Declining bloc ownership; orderly secondaries; consent rights lapsing |
| 9 | Capital-return normalisation & Deep Blue clarity | Catalyst | Medium | 1–2 years | Monitoring | Restored return-of-capital %; dividend increases; Deep Blue funding outcomes |
Source: Company SEC filings (10-K) and forensic footnote review; see Appendix A.1.
2.4 Risk Interdependencies
sources The defining feature of Diamondback’s risk profile is that its top risks are not independent — they are driven by the same underlying variable and compound one another, which is what makes a downturn disproportionately damaging rather than merely additive. The oil price sits at the centre. A sustained price decline simultaneously (i) forces the full-cost ceiling-test impairment (Risk 1), (ii) drives the price-related portion of the reserve write-down and pushes marginal locations below the economic threshold, worsening the development-plan de-bookings (Risk 2), and (iii) suppresses the free cash flow that funds both debt paydown and shareholder returns (Risk 5). Because all three fire off the same trigger, a weak-price year does not deliver one problem — it delivers an impairment, a reserve revision and a cash-flow squeeze at once.
The concentration and leverage risks then amplify that cluster. Single-basin exposure (Risk 3) means there is no diversified region generating offsetting cash flow when Permian-specific stresses — takeaway constraints, disposal restrictions — coincide with low prices, so a regional shock and a price shock reinforce each other with no internal hedge. Leverage and the acquisition treadmill (Risk 5) are the most dangerous compounding link: the model’s need to keep acquiring reserves to offset weak organic replacement (Risk 2) re-inflates the very cost pool that fails the ceiling test (Risk 1), so each attempt to solve the reserve problem through M&A can seed the next impairment and add debt at the same time. Finally, the governance overhang (Risk 4) interacts with the rest through the share price: an equity that is already pressured by impairment headlines and a soft price deck is least able to absorb a continuing related-party sell-down. The combination that would be most damaging is a genuine, sustained oil-price downcycle — it would activate four of the five risks simultaneously, and the non-cash impairment would arrive alongside a very real contraction in distributable cash.
2.5 ESG & Regulatory Exposure
sources Diamondback’s ESG and regulatory exposure is concentrated in the environmental and governance dimensions, and — consistent with this report’s approach — the points below are the ones specific to this filing, not generic energy-sector language.
Environmental and regulatory. The most operationally live exposures are Permian-specific. The Texas Railroad Commission has curtailed produced-water injection volumes near parts of the basin, indefinitely suspended some disposal permits, expanded restrictions and imposed a moratorium on new produced-water disposal wells to manage induced seismicity — a direct threat to the disposal capacity Diamondback’s development depends on, and one that could force costlier trucking, recycling or pipelining or outright volume limits. Water availability is the mirror-image constraint: fracturing is water-intensive in a drought-exposed region where some local districts have restricted use and state rules increasingly push produced-water recycling. On emissions, the company is exposed to evolving methane and flaring regulation — EPA methane standards, a federal methane emissions charge whose implementation has been suspended by recent legislation, and Railroad Commission flaring guidance — the direction of which is genuinely uncertain given signals of federal rollback set against continued litigation. The company also faces energy-transition demand risk (electric vehicles, alternative energy and capital-provider pressure that could raise its cost of capital), and it carries specific legal exposure it discloses as not material and does not accrue: a set of Louisiana coastal-erosion (SLCRMA) suits it characterises as based on “unprecedented” legal theories with significant uncertainty as to scope and damages, plus a legacy offshore-platform decommissioning obligation. Because “unprecedented / significant uncertainty” means damages are not currently estimable rather than absent, these are watch items rather than modelled liabilities. Trade and tax policy round out the regulatory set: tariffs could stoke inflation and dampen oil demand, and recurring legislative proposals to curtail intangible-drilling-cost deductibility or the percentage-depletion allowance would directly raise the company’s tax burden. A newer, physical exposure worth noting is power availability — management flags that rapid growth in AI-related data-center electricity demand is straining regional grids and could reduce reliable power for its operations — alongside the standard cyber exposure, where the company reports regular attempted attacks (none material to date) and inherits vulnerabilities through acquisitions.
Governance. The governance exposure is the same concentration set out in Risk 4 and reiterated here because it is the “G” that matters for this issuer: a large minority holder bloc with multiple board seats and consent rights, related-party repurchases directed to that bloc, and a related-party water joint venture — a combination that a governance-sensitive investor must weigh directly, distinct from the boilerplate anti-takeover, blank-check-preferred and exclusive-forum provisions the company also carries. On the positive side of the ledger, the independent auditor issued unqualified opinions on both the financial statements and internal control with no going-concern or emphasis-of-matter language, and its sole critical audit matter — the estimation of proved reserves as it drives depletion, impairment and acquisition accounting — is independent third-party confirmation that the reserve-and-impairment complex flagged as Risks 1 and 2 is the genuine locus of risk in this business, not an analyst construct.
Section 3 — Financial Analysis & Historical Performance
sources Three-Statement Linkage Confirmation: - Net Income ties (Income Statement → Cash Flow Statement): confirmed, with one presentation nuance a reader must carry. The net income line that anchors the cash-flow statement and diluted EPS is the figure attributable to Diamondback ($1,664.0M in FY2025); consolidated net income is lower because the FY2025 non-controlling interest was a loss rather than a positive share of profit. The mechanism is explained in 3.1B and is correct as printed. - Cash ties (Balance Sheet → Cash Flow Statement): confirmed. Ending cash on the balance sheet ($104.0M) reconciles to the cash-flow roll-forward; the low absolute cash balance reflects a policy of sweeping cash to debt reduction and returns rather than any liquidity strain (the revolver is undrawn). - Retained Earnings reconciliation (Beg RE + NI - Dividends = End RE): confirmed. Retained earnings rose from $4,238.0M to $4,740.0M, consistent with parent net income of $1,664.0M less dividends of $1,156.0M; buybacks and NCI/ownership-change entries flow through paid-in capital and non-controlling interest rather than retained earnings.
3.1A Income Statement
Source: Company SEC filings (10-K); figures per the FL model — see Appendix A.1–A.2.
CAGR Summary
| Metric | 3Y CAGR | 5Y CAGR | 10Y CAGR |
|---|---|---|---|
| Revenue | 15.9% | 39.8% | 42.1% |
| EBITDA | -7.1% | - | - |
| Net Income | -27.6% | - | - |
| Diluted EPS | -38.5% | - | - |
| FCF | 6.1% | 82.4% | - |
Source: Company SEC filings (10-K); figures per the FL model — see Appendix A.1–A.2.
3.1B Income Statement — Analysis
sources The revenue story is acquisition, not the drill bit. Revenue reached $15,026.0M in FY2025, a 35.8% increase on FY2024’s $11,066.0M, which in turn was up 31.6% on FY2023. A reader should resist reading that as organic momentum. The step-up is the arithmetic of consolidating the Endeavor combination (closed September 2024) for its first full year, layered on the Double Eagle acquisition that closed in April 2025 — bolt-ons that enlarged the production base rather than a well-program that grew it. The commodity backdrop actually cut the other way: the trailing SEC oil price used across the year was materially lower than the prior two years, so on a like-for-like barrel the price was a headwind and the entire top-line gain is volume acquired, not price earned. The one prior-period contraction in the series — the -12.8% decline in FY2023 — was itself a price event (a normalisation from the 2022 spike), which underlines the central fact of this income statement: on a per-barrel basis Diamondback does not control its price, so every trend line in this table is a blend of an acquisition path the company chose and a price path it did not.
A second distortion sits inside the headline. A growing slice of reported revenue is third-party oil that Diamondback buys and immediately resells to satisfy transportation commitments; it is booked gross on both the revenue and the cost line at essentially no margin. That pass-through has grown from a rounding item a few years ago into roughly a tenth of the top line, so headline revenue and headline revenue growth overstate the size and the momentum of the underlying production business, and every margin struck on the full revenue base is diluted by near-zero-margin churn. [Rating and price target withdrawn — see the note at the top.]
The margin trajectory is the story of the year, and it must be read on two levels. Gross margin has been remarkably stable (80.0% to 78.5% across the last three years), because lease operating costs are a modest share of a high-value barrel. The drama is below that line. FY2025 is not a representative year, and every FY2025 profitability figure in this section is struck on a depressed base: a non-cash full-cost ceiling-test impairment of $3,652 million (10-K p.72) — the direct consequence of the trailing SEC price falling against a cost pool inflated by the top-of-cycle, largely stock-funded Endeavor deal — is recorded as a discrete operating-expense line, outside the depreciation, depletion and amortisation charge. That single charge is why EBIT margin collapsed to 8.4% from 39.7%. It depresses EBITDA as well, and this point is easy to get wrong: the model computes EBITDA as EBIT plus depreciation, depletion and amortisation, and the impairment is not inside that add-back — so the reported FY2025 EBITDA margin of 42.0%, down from 65.5%, is itself impairment-contaminated and must not be read as a clean pre-impairment figure. Added back, the FY2025 EBITDA margin recovers to roughly two-thirds of revenue, close to the prior-year level — that restated figure, not the reported one, is the true operating read. Net margin compressed on the same mechanism, to 11.1% from 30.2%. This is a RED forensic finding and it is the interpretive key to the whole section: the collapse in reported profitability is an accounting mark-down of carrying value, not an operating failure, and — as Section 2 sets out — it is recurring rather than closed, with a further ceiling-test charge already booked in the first quarter of FY2026. Any P/E, EBIT-margin or net-margin read on FY2025 is therefore mechanically distorted downward; the cash-generative reality of the business is better seen in EBITDA and in the cash-flow statement (3.3).
Major movers.
-
The ceiling-test impairment (structural in origin, non-cash in effect). The dominant mover, collapsing EBIT from $4,396.0M to $1,266.0M. It is non-cash — it does not touch operating cash flow — but it is a real signal that the acquired cost basis exceeds current-price economics. [Rating and price target withdrawn — see the note at the top.]
-
[Rating and price target withdrawn — see the note at the top.] This is a persistent GAAP-earnings drag that will continue as the acquired cost pool depletes, and it is separate from, and additive to, the ceiling-test risk.
-
One-time gains below the operating line flatter the pre-tax result (YELLOW). Pre-tax income of $1,874.0M sits above operating income of $1,266.0M — the gap is non-operating. That gap is filled by a cluster of non-recurring items: gains on the divestiture of equity interests and water assets, a large net mark-to-market gain on derivatives, and a gain on repurchasing senior notes below par. Strip those and the pre-tax result is materially lower. [Rating and price target withdrawn — see the note at the top.]
-
[Rating and price target withdrawn — see the note at the top.] The line moved from a loss in FY2023 to a sizeable gain in FY2025 — a swing of several hundred million dollars that has nothing to do with operations and that flatters the FY2025-versus-FY2023 optics. Only part of the FY2025 gain was cash-settled; the balance is an unrealised, non-cash mark.
-
[Rating and price target withdrawn — see the note at the top.] Critically, the book provision is not the cash outflow: cash income taxes paid in FY2025 substantially exceeded the book charge, because the impairment and the legislative timing sit in deferred tax. Free-cash-flow analysis (3.3) must use cash taxes, not this line.
Quality of earnings — the parent-versus-consolidated inversion (RED). The most counter-intuitive figure in the statements, and one that looks like a transcription error but is not, is that net income attributable to Diamondback ($1,664.0M) exceeds consolidated net income. The reason is the non-controlling interest. Diamondback consolidates Viper Energy in full but owns only a minority economic stake; in FY2025 Viper absorbed its own proportional share of the ceiling-test impairment, so the outside (public) holders of Viper bore a loss for the year. A negative non-controlling-interest share, subtracted from consolidated income, raises the residual attributable to the parent above the consolidated total. This is correct as printed and should not be “resolved.” It also reconciles the per-share figure: diluted EPS of $5.73 is struck on the parent-attributable $1,664.0M, not on the lower consolidated number. In FY2023 and FY2024 the non-controlling interest was a normal positive share of profit; FY2025 is the year it inverted, and the relationship is expected to revert as Viper returns to profit.
Quality of earnings — the per-share series is not like-for-like. The EPS line reads as deterioration and is not. Diluted EPS fell in FY2024 (EPS growth of -10.4%) even as net income attributable rose (net income growth of 6.2%). The denominator did that, not the business: the Endeavor stock consideration entered the weighted-average share count only part-way through FY2024, so diluted shares stepped up from 180M to 214M and again to 289M as the full-year weighting landed. Any comparison of EPS across FY2023–FY2025 is comparing different share bases; the FY2025 EPS of $5.73 additionally carries the impairment. Neither year’s EPS move should be read as an operating trend.
⚠ Items to Watch. (i) The trailing-twelve-month SEC oil price is the single mechanical trigger for further ceiling-test charges; a continued decline forces more write-downs regardless of operating performance. (ii) EBITDA margin as reported is not a clean read: the ceiling-test charge sits outside the depletion add-back and therefore depresses EBITDA too, so the FY2025 figure of 42.0% is an accounting artefact and not an operating floor. The measure to watch is EBITDA margin with the impairment added back — roughly two-thirds of revenue in FY2025 — and a fall in that figure, not the reported one, would signal genuine operating or price deterioration. (iii) The gap between the book tax provision and cash taxes paid: if the deferred-tax tailwind reverses, reported net income and cash taxes will converge from opposite directions.
3.1C Operating Metrics — Volume, Price and Unit Economics
sources The revenue line in 3.1A can now be decomposed. Revenue is the product of barrels and price, and both are series; the table below carries the operating drivers that sit beneath the income statement. It shows milestone years — the FY2015 base, the FY2018 pre-scale position, the FY2020 price trough, the FY2022 price peak and the FY2023–FY2025 run in which acquisitions reshaped the company — rather than every year, to keep it legible; the full FY2015–FY2025 series underlies the analysis.
| Operating metric | FY2015 | FY2018 | FY2020 | FY2022 | FY2023 | FY2024 | FY2025 |
|---|---|---|---|---|---|---|---|
| Production (MMBOE) | 12.1 | 47.6 | 109.9 | 140.9 | 163.4 | 219.0 | 336.2 |
| Production (BOE/d) | 33,098 | 130,439 | 300,331 | 386,005 | 447,707 | 598,284 | 921,036 |
| Oil % of production | 75.0% | 72.0% | 60.0% | 58.0% | 59.0% | 56.0% | 54.0% |
| Realized oil ($/Bbl, unhedged) | $44.68 | $54.66 | $36.41 | $93.85 | $75.68 | $73.52 | $64.04 |
| Realized gas ($/Mcf) | $2.47 | $1.76 | $0.82 | $4.86 | $1.32 | $0.32 | $0.89 |
| Realized NGL ($/Bbl) | $12.77 | $25.47 | $10.87 | $35.07 | $20.08 | $18.99 | $17.88 |
| Revenue per BOE ($) | $36.98 | $45.70 | $25.59 | $68.44 | $51.48 | $50.54 | $44.70 |
| LOE per BOE ($) | $6.84 | $4.31 | $3.87 | $4.63 | $5.34 | $5.87 | $5.55 |
| Depletion (DD&A) per BOE ($) | $18.02 | $13.09 | — | $9.54 | $10.68 | $13.02 | $14.99 |
| Proved reserves (MMBOE) | 156.9 | 992.0 | 1,316.4 | 2,033.0 | 2,177.8 | 3,557.4 | 3,617.9 |
Realized prices are wellhead averages before the effect of derivative settlements. Revenue per BOE is struck on total revenue — including the low-margin purchased-oil pass-through described in 3.1B — and therefore sits above the blended wellhead realization. [Rating and price target withdrawn — see the note at the top.]*
Source: Company SEC filings (10-K); figures per the FL model — see Appendix A.1–A.2.
Revenue splits into barrels and price — and in FY2025 the split is the thesis. With production and realized prices both available as series, the revenue line in 3.1A is no longer a single number but a product of volume and price, and the two pulled in opposite directions in the most important year. Reported revenue grew 35.8% in FY2025 — yet the realized oil price fell, from $73.52 to $64.04 per barrel, and revenue per BOE fell with it, from $50.54 to $44.70. The entire top-line gain therefore came from volume: production stepped up from 598,284 to 921,036 BOE/d — from 219.0 to 336.2 MMBOE for the year — as Endeavor consolidated for its first full year and Double Eagle was added. Stated plainly, FY2025’s growth was barrels bought, not barrels worth more: each barrel Diamondback sold earned less than the year before, and only the far larger barrel count carried revenue higher. This is the single most important operating fact behind the income statement, and it confirms in per-unit data what 3.1B could previously only assert.
The earlier inflections run the other way and validate the decomposition. The FY2020 contraction was purely price: production actually rose that year, to 109.9 MMBOE, but the realized oil price collapsed to $36.41 per barrel and revenue per BOE fell to $25.59 — a trough driven entirely by the commodity, not the business. The FY2021–FY2022 recovery was its mirror image: on broadly comparable volumes the realized oil price rebounded to $66.19 and then $93.85 per barrel, lifting revenue per BOE to a cycle-high $68.44. Price made 2020 and 2022; volume made 2024 and 2025. Because Diamondback controls the second lever and not the first, the only growth it can manufacture is acquired volume — precisely the pattern the reserve and capital-allocation analysis in this section describes.
The production stream is getting gassier, and that is a structural drag on revenue per barrel. A slower force sits underneath the price cycle: oil’s share of total volumes has fallen without interruption across the history, from 75.0% in FY2015 to 54.0% in FY2025. That matters because the three products do not sell for remotely comparable money — in FY2025 oil realized $64.04 per barrel while natural gas realized $0.89 per Mcf and NGLs $17.88 per barrel, so that even after energy-equivalent conversion a barrel of oil is worth a multiple of a barrel-equivalent of gas or NGL. A falling oil share therefore lowers revenue per BOE on its own, independent of where the oil price sits — a structural headwind that compounds with, but is separate from, the commodity cycle. The effect is gradual and should not be overstated; part of it reflects the product mix of the acquired assets rather than any decline in the core. But directionally it is a persistent weight on per-barrel revenue that a higher oil price will not reverse.
Unit economics: the cost of producing a barrel troughed and has since risen. Lease operating expense per BOE is the cleanest single gauge of operating efficiency, and its path is a shallow U. It fell to a trough of $3.87 per barrel in FY2020 — the low point of a decade-long efficiency drive — and has risen since, to $5.87 in FY2024 before easing to $5.55 in FY2025. Some of the increase is service-cost inflation; some is the higher operating cost of integrating acquired, and gassier, properties. Paired with revenue per BOE the squeeze is visible from both ends: revenue per barrel fell from its FY2022 peak of $68.44 to $44.70 while LOE per barrel rose from $4.63 to $5.55, narrowing the cash operating margin per barrel. That margin remains wide — LOE is only one cost line and this is still a low-cost operator — but the direction is compression, driven by a lower realized price, a gassier mix and a higher unit cost at once.
[Rating and price target withdrawn — see the note at the top.] Depletion, depreciation and amortization per BOE troughed at $9.31 per barrel in FY2021 and has climbed steadily to $14.99 in FY2025 as the top-of-cycle Endeavor and Double Eagle cost pool entered the amortization base — heading back toward the mid-to-high-teens the company last carried years earlier, when $14.01 in FY2019 and $18.02 in FY2015 were the norm. The distinction the reader must hold is this: the depletion charge sits inside DD&A and reduces reported earnings every quarter as barrels are produced, whereas the ceiling-test impairment sits outside DD&A — as 3.1B establishes — as a discrete write-down. They are additive drags on GAAP earnings from the same root cause, an expensive and recently acquired cost basis, and the depletion component will persist as that basis depletes even in quarters when no impairment is booked. (The FY2020 point is absent from the series for a disclosure reason noted under the table, not a data gap.)
Reserves: a purchased base growing while the organic base shrinks — the thesis in one line. Proved reserves grew from 156.9 MMBOE in FY2015 to 3,617.9 MMBOE in FY2025, with the decisive jump in the Endeavor year — from 2,177.8 to 3,557.4 MMBOE. Taken alone that looks like emphatic resource growth. It is not what it appears. As Section 2 and the forensic review establish, the growth is purchased: organic reserve replacement ran below the volumes produced, management de-booked drilling locations from its own development plan, and the SEC standardized measure of the reserve base fell even as billions of dollars of acquisitions were folded in. The one-line version — and it is the thesis of this report — is that Diamondback’s reserve base is growing by acquisition while shrinking by the drill bit. A producer whose purchased reserves rise while its organic reserves fall is buying its way to a flat asset base, and the per-barrel economics above explain why that treadmill is getting harder: each acquired barrel is more expensive to deplete, part of the stream is worth progressively less as the mix turns gassier, and the price that would justify the swollen cost pool is the one lever management does not control.
⚠ Items to Watch. (i) Revenue per BOE against the realized oil price: if revenue per barrel keeps falling while the oil price is flat, the gassier mix is doing the damage and the drag is structural, not cyclical. (ii) LOE per BOE above the FY2024 level of $5.87: a renewed climb would signal that acquired-property and inflation costs are outrunning the low-cost operating model. (iii) Depletion per BOE: a continued rise toward the FY2015 $18.02 level compounds the GAAP-earnings drag quarter after quarter, wholly independent of any further impairment.
3.2A Balance Sheet
Source: Company SEC filings (10-K); figures per the FL model — see Appendix A.1–A.2.
3.2B Balance Sheet — Analysis
sources Asset composition: a property pool, and almost nothing else. This is one of the most PP&E-concentrated balance sheets an investor will encounter. Net PP&E of $68,621.0M is essentially the entire $71,059.0M asset base — the oil and gas property pool under the full-cost method. There is no goodwill: under full-cost accounting the purchase price of an acquisition is absorbed directly into oil and gas property values rather than left as a residual intangible, which is why the Goodwill line is blank across the series even after tens of billions of dollars of M&A. Total assets more than doubled between FY2023 and FY2024 — from $29,001.0M to $67,292.0M — as Endeavor loaded the cost pool; that swollen, top-of-cycle cost basis is precisely what the ceiling test then began to mark down. The single most important qualitative point about this balance sheet is that the asset side is the reserve base restated at historical cost, and its carrying value is only as durable as the trailing commodity price will support.
A large minority of the consolidated balance sheet does not belong to Diamondback shareholders. Because Viper is consolidated in full while Diamondback owns only a minority economic interest, the non-controlling-interest line has grown to $5,995.0M — up from $805.0M in FY2023 — swelled by Viper’s own equity issuance and the Sitio combination. Consolidated totals for assets, debt, reserves and EBITDA therefore overstate what economically accrues to Diamondback stockholders, and per-share and valuation work should lean on parent-attributable figures. Viper’s assets are also ring-fenced — not available for Diamondback’s general purposes and without recourse to Diamondback — so the consolidated cash and debt totals are less fungible than they appear.
Leverage rose to fund Endeavor and is now being repaired. Net debt roughly doubled to $12,814.0M in the Endeavor year and stood at $14,385.0M in FY2025, taking net debt/EBITDA from around 1.0x pre-deal to 2.3x. That trajectory is consistent with management’s stated priority — it explicitly reduced its return-of-capital commitment to accelerate deleveraging — and, importantly, the leverage is manageable in cash terms precisely because the earnings collapse behind it is non-cash. The balance-sheet risk profile is, on the evidence, a relative strength (a GREEN forensic finding): the maturity ladder has no near-term wall, the revolver is undrawn, the sole financial covenant (a net-debt-to-capitalization limit) carries wide headroom, and management has been retiring term debt early and repurchasing senior notes below par. Two offsets keep this from being an unambiguous positive. First, the reported interest burden understates the true cost of that debt — developed in 3.4. Second, roughly several billion dollars of take-or-pay transportation and purchase commitments, plus firm oil-delivery obligations, sit off the balance sheet (a YELLOW finding); their shortfall-fee risk rises exactly when weak prices or volumes would make curtailment attractive, and they belong in any true leverage picture alongside on-balance-sheet debt.
Book value per share fell despite the deleveraging, and that is the impairment again. Book value per share dropped from $176.71 to $127.90 — the write-down eroded equity from $37,736.0M to $36,972.0M even as retained earnings edged up. For a full-cost E&P, book value is not a meaningful floor: it is historical cost less depletion and impairment, not a mark of resource value, and it will keep falling if the ceiling test keeps firing.
Working capital: a structurally negative cash conversion cycle, correctly read. The cash conversion cycle has moved deeply negative, to -72 days in FY2025 from 6 days in FY2023 — the company collects from customers and depletes its tubular/crude inventory faster than it pays suppliers, with days payable stretching to 119 days. For a producer this is normal and healthy, not a red flag; it is a modest source of cash, not a warning. Two methodology points frame the receivables line. First, the receivables series combines both balance-sheet receivable lines — trade oil-and-gas sales and joint-interest amounts due from partners — because the company prints no single total; joint-interest receivables are not revenue-driven, so days-sales-outstanding of 36 days is slightly overstated and should be read as a ceiling rather than a precise figure. Second, a deterministic screen flags receivables growth outpacing revenue in FY2024; that flag is false by construction — the FY2024 year-end balance sheet is post-Endeavor while FY2024 revenue includes Endeavor for only part of the year, so the ratio is comparing a full-scale balance against a part-scale income statement. It is not evidence of aggressive revenue recognition, and DSO in fact eased in FY2025 to 36 days.
⚠ Items to Watch. (i) Net debt/EBITDA: a move above the FY2025 level of 2.3x — whether from a new debt-funded acquisition or from EBITDA erosion at weaker prices — would mark a return toward peak leverage and would pressure the discretionary portion of the return-of-capital framework. (ii) The off-balance-sheet commitment stack: watch take-or-pay costs actually incurred and any new firm-delivery obligations, which reduce flexibility in a downturn. (iii) The non-controlling-interest line: further Viper equity deals will keep moving it, widening the gap between consolidated and parent-attributable metrics.
3.3A Cash Flow Statement
| FY2021 | FY2022 | FY2023 | FY2024 | FY2025 | |
|---|---|---|---|---|---|
| Cash from Operations ($M) | $3,944.0M | $6,325.0M | $5,920.0M | $6,413.0M | $8,758.0M |
| — Depreciation & Amortization ($M) | $1,275.0M | $1,344.0M | $1,746.0M | $2,850.0M | $5,038.0M |
| Capital Expenditures ($M) | $1,487.0M | $1,938.0M | $2,701.0M | $2,867.0M | $3,523.0M |
| Free Cash Flow ($M) | $2,457.0M | $4,387.0M | $3,219.0M | $3,546.0M | $5,235.0M |
| FCF Margin | 36.1% | 45.5% | 38.3% | 32.0% | 34.8% |
| FCF / Share | $13.85 | $24.85 | $17.88 | $16.61 | $18.11 |
| FCF Conversion (FCF/NI) | 112.6% | 100.0% | 102.4% | 106.2% | 314.6% |
| CapEx / Revenue | 21.9% | 20.1% | 32.1% | 25.9% | 23.4% |
| CapEx / D&A | 1.2x | 1.4x | 1.5x | 1.0x | 0.7x |
| Dividends Paid ($M) | $312.0M | $1,572.0M | $1,444.0M | $1,578.0M | $1,156.0M |
| Share Repurchases ($M) | $431.0M | $1,098.0M | $840.0M | $959.0M | $2,010.0M |
Source: Company SEC filings (10-K); figures per the FL model — see Appendix A.1–A.2.
3.3B Cash Flow — Analysis
sources This is where the section turns: earnings collapsed and cash did not. The most important single observation in Section 3 is the divergence between the income statement and the cash-flow statement in FY2025. Net income attributable fell by -50.1% — yet operating cash flow rose to $8,758.0M from $6,413.0M, and free cash flow grew to $5,235.0M from $3,546.0M. The reconciling item is the ceiling-test impairment: a non-cash write-down of carrying value that devastates GAAP earnings while leaving cash untouched. The distortion is captured most starkly by FCF conversion, which vaulted to 314.6% of net income in FY2025 (from around 106.2% in FY2024) — a ratio that looks spectacular but is really an artefact of a depressed denominator. The correct reading is not that cash generation improved dramatically; it is that earnings understated cash, because the charge that halved reported profit never left the building. An investor anchoring on EPS or ROIC would conclude the business deteriorated in FY2025; the cash-flow statement says it did not.
But “free cash flow” here is a defined term, and the definition flatters it (YELLOW). The capital-expenditure line in this model is organic development capital only. Property acquisitions are excluded — and in FY2025 acquisition spend was larger than the entire organic capex figure of $3,523.0M. That matters enormously, because it means the $5,235.0M of reported free cash flow is struck before the cash the company actually spent buying reserves. Netting only organic capex against operating cash flow makes discretionary cash look abundant; it is not, because Diamondback is not replacing its reserves organically. As Section 2 established, FY2025 organic reserve replacement fell short of the volumes produced and the reserve base carried a large downward revision. For a company that must keep buying inventory to hold its asset base flat, a meaningful portion of acquisition spend is the cost of standing still, not a discretionary growth choice — so an unqualified “free cash flow” overstates the cash genuinely available for distribution. This is the single most important adjustment carried into the valuation: the separate valuation treat maintenance capital as needing to include acquisition spend, and do not take the reported FCF figure at face value.
Cash taxes, not the book provision, are the right charge in FCF. Reinforcing the point above, the cash tax outflow in FY2025 substantially exceeded the $327.0M book provision, because the impairment and the OBBB legislation pushed benefit into deferred tax. [Rating and price target withdrawn — see the note at the top.]
CapEx intensity: the ratio says “harvest,” but the ratio is distorted. CapEx/D&A fell to 0.7x in FY2025 from 1.0x — nominally a sub-1.0x, harvest-mode reading. [Rating and price target withdrawn — see the note at the top.] Stripping those, the organic program is closer to maintenance than to either growth or genuine underinvestment, consistent with management’s guidance to a broadly flat activity and production profile into 2026 against a soft price deck. Capex/revenue of 23.4% is within the historical band. The fair read is that Diamondback is spending its organic dollars to hold the base flat, not to grow volumes — and topping up reserves through acquisition.
Capital allocation waterfall. Over the last five years operating cash flow has comfortably funded the organic program, with the surplus split across a base-plus-variable dividend, opportunistic buybacks and debt reduction. FY2025 tilted toward buybacks, which rose to $2,010.0M — the highest in the series and well above dividends of $1,156.0M — even as the base dividend was maintained. A portion of that buyback was directed to repurchasing stock from the related Endeavor/SGF holder bloc (a related-party flow, discussed in Section 2), which means part of the buyback was managing the ownership overhang rather than pure per-share value creation. The mix is defensible for a business with a limited organic growth runway — returning cash and repairing the balance sheet is the right use when the reinvestment opportunity set is maintenance-like — but the reader should weigh it against the acquisition spend that sits outside this waterfall entirely.
What the earnings-quality screens actually support. Set aside the model-calibration false positives (a Beneish “manipulation” flag that lands on large-acquisition years, an Altman “distress” flag that lands on impairment years, the FY2024 “channel-stuffing” construct, and an “inventory obsolescence” category error that has no meaning for tubular goods and crude in tanks — none of these is a genuine finding here). What the screens do support is favourable: cash conversion (operating cash flow to net income) is strong and rising, accruals are clean, and the cash conversion cycle is negative in the way a healthy producer’s should be. The quality of the cash earnings is high; it is only the GAAP earnings that are distorted, and distorted downward.
⚠ Items to Watch. (i) The wedge between reported FCF and true post-acquisition cash: if acquisition spend continues to exceed organic capex while organic reserve replacement stays below 100%, reported FCF is a progressively worse proxy for distributable cash. (ii) The cash-tax-versus-book-tax gap: a reversal of the deferred-tax tailwind would raise the book charge and could lift cash taxes further, compressing true FCF. (iii) The buyback pace relative to the SGF sell-down: watch whether repurchases continue to absorb related-party stock rather than open-market shares.
3.4 Returns Analysis
| FY2021 | FY2022 | FY2023 | FY2024 | FY2025 | |
|---|---|---|---|---|---|
| ROIC | 19.2% | 26.4% | 16.4% | 9.9% | 2.1% |
| ROE | 20.9% | 32.4% | 19.9% | 12.3% | 4.5% |
| ROA | 10.8% | 17.9% | 11.4% | 6.9% | 2.4% |
| Interest Coverage | 20.1x | 40.9x | 26.1x | 32.6x | 5.2x |
Source: Company SEC filings (10-K); figures per the FL model — see Appendix A.1–A.2.
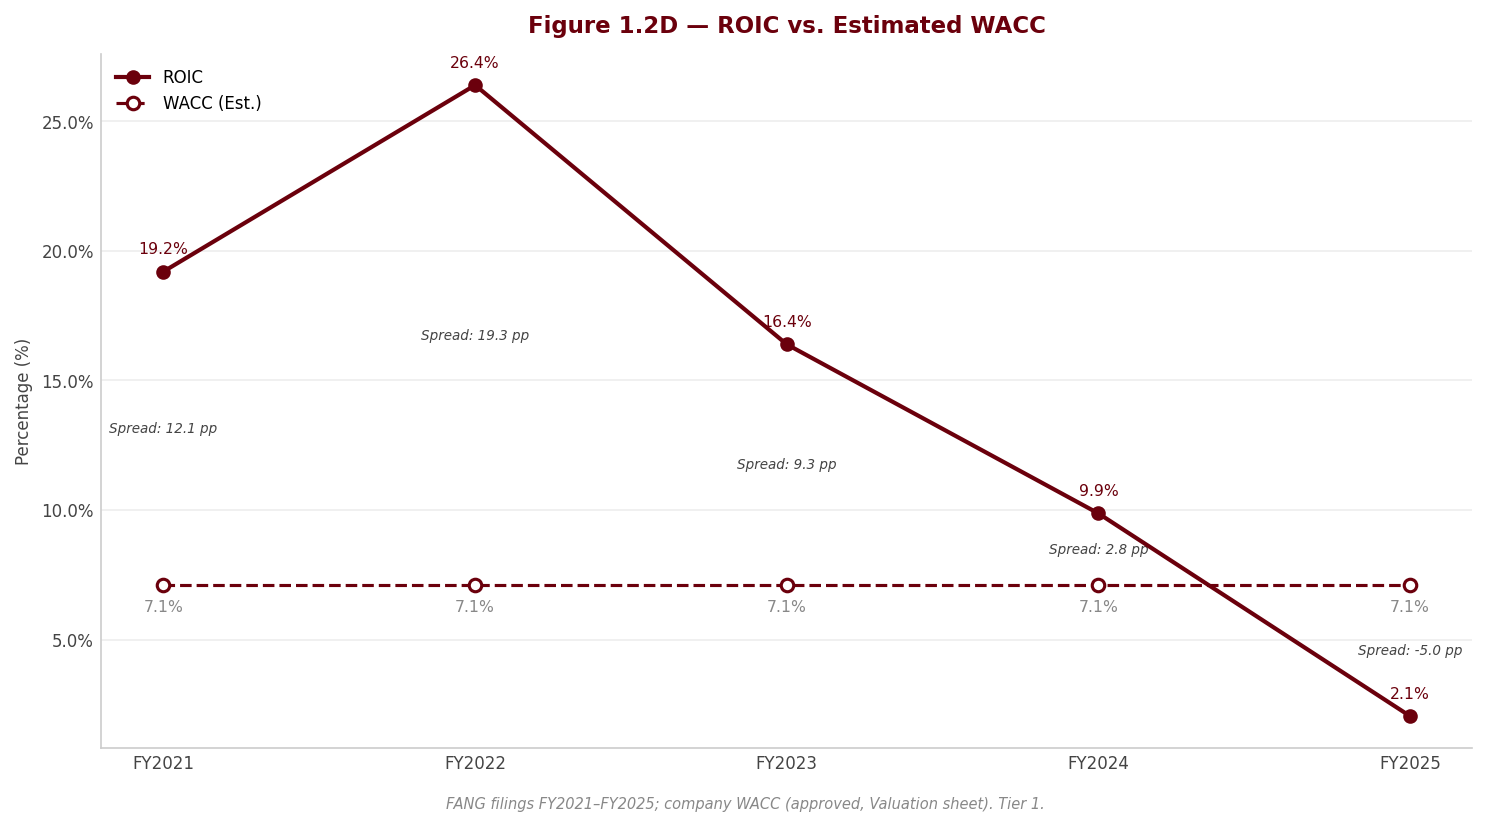
ROIC is the metric that matters most over a cycle, and FY2025’s is not the number to anchor on. Reported ROIC fell to 2.1% in FY2025, down from 9.9% and 16.4% — a level that, taken at face value, sits well below any plausible cost of capital (WACC and serves there as the forward-looking hurdle against which this spread is judged). Two forces drove the decline, and they must be separated. The numerator collapsed because of the non-cash impairment — a distortion that will unwind as the charge annualises out. But the denominator also structurally expanded: the Endeavor cost basis roughly doubled invested capital, so even a normalised return is now spread over a far larger, top-of-cycle capital base. The honest conclusion is that FY2025 ROIC of 2.1% understates the underlying cash-on-capital economics, but that the normalised return is nonetheless lower than the pre-Endeavor high-teens figures, because the acquisition enlarged the capital base at cycle-peak prices. The reserve revision (Section 2) reinforces that caution: it says part of that enlarged capital base is less economic than its carrying value implied.
DuPont: net margin is the whole story, and it is the swing factor. Decomposing FY2025 return on equity into its three drivers — a net margin of 11.1%, asset turnover of 0.22x (struck on average assets, the DuPont convention, so it differs marginally from the ending-assets figure used for peer comparison in Section 5), and an equity multiplier of 1.85x — produces the depressed ROE of 4.5%. Two of the three components are structural and stable: asset turnover is low by construction (this is an extraordinarily capital-intensive business, and the post-Endeavor asset base makes it lower still), and the equity multiplier is modest, confirming that leverage is not the source of the returns and that the balance sheet is conservatively financed. The entire swing in ROE, up in good years and down in FY2025, comes from net margin — which is to say, from the oil price and, this year, from the impairment that the oil price triggered. ROE here is a commodity-and-accounting number, not a franchise-quality number.
Interest coverage is flattered, and the reported ratio overstates debt-service comfort (RED). Reported interest coverage of 5.2x in FY2025 looks comfortable, but it is computed against the interest-expense figure on the face of the income statement — and that figure is a net number. A large amount of the interest Diamondback actually incurs is capitalised into oil and gas properties rather than expensed, and interest income is netted off as well, so the reported line is a fraction of the gross interest the company genuinely pays to service its debt. On the gross-incurred basis, coverage is materially thinner than the reported ratio implies, and against the impairment-depressed EBIT the gross-basis cushion is slim. Two second-order points compound it: the capitalised interest is being added to the very cost pool that is failing the ceiling test, and the flattering effect widens as capital spending on unevaluated acreage continues. The practical instruction for the separate valuation is that the cost of debt in the WACC must reflect gross interest incurred and the true weighted-average coupon, not the reported net line. Read the reported 5.2x as an upper bound on debt-service comfort, not a fair measure of it.
3.5 Altman Z-Score (Most Recent FY)
| Component | FY2023 | FY2024 | FY2025 |
|---|---|---|---|
| X1 (Working Capital / Total Assets) | -0.017 | -0.040 | -0.038 |
| X2 (Retained Earnings / Total Assets) | 0.086 | 0.063 | 0.067 |
| X3 (EBIT / Total Assets) | 0.158 | 0.065 | 0.018 |
| X4 (Equity / Total Liabilities) | 1.437 | 1.376 | 1.316 |
| X5 (Revenue / Total Assets) | 0.290 | 0.164 | 0.211 |
| Z-Score | 1.44 | 0.97 | 0.85 |
| Zone | Gray | Distress | Distress |
Source: Company SEC filings (10-K); figures per the FL model — see Appendix A.1–A.2.
Read the score, but do not read it as insolvency risk. The Altman Z-Score fell to 0.85 in FY2025, inside the model’s distress zone and down from 0.97 in FY2024 and 1.44 in FY2023. On its face that is an alarming trajectory. In this specific case it is misleading, and the reason is mechanical. The Z-Score is dominated by the EBIT/total-assets term (X3) and the retained-earnings and revenue-to-assets terms — every one of which is depressed by the same two events already dissected: the non-cash ceiling-test impairment that collapsed EBIT, and the Endeavor acquisition that doubled the asset denominator at top-of-cycle values. The model was calibrated on manufacturing balance sheets, not on a full-cost E&P carrying its reserve base at historical cost and running a price-driven impairment through operating income; it reads an accounting mark-down and a large acquisition as distress. The contradicting evidence is decisive and sits elsewhere in this section: operating cash flow of $8,758.0M, free cash flow of $5,235.0M, an undrawn revolver, a laddered maturity profile with no near-term wall, wide covenant headroom, and active early debt retirement. Those are not the attributes of a company near insolvency. The genuine credit signal here is not the Z-Score but the two real risks Section 2 isolates — the recurring impairment mechanism and the sub-100% organic reserve replacement — which threaten long-run value and the resource base, not near-term solvency. Treat the distress-zone reading as a cyclical, accounting-driven artefact, not as a statement about Diamondback’s ability to service its debt.
4. Valuation withdrawn
This section stated what the shares were worth and what to do about them. It rested on an exit multiple set by hand — across the coverage it averaged 24% below where each company actually traded — so the conclusion largely restated that assumption instead of testing it. Rather than leave it standing, it has been withdrawn while the method is rebuilt.
Nothing else in this report depends on it: the financial analysis above and below is drawn from the company's own filings, and every figure links to the page it was verified against.
Section 5 — Financial Metrics & Peer Benchmarking
sources One fact governs this entire section, and it must be held in view from the first table to the last. On undistorted cash measures Diamondback leads both of its peers; on reported earnings multiples it screens expensive — and these are the same fact seen twice, not two independent findings. Diamondback’s free-cash-flow yield of 9.0% is close to double either peer’s (5.1% at ConocoPhillips, 4.6% at EOG), while its price-to-earnings multiple of 36.4x towers over both (18.5x and 15.3x). The P/E gap is not a valuation signal. It is the FY2025 full-cost ceiling-test impairment collapsing the earnings denominator — the same non-cash charge dissected in Sections 2 and 3 — while cash generation, which the impairment never touched, remains genuinely superior. A reader who leaves this section with only the cheap-cash story, or only the expensive-earnings story, has been misled by half the evidence. The subsections below present both and reconcile them.
5.1 Peer Selection
sources The comparison set is two companies — ConocoPhillips and EOG Resources — and the discipline behind that choice matters more than its size. Both peer companies were read directly from their own FY2025 Form 10-K filings held in the subject company folder; no financial-data aggregator supplied any hard figure used in this benchmarking (only the two peers’ current market capitalisations are market-sourced, and they are flagged as such wherever they appear). A third, Permian-pure-play peer was considered and deliberately not added, because in this run it could only have been sourced to web data rather than to a fully-read primary filing. Two peers grounded entirely in primary filings are worth more to a capital-allocation decision than three where one rests on an unverifiable scrape — the set is small by choice, not by omission.
The choice of these two specifically is defensible on scale, quality and capital-allocation grounds, and honest about where it strains. Neither peer is a Permian pure-play, which Diamondback is. ConocoPhillips is a globally diversified major several times Diamondback’s revenue, with Alaskan, Lower-48, Canadian and international LNG exposure; EOG is a multi-basin US producer spanning the Delaware, Eagle Ford, Utica and Powder River, with some international acreage. They are therefore valid benchmarks for scale efficiency, balance-sheet quality, returns discipline and cash-return capacity — but they are not clean same-asset comparables. Commodity mix, basin economics and international exposure all differ, so any conclusion drawn from a single-line difference must ask first whether the difference is operational or simply a function of a different business. Two further structural mismatches, developed at length in 5.8, run underneath every table: both peers use the successful-efforts accounting method against Diamondback’s full cost, which makes every book-value-based comparison directional only; and Diamondback consolidates a large, growing Viper Energy minority interest that neither peer carries, so the parent-versus-consolidated basis must be specified wherever it could move a per-share or returns figure.
| Peer | Ticker | Exchange | Filing Type | Accounting Standard | Fiscal Year End | Comparability Note |
|---|---|---|---|---|---|---|
| ConocoPhillips | COP | NYSE | 10-K | US GAAP (Successful Efforts) | December | Global integrated major, several times FANG revenue; successful efforts; no material minority interest. Scale/quality benchmark, not a same-asset comp. |
| EOG Resources, Inc. | EOG | NYSE | 10-K | US GAAP (Successful Efforts) | December | Multi-basin US producer; successful efforts; no material minority interest. Closest on quality, but not a Permian pure-play. |
Source: Peer-company SEC filings; comparability notes in 5.8 — see Appendix A.1.
5.2 Profitability Comparison
sources Comparative: Most Recent Full Fiscal Year (FY2025)
| Metric | Diamondback Energy, Inc. | ConocoPhillips | EOG Resources, Inc. |
|---|---|---|---|
| Revenue ($M) | $15,026.0M | $58,944.0Mᵍ | $22,632.0Mᵍ |
| Gross Margin | 78.5% | 78.8%ᵍ | 77.7%ᵍ |
| EBITDA Margin | 42.0%ⁱ | 38.0%ᵍ | 47.9%ᵍ |
| EBIT Margin | 8.4%ⁱ | 18.5%ᶜ | 28.2%ᵍ |
| Net Margin | 11.1%ⁱ | 13.6%ᵍ | 22.0%ᵍ |
| FCF Margin | 34.8% | 12.3% | 15.2% |
Source: Peer-company SEC filings; comparability notes in 5.8 — see Appendix A.1.
Flag legend: ⁱ = FY2025 depressed by a non-cash full-cost ceiling-test impairment the peers did not take (5.8, C001); ᵍ = revenue grossed-up by large low-margin trading/marketing throughput, so the reported margin understates true upstream profitability (5.8, C002); ᶜ = analyst-constructed, no reported operating-income subtotal (5.8, C004). Peer figures from ConocoPhillips (10-K, FY2025) and EOG Resources, Inc. (10-K, FY2025).
Historical: Diamondback Energy, Inc. Own 5-Year Progression
| Metric | FY2021 | FY2022 | FY2023 | FY2024 | FY2025 |
|---|---|---|---|---|---|
| Gross Margin | 82.3% | 84.2% | 80.0% | 79.4% | 78.5% |
| EBITDA Margin | 77.6% | 81.4% | 75.1% | 65.5% | 42.0%ⁱ |
| EBIT Margin | 58.9% | 67.5% | 54.3% | 39.7% | 8.4%ⁱ |
| Net Margin | 32.1% | 45.5% | 37.4% | 30.2% | 11.1%ⁱ |
| FCF Margin | 36.1% | 45.5% | 38.3% | 32.0% | 34.8% |
Source: Peer-company SEC filings; comparability notes in 5.8 — see Appendix A.1.
The reported-margin comparison flatters Diamondback, and the flattery must be stripped out before any conclusion is drawn. At first glance Diamondback’s margin profile looks structurally superior: its EBITDA margin of 42.0% sits above ConocoPhillips’s 38.0%, and its net margin appears competitive with a global major’s. Both impressions are largely artefacts of accounting presentation, and they mislead in opposite directions.
The first correction cuts against Diamondback. Both peers run enormous volumes of near-zero-margin third-party commodity trading and marketing through their revenue line — many billions of dollars of purchased commodities at ConocoPhillips and a multi-billion-dollar marketing throughput at EOG, grossed up in both revenue and cost. That pass-through inflates the peers’ revenue denominator and therefore depresses every margin they report. Stripped of it, the peers’ true upstream operating margins are materially higher than the table shows — ConocoPhillips’s underlying EBIT margin well above the reported 18.5%, and EOG’s higher still. Diamondback does the same thing on a far smaller scale, with roughly a tenth of its own revenue being purchased-oil resale booked at essentially no margin (a YELLOW forensic finding, F012, carried from Section 3). The net effect is that a raw margin comparison overstates Diamondback’s relative profitability: the peers are more profitable upstream than their headline ratios imply, and Diamondback less distinct than its headline implies.
The second correction is the one that dominates FY2025. Every FANG earnings-based margin in the comparative column — EBITDA, EBIT and net — is struck on an impairment-depressed base and is not like-for-like with the peers. The pipeline computes EBITDA as EBIT plus D&A only, so the large non-cash ceiling-test charge is not added back; it drags both the EBIT margin down to 8.4% and the EBITDA margin down to 42.0%. The peers took nothing remotely comparable — a negligible charge at ConocoPhillips and a far smaller one at EOG. The clean like-for-like reference is Diamondback’s own FY2024, when the EBIT margin was 39.7% and the net margin 30.2% — figures that place Diamondback’s underlying upstream margins at or above the peers once the peers’ gross-up dilution is also removed. One further caveat sits on the ConocoPhillips column specifically: it reports no operating-income subtotal, so its EBIT margin is analyst-constructed, and an alternative but equally defensible definition would lift it by several points (5.8, C004). The honest summary is that Diamondback’s margin structure is competitive with these large-cap peers on a normalised, mid-cycle basis — but the raw FY2025 table neither proves that superiority nor, read carelessly, disproves it.
5.3 Returns Comparison
sources Comparative: Most Recent Full Fiscal Year (FY2025)
| Metric | Diamondback Energy, Inc. | ConocoPhillips | EOG Resources, Inc. |
|---|---|---|---|
| ROIC | 2.1%ⁱ | 8.4%ˢ | 16.3%ˢ |
| ROE | 4.5%ⁱ | 12.4%ˢ | 16.8%ˢ |
| ROA | 2.4%ⁱ | 6.5%ˢ | 10.1%ˢ |
| Asset Turnover (ending assets) | 0.21x | 0.48x | 0.44x |
Source: Peer-company SEC filings; comparability notes in 5.8 — see Appendix A.1.
Flag legend: ⁱ = FY2025 numerator collapsed by the non-cash ceiling-test impairment (5.8, C001); ˢ = successful-efforts basis vs FANG’s full cost — book-capital and book-equity comparisons are directional only (5.8, C003).
Historical: Diamondback Energy, Inc. Own 5-Year Progression
| Metric | FY2021 | FY2022 | FY2023 | FY2024 | FY2025 |
|---|---|---|---|---|---|
| ROIC | 19.2% | 26.4% | 16.4% | 9.9% | 2.1%ⁱ |
| ROE | 20.9% | 32.4% | 19.9% | 12.3% | 4.5%ⁱ |
| ROA | 10.8% | 17.9% | 11.4% | 6.9% | 2.4%ⁱ |
Source: Peer-company SEC filings; comparability notes in 5.8 — see Appendix A.1.
FY2025 returns are the single most misleading line in this section, and they should not anchor any judgment. Read literally, the table says Diamondback earns a ROIC of 2.1%, a ROE of 4.5% and a ROA of 2.4% — a fraction of both peers, and, on ROIC, far below the 7.09% cost of capital. Taken at face value that would describe a company destroying capital. It is not what is happening. Every FANG return here suffers a numerator collapsed by the non-cash impairment and a denominator — invested capital, equity, assets — structurally enlarged at top-of-cycle prices by the Endeavor combination. The clean reference is again FY2024, where ROIC was 9.9%, ROE 12.3% and ROA 6.9%; those figures narrow the gap to the peers substantially, though they still sit below EOG’s returns, which are the strongest in the set.
Even the FY2024 comparison must carry a health warning, and this is the third material caveat: Diamondback uses full-cost accounting while both peers use successful efforts. [Rating and price target withdrawn — see the note at the top.] Because ROIC, ROE and ROA are all struck on book capital, the cross-company comparison is directional only, never precise; a portion of any gap is method, not performance. What survives all of these adjustments is a genuine structural point visible in asset turnover: at 0.21x on ending assets, Diamondback turns its asset base more slowly than either peer, and the post-Endeavor, top-of-cycle capital base is a real reason its normalised returns now sit lower than its own pre-acquisition high-teens ROIC. One final basis point: Diamondback’s returns are computed parent-attributable, stripping the Viper minority; the peers need no such adjustment because neither carries material minority interest (5.8, C006). The durable-value question — does Diamondback out-earn its cost of capital? — is answerable only on mid-cycle, method-adjusted, parent-attributable numbers, and on that basis it is a closer and more favourable call than the FY2025 row could ever show.
5.4 Leverage & Liquidity Comparison
sources Comparative: Most Recent Full Fiscal Year (FY2025)
| Metric | Diamondback Energy, Inc. | ConocoPhillips | EOG Resources, Inc. |
|---|---|---|---|
| Net Debt / EBITDA | 2.3xⁱ | 0.7x | 0.4x |
| Total Debt / Equity | 0.4x | 0.4x | 0.3x |
| Interest Coverage | 5.2xⁱ | 12.8x | 27.2x |
| Current Ratio | 0.4x | 1.3x | 1.6x |
| FCF Margin | 34.8% | 12.3% | 15.2% |
Source: Peer-company SEC filings; comparability notes in 5.8 — see Appendix A.1.
Flag legend: ⁱ = ratio distorted by the impairment — Net Debt/EBITDA is inflated by a depressed EBITDA denominator, and interest coverage by a collapsed EBIT numerator (5.8, C001; F003).
Diamondback carries the most leverage and the thinnest reported liquidity in the set — but the gap is smaller than the raw ratios suggest, and manageable in cash terms. On the face of it Diamondback screens as the weakest balance sheet: net debt/EBITDA of 2.3x against ConocoPhillips’s 0.7x and EOG’s 0.4x, and a current ratio of 0.4x that is a fraction of either peer’s. Both readings need adjustment. The net-debt/EBITDA multiple is inflated by the same impairment that depressed EBITDA: struck on a clean, pre-impairment EBITDA the multiple falls back toward the materially lower underlying figure Section 3 identified — still above the peers, but not the outlier the table implies. The low current ratio is a policy outcome, not a distress signal: as Section 3 documented, Diamondback deliberately sweeps cash to debt reduction and shareholder returns rather than holding it, the revolver is undrawn, and the maturity ladder has no near-term wall — a GREEN forensic finding on liquidity and maturity structure. Debt/equity of 0.4x is only modestly above the peers, confirming that leverage is not the source of Diamondback’s returns.
Interest coverage carries the section’s most important leverage caveat, and it is a RED forensic finding. Reported coverage of 5.2x already screens as the lowest in the group — but that figure is computed on the net interest line on the face of the income statement, which understates true borrowing cost several-fold because a large share of interest incurred is capitalised into the full-cost property pool and interest income is netted against it. On gross interest actually incurred, coverage is materially thinner than 5.2x, and against impairment-depressed EBIT the true cushion is slim; the peers’ coverage figures (both far higher) are not similarly flattered, so the real coverage gap is wider than the table shows, not narrower. This is why the separate valuation built the cost of debt off gross incurred interest rather than the reported net line. One final leverage point sits off the balance sheet entirely: several billion dollars of take-or-pay transportation and purchase commitments (a YELLOW finding, F013) are additive to on-balance-sheet debt for a true leverage picture and raise shortfall-fee risk precisely when weak prices would make curtailment attractive. The fair conclusion is that Diamondback is the most leveraged and least liquid of the three on reported metrics, that the gap narrows once the impairment distortion is removed, and that it remains serviceable because the earnings collapse behind it is non-cash — but that the reported interest-coverage comfort is the one figure a credit-minded reader should discount, not trust.
5.5 Valuation Multiples Comparison
sources Comparative: Current Price
| Metric | Diamondback Energy, Inc. | ConocoPhillips | EOG Resources, Inc. |
|---|---|---|---|
| EV/EBITDA | 12.5xⁱ ᵐ | 7.0xᵐ | 7.3xᵐ |
| P/E | 36.4xⁱ ᵐ | 18.5xᵐ | 15.3xᵐ |
| FCF Yield | 9.0%ᵐ | 5.1%ᵐ | 4.6%ᵐ |
Source: Peer-company SEC filings; comparability notes in 5.8 — see Appendix A.1.
Flag legend: ⁱ = denominator depressed by the FY2025 impairment (5.8, C001); ᵐ = market-sourced (Tier 2), moves with price. All peer market capitalisations were located via public aggregators and carry no hard filing figure.
Historical: Diamondback Energy, Inc. EV/EBITDA (period-end price)
| FY2021 | FY2022 | FY2023 | FY2024 | FY2025 |
|---|---|---|---|---|
| 5.0x | 3.9x | 5.5x | 6.9x | 10.1xⁱ |
Source: Peer-company SEC filings; comparability notes in 5.8 — see Appendix A.1.
This is where the section’s central fact resolves. Diamondback screens conspicuously expensive on both earnings-based multiples: EV/EBITDA of 12.5x against ConocoPhillips’s 7.0x and EOG’s 7.3x, and P/E of 36.4x against 18.5x and 15.3x — on the surface a rich premium demanding either superior growth, superior returns, or a warning. It is none of those. Both multiples are inflated from the denominator: FY2025 net income is crushed by the impairment (driving the P/E up) and the EBIT-plus-D&A EBITDA is likewise depressed because the charge is not added back (driving EV/EBITDA up). Normalise the denominators to clean, pre-impairment earnings and the apparent premium collapses toward — and on EV/EBITDA largely into — the peer range. The premium is an accounting artefact of the write-down, not a market verdict on quality. [Rating and price target withdrawn — see the note at the top.]
The cash-based multiple tells the opposite — and truer — story. Diamondback’s free-cash-flow yield of 9.0% is undistorted by the impairment (the charge is non-cash and never entered the cash-flow statement) and is close to double both peers’ — 5.1% at ConocoPhillips and 4.6% at EOG. That gap is real and directly comparable, struck for all three on the same organic-development-capex convention. It is the same underlying business seen through a cash lens rather than an earnings lens: expensive on impaired GAAP earnings, cheap on the cash those earnings understated. The one honest qualifier — carried from Section 3 and the separate valuation — is that this FCF is measured before acquisition spend, which for Diamondback exceeded organic capex in FY2025; because the company is not replacing reserves organically, a portion of that acquisition spend is the cost of standing still, so the headline yield advantage is genuine but should not be read as fully distributable. All three valuation multiples are market-sourced Tier 2 inputs and will move with price.
5.6 Efficiency Comparison
| Metric | Diamondback Energy, Inc. | ConocoPhillips | EOG Resources, Inc. |
|---|---|---|---|
| Days Sales Outstanding | 36 days | 39 days | 43 days |
| Days Inventory Outstanding | 11 days | 54 days | 72 days |
| Days Payables Outstanding | 119 days | 179 days | 194 days |
| Cash Conversion Cycle | -72 days | -87 days | -79 days |
| CapEx / Revenue | 23.4% | 21.3% | 29.1% |
Source: Peer-company SEC filings; comparability notes in 5.8 — see Appendix A.1.
The working-capital metrics are low-signal for exploration-and-production companies and should not be read as an efficiency ranking. All three companies show a structurally negative cash conversion cycle — Diamondback at -72 days — which is normal and healthy for a producer that collects from a handful of large, creditworthy buyers while stretching payables that include capital and marketing obligations far larger than production costs. Because these days-metrics are computed on production-cost-only COGS, a small fraction of total activity, the payables figure in particular is inflated and the cycle is deeply negative for all three by construction. They are presented for completeness, not as a scorecard; the modest differences between the companies carry little analytical weight (5.8, C007).
Capital intensity is the line that matters here, and it needs the acquisition caveat to be read correctly. Diamondback’s CapEx/Revenue of 23.4% sits between ConocoPhillips’s 21.3% and EOG’s 29.1%, which would ordinarily read as middle-of-the-pack reinvestment. But all three figures — Diamondback’s included — count organic development capital only and exclude business acquisitions. For Diamondback that exclusion is unusually large: in FY2025 property-acquisition spend exceeded the entire organic capex figure, and because organic reserve replacement ran below 100% of production, a meaningful share of that acquisition spend is maintenance rather than growth. On a reserve-sustaining basis, therefore, Diamondback’s true capital intensity is higher than the 23.4% shown — a point that the separate valuation built directly into its maintenance-capex assumption and that materially affects how much of the FCF-yield lead in 5.5 is genuinely distributable.
5.7 Unit Economics — Cost per Barrel
sources For an oil and gas producer the most informative peer comparison is not a margin or a multiple but cost per barrel. Lease operating expense, depletion and revenue expressed per barrel of oil equivalent strip out both the commodity price and — for the cash line — the accounting method, isolating the operational efficiency that a margin buries; it is the comparison an energy specialist reaches for first, and a reader arriving here will immediately want to know whether Diamondback’s lease operating expense per barrel is competitive with its peers’. Diamondback’s own record on these measures is strong. The honest limitation, stated plainly below, is that this report cannot set that record against ConocoPhillips or EOG on the same basis.
| Metric | FY2020 | FY2021 | FY2022 | FY2023 | FY2024 | FY2025 |
|---|---|---|---|---|---|---|
| Production (MMBOE) | 109.9 | 137.0 | 140.9 | 163.4 | 219.0 | 336.2 |
| Oil % of production | 60.0% | 60.0% | 58.0% | 59.0% | 56.0% | 54.0% |
| Proved reserves (MMBOE) | 1,316.4 | 1,789.0 | 2,033.0 | 2,177.8 | 3,557.4 | 3,617.9 |
| Realized oil price ($/bbl) | $36.41 | $66.19 | $93.85 | $75.68 | $73.52 | $64.04 |
| Revenue ($/boe) | $25.59 | $49.61 | $68.44 | $51.48 | $50.54 | $44.70 |
| LOE ($/boe) | $3.87 | $4.12 | $4.63 | $5.34 | $5.87 | $5.55 |
| DD&A ($/boe) | — | $9.31 | $9.54 | $10.68 | $13.02 | $14.99 |
Source: Diamondback Energy Form 10-K filings (production, realized prices, per-unit lease operating and depletion costs, proved reserves); revenue per boe computed as total revenue divided by production. See Appendix A.1.
[Rating and price target withdrawn — see the note at the top.]
Read as a trend against its own history — the only benchmark this section can legitimately defend for these lines — Diamondback’s unit economics confirm the low-cost-operator characterisation carried from Section 1. Lease operating expense per barrel has held in a remarkably narrow band even as the business scaled from 12.1 MMBOE of production in FY2015 to 336.2 MMBOE, and proved reserves grew from 156.9 to 3,617.9 MMBOE: LOE of $5.55 per boe in FY2025 sits only modestly above the $3.87 cycle trough and well below the $6.84 of a decade earlier — a genuine achievement against the service-cost inflation of the last three years and a mix shift toward a gassier, less oil-weighted stream (oil fell to 54.0% of volumes in FY2025 from 75.0% in FY2015). Revenue per boe of $44.70 tracks the realized oil price ($64.04 per barrel) and that mix rather than any efficiency change, and — because Diamondback’s revenue carries the purchased-oil resale gross-up flagged at C002 — modestly overstates true wellhead revenue in every year; the distortion is broadly constant, so the trend, if not the absolute level, holds. Section 3 develops the drivers behind these lines; the benchmarking point here is narrower — on its own multi-year record Diamondback’s cost structure is competitive and durable.
What this subsection deliberately does not do — and the reader is owed the reason — is rank that cost structure against ConocoPhillips and EOG. No per-barrel peer comparison appears above, and its absence is a sourcing decision rather than an oversight. Every peer figure in this report comes from ConocoPhillips’s and EOG’s own Form 10-K financial statements; neither peer’s production volumes nor its per-barrel cost disclosures were extracted, so there is no primary-sourced lease-operating-expense-per-barrel or depletion-per-barrel figure for either company in this model. Supplying one would require either a third-party aggregator or an analyst estimate, and both are barred by this report’s sourcing standard, which admits only figures traceable to a primary filing. A reader who wants Diamondback’s per-barrel costs set against these two peers should therefore treat it as an open item to be sourced separately — not as a comparison this report has quietly made and buried. It is the one benchmarking question in this section that the available data honestly cannot answer.
Even with peer volumes in hand, one of these lines would still not compare cleanly, and it is worth naming which. Depletion per barrel is governed by the accounting method, and the full-cost-versus-successful-efforts difference already flagged at C003 makes Diamondback’s DD&A per boe structurally unlike either peer’s: Diamondback depletes a full-cost pool that capitalises the exploration and dry-hole costs the peers expense as incurred, producing a different — and typically higher — per-barrel charge for reasons of accounting rather than of reservoir or drilling performance. Lease operating expense per barrel, a pure cash cost, is the line that would carry real signal in a peer comparison; depletion per barrel is not, and would mislead even if the peer figures existed. The clean cross-read is therefore doubly constrained here: the cash line we could benchmark, we cannot source; the line we could source from filings, we could not benchmark like-for-like.
5.8 Comparability Caveats
sources This benchmarking rests on two primary-sourced peers, and its credibility lives in the caveats below rather than in the tables above. Five issues are material — each would change a conclusion if ignored — and three are informational. Every one is reflected in the superscripts and commentary of the preceding subsections; none is raised here only to be forgotten there.
C001 — Diamondback’s FY2025 is impairment-depressed; the peers’ is not (MATERIAL; affects EBIT/EBITDA/net margin, ROE/ROIC/ROA, interest coverage, P/E, EV/EBITDA). Diamondback booked a large non-cash full-cost ceiling-test impairment in FY2025 — a separate income-statement charge, not inside D&A — that collapsed operating income and, because the model computes EBITDA as EBIT plus D&A without adding the charge back, depressed EBITDA as well. ConocoPhillips took a negligible impairment and EOG a far smaller one, neither remotely comparable. Consequence: every FANG FY2025 earnings-based margin, return and earnings multiple in this section is an artefact, not a like-for-like quantity. The reader should benchmark on Diamondback’s FY2024 clean year (EBIT margin 39.7%, ROE 12.3%) or on cash measures. Diamondback’s FCF margin and FCF yield are not distorted — the impairment is non-cash — and remain fully comparable.
C002 — the commodity gross-up dilutes the peers’ margins, cutting against Diamondback (MATERIAL; affects revenue, all margins, asset turnover). ConocoPhillips grosses up many billions of dollars of purchased commodities and EOG a multi-billion-dollar marketing throughput in both revenue and cost — near-zero-margin trading that inflates their revenue denominator and depresses every margin they report. Their true upstream margins are materially higher than the table shows (ConocoPhillips’s underlying EBIT margin well above the reported 18.5%). Diamondback does the same on a much smaller scale via purchased-oil resale, roughly a tenth of its revenue (F012). A raw margin comparison therefore overstates Diamondback’s relative profitability, and the headline margin gap must not be characterised as a pure Diamondback advantage.
[Rating and price target withdrawn — see the note at the top.] Every book-value-based comparison — ROE, ROIC, ROA, and any price-to-book — is therefore directional only, never precise, and the FY2025 impairment is itself a direct product of this accounting choice.
C004 — ConocoPhillips reports no operating-income line (MATERIAL; affects COP EBIT and EBITDA margin). ConocoPhillips’s EBIT is analyst-constructed, deliberately excluding equity earnings, disposition gains and other income so that it mirrors Diamondback’s operating-income definition. An equally defensible alternative — pre-tax income plus interest — would raise ConocoPhillips’s EBIT margin from the reported 18.5% by several points. Wherever ConocoPhillips’s EBIT or EBITDA margin appears (marked ᶜ), read it as one reasonable construction rather than a reported fact.
C005 — neither peer is a Permian pure-play (MATERIAL; affects all metrics). Diamondback is a Permian (Midland plus Delaware) pure-play. ConocoPhillips is a globally diversified major several times its revenue, with Alaskan, Canadian and international LNG exposure; EOG is a multi-basin US producer. They are valid scale, quality and capital-allocation benchmarks, but not clean same-asset comparables — commodity mix, basin economics and international exposure all differ. No pure-play Permian third peer was added because one could not be sourced to a fully-read primary filing in this run, and two primary-sourced peers were preferred over three with one web-scraped.
C006 — minority-interest basis (informational, but decisive for like-for-like work). Both peers report net income fully attributable to the parent with no material minority interest. Diamondback does not: it consolidates a large and growing Viper Energy non-controlling interest, and in FY2025 that interest was a loss rather than a positive share of profit, which is why parent net income exceeds consolidated net income (a RED finding, F002, pre-empted in Section 3). All FANG figures in this section use the parent-attributable basis; the peer figures need no such adjustment. Every per-share, returns and multiple comparison is therefore stated on a consistent parent-attributable footing.
C007 — working-capital-cycle metrics are low-signal for E&P (informational). DSO, DIO, DPO and CCC are computed on production-cost-only COGS, a tiny fraction of activity, so payables (which include capital and marketing obligations) inflate DPO and drive all three companies to deeply negative cash-conversion cycles. They are shown for completeness and should not be presented as an efficiency ranking.
C008 — valuation multiples are market-sourced (informational). EV/EBITDA, P/E and FCF yield are Tier 2: the peer market capitalisations were located via public aggregators, not filings, and enterprise value adds net debt (neither peer carries minority interest). They move with price. Diamondback’s own P/E and EV/EBITDA are additionally impairment-inflated per C001, which is the entire explanation for its expensive earnings screen; its FCF yield is the undistorted and genuinely superior figure.
One-time-items screen before any earnings comparison (F007). Roughly a billion dollars of Diamondback’s FY2025 pre-tax income is non-recurring — divestiture gains, a large net derivative mark-to-market gain, and a gain on repurchasing senior notes below par. Before treating any FY2025 pre-tax or margin comparison as clean, the peers should be screened for their own non-recurring gains and charges; a normalised comparison removes such items on both sides. This reinforces the section’s governing instruction: benchmark Diamondback against these peers on normalised, mid-cycle, cash-based measures, and treat every raw FY2025 earnings line as distorted until adjusted.
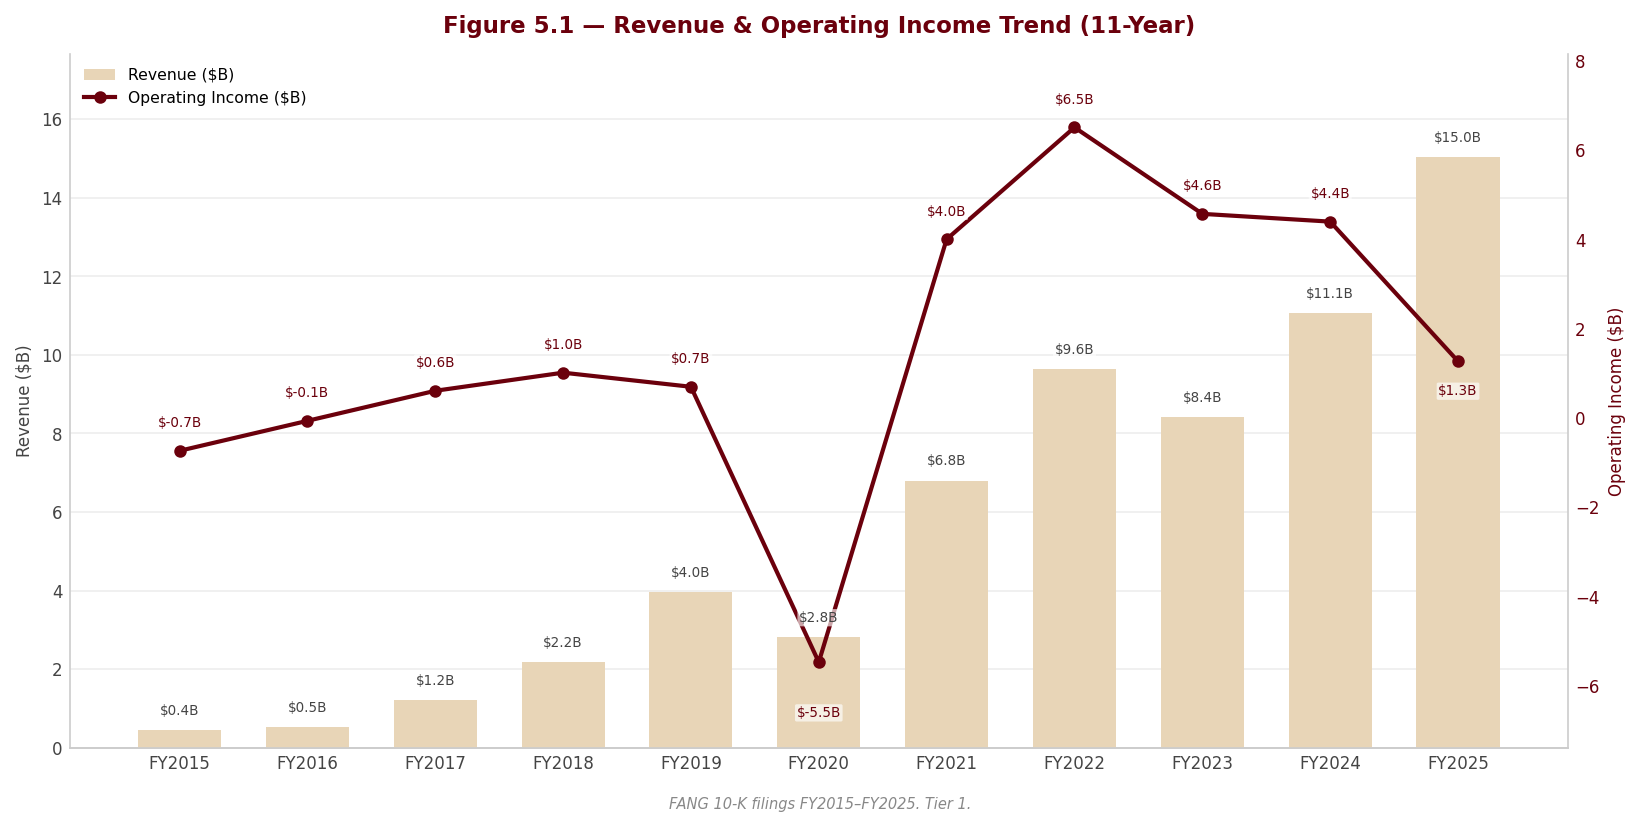
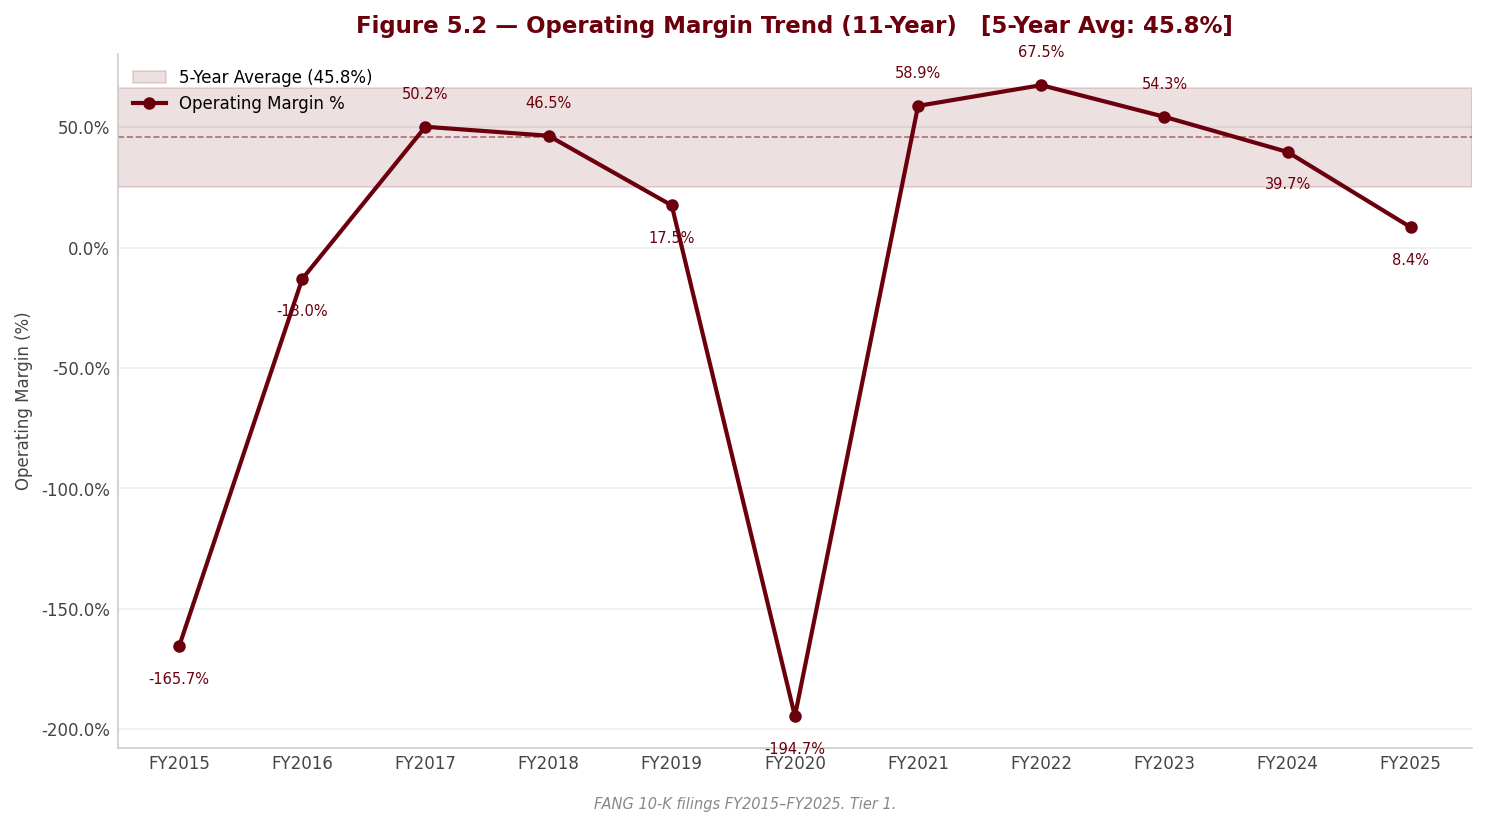
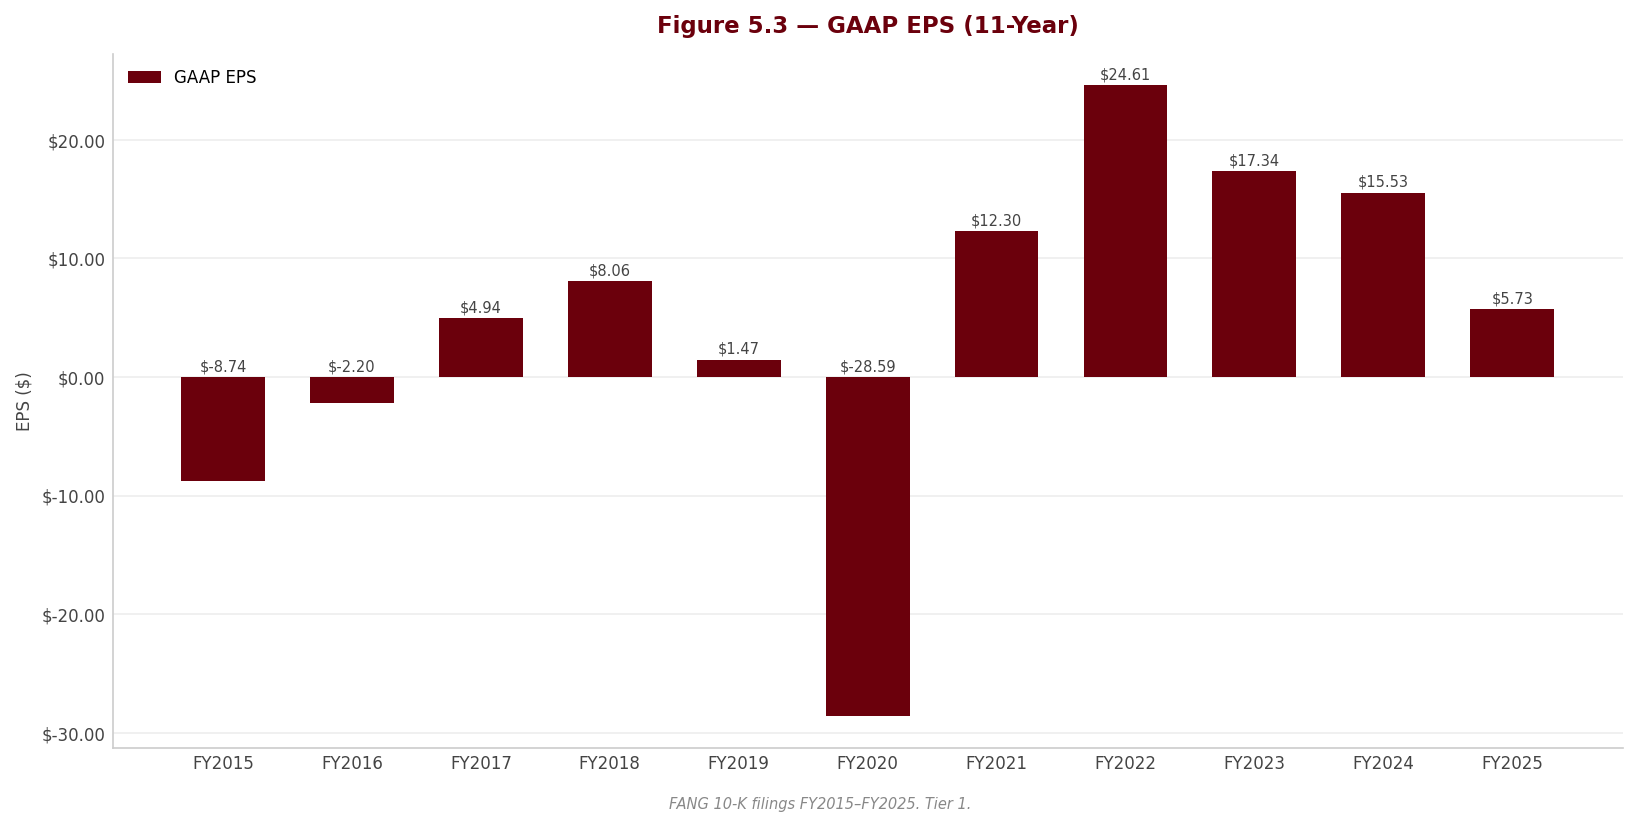
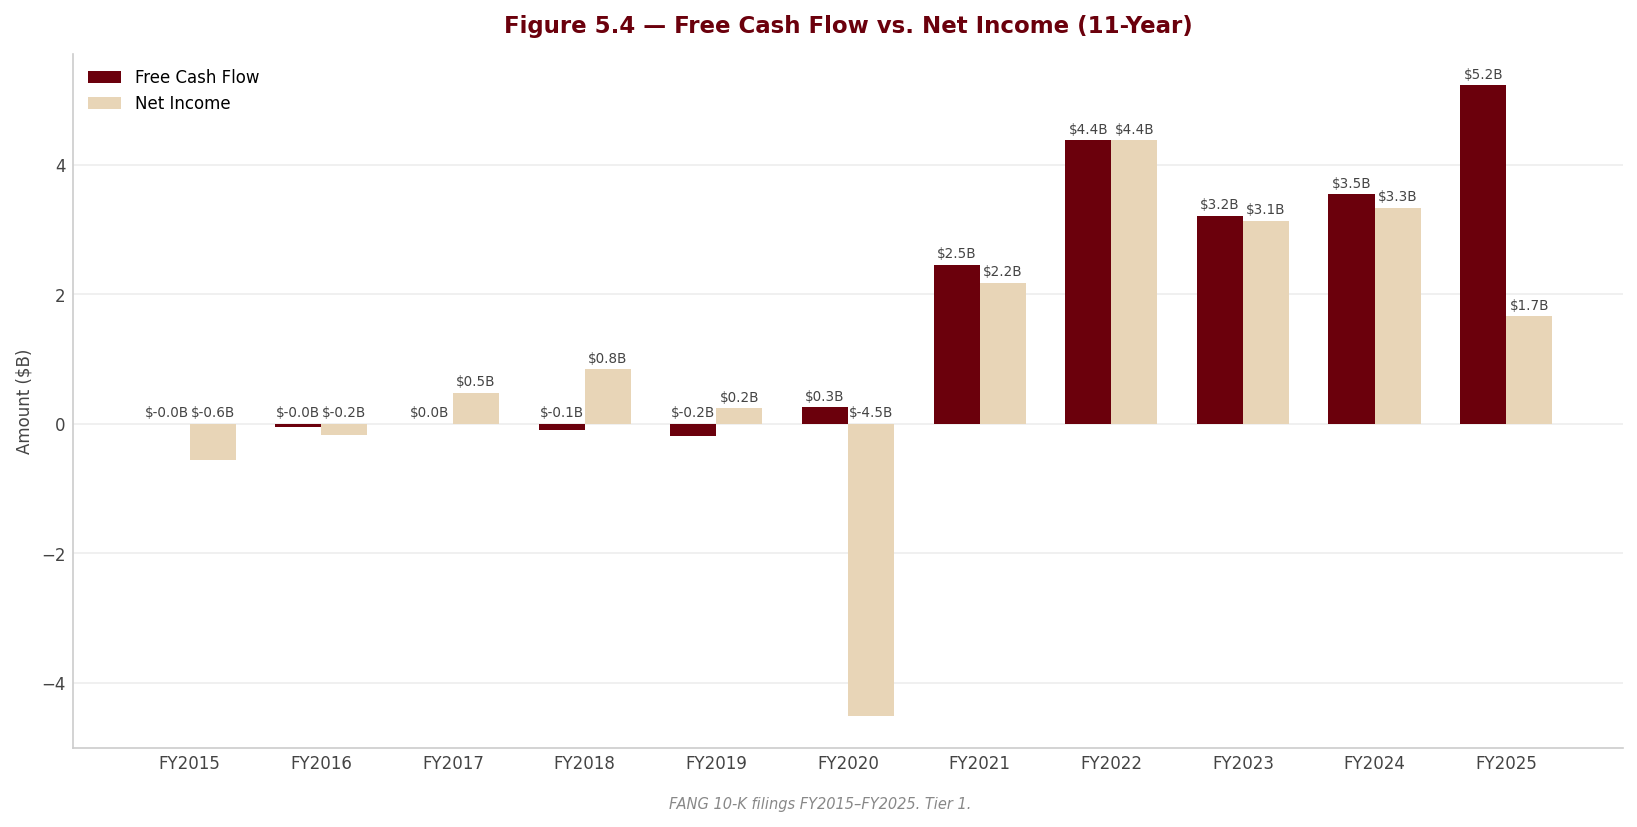
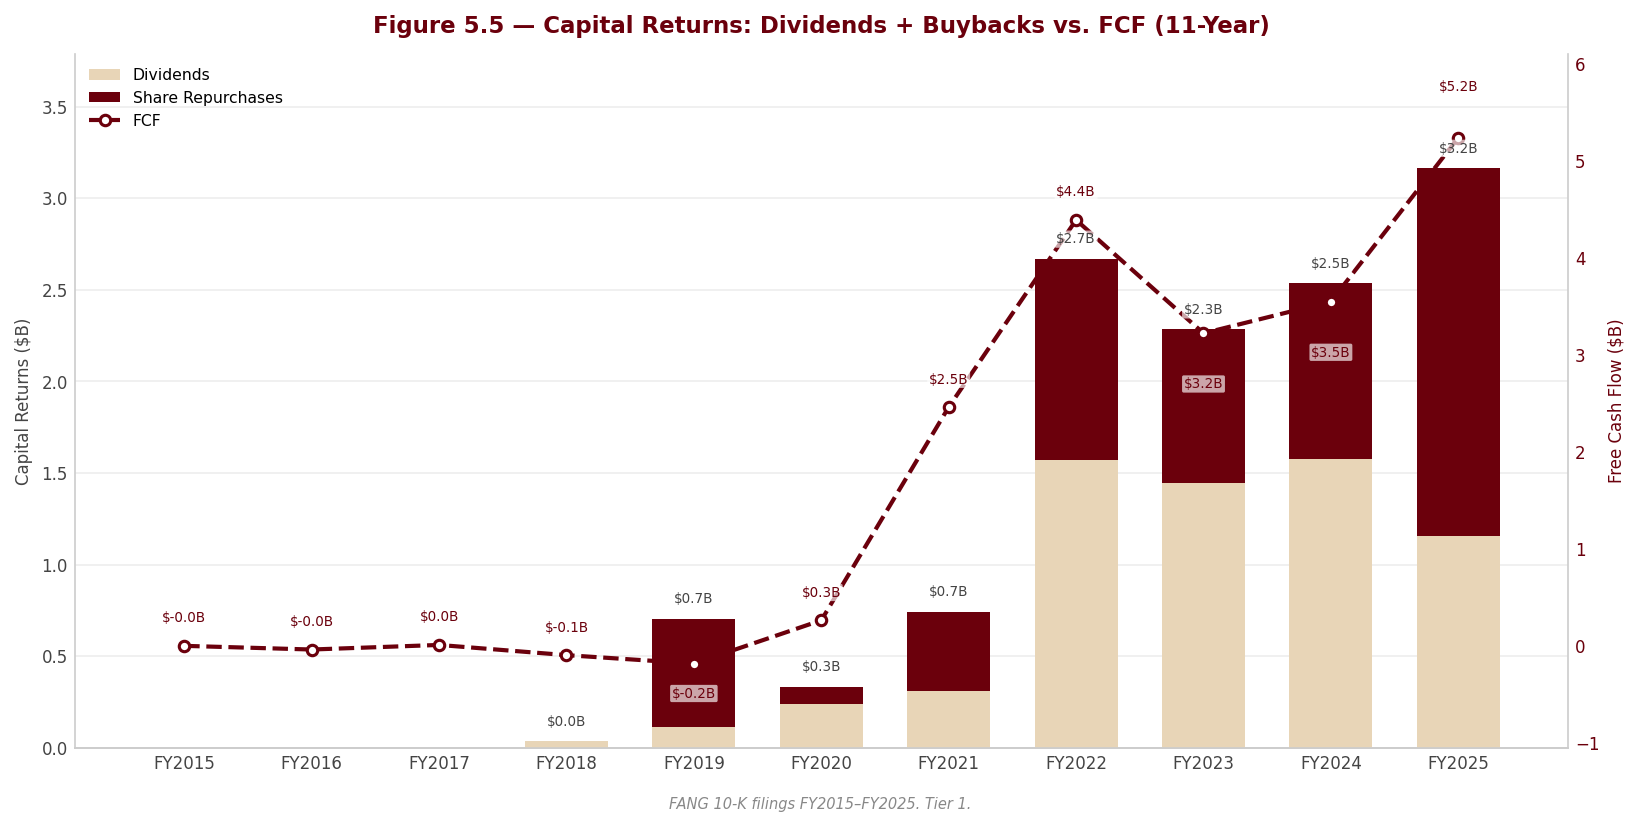
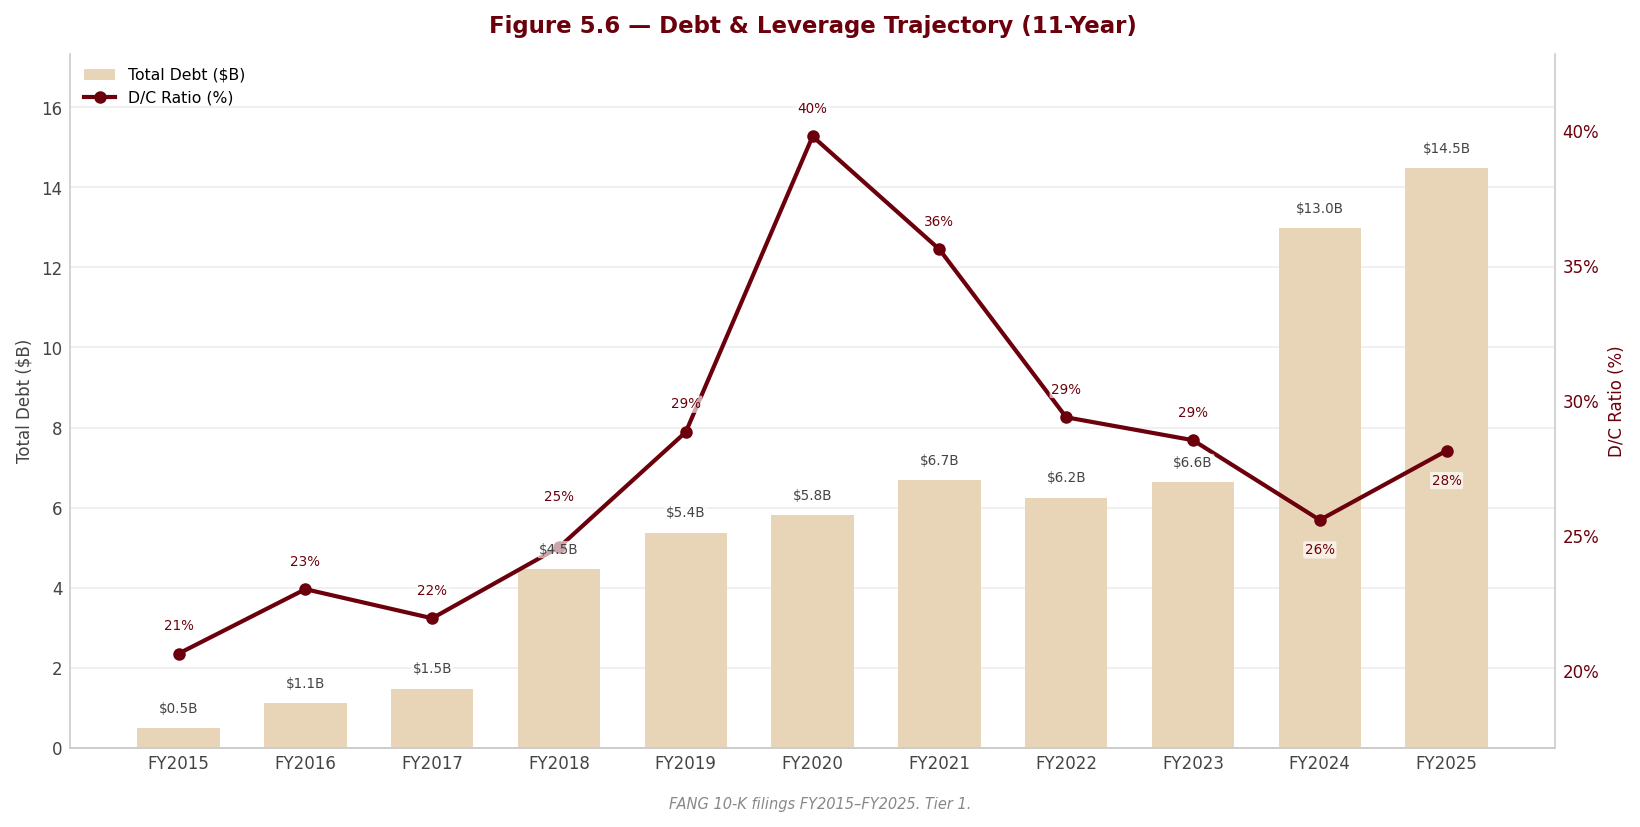
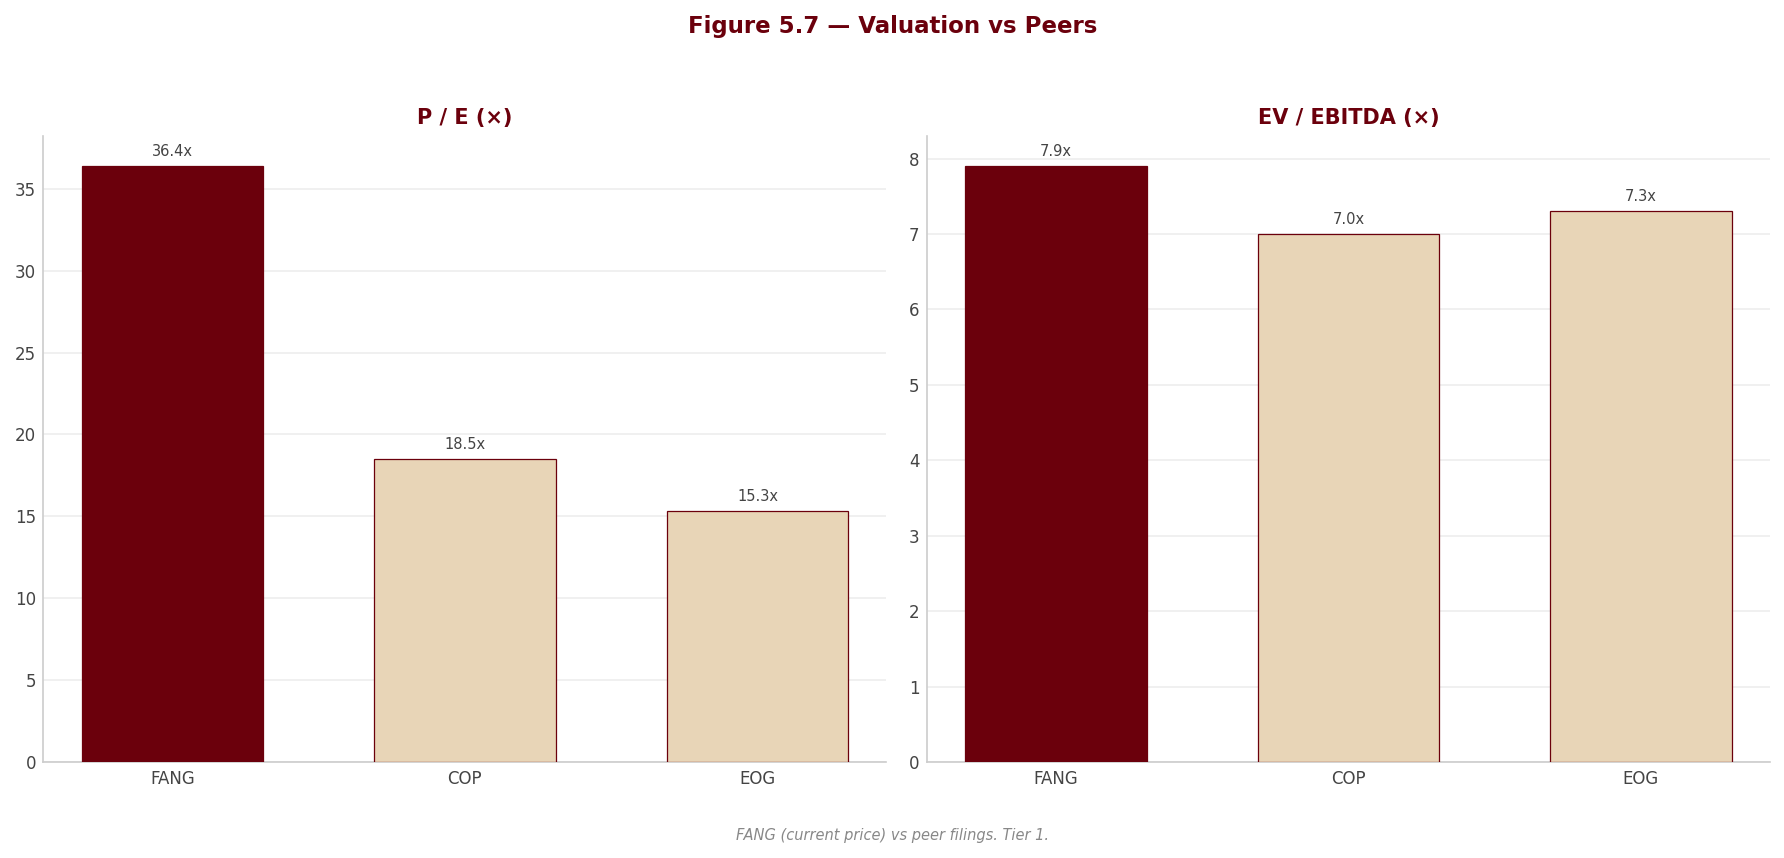
6. Valuation & Price Target withdrawn
This section stated what the shares were worth and what to do about them. It rested on an exit multiple set by hand — across the coverage it averaged 24% below where each company actually traded — so the conclusion largely restated that assumption instead of testing it. Rather than leave it standing, it has been withdrawn while the method is rebuilt.
Nothing else in this report depends on it: the financial analysis above and below is drawn from the company's own filings, and every figure links to the page it was verified against.
Section 7 — Quarterly Update: Q2 2026
sources This update covers Q2 2026 (the three months ended June 30, 2026). All page citations in this section are PDF page numbers of the Q2 2026 Form 10-Q (signed August 5, 2026), read in full for this section. Year-over-year (YoY) comparisons are versus Q2 2025 and sequential (QoQ) comparisons versus Q1 2026.
Read this before the tables below — two comparability points. First, the $1,400M ceiling-test impairment was entirely a first-quarter event; the second quarter is clean. The income statement shows impairment of nil for the three months and $1,400M for the six months ended June 30, 2026 (10-Q pp. 11, 27), and the MD&A states it directly: no ceiling-test impairment was recorded in Q2, and “we do not expect to record additional impairment of our assets in the third quarter of 2026” (10-Q p. 53). Every QoQ percentage on EBIT, net income and EPS is therefore measured against an impairment-crushed Q1 base ($116.0M of EBIT, $25.0M of net income) and is arithmetically explosive but analytically empty; the meaningful sequential comparison is ex-impairment (Q1 EBIT $1,516M, EBITDA $2,809M), against which Q2 EBIT of $2,512.0M is +65.7% and EBITDA of $3,784.0M is +34.7% — still a very strong quarter, driven by price. Second, the YoY comparison is clean-on-clean — no impairment in either second quarter — and shows EBIT +120.5% on revenue +51.2%, almost entirely because realized oil prices rose to $96.82/Bbl as the Middle East conflict moved the global crude market into deficit (10-Q pp. 47, 49).
The Viper wedge, stated once. Consolidated net income was $2,055M; $173M of it belongs to Viper Energy’s outside shareholders, leaving $1,882.0M attributable to Diamondback — the non-controlling interest took 8.4% of consolidated earnings this quarter, against 82.6% in the impairment-distorted Q1 ($119M of $144M) and 5.4% in Q2 2025 ($40M of $739M) (10-Q pp. 11, 18). Diamondback owned approximately 39% of Viper’s combined Class A and B stock fully diluted at quarter end and consolidates it as a VIE (10-Q p. 22).
Portfolio Action
sources [Rating and price target withdrawn — see the note at the top.]
| Assessment | |
|---|---|
| Action | [Rating and price target withdrawn — see the note at the top.] |
| Reason | [Rating and price target withdrawn — see the note at the top.] Revenue of $5,562.0M (+51.2% YoY) and EBIT of $2,512.0M (+120.5%) rest on a realized oil price of $96.82/Bbl (+31.8% QoQ) — the MD&A’s own bridge attributes $861M of the $961M sequential revenue gain to price and only $100M to volumes (10-Q pp. 49, 51). [Rating and price target withdrawn — see the note at the top.] |
| Thesis intact? | PARTIALLY — and the parts that weakened are the risk legs, not the valuation leg. The impairment cycle paused (no Q2 charge; Q3 all-clear guided, 10-Q p. 53) and trailing SEC prices are now rising; the SGF governance overhang eased materially (zero related-party repurchases in Q2, the Endeavor bloc down to 26.7% from 30.2%, and the quarter’s 756 thousand repurchased shares all open-market at an average $186.63 — 10-Q pp. 30, 73); and the quarter was fully self-funded — $2,593.0M of FCF covered ~$1.18 billion of dividends, buybacks, NCI distributions and property acquisitions 2.2× over, with $1,284M of debt retired from the surplus, no disposals required. [Rating and price target withdrawn — see the note at the top.] The model’s ~$65 WTI against a ~$85–86 strip is the live tension of this report — resolving it is a deck revision, an analyst decision, not a quarterly one. |
| Trigger to revisit | [Rating and price target withdrawn — see the note at the top.] |
Source: Diamondback Energy, Inc. Form 10-Q for the quarter ended June 30, 2026; FL valuation model (Valuation sheet) for the rating, fair-value and price references — see Appendix A.1–A.2.
7.1 Results at a Glance
| Metric | Q2 2026 | Q2 2025 | YoY Δ | Q1 2026 | QoQ Δ |
|---|---|---|---|---|---|
| Revenue ($M) | $5,562.0M | $3,678.0M | +51.2% | $4,240.0M | +31.2% |
| Gross Profit ($M) ᵃ | $4,595.0M | $2,879.0M | +59.6% | $3,305.0M | +39.0% |
| Gross Margin | 82.6% | 78.3% | +4.3 pp | 77.9% | +4.7 pp |
| EBITDA ($M) ᵇ | $3,784.0M | $2,405.0M | +57.3% | $1,409.0M | +168.6% |
| EBITDA Margin | 68.0% | 65.4% | +2.6 pp | 33.2% | +34.8 pp |
| EBIT ($M) | $2,512.0M | $1,139.0M | +120.5% | $116.0M | +2,065.5% |
| EBIT Margin | 45.2% | 31.0% | +14.2 pp | 2.7% | +42.5 pp |
| Net Income ($M) ᶜ | $1,882.0M | $699.0M | +169.2% | $25.0M | +7,428.0% |
| Net Margin | 33.8% | 19.0% | +14.8 pp | 0.6% | +33.2 pp |
| Diluted EPS | $6.65 | $2.38 | +179.4% | $0.08 | +8,212.5% |
Formulas, shown once: YoY Δ = (CQ - PYSQ) / |PYSQ| × 100 — e.g. revenue (5,562 - 3,678) / 3,678 × 100 = +51.2%. QoQ Δ = (CQ - PQ) / |PQ| × 100 — e.g. revenue (5,562 - 4,240) / 4,240 × 100 = +31.2%. Margin = line ÷ revenue × 100 — e.g. gross margin CQ = 4,595 / 5,562 × 100 = 82.6%; EBITDA margin CQ = 3,784 / 5,562 × 100 = 68.0%; EBIT margin CQ = 2,512 / 5,562 × 100 = 45.2%; net margin CQ = 1,882 / 5,562 × 100 = 33.8%. Margin deltas in percentage points = CQ margin - comparator margin. The QoQ percentages on EBIT, net income and EPS are measured against the impairment-crushed Q1 base and are not meaningful — see the comparability note at the head of this section; ex-impairment the sequential EBIT gain is +65.7% and the EBITDA gain +34.7%.
ᵃ Gross profit here is revenue less field operating costs (lease operating expenses $552M + production and ad valorem taxes $302M + gathering, processing and transportation $113M = $967M in Q2 2026, against $440M + $214M + $145M = $799M in Q2 2025) (10-Q p. 11). It is not a full cash margin: the $730M of purchased-oil expense that offsets $739M of purchased-oil sales sits below this line — net purchased-oil sales were +$9M this quarter against -$8M in Q1 (10-Q p. 51) — so the 82.6% gross margin overstates the true field margin. Excluding pass-through purchased-oil sales from both periods, revenue was $4,823M against $3,343M, +44.3%. §
ᵇ EBITDA = EBIT plus depreciation, depletion, amortisation and accretion, with ceiling-test impairments left in — the convention Sections 3, 5 and 6 use. This is why Q1 2026 EBITDA is $1,409.0M and the +168.6% sequential move is an artefact of the impaired base: adding back the Q1 charge, Q1 EBITDA was $1,409M + $1,400M = $2,809M (66.3% margin) and the sequential gain is +34.7% at a +1.7 pp margin.
ᶜ Net income is the figure attributable to Diamondback Energy, Inc. Consolidated net income was $2,055M in Q2 2026, $739M in Q2 2025 and $144M in Q1 2026; the Viper non-controlling interest took $173M, $40M and $119M respectively (10-Q pp. 11, 18, 20). Diluted EPS equals basic in all periods — zero potentially dilutive shares (10-Q p. 35). §
Source: Diamondback Energy, Inc. Form 10-Q for the quarter ended June 30, 2026 — Condensed Consolidated Statements of Operations (10-Q p. 11); Q1 2026 comparatives per the MD&A sequential-quarter tables (10-Q pp. 49–55), which the Company itself uses as its primary results discussion (10-Q p. 48).
E&P operating KPIs — the block that actually explains the quarter
| KPI | Q2 2026 | Q1 2026 | QoQ Δ | 1H 2026 | 1H 2025 | YoY Δ (1H) |
|---|---|---|---|---|---|---|
| Combined production (MBOE) | 92,607 | 88,142 | +5.1% | 180,749 | 160,268 | +12.8% |
| Daily production (BOE/d) | 1,017,659 | 979,356 | +3.9% | 998,613 | 885,459 | +12.8% |
| Daily oil volumes (BO/d) | 525,176 | 520,989 | +0.8% | 523,094 | 485,873 | +7.7% |
| Oil realization ($/Bbl) | $96.82 | $73.47 | +31.8% | $85.26 | $66.99 | +27.3% |
| Natural gas realization ($/Mcf) | $(2.15) | $0.18 | n.m. | $(1.03) | $1.47 | n.m. |
| NGL realization ($/Bbl) | $18.56 | $16.68 | +11.3% | $17.66 | $20.77 | -15.0% |
| Combined realization ($/BOE) | $51.68 | $43.40 | +19.1% | $47.64 | $43.51 | +9.5% |
| Combined realization, hedged ($/BOE) | $52.90 | $45.21 | +17.0% | $49.15 | $44.19 | +11.2% |
| Lease operating expense ($/BOE) | $5.96 | $6.21 | -4.0% | $6.08 | $5.29 | +14.9% |
| Cash operating costs ($/BOE) | $10.96 | $11.26 | -2.7% | — ᵈ | — ᵈ | — |
| DD&A ($/BOE) | $13.74 | $14.67 | -6.3% | $14.19 | $14.74 | -3.7% |
| WTI average ($/Bbl) | — ᵈ | — ᵈ | — | $83.00 | $70.81 | +17.2% |
ᵈ The filing prints cash operating costs per BOE for the standalone quarters only ($10.96 vs $11.26, 10-Q pp. 46, 49) and the WTI benchmark average for the six-month periods only ($83.00 vs $70.81, 10-Q p. 47); the missing cells are not disclosed on the same basis and are not derived here.
Source: Form 10-Q for the quarter ended June 30, 2026 — MD&A selected operating data, sequential quarters (10-Q p. 49) and six-month comparison (10-Q p. 57); cash operating costs and WTI/Henry Hub averages (10-Q pp. 46–47). Hedged prices include settlements of matured commodity derivatives (10-Q p. 49).
Three KPI observations. (i) The quarter is a price event, not a volume event: sequential volumes grew 5.1% while the realized oil price rose 31.8%; production crossed the 1.0 million BOE/d milestone at 1,017.7 MBOE/d (10-Q p. 46). (ii) Natural gas realizations went negative — the Company paid to move gas: -$2.15/Mcf unhedged on 128,279 MMcf, producing negative gas revenue of $(276)M for the quarter (23% of production by BOE earned less than nothing), driven by Waha Hub takeaway constraints with periods of negative regional pricing; hedging recovered most of it (-$0.34/Mcf hedged, roughly $232M of settlement value) and management expects relief “later in 2026” as new takeaway contracts and infrastructure arrive (10-Q pp. 47, 49). (iii) Unit costs finally bent down: LOE of $5.96/BOE from Q1’s $6.21 and cash costs of $10.96 from $11.26, which management attributes to cost-discipline initiatives offsetting volume growth (10-Q p. 51) — though 1H LOE of $6.08 is still +14.9% on 1H 2025, so the YoY structural drift flagged in the Q1 update has moderated, not reversed. [Rating and price target withdrawn — see the note at the top.]
7.2 P&L Drivers
sources Revenue. Revenue rose +51.2% YoY to $5,562.0M and +31.2% sequentially, and the filing’s own bridge allocates the sequential gain almost entirely to price: of the $961M increase in oil, natural gas and NGL revenues (to $4,786M from $3,825M), $861M was higher average prices — largely oil — and $100M higher volumes (10-Q p. 51). The macro driver is named explicitly: the Middle East conflict shifted the global crude market from surplus to deficit in 2026, lifting benchmark prices (10-Q p. 47); realized oil hit $96.82/Bbl against $73.47 in Q1. Against that, natural gas contributed negative $276M of revenue at -$2.15/Mcf on Waha basis blowout (see KPI note ii), and purchased-oil activity — a pass-through that satisfies unused pipeline commitments — added $739M of sales against $730M of expense, net +$9M (10-Q p. 51). Basin concentration remains extreme and slightly tighter: the Midland Basin produced $4,429M of the $4,786M of oil, gas and NGL revenue, 92.5% (Q2 2025: 92.0%), with the Delaware at $354M (10-Q p. 24). On volumes, 1H growth of +12.8% decomposes per management into ~33% from Viper’s Sitio Acquisition, ~16% from Double Eagle, and the remainder organic new wells (10-Q p. 59) — about half the growth was bought, an improvement on the two-thirds of the Q1 disclosure.
Cost and margin. Field operating costs of $967.0M rose +21.0% YoY against +51.2% revenue, so gross margin expanded +4.3 pp to 82.6% — in a price-driven quarter, operating leverage does the work. Sequentially every unit cost fell: LOE $5.96/BOE (-4.0%), GP&T $1.22 (-10.3%), ad valorem taxes $0.66/BOE from $0.93 as valuations reset to lower 2025 prices, while production taxes scaled with revenue at 5.0% (10-Q pp. 51, 53). [Rating and price target withdrawn — see the note at the top.] G&A of $72.0M fell to $0.78/BOE from $0.90 in Q1 (10-Q p. 53). The result: a 68.0% EBITDA margin, +2.6 pp YoY on the impairment-inclusive convention.
Below the line. Interest expense, net of $56.0M was flat YoY ($$56.0M) and down from $63M in Q1 as retirements outran the lost capitalized interest (1H interest expense +$23M YoY, of which $32M was lower capitalized interest and $33M Viper/2035-Notes issuance effects, less $50M saved from retirements — 10-Q p. 65). The quarter’s one large non-operating item is a $134M gain on extinguishment of debt — the April tender repurchased $777M of principal of the 4.400% 2051 and 4.250% 2052 notes for approximately $632M of cash including accrued interest, an average 81.1% of par, plus $51M of 3.250% 2026 notes retired at 99.7% in May (10-Q p. 33). Derivatives added a $49M net gain ($113M of cash received on settlements — the gas hedges doing their job — less mark-to-market: a $262M swing against the unsettled gas book on Waha basis, offset by $194M in favour of the oil book as forward prices fell relative to struck puts, 10-Q pp. 41, 55). [Rating and price target withdrawn — see the note at the top.] Net income attributable of $1,882.0M converts to diluted EPS of $6.65 (+179.4% YoY) — and EPS growth outran net-income growth (+169.2%) because the diluted count fell 3.7% to 281,202 thousand from 292,135 thousand, the cumulative effect of the 2025–26 repurchases including the Q1 SGF purchase (10-Q pp. 11, 35).
7.3 Balance Sheet & Cash Flow
| Metric | Q2 2026 | Q2 2025 | YoY Δ | Q1 2026 | QoQ Δ |
|---|---|---|---|---|---|
| Cash ($M) | $462.0M | $219.0M | +111.0% | $174.0M | +165.5% |
| Net Debt ($M) | $12,152.0M | $14,914.0M | -18.5% | $13,724.0M | -11.5% |
| Net Debt / LTM EBITDA | 1.9× ᵉ | — | — | — | — |
| Total Assets ($M) | $70,218.0M | $71,941.0M | -2.4% | $70,080.0M | +0.2% |
| Equity ($M) ᶠ | $37,900.0M | $38,881.0M | -2.5% | $36,473.0M | +3.9% |
| OCF ($M) | $3,589.0M | $1,677.0M | +114.0% | $1,828.0M | +96.3% |
| CapEx ($M) ᵍ | $996.0M | $864.0M | +15.3% | $933.0M | +6.8% |
| FCF ($M) | $2,593.0M | $813.0M | +218.9% | $895.0M | +189.7% |
| Dividends Paid ($M) ᵍ | $310.0M | $291.0M | +6.5% | $295.0M | +5.1% |
YoY and QoQ percentages use the same formulas as 7.1 — net debt YoY: (12,152 - 14,914) / |14,914| × 100 = -18.5%; net debt QoQ: (12,152 - 13,724) / |13,724| × 100 = -11.5%.
ᵉ LTM EBITDA derivation, on the same impairment-inclusive convention as the 7.1 table: Q3 2025 $2,522.0M + Q4 2025 -$1,393.0M + Q1 2026 $1,409.0M + Q2 2026 $3,784.0M = $6,322.0M (the two 2025 quarters are taken from the workbook’s standalone quarterly series, Data sheet row 20, cols 20–21, because the section-7 data pack carries only the CQ/PYSQ/PQ columns). Net Debt ÷ LTM EBITDA = $12,152.0M ÷ $6,322.0M = 1.9×. As in the Q1 update, this reported figure is not economically meaningful: the trailing year still contains the two ceiling-test charges — $3,652M in Q4 2025 and $1,400M in Q1 2026 — and adding them back gives adjusted LTM EBITDA of $11,374.0M and leverage of 1.1×, the figure a credit committee would use. The 0.8-turn gap between the two is itself the measure of the full-cost distortion, and it narrowed from 1.4 turns last quarter as the impaired quarters age out of the window. Net debt reconciles exactly to the filing: current maturities $1,548M + long-term debt $11,066M - cash $462.0M = $12,152.0M (10-Q p. 14).
ᶠ Equity is total Diamondback Energy, Inc. stockholders’ equity, excluding the non-controlling interest of $6,085M at June 30, 2026 ($6,167M at March 31, 2026; $3,938M at June 30, 2025). Total equity including NCI was $43,985M (10-Q pp. 14, 18, 20). §
ᵍ CapEx and dividends are stored as positive magnitudes in the model and shown as such here; both are cash outflows. CapEx is additions to oil and natural gas properties only ($1,929M for the six months = $933M Q1 + $996M Q2) and excludes the $752M of property acquisitions reported separately in investing activities ($438M of it in Q2); dividends are the cash-flow-statement line ($605M six months = $295M + $310M), while Note 9’s dividend table including dividend-equivalent rights shows $298M and $311M at $1.05 and $1.10 per share (10-Q pp. 16, 35). §
Source: Form 10-Q for the quarter ended June 30, 2026 — Condensed Consolidated Balance Sheets (10-Q p. 14) and Condensed Consolidated Statements of Cash Flows (10-Q p. 16); standalone-quarter cash-flow figures derived by the pipeline as the six-month statement less the Q1 2026 10-Q’s three-month statement (OCF: 5,417 - 1,828 = 3,589).
Balance sheet note. Total debt fell to $12,614M from $13,898M at March 31 and $14,489M at year-end — $1,875M retired in six months — through the April tender ($777M of face for ~$632M of cash), the $51M May repurchase at 99.7%, the full $550M repayment and termination of the 2025 Term Loan on April 22, and the $14M March maturity, with the Viper revolver at $95M drawn (10-Q pp. 31, 33). Both revolvers were simultaneously upsized and extended on June 12, 2026 — Diamondback’s from $2.5 to $3.0 billion and Viper’s from $1.5 to $2.0 billion, both to a June 12, 2031 maturity, at reduced margins — leaving ~$3.4 billion of liquidity ($385M standalone cash plus the fully undrawn $3.0 billion facility) against ~$1.5 billion of senior notes maturing within twelve months (the $698M residual 3.250% 2026 notes and the $850M 5.200% 2027 notes sit in current maturities of $1,548M) (10-Q pp. 14, 31–33, 65). The Q1 receivables balloon partially unwound: oil and gas sales receivables of $1,669M against $1,834M at March 31, still up from $1,128M at year-end on higher prices (10-Q p. 14; Q1 comparative per the Q1 update).
Cash flow note. FCF conversion = FCF ÷ Net Income = $2,593M ÷ $1,882M = 137.8% — and this quarter, unlike Q1, the ratio is meaningful, because the denominator is clean and the cash is operational. Q2 standalone operating cash flow of $3,589.0M nearly doubled YoY, and 1H OCF of $5,417M against $4,032M decomposes per management into +$1.7 billion of revenue (ex-purchased oil), +$198M of derivative settlements and -$98M of cash taxes, less $295M of adverse working capital and $241M of higher cash operating costs (10-Q p. 66). Note the cash-tax reality check: 1H federal cash taxes paid were $799M (10-Q p. 43) — the Q1 update flagged that quarter’s nil federal payment as deferral, not avoidance, and Q2 duly paid it: income taxes payable fell to $230M from $517M at March 31 (10-Q p. 14).
Forensic observations (read from the filing, in order of importance):
- This quarter, the funding analysis flips from the Q1 finding: every use of cash was covered by operations, with room to spare. Q2 FCF of $2,593.0M against the quarter’s uses — $311M of dividends including DERs, $142M of program repurchases including excise tax, $131M of Viper-program repurchases, $159M of NCI distributions and $438M of property acquisitions ($752M six-month less $314M in Q1), roughly $1.18 billion in all — is 2.2× coverage, and the ~$1.4 billion surplus plus $53M of residual asset-sale proceeds funded $1,234M of cash debt retirement — the cash paid; the total debt BALANCE fell $1,284M, the extra $50M being the tender-discount gain and amortization, which is why the headline figures elsewhere read $1,284M — and a $288M cash build (10-Q pp. 16, 18, 33). Q1 needed $1,193M of Viper disposals and share sales to square its arithmetic; Q2 needed none. The quarter demonstrates the franchise’s cash power at high prices — the question the valuation asks is what the same machine yields at $65.
- The April tender monetised the market’s own discount on Diamondback’s long bonds: $777M of face retired for $632M of cash, an average 81.1% of par, booking a $134M extinguishment gain (10-Q pp. 11, 33). [Rating and price target withdrawn — see the note at the top.]
- The return-of-capital architecture was rebuilt in opposite directions within ninety days. The minimum 50%-of-FCF quarterly commitment was removed effective this quarter — and Q2 returns duly ran at ~22% of FCF ($583M of dividends and buybacks against $2,593M) — while on July 30 the board doubled the repurchase authorization from $8.0 to $16.0 billion, leaving $9.9 billion available at July 31 (10-Q pp. 45, 69). Floor removed, ceiling doubled: capital allocation is now fully discretionary, and in Q2 discretion chose debt paydown. For an income-anchored holder the contractual floor is gone; what replaces it is trust in the board’s opportunism.
- The SGF exit facility went quiet — the governance datum of the quarter is an absence. Zero shares were repurchased from SGF in Q2 (10-Q p. 30); the quarter’s entire issuer repurchase was 756 thousand shares at an average $186.63, all under the publicly announced program (444 shares were executive tax-withholding), across May and June (10-Q p. 73). Program-to-date through July 31: 43.0 million shares for $6.1 billion, of which $814M for 5.0 million SGF shares (10-Q p. 69). The Endeavor bloc’s ownership fell to approximately 26.7% at June 30 from ~30.2% at March 31 (10-Q p. 30) — the overhang thins, though the letter agreement (up to 3.0 million shares per quarter at the most recent close, through December 31, 2026) remains alive and unused this quarter.
- The Deep Blue related-party cost base keeps compounding well ahead of volumes. Water-services charges from the 30%-owned JV more than doubled YoY: $84M expensed in LOE (Q2 2025: $35M) plus $66M capitalized into proved properties (Q2 2025: $25M) — $150M combined, +150% YoY against first-half production growth of +12.8%; 1H combined $292M against $144M (10-Q pp. 28–30). The 15-year dedication makes this a locked-in, self-dealt cost lane; it remains the structural residue of the 2025 water divestiture.
- Accrued capital expenditures in payables rose to $1,022M from $850M a year earlier (10-Q p. 43) — $172M of incurred-but-unpaid capex that flatters reported cash capex; the same timing caveat the Q1 update carried, at a similar magnitude.
7.4 Footnote Review
sources Every one of the seventeen notes in the filing was read for this section. Each is addressed below; balance-sheet comparatives are as printed in this filing (versus December 31, 2025) unless a Q1 2026 figure is cited from the prior update.
Note 1 — Description of the Business and Basis of Presentation (10-Q p. 22) One operating and reportable segment (upstream, including Viper and residual midstream). Diamondback owned approximately 39% of Viper’s combined Class A/B stock fully diluted at June 30, 2026 — unchanged from March 31 — and continues to consolidate Viper as a VIE under ASC 810 as primary beneficiary. Prior-period reclassifications immaterial. Significance: unchanged structurally from Q1; this note is the mechanical source of the $173M NCI deduction (see the wedge note at the head of this section). No further sell-down occurred this quarter — but see Note 16’s pending 2026 Drop Down, which moves assets into Viper for units, marginally re-diluting Diamondback’s economic claim on its own minerals.
Note 2 — Summary of Significant Accounting Policies (10-Q p. 23) VIE conclusion re-affirmed; Viper’s assets cannot be used for Diamondback’s general corporate purposes and Viper’s creditors have no recourse to Diamondback. The note restates the March 4/19, 2026 Secondary Offering (~12.9 million Viper Class A shares sold for ~$589M) — a Q1 event with no Q2 sequel. No pronouncements adopted in the period; ASU 2024-03 (expense disaggregation) still pending, no financial-position impact expected. Confirmed unchanged vs. Q1 2026 in substance.
Note 3 — Revenue from Contracts with Customers (10-Q p. 24) Revenue from contracts with customers $5,546M (Q2 2025: $3,666M). The basin disaggregation carries the quarter’s starkest number: Midland Basin natural gas revenue of -$267M and Delaware -$11M — negative gas revenue in both basins — against +$89M and +$8M a year ago. Midland delivered $4,429M of the $4,786M oil/gas/NGL total (92.5%); the Delaware at $354M remains barely larger than a year ago ($246M). Changed vs. PYSQ: the gas sign flip is new and material; the single-basin concentration is unchanged and remains the report’s Risk 3.
Note 4 — Acquisitions and Divestitures (10-Q pp. 24–27) No new 2026 transactions beyond the Q1 Viper Non-Permian Divestiture (February 9, 2026 — ~$610M net proceeds, ~9,400 net royalty acres, ~4,750 BO/d, proceeds repaying the Viper 2025 Term Loan in full), restated unchanged. The 2025 items (EPIC $504M + $96M contingent; Deep Blue water divestiture $694M + $34M equity, gain ~$167M including the $1M Q1 2026 post-closing loss, with up to $200M earn-out receivable / $150M contingent payable across 2026–2028; 2025 Drop Down $873M + 69.63M units; Double Eagle $3.1bn + 6.84M shares; Sitio ~$4.0bn all-equity) are carried forward without change. Significance: a quiet quarter on the deal front — until the subsequent events (Note 16), where Viper resumes buying (Riverbend, closed July 1) and Diamondback drops minerals down (August 3).
Note 5 — Property and Equipment (10-Q p. 27) Gross oil and gas properties $97,578M; accumulated depletion $(18,475)M; accumulated impairment $(13,007)M — unchanged from March 31 apart from a $1M rounding movement, because no Q2 ceiling-test charge was recorded. The note states it plainly: no impairment for the three months ended June 30, 2026 (nor in either 2025 period); the six-month $1.4 billion is entirely Q1. The forward warning is retained verbatim — material write-downs remain possible “if the future trailing 12-month commodity prices decline” — but the operative direction has reversed: SEC Prices are trailing-twelve-month averages, and with WTI averaging $83.00 in 1H 2026 against $70.81 a year ago (10-Q p. 47), the ceiling is now rising. The MD&A extends the all-clear to Q3 2026 (10-Q p. 53). Significance: Risk 1’s transmission channel fired twice and has now paused with cumulative impairment at 13.3% of gross properties; the trigger condition (falling trailing prices) is not currently in force.
Note 6 — Asset Retirement Obligations (10-Q p. 28) ARO closed the half at $547M (opening $542M; additions $8M, acquired $1M, settled/divested $(20)M, accretion $15M, revisions $1M), against $638M a year earlier; current portion $39M. Confirmed materially unchanged in character vs. both comparatives; immaterial to the thesis.
Note 7 — Related Party Transactions (10-Q pp. 28–30) Treated in full below under “Related-party transactions”.
Note 8 — Debt (10-Q pp. 31–33) Total debt, net $12,614M from $14,489M at year-end. [Rating and price target withdrawn — see the note at the top.] Covenants: both borrowers “in compliance with all financial maintenance covenants” — no covenant level and no actual ratio is disclosed anywhere in the filing, so no headroom measurement can be made from this document. Changed vs. Q1 markedly, all in the direction of longer maturity, larger undrawn capacity and lower gross debt.
Note 9 — Stockholders’ Equity and Earnings (Loss) Per Share (10-Q pp. 34–35) Authorization $8.0 billion at quarter end (doubled after quarter end — Note 16). Q2 repurchases: approximately $141M excluding excise tax, all open market; six months $689M including the $509M Q1 SGF purchase; ~$2.0 billion remained available at June 30. Q2 2025 comparator: $398M. [Rating and price target withdrawn — see the note at the top.] EPS is two-class: $11M allocated to participating securities in the quarter; diluted equals basic at 281,202 thousand shares with zero potentially dilutive securities. The ownership-transfer table shows the Q2 change-in-ownership as a $(33)M APIC transfer to NCI. Significance: the capital-returns story is in the composition — see forensic observations 3 and 4.
Note 10 — Equity-Based Compensation (10-Q pp. 36–37) G&A stock compensation $24M (Q2 2025: $21M) with a further $9M capitalized into oil and gas properties under full cost ($10M PY) — the capitalization practice flagged in Q1 persists at the same scale. Unvested RSUs 1,267,116 at $163.53 weighted average ($157M unrecognized over 2.2 years); PSUs 474,947 at $249.28 ($63M over 1.7 years). The March 2026 PSU grant (170,279 units, grant-date fair value $235.63, 3.4% risk-free, 32.0% volatility) pays 0–200% on three-year relative TSR with a modifier lifting the maximum to 250% and a maximum 1,160,668 units awardable. ~3.0 million shares remain under the Equity Plan. Confirmed materially unchanged vs. Q1 apart from normal grant-cycle movement; the 250% cap remains an aggressive upper bound.
Note 11 — Income Taxes (10-Q pp. 37–39) [Rating and price target withdrawn — see the note at the top.] The Q1 Secondary Offering’s $88M taxes-payable / $(26)M deferred-liability APIC effects and $61M Viper deferred-tax-asset step are restated without change. No unrecognized-tax-benefit balance and no uncertain-tax-position movement is disclosed. Cash reality: 1H federal cash taxes paid $799M (Note 14) and the taxes-payable balance fell to $230M from $517M at March 31 — the Q1 cash-tax deferral reversed on schedule, as the prior update predicted.
Note 12 — Derivatives (10-Q pp. 39–41) [Rating and price target withdrawn — see the note at the top.] Gains: total $49M in the quarter (commodity $49M; Q2 2025: $(197)M); net cash received on settlements $113M (Q2 2025: $(37)M), including $1M from early terminations. The book’s structure is unchanged in character — catastrophe protection, not a revenue floor: oil puts at $50.00–$55.00 strikes (Brent, Argus WTI Houston, WTI Cushing) with deferred premiums of $1.28–$1.60/Bbl running through Q3 2027, one 15,000 Bbl/d put spread with a $50.00/$55.00 structure, and on gas the Henry Hub two-way collars ($2.87–$2.88 floors, $6.35–$6.37 ceilings on 840,000 then 720,000 MMBtu/d) plus the Waha basis swaps at $(1.87)/$(1.75)/$(1.26) that carried the quarter — the hedged gas realization of -$0.34/Mcf against -$2.15 unhedged is these swaps working exactly as designed. Significance: at current strip the put book is far out of the money (its deferred premiums are a running cost), while the gas basis swaps are the binding protection; below ~$50 WTI the oil floor engages, which is also the region where the ceiling test resumes biting.
Note 13 — Fair Value Measurements (10-Q pp. 41–43) Net commodity derivative assets $68M current / $59M non-current against $36M of current derivative liabilities; the Verde Clean Fuels stake fell to $15M from $30M; the 2026 WTI Contingent Liability is gone (settled $20M in January). Most consequentially: debt with carrying value $12,614M has fair value $12,746M — a $132M premium — against a $99M discount at March 31 and an $8M premium at year-end. The bond market repriced Diamondback’s paper upward with the commodity; the window that made the April tender so cheap (81.1% of par) has partially closed. Changed vs. Q1 in direction; significance noted in forensic observation 2.
Note 14 — Supplemental Information to Statements of Cash Flows (10-Q p. 43) Interest paid $141M net of $258M capitalized (PY: $107M net of $290M). Federal cash taxes paid $799M (PY: $871M); Texas $25M. Accrued capex in payables $1,022M (PY: $850M). No shares or units issued for acquisitions in 2026. Significance: the two cash-flow flattering items from Q1 (deferred federal tax, rising accrued capex) resolved in opposite ways — the tax was paid, the capex accrual persists.
Note 15 — Commitments and Contingencies (10-Q p. 44) Two named matters, both carried forward without change in characterisation and neither quantified nor accrued: the BSEE Louisiana platform decommissioning order (trust contribution “not expected to be material”) and the SLCRMA coastal-erosion suits — the Company remains a defendant in five cases, theories “unprecedented,” claims believed to “lack merit,” defended vigorously, contractual indemnification exercised where applicable. New this quarter: a fixed-price electrical power purchase contract for 2028–2034 committing approximately $28M (2028), $132M (2029–30) and $359M (2031–34) — ~$519M in aggregate (10-Q pp. 44, 69) — a real, priced commitment consistent with powering operations (and the compression/electrification build-out) through the next decade; it embeds fixed cost against a floating-price revenue base.
Note 16 — Subsequent Events (10-Q pp. 44–45) Treated in full below under “Subsequent events”.
Note 17 — Segment Information (10-Q p. 45) One reportable segment; CODM is the CEO/CFO/COO committee; segment profit measure is consolidated net income as reported — the note adds no decomposition beyond the primary statements, so the parenthetical Viper disclosures (cash $77M, oil-and-gas receivables $461M, proved properties $9,608M, long-term debt $1,678M — 10-Q p. 14) and the guarantor summary (below) remain the only windows into the parent/Viper split. Confirmed unchanged in structure vs. Q1.
Guarantor financial information (10-Q pp. 69–70) — not a numbered note, but the filing’s most revealing table. The parent-plus-Diamondback-E&P group (which carries the operated E&P business and the impairment) reported 1H revenues of $4,052M, a loss from operations of $(119)M and a net loss of $(402)M, with the filing’s own footnote cautioning that the impairment “is not indicative of cash flows available for debt service.” Intercompany payables to non-guarantor subsidiaries rose to $8,524M from $6,970M at year-end (+$1,554M in six months) — the operated business’s growing IOU to the royalty/minerals side of the house. Long-term debt at the guarantor group fell to $9,388M from $11,540M, mirroring the retirements.
Related-party transactions (10-Q pp. 28–30, 73)
Diamondback’s two material related-party relationships were both active in the period; every disclosed amount is set out with its comparative.
1 — SGF FANG Holdings, LP (the Endeavor equityholder bloc; related party via the 117.27 million Endeavor Acquisition shares and board-nomination rights of one to four directors while ownership thresholds hold).
| Transaction | Q2 2026 | Q1 2026 | Q2 2025 | Terms |
|---|---|---|---|---|
| Shares repurchased from SGF | Nil | 3.0 million shares, ~$509M excl. excise (~$514M incl.) | Nil | Letter agreement of Nov 28, 2025: up to 3.0M shares/quarter through Dec 31, 2026 at the most recent Nasdaq close; audit-committee approved; remains in force but unused this quarter |
| Company open-market/program repurchases | ~$141M (756 thousand shares at avg $186.63) | ~$39M (267 thousand at avg $146.22) | ~$398M | $8.0bn authorization at quarter end; doubled to $16.0bn on July 30 |
| SGF secondary sales | None disclosed | 12.65M shares at $170.18875 (March 12, 2026) | — | No Company cash involved |
| Endeavor equityholder ownership | ~26.7% at June 30, 2026 | ~30.2% at March 31, 2026 | — | Nomination rights persist |
| Program-to-date SGF purchases | $814M for 5.0M shares (through July 31, 2026) | — | — | 13.3% of the $6.1bn program total |
Source: Form 10-Q for the quarter ended June 30, 2026, Note 7 (10-Q p. 30), Note 9 (10-Q p. 34), Part II Item 2 (10-Q p. 73) and MD&A return-of-capital discussion (10-Q p. 69); Q1 2026 comparatives per the Q1 2026 Form 10-Q as documented in the prior quarterly update.
The terms did not change; the behaviour did. The letter agreement — which fixes price at the most recent close and leaves the Company only the right to decline — was simply not used: zero SGF purchases in the quarter, all 756 thousand repurchased shares open-market at an average $186.63 (444 of them executive tax-withholding shares), and the bloc’s stake fell to ~26.7% through its own third-party sales (10-Q pp. 30, 73). One quarter of restraint does not retire the Q1 finding — the facility runs through year-end and the authorization behind it just doubled — but the exit-facility pattern documented last quarter did not repeat, and each percentage point of SGF sell-down advances the governance-normalisation catalyst.
2 — Deep Blue Midland Basin LLC (30%-owned water JV with Five Point Energy).
| Item | Q2 2026 | Q2 2025 | 1H 2026 | 1H 2025 | Basis |
|---|---|---|---|---|---|
| Lease operating expenses charged by Deep Blue | $84M | $35M | $159M | $72M | Income statement; +140.0% YoY quarter |
| Water services capitalized to proved properties | $66M | $25M | $133M | $72M | Capitalized under full cost; +164.0% |
| Accounts receivable from Deep Blue | — | — | $0M (Dec 31: $1M) | — | Balance sheet |
| Other assets (equity interest) | — | — | $229M (Dec 31: $197M) | — | Balance sheet |
| AP and accrued capital expenditures | — | — | $85M (Dec 31: $71M) | — | Balance sheet |
| Other accrued liabilities | — | — | $63M (Dec 31: $82M) | — | Balance sheet |
Source: Form 10-Q for the quarter ended June 30, 2026, Note 7 — Related Party Transactions (10-Q pp. 28–30). The filing presents Deep Blue balance-sheet comparatives against December 31, 2025 only.
Combined Deep Blue charges were $150M in the quarter against $60M a year earlier (+150%) and $292M against $144M for the half (+102.8%), under the unchanged 15-year, 12-county water dedication — against production growth of +12.8%. The terms are disclosed as unchanged; the scale is not. This remains a self-dealt cost lane growing multiples faster than volumes, with $133M of the half’s charges capitalized into the same full-cost pool the ceiling test measures.
3 — Viper. No new related-party transaction amounts this quarter beyond the consolidated-structure items above; the note cross-references the 2025 Drop Down. The pending 2026 Drop Down (August 3) is next quarter’s related-party event: minerals move from Diamondback to Viper for 3.65 million Viper LLC Units at historical carrying value, common-control accounting (10-Q pp. 44–45).
Contingencies and litigation (10-Q pp. 44, 73)
| Matter | Nature | Amount at stake | Company assessment | Change vs. Q1 2026 |
|---|---|---|---|---|
| BSEE Louisiana platform decommissioning | Decommissioning order naming an Energen corporate predecessor; trust-funding arrangement with other operators | Not disclosed; no accrual | “Not expected to be material” | Repeated without change |
| SLCRMA coastal-erosion suits | Louisiana parishes/State vs. numerous producers; Company defendant in five cases | Not disclosed; no accrual | Theories “unprecedented”; “significant uncertainty” as to scope and damages; claims “lack merit” | Repeated without change; still five cases |
| Ordinary-course proceedings | Royalty, title, contract, employment, antitrust, personal-injury, contamination, environmental | Not disclosed; accrued when probable and estimable | None material if decided adversely | Repeated without change; $1M disclosure threshold for governmental environmental proceedings noted (10-Q p. 73) |
| Risk factors | — | — | “There have been no material changes in our risk factors” from the FY2025 10-K (10-Q p. 73) | No change |
Subsequent events (10-Q pp. 44–45, 69, 73, 75)
Five post-quarter disclosures, all dated:
- Repurchase authorization doubled (July 30, 2026) — from $8.0 billion to $16.0 billion excluding excise tax; ~$9.9 billion available at July 31 (10-Q p. 45). Read together with the Q2 removal of the 50% return-of-capital floor (10-Q p. 69): maximum discretion, maximum capacity, no commitment.
- Viper Riverbend Acquisition closed (July 1, 2026) — all equity of Riverbend Oil & Gas IX for approximately $339M in cash (including $25M escrow already on the June 30 balance sheet) plus 3.69 million Viper Class A shares (10-Q p. 45). Viper resumed buying minerals five months after selling $610M of them.
- Pending 2026 Drop Down (August 3, 2026) — Diamondback divests certain mineral and royalty interests to Viper Energy Partners LP for 3.65 million Viper LLC Units plus equivalent Class B shares; common-control accounting at historical carrying value (10-Q pp. 44–45).
- Q2 base dividend declared (July 30, 2026) — $1.10 per share, payable August 20, 2026, record date August 13; the note adds, for the first time in this phrasing, that “future dividends are at the discretion of the Company’s board of directors” (10-Q p. 44).
- Executive Retirement Policy adopted (August 1, 2026) — accelerated RSU vesting, up to 12–24 months of continued PSU eligibility, prorated bonus and COBRA payment on qualifying retirement (age ≥55, age+service ≥65, ≥10 years, six months’ notice) for the named executives including CEO Kaes Van’t Hof and CFO Jere W. Thompson III (10-Q p. 75). A governance housekeeping item that lowers the cost of orderly senior transitions.
Outlook disclosures (MD&A — the closest this filing comes to guidance): annual production guidance raised 3% to approximately 1,000 MBOE/d — the second consecutive quarterly raise — “based on our assessment of current market fundamentals, including global oil supply constraints that began in the first quarter of 2026,” achieved partly by converting the drilled-but-uncompleted balance (10-Q p. 48); the 2026 capital budget stands at the previously announced ~$3.90 billion ($3.31 billion operated D&C), with 17 rigs and five completion crews running, one rig more than at the Q1 filing (10-Q p. 68); Waha takeaway relief is expected “later in 2026” via new contracts and infrastructure (10-Q p. 47); and the ceiling-test all-clear extends through Q3 2026 (10-Q p. 53). Item 4: disclosure controls effective; Sitio integration may change certain controls — the only ICFR caveat (10-Q p. 72). No director or officer adopted or terminated any 10b5-1 arrangement in the quarter (10-Q p. 75).
7.5 What Changed This Quarter
sources - The impairment cycle paused, and the arithmetic that drove it reversed. No Q2 ceiling-test charge (10-Q p. 27); accumulated impairment sits at $13,007M, 13.3% of $97,578M gross properties; the all-clear now extends through Q3 2026 (10-Q p. 53); and the trigger variable — trailing-12-month SEC Prices — is rising, with 1H WTI at $83.00 against $70.81 (10-Q p. 47). Risk 1 fired twice, then stopped, exactly on the price mechanics the thesis described. - The quarter was a price windfall and the filing says so: of the $961M sequential revenue gain, $861M was price and $100M volume (10-Q p. 51); realized oil $96.82/Bbl (+31.8% QoQ) on a Middle East supply deficit (10-Q p. 47). EBIT of $2,512.0M (+120.5% YoY, clean-on-clean) and 137.8% FCF conversion are what this asset base does at ~$97 oil — the valuation question is unchanged: the deck prices ~$65. - Gas revenue went negative — the first structural leak in the revenue line: -$276M for the quarter at -$2.15/Mcf on Waha takeaway constraints, with the basis swaps recovering most of it (hedged -$0.34) and relief guided “later in 2026” (10-Q pp. 11, 47, 49). Roughly a quarter of production by BOE currently earns nothing. - The quarter self-funded everything — the Q1 funding gap did not repeat. FCF of $2,593.0M covered ~$1.18 billion of dividends, buybacks, NCI distributions and property acquisitions 2.2× over and still retired $1,284M of debt; no disposals, no SGF transactions, no Viper share sales were needed (10-Q pp. 16, 18, 33). Q1 required $1,193M of non-recurring inflows to square the same arithmetic. - Debt was restructured on every axis: the April tender took out $777M of 2051/2052 face at 81.1% of par (gain $134M), the 2025 Term Loan was repaid and terminated ($550M), both revolvers were upsized (to $3.0B and $2.0B) and extended to 2031 at lower margins, and net debt fell to $12,152.0M — 1.9× reported LTM EBITDA, 1.1× adjusted for the two ceiling-test charges (10-Q pp. 31–33). The bond-market discount that funded the tender has since closed to a premium ($12,746M fair value vs $12,614M carrying, 10-Q p. 43). - The return-of-capital regime flipped to full discretion: the minimum 50%-of-FCF commitment is gone as of this quarter, Q2 returns ran at ~22% of FCF — and then the authorization was doubled to $16.0 billion on July 30 with $9.9 billion available (10-Q pp. 45, 69). The floor an income holder relied on has been replaced by board opportunism, currently pointed at debt. - The SGF overhang thinned without Company cash: zero letter-agreement repurchases, the bloc down to ~26.7% from ~30.2%, and the quarter’s entire 756 thousand-share buyback open-market at $186.63 average (10-Q pp. 30, 73). The facility remains alive through December 31, 2026. - Deep Blue related-party water costs hit $150M for the quarter, +150% YoY against first-half production growth of +12.8% ($84M expensed, $66M capitalized; 1H $292M vs $144M) under the unchanged 15-year dedication (10-Q pp. 28–30) — the one related-party cost lane still compounding. - Guidance went up again: production +3% to ~1,000 MBOE/d (second consecutive raise), capital held at ~$3.90 billion, 17 rigs running (10-Q pp. 48, 68) — capital intensity is now flat-to-down per BOE while the DUC balance converts, the most shareholder-friendly production raise available. - Viper churn continues on both sides: Riverbend closed July 1 ($339M cash + 3.69M Class A shares) and the 2026 Drop Down was signed August 3 (minerals to Viper for 3.65M units) (10-Q pp. 44–45) — the minerals vehicle keeps buying while the parent keeps dropping down; each transaction is individually sensible and collectively they keep shifting economics between the 39%-owned vehicle and the parent.
7.6 Portfolio Decision
sources [Rating and price target withdrawn — see the note at the top.]
The quarter is the strongest this company has printed since the Endeavor acquisition, and almost none of that strength is repeatable at the prices the valuation is willing to underwrite. Revenue of $5,562.0M (+51.2%), EBIT of $2,512.0M (+120.5% clean-on-clean), net income of $1,882.0M and 137.8% FCF conversion were delivered by a $96.82/Bbl realized oil price that the filing itself attributes to a war-driven supply deficit; the sequential bridge is $861M price against $100M volume (10-Q pp. 47, 51). Strip out the commodity and what the quarter genuinely proved is operational: unit costs bent down ($5.96/BOE LOE, $10.96 cash costs), production crossed one million BOE/d with guidance raised a second time on flat capital, the balance sheet was shortened and cheapened ($1,284M of debt retired, some at 81 cents), and — for the first time since the related-party finding — the buyback ran entirely at open market with SGF idle and the bloc down to 26.7%. Those are real improvements to the risk profile, and 7.4 documents each one. [Rating and price target withdrawn — see the note at the top.] A price spike that the company itself treats as a reason to pay down debt rather than raise the payout is a price spike the model should not capitalise either. The correct response to a fully-priced windfall quarter is to keep reducing into it.
[Rating and price target withdrawn — see the note at the top.] First, the impairment engine that anchored the bear case has stopped and reversed — trailing SEC prices are rising, the Q3 all-clear is explicit, and cumulative-impairment risk is now a sub-$65-WTI scenario, not a live quarterly event. Second, cash conversion is unimpeachable: the quarter covered every distribution, acquisition and buyback from operations with 2.2× headroom, and the Q1 receivables and deferred-tax flattering both resolved cleanly ($799M of federal cash tax paid). Third — the live tension — the model’s ~$65 WTI deck now sits ~$20 below both the strip and two consecutive quarters of realizations; if hedged realizations hold ≥$75/Bbl through year-end with net debt under $10 billion, the deck itself, not the quarter, becomes the stale input, and revising it is an analyst decision that would mechanically lift $151.14. None of this changes what can be concluded from one war-priced quarter, and none of it makes $208.45 payable against the current model. [Rating and price target withdrawn — see the note at the top.]
What would change this view:
[Rating and price target withdrawn — see the note at the top.] [Rating and price target withdrawn — see the note at the top.] Any of these re-arms a specific risk leg this quarter had disarmed.
Report Versions
Every published version of this report, newest first — each one kept so a reader can see what changed and when.
| Version date | Files |
|---|---|
| 2026-08-20 Current | Model (Excel) |
| 2026-08-12 | Model (Excel) |