
Dover Corporation
Section 1 — Business Overview, Operations & Competitive Positioning
sources
1.1 The Business
sources Dover is a decentralized industrial holding company that owns a portfolio of niche manufacturing businesses — most of them long-standing leaders in small, defensible markets — and compounds shareholder value by running them lean, reinvesting their cash at high returns, and continuously buying more of the same while selling what no longer fits. The economic model is not “make machines”; it is disciplined capital allocation across a stable of businesses that individually throw off more cash than they need to grow. §
Two business archetypes recur across the portfolio and explain why the returns are durable. The first is the component business, which supplies a critical part that is a small fraction of the cost of the customer’s overall system but sits in a demanding application where the cost and risk of switching suppliers dwarf the price of the part itself — a structural source of pricing power and retention. The second is equipment with an aftermarket, where an installed base of Dover machines drives years of recurring, higher-margin demand for parts, consumables, software and service. Management states that recurring revenue is a meaningful share of the total; the practical consequence is that a large slice of the top line is annuity-like rather than tied to new-machine capex cycles. Dover generated $8,092.6M of continuing-operations revenue in its most recent fiscal year across a workforce spread over dozens of operating companies, is incorporated in Delaware, headquartered in Downers Grove, Illinois, and trades on the NYSE under DOV. [Rating and price target withdrawn — see the note at the top.]
Key Information
| Item | Value |
|---|---|
| Ticker | DOV |
| Sector / Industry | Industrials / Diversified Machinery |
| Report Date | 2026-08-05 |
| Most Recent FY Revenue | $8,092.6M |
| EBIT Margin (Most Recent FY) | 17.0% |
| Diluted Shares Outstanding | 138M |
| Current Price | $209.93 |
Source: Company SEC filings (10-K); see Appendix A.1.
1.2 Operating Segments
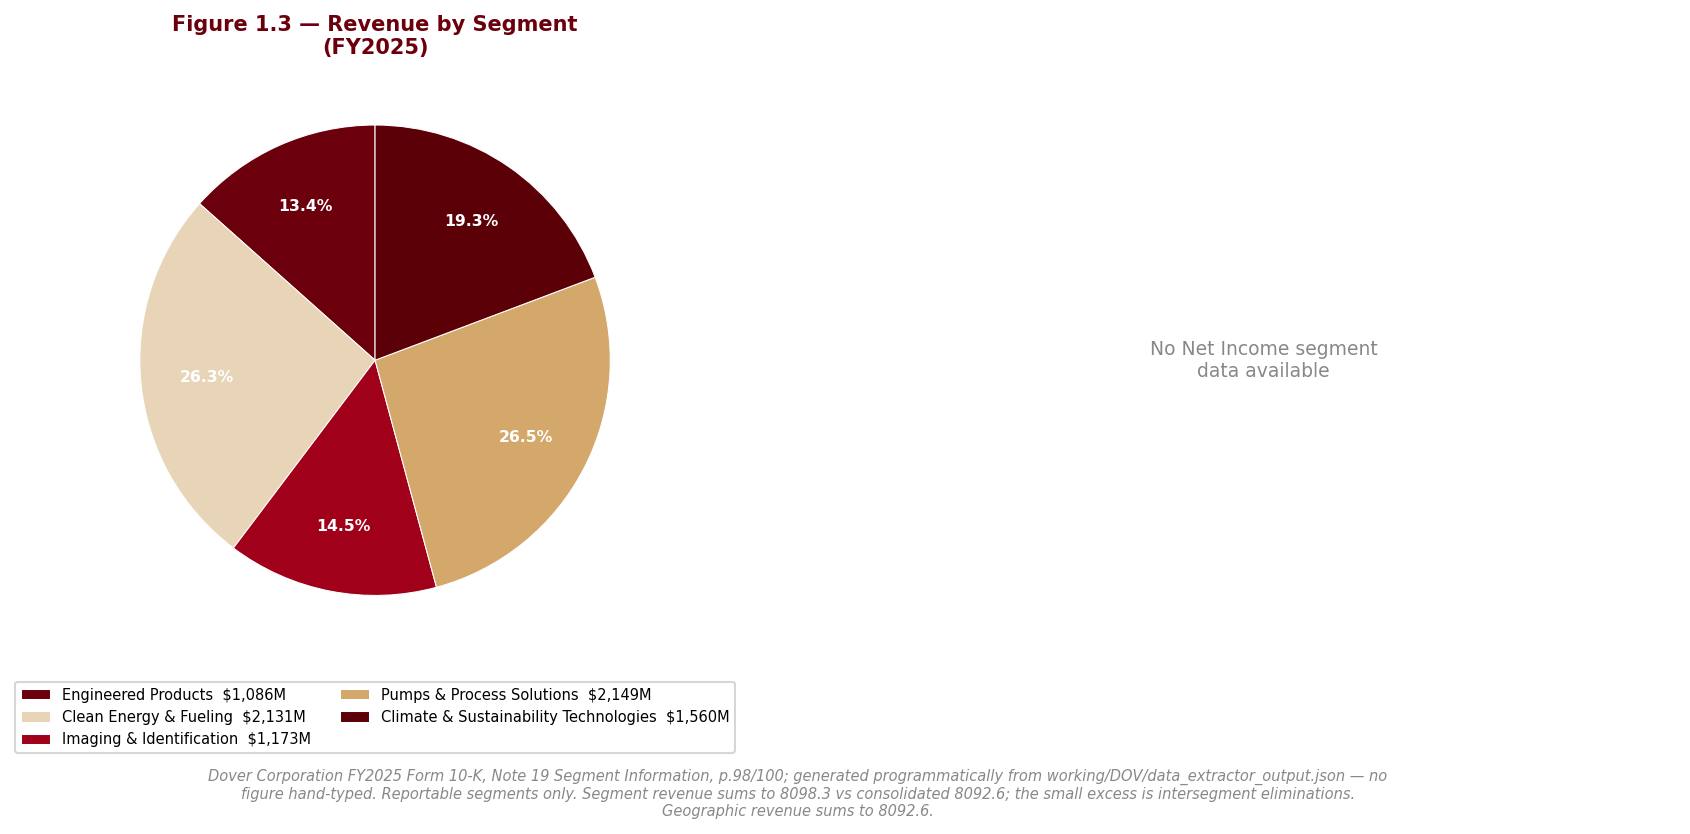
sources Dover reports through five segments, grouped by shared business model and go-to-market rather than by end-market — a structure management says sharpens capital-allocation focus and transparency. Segment-level revenue is not reproduced here in dollar terms; the analytical point is what drives each and how they interlock. §
Engineered Products supplies vehicle-service equipment (lifts, wheel service, diagnostics, collision repair), industrial winches and hoists, precision bearings and drives, and radio-frequency and microwave components for aerospace and defense signals-intelligence and electronic-warfare applications. The single variable that moves this segment is the industrial and vehicle-aftermarket capex cycle, now supplemented by a secular defense-electronics tailwind. Following the recent divestitures of the Environmental Solutions Group and De-Sta-Co, management describes this as the smallest slice of the portfolio, and it was the weakest performer, with vehicle-service volumes the drag.
Clean Energy & Fueling provides the dispensing equipment, payment systems, underground containment, asset-monitoring software and vehicle-wash systems that let retail-fueling and convenience sites — and, increasingly, clean-fuel infrastructure for LNG, hydrogen, cryogenic gases and EV charging — operate safely. Its driver is the retail-fueling capital-expenditure cycle plus environmental-compliance regulation; management frames a fresh North American fueling-capex cycle as being in its early innings.
Imaging & Identification is a global supplier of precision marking-and-coding, product serialization and traceability, brand protection and digital textile printing — equipment sold with a rich stream of consumables, software and service. Its economics are driven by regulatory demand for supply-chain and food-safety traceability; it carries the portfolio’s highest recurring-revenue intensity and its most international footprint.
Pumps & Process Solutions — the priority growth platform — makes specialty and single-use pumps, flow meters, fluid-transfer connectors, polymer-processing equipment and precision components and controls for rotating machinery. Its demand is levered to three genuine secular themes: single-use biopharma manufacturing, thermal connectors and pumps for data-center liquid cooling tied to AI investment, and midstream gas compression and power generation. This was the strongest organic grower.
Climate & Sustainability Technologies supplies commercial CO2 refrigeration systems and display cases, brazed-plate heat exchangers for heat pumps and data-center cooling, and aluminum can-making machinery. Its drivers are the regulatory shift to low-GWP refrigerants, heat-pump adoption and beverage-can demand; project timing in refrigeration made it a modest organic decliner in the year even as heat-exchanger and can-making volumes rose.
The system view: these five segments do not share customers or supply chains in any meaningful way — the synergy is financial and managerial, not industrial. What binds them is a center-led operating layer (shared services, digital, manufacturing-footprint optimization, an India innovation center) that management says is now largely built out, plus centralized access to capital and talent that lets small businesses punch above their weight. That is the flywheel: cash-rich niche leaders fund a corporate center that redeploys their free cash flow into more niche leaders. The fragility is the mirror image — because the segments are unrelated, growth increasingly depends on the acquisition engine rather than on the portfolio compounding organically, a tension we return to in the moat verdict. §
1.3 Geographic Exposure
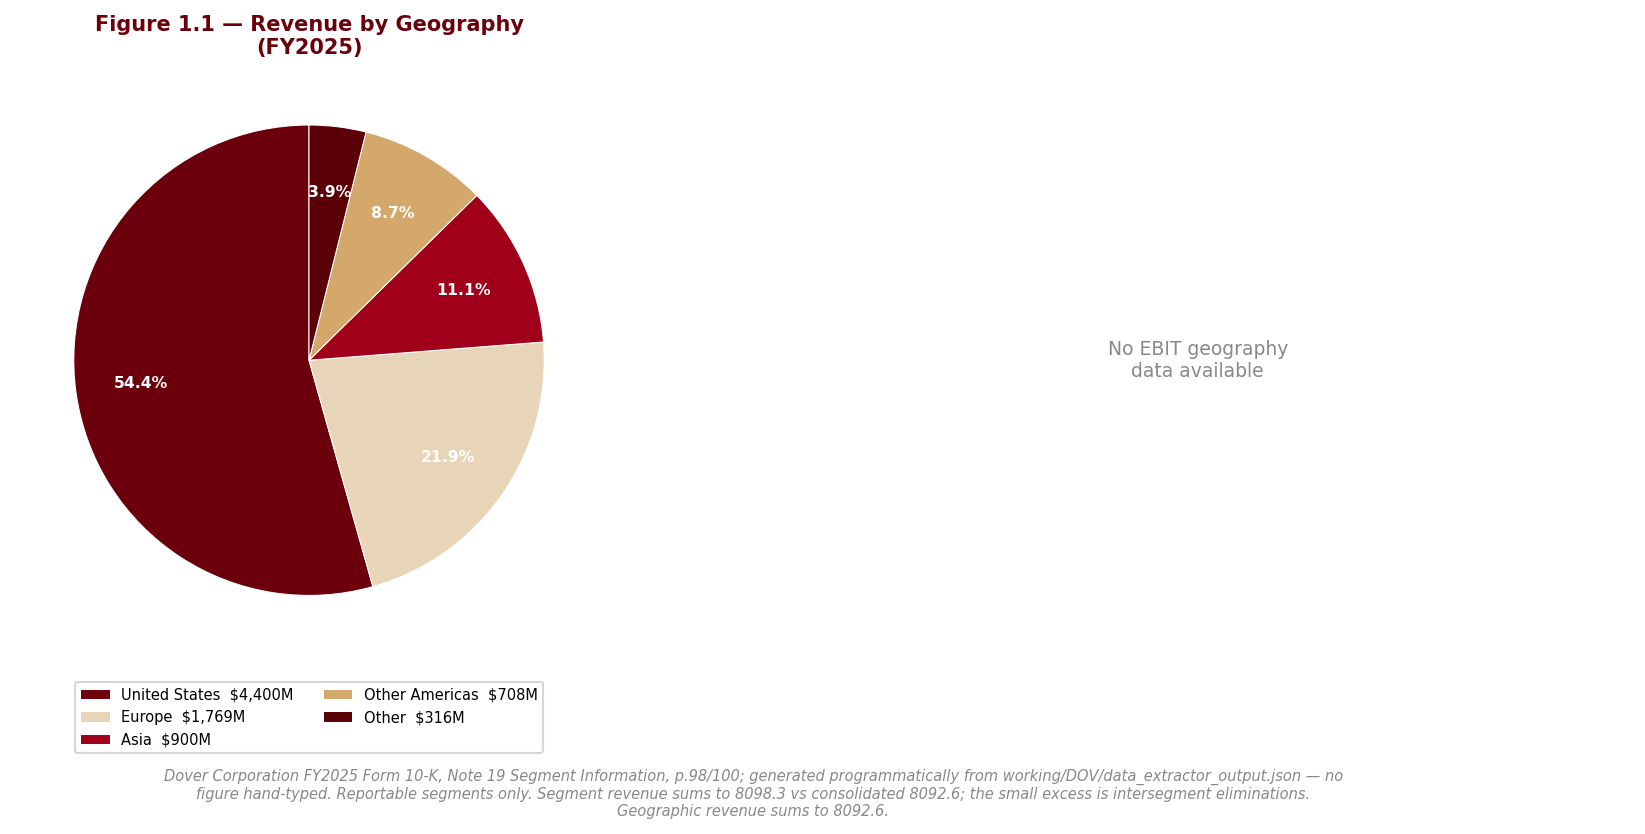
sources Dover earns a substantial portion of revenue outside the United States, with the U.S. its single largest market and a stated strategic push into developing economies across Asia, the Middle East, Eastern Europe and South America; Imaging & Identification is the most internationally weighted segment. In the most recent year U.S. and Asia organic revenue grew while Europe and Other Americas declined. The exposure is real but diffuse rather than concentrated, and it carries two operational realities: translation risk from reporting subsidiary results in a range of currencies (euro, Chinese renminbi, Swedish krona, sterling, Indian rupee and others) into U.S. dollars, and elevated country risk cited by management in Brazil, India and China. Dover partially structures around the currency exposure — it has issued euro-denominated debt designated as a net-investment hedge of its euro operations. The full political, tariff and currency risk detail is developed in Section 2.
1.4 Management Team
sources The clear anchor is CEO Richard J. Tobin, in the seat since 2018 and the architect of the portfolio-focusing, center-led-margin strategy that defines the current Dover — the divestitures of ESG and De-Sta-Co, the build-out of shared services, and the tilt toward higher-growth platforms all bear his imprint. The principal personnel watch item is the finance chair: Christopher B. Woenker became CFO only at the start of the reporting year, and a new Chief Human Resources Officer joined the year prior. We regard the CFO transition as low-risk rather than a red flag — Woenker was promoted internally from a segment-CFO role, so institutional knowledge and continuity of accounting judgment are preserved rather than imported. The governance backdrop is clean: a widely held shareholder base with no controlling owner, a nine-member board with an independent lead director and only the CEO-Chairman as an insider, and no related-party transactions disclosed in the filing — none of the value-extraction dynamics that a concentrated-ownership structure would raise. The thin point to monitor is bench depth in a decentralized model that leans heavily on one long-tenured CEO for strategic direction.
1.5 Capital Allocation Track Record
| Year | Dividends Paid ($M) | Share Repurchases ($M) | CapEx ($M) |
|---|---|---|---|
| FY2021 | $286.9M | $21.6M | $171.5M |
| FY2022 | $287.6M | $585.0M | $221.0M |
| FY2023 | $284.3M | — | $192.6M |
| FY2024 | $283.1M | $500.0M | $167.5M |
| FY2025 | $283.0M | $540.7M | $220.3M |
Source: Company SEC filings (10-K); see Appendix A.1.
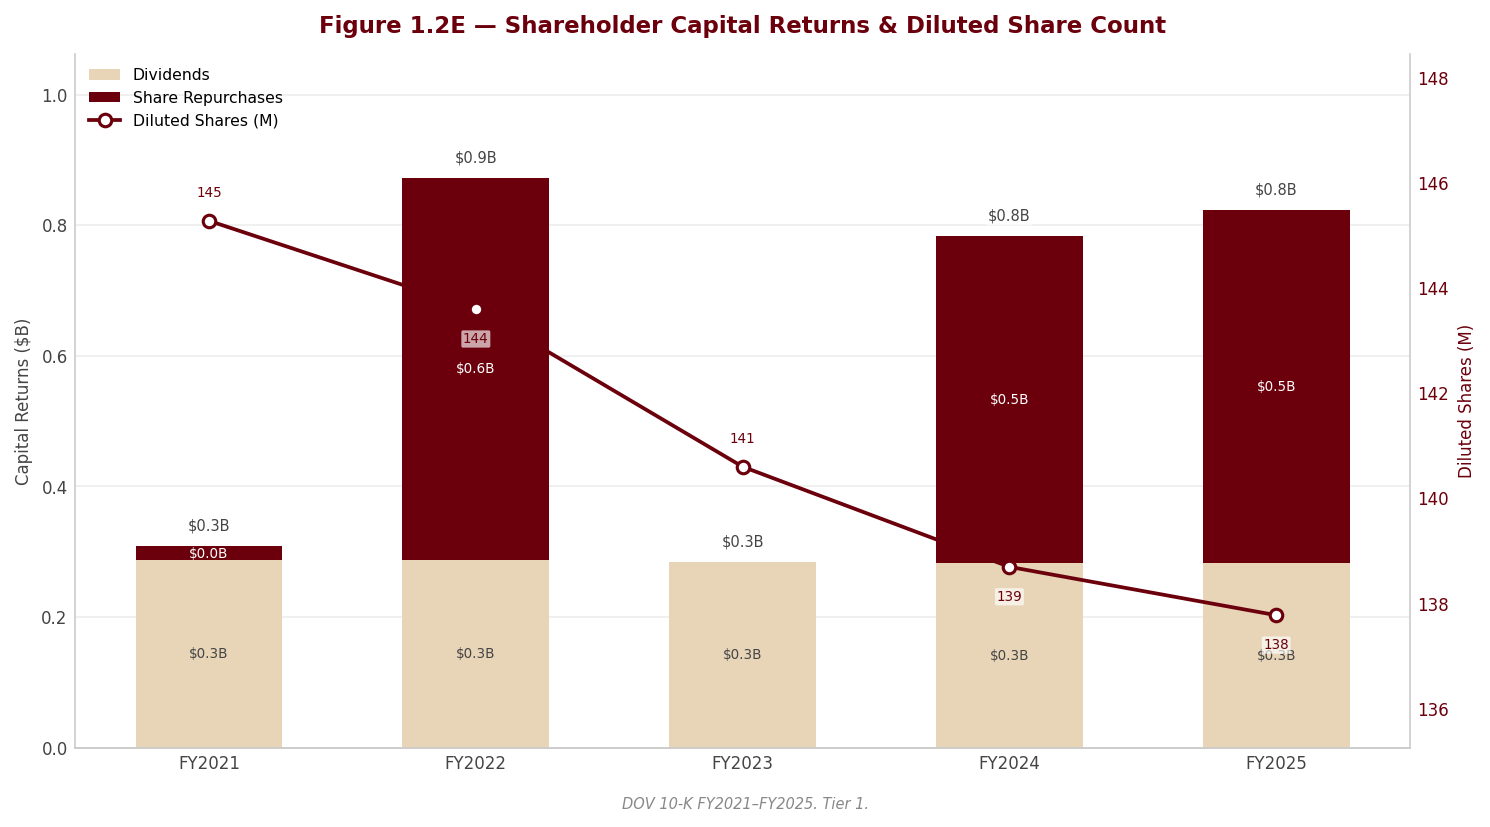
Capital allocation is the core competency here, and management runs an explicit hierarchy: high-return organic reinvestment first, then synergistic bolt-on acquisitions, alongside a steadily growing dividend and opportunistic repurchases — all under an investment-grade financial policy. The signal in the mix is telling. Capital expenditure is deliberately modest and revenue-scaled — Dover is a genuinely low-capital-intensity business, which is what allows so much of operating cash flow to be discretionary. The dividend carries a multi-decade record of unbroken annual increases, one of the longest in the industrial sector, and was raised again in the year; against that steady base, buybacks are the swing lever, executed opportunistically — most recently through an accelerated share-repurchase agreement funded from cash on hand. The FY2025 total shareholder-return yield of 3.1% sits against a dividend payout ratio of 25.8%, a payout comfortable enough to leave ample room for both the buyback and the acquisition program. The through-line is a management team that treats free cash flow as its scarcest resource and reinvestment discipline — not asset intensity — as the source of returns; the low CapEx-to-depreciation profile confirms this is a maintenance-and-productivity capex model, not a heavy growth-build. The one caveat, developed below, is that with organic growth running low, an increasing share of that redeployed cash is going into acquisitions, and the amortization those deals generate is a real and rising cost.
1.6 Competitive Positioning & Moat
sources §1.6.1 Industry structure. Diversified niche industrials is a business where returns are won at the individual-market level, not the sector level. The attractive niches are small enough to deter large, well-capitalized entrants, technically demanding enough to keep out low-cost commodity competition, and structured so that only a handful of credible suppliers compete — on service, quality, engineering and innovation rather than price. Dover states that most of its businesses compete against only a few rivals in exactly this kind of market, and the named competitor set (IDEX, Ingersoll Rand, ITT, Danaher, Nordson, Vontier, Veralto and others) is a roster of specialists rather than mass-market manufacturers. The winners are the incumbents who combine a specified, hard-to-displace product with an aftermarket annuity.
§1.6.2 Competitive advantages. Three moats are supportable from the disclosures rather than asserted. First, switching costs: in the component businesses the part is a small share of the customer’s system cost but critical to its performance, so requalifying an alternative supplier is rarely worth the risk — a structural pricing-power source. Second, an installed-base aftermarket: the equipment-plus-consumables/software/service model (most pronounced in Imaging & Identification) converts one-time equipment sales into recurring, higher-margin revenue that management confirms is a meaningful share of the total. Third, low customer concentration and end-market diversity: Dover serves thousands of customers with no single one representing a material share of consolidated revenue, so the portfolio is insulated from the loss of any single account or the downturn of any single end-market. Management characterizes the resulting financial profile as predictable revenue, low capital intensity and returns on invested capital well above the cost of capital — a characterization the low-capex track record supports.
§1.6.3 Competitive vulnerabilities. The moat is real at the business-unit level but faces three erosion vectors. First and most important, growth is increasingly acquisition-dependent: organic growth in the most recent year was low single-digit and two of five segments declined organically, so the compounding story leans on the M&A engine and on price rather than organic volume — if deal cadence slows or pricing normalizes, headline growth compresses. Second, and directly related, the true cost of that engine is easy to understate. Management’s internal “segment earnings” measure — the number it uses to run and present the business — is defined to exclude both restructuring, which has been charged in every one of the last three years with more signalled for the year ahead, and purchase-accounting amortization, which rises with each acquisition vintage. An analyst who anchors on segment margins will overstate Dover’s profitability and understate the recurring price of its growth model; GAAP operating earnings is the correct anchor, and we use it throughout this report. Third, balance-sheet composition: after years of acquisitions, goodwill and intangibles now approximate the entirety of book equity, and the auditor’s sole critical audit matter is the goodwill impairment test — a reminder that much of the enterprise’s carried value is acquisition-derived and forecast-dependent. Commodity input costs (steel, copper, aluminum) and IP protection in emerging markets round out the list, though management mitigates the former with index-based contracts.
§1.6.4 Verdict. At the level that matters — the individual niche — Dover’s competitive position is genuinely strong, and the switching-cost-plus-aftermarket structure supports durable, above-cost-of-capital margins that we expect to persist. The qualification is not about margin durability but about margin interpretation and growth source: the business earns high returns on the capital already deployed, but its forward compounding depends materially on continuing to buy well, and the accounting Dover highlights flatters both the level and the trend of profitability by excluding costs that recur structurally. [Rating and price target withdrawn — see the note at the top.]
Section 2 — Key Risks & Catalysts
sources
2.1 Downside Risks
sources The risks that matter for Dover are not the operational or macro hazards that dominate a generic industrial risk register — those exist but are diffused across dozens of niche businesses and thousands of customers. The risks that could actually change the investment case are financial-reporting and capital-allocation risks specific to a serial acquirer: how the company frames its own profitability, whether its acquisition engine keeps clearing the cost of capital, and whether the acquisition-derived value now dominating the balance sheet holds. These are risks of interpretation and model durability, not of solvency or governance.
Risk 1 — The headline “segment earnings” measure overstates the true economics of the roll-up
sources This is the single most important risk in the section, and it is an earnings-quality risk rather than a misstatement — the filing is fully GAAP-transparent, the auditor’s opinion is clean, and there is no adjusted-EPS headline. The issue is that the metric management uses to run and present the business, “segment earnings,” is defined to strip out two cost buckets that are not genuinely non-recurring. The first is restructuring, which has been charged in every one of the last three fiscal years, with management explicitly signalling that further programs may be implemented in the year ahead — a cost that recurs by management’s own guidance is an operating cost, not a one-off. The second, and more structurally important, is purchase-accounting amortization, principally the amortization of acquired intangibles, which has risen in each successive year as the acquisition program adds new vintages. Because most of the company’s recent growth came from acquisitions rather than from organic expansion, the amortization being excluded is the direct, recurring price of the growth being counted. An analyst who takes the aggregate segment margin at face value — or who benchmarks it against the industrial peer set — will overstate Dover’s real profitability and understate the cost of its acquisition engine, on both the level and the trend. Why it hits the financials: any earnings-based multiple, margin comparison or forward model built on segment earnings is inflated relative to one built on GAAP operating earnings, which is the correct anchor and which we use throughout this report. What would make it material to a reader: nothing needs to “trigger” — the distortion is present now and widens mechanically as each new acquisition vintage layers on amortization. Free cash flow is unaffected (both excluded buckets are largely non-cash or already sit in cash costs), so the cash story remains genuine; the risk is confined to earnings-based interpretation.
Probability: High (present today) | Timeframe: Immediate and widening | Quantified potential impact: The gap between segment earnings and GAAP operating earnings is material and structurally rising; it is quantified in Section 3, where all margin and multiple work is anchored to GAAP operating earnings. Here the point is qualitative — the presentation flatters both the level and the trend of profitability.
Risk 2 — Growth is acquisition-dependent, and the arithmetic requires every deal to keep clearing the cost of capital
sources Dover’s compounding model requires it to buy businesses continuously. In the most recent year organic growth was only low-single-digit, two of the five segments declined organically, and a meaningful share of even that thin organic figure came from price rather than volume — implying roughly flat-to-negative organic volume. The headline top-line growth therefore leaned materially on acquisitions and on pricing, not on the underlying portfolio compounding on its own. This creates three linked exposures. First, price discipline on the buy side: as competition for quality niche assets rises, the risk is paying up and eroding the return spread. Second, integration and synergy realization, which management itself flags as never assured. Third, and most fundamental, the arithmetic — the model only creates value for as long as incremental deals earn returns above the cost of capital. The counterweight must be stated fairly and is genuine: historically Dover’s returns on invested capital have exceeded its cost of capital, so the engine has demonstrably created value, management reports that recently closed deals are tracking above their underwriting cases, and the current pipeline is described as proprietary and active. The risk is not that the engine never worked — it is that it stops working, through a combination of higher asset prices, slowing organic end-markets and a rising cost of capital compressing the spread. A related, lower-order exposure: Dover has retained or indemnified buyers against certain contingent liabilities on businesses it has sold (tax and environmental among them), and indemnities it received from sellers are often capped, so the portfolio-churn model carries a tail of residual liability on both sides.
[Rating and price target withdrawn — see the note at the top.] The ROIC-versus-WACC spread that governs whether the engine still creates value is quantified in Section 3.
Risk 3 — Acquisition-derived goodwill and intangibles now approach the entirety of book equity
sources After years of acquisitions, goodwill plus net intangible assets have grown to approximate the size of total stockholders’ equity — the balance sheet is now dominated by acquisition-derived, forecast-dependent value. Two features sharpen this into a live risk rather than a static observation. [Rating and price target withdrawn — see the note at the top.] No impairment has been recorded in the last three years, so this is a latent balance-sheet risk, not a realized one.
Probability: Medium | Timeframe: 1–3 years | Quantified potential impact: Non-cash if realized and therefore not a cash or covenant event, but potentially large relative to a single year’s earnings given the scale of the carried balances. The goodwill-and-intangibles-to-equity relationship is quantified in Section 3 and treated as a downside sensitivity in the separate valuation.
Risk 4 — Cyclicality, end-market divergence and input/currency/tariff exposure
sources Beneath the diversified surface, the five segments are cyclically distinct and diverged materially in the most recent year — Pumps & Process Solutions and Clean Energy & Fueling grew organically while Engineered Products and Climate & Sustainability Technologies declined. Diversity dampens the aggregate but does not eliminate it: a broad industrial recession would pressure multiple end-markets at once, could reduce sales and cash flows, and — as management itself notes — could trigger goodwill or long-lived-asset impairment and force more extensive, costly restructuring whose benefits arrive with a lag. Layered on top are input, currency and trade exposures that are specific enough to matter: the businesses consume metals — steel, copper and aluminum in particular — whose prices are volatile and increasingly subject to tariffs, trade barriers and retaliatory measures; management mitigates but does not neutralize this through index-based supplier and customer contracts. A substantial portion of revenue is earned outside the United States and translated back into dollars, so a strengthening dollar creates unfavorable translation and hands lower-cost foreign producers a competitive edge; management cites elevated country risk in Brazil, India and China specifically. Why it hits the financials: these are the classic margin-and-translation swing factors for a global manufacturer, and in a downcycle they compound with the impairment risk in Risk 3.
Probability: Medium | Timeframe: Immediate and cyclical | Quantified potential impact: Not quantifiable ex ante; it is a margin and revenue-translation sensitivity. Segment-level and currency detail is developed in Section 3.
Risk 5 — An unreserved adverse jury verdict and retained disposition liabilities
sources During the reporting year a jury returned a verdict against the divested Environmental Solutions (ESG) business in a commercial dispute alleging breach of contract and inducement of breach of fiduciary duty. Although ESG was sold in the prior year, the litigation predates the sale and Dover appears to retain the exposure. What makes this a watch item rather than routine litigation is the accounting posture: despite an adverse jury verdict already having been rendered, the company has recognized no expense, on the judgment that a loss is not currently probable, and intends to pursue post-trial motions and, if necessary, an appeal. A “not probable” characterization after an adverse verdict is precisely the type of management judgment that merits scrutiny — the reserve is zero against a quantified, already-lost verdict. Why it hits the financials: if the motions and appeal fail, a charge of the order of the verdict amount would flow through discontinued operations with no existing reserve to absorb it — a modest but real single-year hit. It is disclosed, appeal-stage and not yet a base-case charge, but it is a specific, quantified, unreserved contingency and belongs on the monitoring list. More broadly, it illustrates the retained-liability tail of the portfolio-churn model flagged in Risk 2: the company’s own remaining environmental and product-liability contingencies are characterized as immaterial and reserved normally, but disposed-business exposure can outlast the sale.
Probability: Low-to-Medium (verdict rendered; appeal pending) | Timeframe: 1–2 years (appeal cycle) | Quantified potential impact: The verdict amount is a footnote figure carried at Section 3; qualitatively it is a low-single-digit-percent hit to annual continuing earnings if it crystallizes, routed through discontinued operations.
2.2 Upside Catalysts
sources [Rating and price target withdrawn — see the note at the top.] There is no hidden asset, no pending approval, no break-up optionality. The bull case is “the compounder keeps compounding, and organic growth reasserts itself,” which is an earnings-durability catalyst, not a surprise.
Catalyst 1 — Secular demand drivers convert soft organic growth into an organic acceleration
sources The most valuable thing that could happen to this thesis is the one that would directly disarm Risks 1 and 2: a re-acceleration of organic volume that reduces the model’s dependence on acquisitions and price. The pipeline of drivers is real and named across the portfolio — data-center liquid cooling (brazed-plate heat exchangers and thermal connectors), single-use biopharma manufacturing, aerospace-and-defense electronic warfare and signals intelligence, low-GWP CO2 refrigeration systems, and an early-innings North American retail-fueling capital-expenditure cycle. Management reports broad-based bookings growth, with every segment posting bookings gains in the most recent quarter and each of the five segments running a book-to-bill above one — a leading indicator that, if sustained, feeds organic revenue over the following year. [Rating and price target withdrawn — see the note at the top.]
Probability: Medium | Timeframe: 1–2 years | Monitoring trigger: Segment-level organic growth (not total growth) turning up, particularly in the two units that declined; sustained book-to-bill above one across segments; and a narrowing of the gap between total and organic revenue growth.
Catalyst 2 — Accretive deployment of balance-sheet flexibility into the acquisition pipeline
sources Management describes meaningful balance-sheet capacity and “dry powder,” a proprietary and active acquisition pipeline, and recently closed deals tracking above their underwriting cases. If Dover continues to deploy capital into bolt-ons — or a larger platform deal — at returns above its cost of capital, the engine that Risk 2 identifies as the key vulnerability instead becomes the primary value-creation lever. This is the same fact viewed from the other side: the acquisition dependence is a risk if the spread compresses and a catalyst if it holds. Why it matters: accretive M&A is how this model has historically driven per-share value, and the funding is self-generated, so it does not require leveraging up.
Probability: Medium-to-High (deployment is near-certain; accretion is the variable) | Timeframe: Ongoing | Monitoring trigger: Realized return on invested capital holding above the cost of capital (quantified in Section 3); deal multiples paid; and post-close performance disclosures against underwriting.
Catalyst 3 — Margin expansion from a now-largely-built center-led cost structure
sources Management states that its center-led enterprise capabilities — shared services, digital labs, manufacturing-footprint optimization and an offshore innovation center — are largely built out, meaning their cost is now substantially in the base while their benefit scales with future revenue. Combined with the cumulative benefit of the restructuring programs of the last several years, this creates operating leverage: incremental revenue should drop through at a higher margin than the trailing average. Why it matters: it is the mechanism by which even modest organic growth can produce above-average GAAP operating-margin expansion. §
Probability: Medium | Timeframe: 1–2 years | Monitoring trigger: GAAP operating margin (not segment margin) expanding faster than revenue growth; declining restructuring charges as programs complete rather than being renewed.
2.3 Risk & Catalyst Summary
| # | Item | Type | Probability | Timeframe | Status | Monitoring Trigger |
|---|---|---|---|---|---|---|
| 1 | Segment-earnings framing overstates true economics (excludes recurring restructuring and growing acquisition amortization) | Risk | High | Immediate, widening | Active | Widening gap between segment earnings and GAAP operating earnings |
| 2 | Acquisition-dependent growth; deals must keep clearing cost of capital | Risk | Medium | 1–2 yrs, ongoing | Active | ROIC-vs-WACC spread; deal multiples; organic growth ex-M&A |
| 3 | [Rating and price target withdrawn — see the note at the top.] | Risk | Medium | 1–3 yrs | Latent | [Rating and price target withdrawn — see the note at the top.] |
| 4 | Cyclicality, end-market divergence, metals/tariff/FX exposure | Risk | Medium | Immediate, cyclical | Monitoring | Broad industrial downturn; dollar strength; metals prices |
| 5 | Unreserved adverse ESG jury verdict; retained disposition liabilities | Risk | Low-Medium | 1–2 yrs | Monitoring | Post-trial motion / appeal outcome |
| 6 | Secular drivers convert soft organic growth into acceleration | Catalyst | Medium | 1–2 yrs | Monitoring | Segment organic growth turning up; book-to-bill above one |
| 7 | Accretive deployment of dry powder into M&A pipeline | Catalyst | Medium-High | Ongoing | Active | ROIC above cost of capital; post-close vs underwriting |
| 8 | Operating leverage from built-out center-led cost structure | Catalyst | Medium | 1–2 yrs | Monitoring | GAAP operating margin expanding faster than revenue; falling restructuring |
Source: Company SEC filings (10-K) and forensic footnote review; see Appendix A.1.
2.4 Risk Interdependencies
sources The risks above are not independent — the first three form a single, reinforcing chain that is the real fault line in the thesis. It begins with acquisition dependence (Risk 2): because organic growth is soft, the company buys growth. Those acquisitions generate the purchase-accounting amortization that the segment-earnings framing excludes (Risk 1), so the same M&A that props up the top line is the reason the headline profitability metric drifts above GAAP reality — Risk 2 mechanically feeds Risk 1, and the gap widens with every deal. The acquisitions simultaneously build the goodwill and intangibles that now approximate book equity (Risk 3), so the balance sheet’s exposure to a forecast miss grows in lockstep with the earnings-quality gap. The dangerous simultaneous scenario is therefore concrete and specific: a cyclical downturn (Risk 4) hits the organic end-markets, which both slows the demand that would justify the impairment-test growth assumptions — raising the odds of a goodwill charge (Risk 3) — and pressures management to lean harder on acquisitions to maintain headline growth (Risk 2), further widening the segment-versus-GAAP earnings gap (Risk 1) at the exact moment investors are scrutinizing earnings quality most closely. In that state, an analyst anchored on segment margins would be most wrong precisely when being wrong is most costly. Risk 5 is largely orthogonal — a discrete legal tail that would not compound the others — and the CFO transition noted in Section 1 is a mild overlay: a finance chief in his first full year presiding over the impairment-test judgment and the non-GAAP framing is a continuity-of-judgment consideration, though it is mitigated by his internal promotion. The mitigant to the whole chain is the one fact that sits outside it: free cash flow is unaffected by the amortization and restructuring add-backs, so even in the adverse scenario the cash-generative core and the investment-grade balance sheet remain intact — the damage would be to the multiple and to reported earnings, not to solvency.
2.5 ESG & Regulatory Exposure
sources Dover’s ESG and regulatory profile is a source of demand as much as of risk, but several specific exposures in this filing warrant flagging. On the environmental and regulatory side, the company’s growth narrative is itself tied to the regulatory cycle: Clean Energy & Fueling revenue is levered to environmental-safety and fuel-compliance regulation and the retail-fueling capital cycle, and Climate & Sustainability Technologies depends on the regulatory shift to low-GWP refrigerants — a tailwind today, but one that cuts both ways, since a rollback or divergence in sustainability mandates could soften demand for exactly the products management is positioning behind. Management explicitly flags that evolving, sometimes-diverging ESG expectations and mandatory sustainability-reporting requirements could consume resources, reduce demand for certain products, and harm reputation if not met — an unusually candid acknowledgment that the ESG theme is a two-sided regulatory bet, not a one-way tailwind. Dover carries the ordinary environmental-remediation and potentially-responsible-party exposures of a long-lived manufacturer; these are reserved and characterized as immaterial given the number of other responsible parties, and we take them at face value absent evidence otherwise.
On the operational-regulatory side, cybersecurity is a disclosed and live exposure: management states its systems have been, and are expected to remain, targets of cyber attack, that it has experienced incidents in the ordinary course, and that a successful attack could cause production downtime, data compromise, financial loss and regulatory and reputational harm — while confirming that, as of the report date, no threat or incident has materially affected the company. This is a genuine operational risk given the company’s growing base of connected, internet-enabled and AI-embedded products, and it belongs on the watch list even though it has not yet been material. §
On governance, the picture is a clear positive and worth stating explicitly as a counterweight to the risks above. The auditor issued an unqualified opinion on both the financial statements and internal control, with no going-concern language, no material weakness and no restatement — the single critical audit matter (goodwill) is the balance-sheet risk already discussed, not a controls concern. There is no controlling shareholder, no related-party transactions are disclosed in the filing, and the board is independent-led with only the CEO-Chairman as an insider — none of the value-extraction dynamics that a concentrated-ownership structure would raise. The one mild governance-optics item is the auditor’s multi-decade tenure, which is an independence consideration to note rather than a finding. Net, the governance and controls backdrop is clean; the exposures that can move this investment are the financial-reporting and capital-allocation risks in 2.1, not the ESG or governance profile.
Section 3 — Financial Analysis & Historical Performance
sources Three-Statement Linkage Confirmation: - Net Income ties (Income Statement → Cash Flow Statement): Confirmed. Continuing-operations net income is the starting line of the operating cash-flow build in each year, and the discontinued-operations result (principally the FY2024 ESG disposal gain) is presented separately so it does not distort the operating section. - Cash ties (Balance Sheet → Cash Flow Statement): Confirmed. The net change in cash reconciles the opening and closing cash balances on the balance sheet in each year, including the step-up in the FY2024 balance funded by divestiture proceeds. - Retained Earnings reconciliation (Beg RE + NI - Dividends = End RE): Confirmed, on total net income (continuing plus discontinued operations) — not on the continuing-operations net income featured elsewhere in this report. The distinction matters most in FY2024, where the roll-forward step-up is driven by the gain on the disposal of the Environmental Solutions Group, which is recorded in discontinued operations and therefore sits outside the continuing-operations earnings used throughout this analysis. In the remaining years the small residuals reflect share-repurchase retirements and other items routed through equity.
3.1A Income Statement
Source: Dover Corporation FY2025 Form 10-K (Consolidated Statements of Earnings); figures per the FL model — see Appendix A.1–A.2. Net income and diluted EPS are continuing-operations figures throughout; the large after-tax gain on the ESG disposal sits in discontinued operations and is excluded, so reported total FY2024 EPS was materially higher than the continuing-operations $10.09 shown here. The continuing-operations basis is used because it ties to pre-tax income minus tax and is the like-for-like measure across years.
Reading the FY2023→FY2024 line. Reported revenue fell -8.2% to $7,745.9M, but this is an artefact of portfolio change, not demand: FY2023 revenue includes the Environmental Solutions Group (ESG), which was sold to Terex and completed in October 2024, while FY2024 excludes it. On a like-for-like basis — restating the prior-year base to strip out ESG — revenue was modestly higher, so the entire reported decline is the divestiture. The same caveat applies to every FY2024 comparison below.
CAGR Summary
| Metric | 3Y CAGR | 5Y CAGR | 10Y CAGR |
|---|---|---|---|
| Revenue | -1.7% | 3.9% | - |
| EBITDA | 1.3% | 7.7% | - |
| Net Income | 1.0% | 9.9% | - |
| Diluted EPS | 2.4% | 11.1% | - |
| FCF | 24.1% | 3.5% | - |
Source: Company SEC filings (10-K); figures per the FL model — see Appendix A.1–A.2. The 3-year revenue CAGR of -1.7% straddles the ESG divestiture — the FY2022 endpoint includes ESG while the FY2025 endpoint excludes it — and therefore understates the underlying growth rate; the 5-year figure of 3.9% is the cleaner read on trend compounding.
3.1B Income Statement — Analysis
sources The revenue story is portfolio reshaping over organic momentum. Across the window, Dover’s top line compounded at 3.9% on a five-year basis — low-single-digit growth characteristic of a mature, diversified industrial rather than a secular grower. The path was not linear. Revenue surged 18.3% in the FY2021 post-pandemic recovery to $7,907.1M, added a further 7.6% to a cyclical peak of $8,508.1M in FY2022, then eased -0.8% in FY2023 as the industrial short-cycle rolled over. The apparent -8.2% collapse to $7,745.9M in FY2024 is entirely the ESG divestiture, not demand — restating the prior-year base to exclude the sold business, revenue was modestly higher on a like-for-like footing. FY2025 then returned to reported growth of 4.5%, reaching $8,092.6M.
But the composition of that FY2025 growth is the analytically important point, and it is a watch item. Per management’s own disclosure (forensic flag F006), of the 4.5% consolidated increase, only a small fraction was organic; the larger part came from acquisitions, with a further favourable currency contribution, net of a disposition drag. And within that thin organic layer, pricing did most of the work — which implies organic volume was roughly flat to slightly negative. Two of the five segments, Engineered Products and Climate & Sustainability Technologies, declined organically, while Pumps & Process Solutions and Clean Energy & Fueling carried the portfolio. [Rating and price target withdrawn — see the note at the top.] This ties directly to the earnings-quality point below and to the acquisition-dependence risk developed in Section 2.
Margin trajectory: genuine, structural gross-margin expansion. Gross margin is the standout positive in the model. It moved from 37.6% in FY2021 through a trough of 36.0% in FY2022 (peak input-cost inflation) to 38.2% in FY2024 and 39.8% in FY2025 — the highest in the period and a marked cumulative expansion off the FY2022 trough. Management attributes this to favourable price-versus-cost dynamics, productivity initiatives, favourable portfolio mix (the divestiture of lower-margin businesses helps) and restructuring benefits. The consistency of the improvement, and the fact that it survived a soft-volume year, argues this is structural rather than purely cyclical — the pricing and center-led cost programs described in Section 1 are doing real work.
EBIT margin tells the cleanest profitability story, and it is anchored to GAAP operating earnings, not the company’s segment measure. This distinction is a RED forensic flag (F001) and it governs all margin work in this report. Dover’s headline “segment earnings” metric is defined to exclude both restructuring — a charge incurred in every one of the last three years — and purchase-accounting amortization that is rising structurally with each acquisition vintage. The gap between that managed measure and GAAP operating earnings is material and widening as the roll-up compounds. We therefore anchor to GAAP EBIT. On that basis, EBIT margin was remarkably stable at roughly 16.2%–16.2% through FY2021–FY2023, dipped to 15.6% in FY2024, and then expanded to 17.0% in FY2025 — the best operating margin in the window. Critically, EBIT is a clean FY2024 read: the large pre-tax gain on the De-Sta-Co disposal sits below the operating-earnings line, so it does not flatter EBIT the way it flatters pre-tax and net income. The FY2025 EBIT-margin high, achieved on flat organic volume, is evidence that mix and cost discipline — not demand — are driving current profitability.
Major movers.
-
The ESG divestiture (FY2024). The single largest mover of the reported income statement: it removed the entire -8.2% of headline FY2024 revenue change and is the reason continuing-operations revenue “fell” while the underlying business grew. It is a structural, permanent portfolio change — the correct frame for every FY2024 comparison. It also improved the go-forward margin mix by removing a lower-margin operating company.
-
The De-Sta-Co pre-tax disposal gain (FY2024). This large gain sits inside continuing operations, below EBIT but inside pre-tax income. [Rating and price target withdrawn — see the note at the top.] It is a one-off, non-recurring disposal gain. The corollary: FY2025 net income of $1,097.4M “declining” from FY2024’s $1,400.0M is an optical artefact of the prior-year gain not recurring — operating earnings actually rose.
-
Purchase-accounting amortization (rising every year). The direct, recurring cost of the acquisition engine. It is embedded in GAAP operating earnings — the reason we anchor there — but excluded from segment earnings. As the 2025 deals (notably Sikora) annualize, this line steps up further in FY2026, mechanically widening the gap between the company’s segment margin and its true GAAP margin. Structural and growing, not temporary.
-
[Rating and price target withdrawn — see the note at the top.] This matters for forward modelling: extrapolating the reported 20.1% would overstate normalized net earnings. [Rating and price target withdrawn — see the note at the top.]
-
Net interest expense (falling into FY2025). Interest coverage improved to 12.5x in FY2025 from 9.2x, helped by higher interest income on the divestiture proceeds held in short-term instruments and the absence of commercial-paper borrowing — a direct downstream benefit of the ESG cash inflow.
Quality of earnings. The core earnings are clean and cash-backed, but three qualifications are non-negotiable for any reader. First (F001), profitability must be read on GAAP operating earnings, not the higher-margin segment measure the company highlights — that measure excludes recurring restructuring and structurally-rising deal amortization and overstates the economics of the roll-up. [Rating and price target withdrawn — see the note at the top.] On the positive side, the auditor issued a clean unqualified opinion with a single Critical Audit Matter (goodwill), there is no restatement or material weakness, and core accounting policies (FIFO inventory, straight-line depreciation, predominantly point-in-time revenue) are stable and comparable year-over-year.
⚠ Items to Watch. If GAAP EBIT margin were to fall back below 15.6%, it would reverse the FY2025 operating-margin breakout and call into question whether the center-led cost and pricing gains are durable rather than cyclical. If organic revenue growth cannot re-accelerate above the ~1.6% of FY2025 — i.e. if price normalizes and volume stays flat — reported growth becomes almost wholly dependent on continued M&A, and the rising amortization it carries would keep compressing the spread between segment and GAAP margins.
3.2A Balance Sheet
Source: Dover Corporation FY2025 Form 10-K (Consolidated Balance Sheets); figures per the FL model — see Appendix A.1–A.2.
3.2B Balance Sheet — Analysis
sources Asset composition: this is an acquisition-built, goodwill-heavy balance sheet, not a capital-intensive one. The defining feature is intangible value. Goodwill and intangibles rose steadily from $4,558.8M in FY2021 to $5,430.0M in FY2025 — each step reflecting the bolt-on cadence — while net PP&E remained comparatively modest at $1,119.6M. That asset-light physical footprint is a genuine strength for returns and cash conversion (little maintenance capital is required), but the flip side is a YELLOW forensic flag (F003): goodwill and intangibles now approximate the entirety of book equity of $7,405.2M. The balance sheet’s carrying value is dominated by the durability of acquired-business economics. [Rating and price target withdrawn — see the note at the top.] No impairment was taken, and none is indicated, but this is the balance-sheet line that would move first in a demand downturn, and it is developed as a principal risk in Section 2.
Leverage trajectory: materially de-risked, and a source of strategic optionality. This is the clearest positive in the balance sheet. Net debt fell from a peak of $3,297.4M in FY2022 to $1,084.5M in FY2024 — the ESG and De-Sta-Co proceeds building cash from $398.6M to $1,844.9M — before settling at $1,651.2M in FY2025 after acquisition and buyback activity. On a leverage basis, net debt/EBITDA compressed from 2.0x to just 0.7x in FY2024 and 0.9x in FY2025, with debt/equity down to 0.4x from 0.9x. This is well inside management’s stated investment-grade priorities and, importantly, it is dry powder — leverage now well under one turn of EBITDA on a business generating strong free cash flow is exactly the capacity the acquisition thesis (Section 2, Catalyst 2) needs. Liquidity is unquestioned (forensic flag F011): cash of $1,676.8M, undrawn revolvers, and an interest-coverage covenant against which the company runs enormous headroom. There are no covenant concerns.
Working capital is the one place discipline has quietly loosened, and it warrants monitoring. The cash conversion cycle lengthened from 61 days in FY2021 to 87 days in FY2025 — a material extension driven at both ends. [Rating and price target withdrawn — see the note at the top.] Receivables discipline held up, with DSO roughly flat at 61 days. Two points for the reader. First, receivables of $1,371.4M have not outrun revenue — there is no channel-stuffing or aggressive revenue-recognition signal here, consistent with the clean revenue policy. Second, and importantly for cash-flow quality: the fall in payables partly reflects a declining reverse-factoring (supply-chain-financing) balance (forensic flag F004), whose balance declined year-over-year. Because those obligations sit inside accounts payable rather than debt, a rising balance would flatter working capital and operating cash flow — but here the balance shrank, which was a use of cash in FY2025, not a source. In other words, the year’s cash generation is not being propped up by supply-chain financing; if anything it faced a modest headwind. That is a quality positive, but the mechanism is one to watch for any future ramp.
⚠ Items to Watch. If net debt/EBITDA were to climb back above 2.0x — the FY2022 peak — it would signal the balance sheet had been re-levered aggressively for M&A and would erode the acquisition optionality that is currently a thesis pillar. Separately, if the cash conversion cycle extends beyond the current 87 days without a corresponding organic-volume acceleration, it would suggest working-capital drag is structural rather than transitional, and would pressure the free-cash-flow conversion that underpins the capital-return program.
3.3A Cash Flow Statement
| FY2021 | FY2022 | FY2023 | FY2024 | FY2025 | |
|---|---|---|---|---|---|
| Cash from Operations ($M) | $1,115.9M | $805.7M | $1,336.3M | $1,087.8M | $1,338.0M |
| — Depreciation & Amortization ($M) | $290.1M | $307.5M | $317.5M | $337.8M | $379.6M |
| Capital Expenditures ($M) | $171.5M | $221.0M | $192.6M | $167.5M | $220.3M |
| Free Cash Flow ($M) | $944.4M | $584.8M | $1,143.8M | $920.3M | $1,117.7M |
| FCF Margin | 11.9% | 6.9% | 13.6% | 11.9% | 13.8% |
| FCF / Share | $6.50 | $4.07 | $8.13 | $6.64 | $8.11 |
| FCF Conversion (FCF/NI) | 84.0% | 54.9% | 108.2% | 65.7% | 101.9% |
| CapEx / Revenue | 2.2% | 2.6% | 2.3% | 2.2% | 2.7% |
| CapEx / D&A | 0.6x | 0.7x | 0.6x | 0.5x | 0.6x |
| Dividends Paid ($M) | $286.9M | $287.6M | $284.3M | $283.1M | $283.0M |
| Share Repurchases ($M) | $21.6M | $585.0M | — | $500.0M | $540.7M |
Source: Dover Corporation FY2025 Form 10-K (Consolidated Statements of Cash Flows); figures per the FL model — see Appendix A.1–A.2.
3.3B Cash Flow — Analysis
sources Operating cash flow is genuine and, crucially, unaffected by the earnings-quality caveats above. Operating cash flow reached $1,338.0M in FY2025, up from $1,087.8M, and free cash flow of $1,117.7M converted at 101.9% of net income — above one-to-one. This is the reassuring counterpoint to the F001 flag: while segment earnings overstate GAAP profitability, the free-cash-flow story does not suffer the same distortion, because the excluded items (purchase-accounting amortization is non-cash; restructuring is largely already in cash costs) do not flatter cash generation. The cash is real. The FY2022 conversion trough of 54.9% is explained by the working-capital build of that year (inventory peaked at $1,366.6M), and the optically low FY2024 conversion of 65.7% is a denominator artefact — FY2024 net income was inflated by the non-cash-to-operations De-Sta-Co gain, which depresses the FCF/NI ratio without saying anything adverse about cash quality. Normalized, Dover is a mid-teens-FCF-margin business (13.8% in FY2025), which is the engine behind both the deleveraging above and the capital-return program below.
Capital intensity is low and stable — this is a harvest-mode, asset-light industrial. Capital expenditure has run at 2.7% of revenue and, tellingly, CapEx/D&A has stayed well below parity throughout — 0.6x in FY2025 and never above 0.7x across the window. A ratio persistently under one times means the company is not spending to grow its physical base; growth capital is being deployed through acquisitions (the cash-flow investing section), not organic capex. For a diversified-industrial roll-up this is coherent and is a structural support for free cash flow — but it also reinforces that organic capacity, and therefore organic volume growth, is not where management is investing. [Rating and price target withdrawn — see the note at the top.]
Capital allocation: dividends are sacrosanct, buybacks are the flex, and M&A is the priority use. Over the five-year window the allocation pattern is consistent and disciplined. The dividend has been held almost perfectly steady in dollar terms — $283.0M in FY2025 versus $286.9M in FY2021 — consuming a modest and highly-covered share of free cash flow; Dover’s multi-decade record of consecutive annual increases (developed in Section 1) makes this the first claim on cash. Buybacks are the discretionary lever: essentially paused in FY2023 (no repurchases) to preserve capacity, then stepped up to $500.0M in FY2024 and $540.7M in FY2025 via accelerated share-repurchase programs once the divestiture cash landed. The residual — and the largest intended use — is acquisitions, funded from both free cash flow and the balance-sheet capacity created by deleveraging. Given a business whose organic reinvestment needs are low (2.7% of revenue) but whose organic growth is soft, routing the bulk of capital toward accretive bolt-ons is the internally consistent choice — provided each deal clears the cost of capital, which is precisely the discipline the returns analysis below tests.
⚠ Items to Watch. If FCF conversion were to fall durably below one-to-one on a clean (De-Sta-Co-adjusted) basis, it would point to structural working-capital drag rather than the one-off timing effects seen in FY2022, and would tighten the funding envelope for the dividend-plus-buyback-plus-M&A program. A renewed ramp in the supply-chain-financing balance from its current, declining level would also merit scrutiny, since it would inflate reported operating cash flow relative to a company that pays suppliers directly.
3.4 Returns Analysis
| FY2021 | FY2022 | FY2023 | FY2024 | FY2025 | |
|---|---|---|---|---|---|
| ROIC | 15.9% | 15.7% | 14.4% | 11.9% | 12.8% |
| ROE | 29.7% | 25.1% | 22.5% | 23.2% | 15.3% |
| ROA | 11.5% | 10.0% | 9.5% | 11.7% | 8.5% |
| Interest Coverage | 12.1x | 11.8x | 10.4x | 9.2x | 12.5x |
Source: Company SEC filings (10-K); figures per the FL model — see Appendix A.1–A.2.
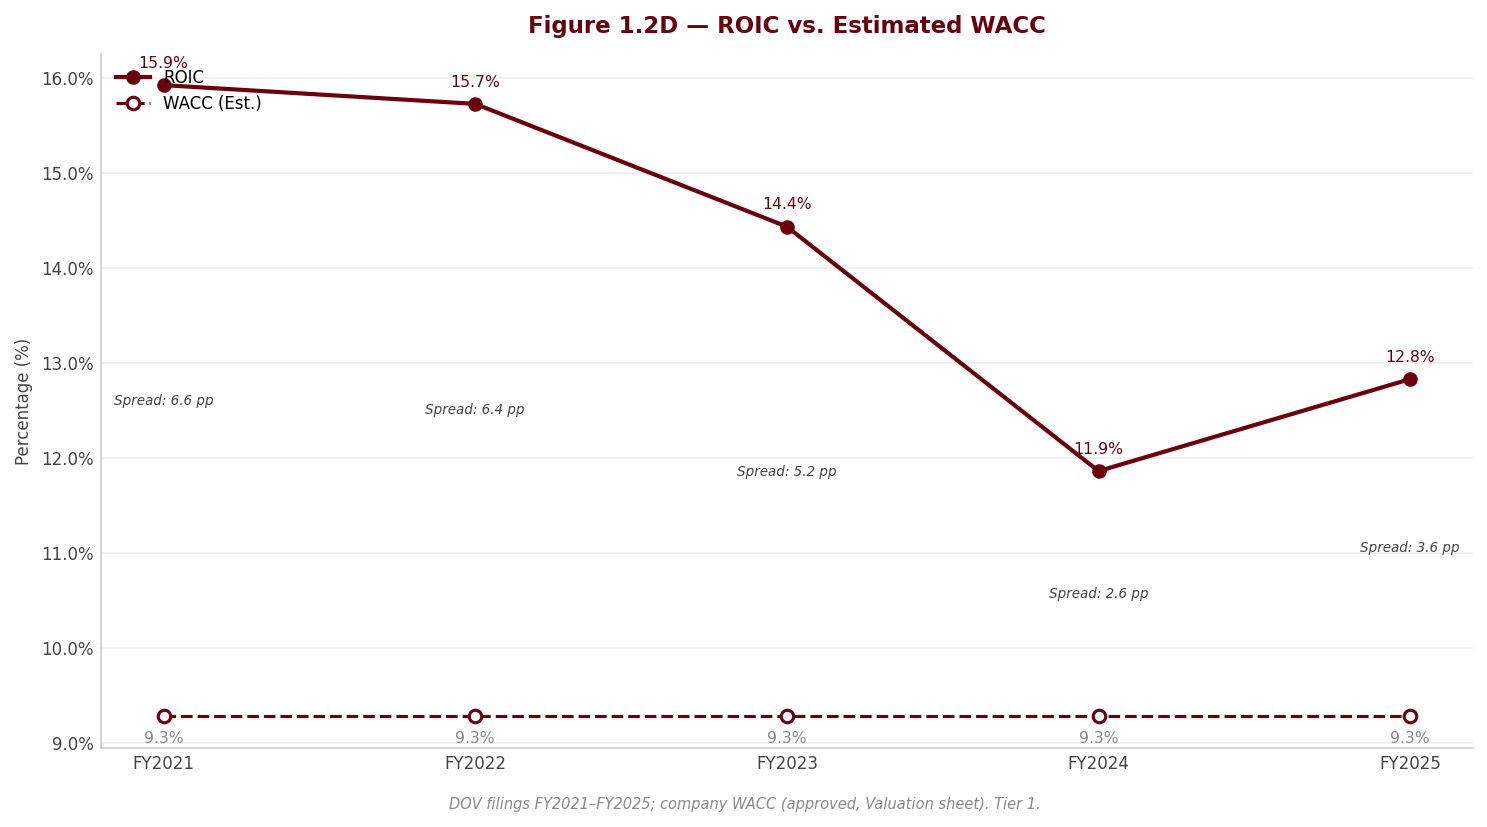
ROIC is the number that validates the acquisition thesis — and it clears the bar, though the spread has narrowed. Return on invested capital ran in the mid-teens through FY2021–FY2023 (15.9%, 15.7%, 14.4%) before compressing to 11.9% in FY2024 and recovering to 12.8% in FY2025. Even at the compressed level, ROIC sits comfortably above Dover’s cost of capital (the WACC; the comparison there confirms a positive spread). This is the single most important long-run fact in the section: for a serial acquirer, ROIC above WACC is the precondition for value creation — it is what makes deploying balance-sheet capacity into bolt-ons accretive rather than dilutive. The caution is directional: the step-down from the mid-teens reflects the growing invested-capital base (goodwill and intangibles from the roll-up) against organic earnings that have grown only modestly. The thesis does not require ROIC to re-expand, but it does require the spread over WACC to stay positive — and if the invested-capital base keeps compounding faster than NOPAT, the spread narrows. That is the metric to track, and it is why the growth-mix and amortization flags matter beyond the income statement.
DuPont decomposition: a well-margined business running low leverage on an asset-heavy base. Decomposing FY2025 ROE of 15.3% into its three drivers — net margin of 13.6%, asset turnover of 0.62x and an equity multiplier of 1.81x — reveals the character of the returns. Net margin is healthy and is the component that sustains the ROE level. Asset turnover of 0.62x is structurally low and has been declining (0.81x in FY2021), the direct signature of a goodwill-and-intangible-heavy balance sheet — acquisitions add assets faster than the sales they carry. The equity multiplier of 1.81x is also low and falling (from 2.58x in FY2021), reflecting the deleveraging and equity build discussed above. The swing factor year-over-year, however, is net margin: ROE fell sharply from 23.2% in FY2024 to 15.3% in FY2025 almost entirely because FY2024’s margin was inflated by the non-recurring De-Sta-Co gain — strip that, and the ROE decline is largely optical. The structural read is a business earning solid returns on a conservatively financed but asset-heavy base; there is latent ROE upside available simply from re-levering the currently under-utilized balance sheet, which dovetails with the M&A optionality thesis. Interest coverage of 12.5x underscores how much debt capacity is unused.
3.5 Altman Z-Score (Most Recent FY)
| Component | FY2023 | FY2024 | FY2025 |
|---|---|---|---|
| X1 (Working Capital / Total Assets) | 0.086 | 0.183 | 0.148 |
| X2 (Retained Earnings / Total Assets) | 0.969 | 1.072 | 1.059 |
| X3 (EBIT / Total Assets) | 0.120 | 0.096 | 0.102 |
| X4 (Equity / Total Liabilities) | 0.818 | 1.252 | 1.231 |
| X5 (Revenue / Total Assets) | 0.744 | 0.619 | 0.603 |
| Z-Score | 2.34 | 2.48 | 2.44 |
| Zone | Gray | Gray | Gray |
Source: Company SEC filings (10-K); figures per the FL model — see Appendix A.1–A.2.
The Z-Score places Dover in the gray zone — a structural artefact of the balance sheet, not a solvency warning. At 2.44 in FY2025 the score sits below the model’s 2.90 safe-zone threshold and is classified Gray; it has printed in that same band across the whole recent window, at 2.34 in FY2023 and 2.48 in FY2024. The reading is range-bound rather than trending — the small year-to-year moves reflect the normalization of EBIT/total-assets (X3) after the gain-inflated FY2024 and the larger asset base from FY2025 acquisitions, not any change in underlying credit quality. Critically, nothing else in this section corroborates financial stress: the de-risked leverage profile (net debt well under one turn of EBITDA), interest coverage of 12.5x, unquestioned liquidity (cash of $1,676.8M, undrawn revolvers and wide covenant headroom) and above-one-times free-cash-flow conversion all sit far from any distress boundary. The tension resolves in the score’s own construction: the components that carry total assets in their denominator — revenue-to-assets (X5) and EBIT-to-assets (X3) — are mechanically depressed by the goodwill- and intangible-heavy, asset-turnover-light balance sheet the acquisition model builds, exactly the structural understatement that afflicts the Z-Score for any capital-light serial acquirer whose value lives in acquired-business economics rather than tangible assets. The credit conclusion from the leverage and coverage analysis therefore stands: default risk is remote and refinancing risk negligible given the liquidity position. But the gray-zone print is a genuine one and should be read honestly — a reminder that so much of the carrying value is intangible (the goodwill concentration flagged in the balance-sheet analysis and developed as a principal risk in Section 2), and therefore a line to monitor rather than a present concern.
4. Valuation withdrawn
This section stated what the shares were worth and what to do about them. It rested on an exit multiple set by hand — across the coverage it averaged 24% below where each company actually traded — so the conclusion largely restated that assumption instead of testing it. Rather than leave it standing, it has been withdrawn while the method is rebuilt.
Nothing else in this report depends on it: the financial analysis above and below is drawn from the company's own filings, and every figure links to the page it was verified against.
Section 5 — Financial Metrics & Peer Benchmarking
5.1 Peer Selection
sources The comparable set is deliberately narrow: two large-cap U.S. multi-industrials — Illinois Tool Works (ITW) and Parker-Hannifin (PH) — each benchmarked from its own Form 10-K, read in full and page-cited to the primary statements rather than pulled from a data aggregator. That primary-source discipline is the reason the set is only two names. Additional diversified-industrial candidates (Emerson, IDEX, Ingersoll Rand, Honeywell) would have been legitimate read-across, but their filings are not in the source folder and adding them would have meant substituting screener figures for verified ones. We chose two fully-traced peers over five loosely-sourced ones, and the reader should treat this as a directional triangulation of where Dover sits, not a statistically robust peer median.
Both peers share Dover’s essential DNA — short-cycle, engineered-products, highly cash-generative, acquisition-active industrials reporting under U.S. GAAP — which makes the comparison meaningful. But three structural differences must be carried through every table below, and a fourth is a reporting artifact of Dover’s own disclosure:
- Parker-Hannifin closes its fiscal year on 30 June. Its “FY2025” spans July 2024–June 2025 and is roughly six months lagged against Dover’s and ITW’s calendar year; against the current share price its fundamentals are some thirteen months stale. Every PH figure is therefore period-mismatched and directional only.
- ITW’s book-based ratios are distorted by decades of buybacks held as treasury stock, which collapses book equity and mechanically inflates its ROE and debt/equity. Those two ratios are not comparable to Dover’s and are flagged accordingly.
- PH’s EBIT is a computed operating figure (its income statement prints no operating-income subtotal) that deliberately strips out a one-off gain on business sales; PH also carries far heavier acquisition amortization than ITW.
- Dover’s headline “segment earnings” margin is not on a comparable basis to peers’ GAAP margins. All Dover figures in this section are struck on GAAP operating economics (forensic flag F001) — see 5.2 and 5.7.
| Peer | Ticker | Exchange | Filing Type | Accounting Standard | Fiscal Year End | Comparability Note |
|---|---|---|---|---|---|---|
| Illinois Tool Works Inc. | ITW | NYSE | 10-K | US GAAP | December | Calendar-aligned with Dover; book ratios (ROE, D/E) distorted by treasury stock — use net-debt/EBITDA and ROIC. |
| Parker-Hannifin Corporation | PH | NYSE | 10-K | US GAAP | June | Fiscal year ends 30 June — ~6-month lag; EBIT computed and excludes a one-off disposal gain. Directional only. |
Source: Peer-company SEC filings; comparability notes in 5.7 — see Appendix A.1.
5.2 Profitability Comparison
sources Comparative: Most Recent Full Fiscal Year
| Metric | Dover Corporation | Illinois Tool Works Inc. | Parker-Hannifin Corporationᵖ |
|---|---|---|---|
| Revenue ($M) | $8,092.6M | $16,044.0M | $19,850.0M |
| Gross Margin | 39.8% | 44.1% | 36.9% |
| EBITDA Margin | 21.7% | 28.8%ᶜ | 25.0%ᶜ |
| EBIT Margin | 17.0% | 26.3% | 20.5%ᶜ |
| Net Margin | 13.6% | 19.1% | 17.8% |
| FCF Margin | 13.8% | 16.9% | 16.8% |
Source: Peer-company SEC filings; comparability notes in 5.7 — see Appendix A.1.
Flag legend: ᵖ = fiscal year ends 30 June, ~6-month lag versus Dover/ITW (whole column period-mismatched, directional only); ᶜ = computed from filing components; ᵐ = market-sourced multiple; ᵗ = distorted by treasury stock, not comparable.
The single most important disclosure in this section is a benchmarking-integrity point (forensic flag F001, RED). Dover’s own headline profitability metric — “segment earnings,” which management uses to run and report the business — is defined to exclude recurring restructuring (a charge in every year FY2023–FY2025) and purchase-accounting amortization that rises with each acquisition vintage. Its aggregate segment-earnings margin sits several points above Dover’s GAAP operating margin. Every Dover figure in this section is struck on GAAP operating economics, not on that segment measure. This matters precisely here: were one to line Dover’s segment-earnings margin up against ITW’s GAAP operating margin, Dover would appear to nearly match the most profitable peer in the set — a flattering illusion of roughly the same order as the entire margin gap discussed below. The honest comparison uses 17.0% GAAP EBIT margin, and on that basis the verdict is unambiguous: Dover earns the lowest operating margins of the three.
Dover’s 21.7% EBITDA margin, 17.0% EBIT margin and 13.6% net margin each trail both ITW and PH. The gap to ITW is the widest — ITW’s ~80/20 operating model on seven short-cycle segments produces structurally high profitability that is, candidly, best-in-class for the group. The gap to Parker is narrower and partly an artifact: on gross margin Dover (39.8%) actually sits above PH (36.9%), and PH’s below-ITW EBIT margin is driven heavily by its far larger acquisition-amortization load, not weaker operations — which is why the fairer operating comparison between the two acquirers is EBITDA margin, where Dover still trails but by less. None of these differences is a pure efficiency ranking: ITW, PH and Dover overlap only partially in end-markets (see 5.7, C005), so absolute margin levels reflect portfolio mix as much as operating skill.
The one line where Dover nearly closes the gap is free cash flow. Dover’s 13.8% FCF margin trails ITW’s 16.9% and PH’s 16.8% by only a couple of points — a materially smaller shortfall than its ~nine-point EBIT-margin gap to ITW. The reason is the same F001 amortization: a meaningful slice of Dover’s lower GAAP margin is a non-cash charge, so Dover converts operating earnings to cash more efficiently than its accrual margins imply. This is the analytical bridge to the valuation finding in 5.5.
Historical: Dover Corporation Own 5-Year Progression
| Metric | FY2021 | FY2022 | FY2023 | FY2024 | FY2025 |
|---|---|---|---|---|---|
| Gross Margin | 37.6% | 36.0% | 36.6% | 38.2% | 39.8% |
| EBITDA Margin | 19.9% | 19.8% | 20.0% | 19.9% | 21.7% |
| EBIT Margin | 16.2% | 16.2% | 16.2% | 15.6% | 17.0% |
| Net Margin | 14.2% | 12.5% | 12.5% | 18.1% | 13.6% |
| FCF Margin | 11.9% | 6.9% | 13.6% | 11.9% | 13.8% |
Source: Company SEC filings (10-K); comparability notes in 5.7 — see Appendix A.1. FY2024 net margin is flattered by the non-recurring De-Sta-Co pre-tax gain inside continuing operations and is not a clean run-rate; FY2025 is the clean comparison year (consistent with Section 3).
Dover’s own trend cuts a more favourable figure than the cross-sectional snapshot: gross margin reached its five-year high in FY2025 and EBIT margin (17.0%) rebounded to the best level in the window on essentially flat organic volume — evidence that mix and center-led cost discipline are doing real work. The important continuity point with Section 3 is that Dover’s margins are rising even as they sit below peers; the peer gap is a level, not a deteriorating trajectory. The FY2024 net-margin spike is the De-Sta-Co disposal gain, not operating performance, and should be read through.
5.3 Returns Comparison
sources Comparative: Most Recent Full Fiscal Year
| Metric | Dover Corporation | Illinois Tool Works Inc. | Parker-Hannifin Corporationᵖ |
|---|---|---|---|
| ROIC | 12.8% | 26.7%ᶜ | 15.2%ᶜ |
| ROE | 15.3% | 93.7%ᵗ | 27.4% |
| ROA | 8.5% | 19.6% | 12.0% |
| Asset Turnover | 0.60x | 1.03x | 0.68x |
Source: Peer-company SEC filings; comparability notes in 5.7 — see Appendix A.1.
Historical: Dover Corporation Own 5-Year Progression
| Metric | FY2021 | FY2022 | FY2023 | FY2024 | FY2025 |
|---|---|---|---|---|---|
| ROIC | 15.9% | 15.7% | 14.4% | 11.9% | 12.8% |
| ROE | 29.7% | 25.1% | 22.5% | 23.2% | 15.3% |
| ROA | 11.5% | 10.0% | 9.5% | 11.7% | 8.5% |
Source: Company SEC filings (10-K); comparability notes in 5.7 — see Appendix A.1.
The returns comparison must be read through two of the caveats above before any conclusion is drawn. ITW’s 93.7% ROE is not comparable to Dover’s — it is a treasury-stock artifact, the arithmetic result of decades of buybacks having shrunk book equity to a fraction of earnings, and it says nothing about operating or credit reality (5.7, C003). The clean cross-peer return measure is ROIC, and it corroborates the profitability picture: Dover’s 12.8% ROIC is the lowest of the three, below PH’s 15.2% and well below ITW’s 26.7%. The same ordering holds on ROA. Dover’s low asset turnover (0.60x versus ITW’s 1.03x) is the mechanical driver: like Parker, Dover carries a goodwill- and intangible-heavy balance sheet built by acquisition (Section 3 / F003), which enlarges the asset base per dollar of sales; ITW’s leaner, less acquisitive model turns assets nearly twice as fast.
The judgement that keeps this from being a purely negative read is the cost-of-capital hurdle. Dover’s 12.8% ROIC clears its 9.28% WACC by a positive spread of roughly three-and-a-half points — the acquisition engine, struck after loading the balance sheet with the goodwill of past deals, still creates value. It simply creates less excess return than ITW’s exceptional franchise or Parker’s higher-return aftermarket-heavy mix. Dover’s own history shows ROIC has compressed from the high-teens of FY2021 toward the current level as the goodwill base has grown faster than NOPAT — a trend worth watching, and one that ties directly to the valuation discipline the base-case DCF imposes in the separate valuation.
5.4 Leverage & Liquidity Comparison
sources Comparative: Most Recent Full Fiscal Year
| Metric | Dover Corporation | Illinois Tool Works Inc. | Parker-Hannifin Corporationᵖ |
|---|---|---|---|
| Net Debt / EBITDA | 0.9x | 1.8x | 1.8x |
| Total Debt / Equity | 0.4x | 2.8xᵗ | 0.7x |
| Interest Coverage | 12.5x | 14.4x | 9.9x |
| Current Ratio | 1.8x | 1.2x | 1.2x |
| FCF Margin | 13.8% | 16.9% | 16.8% |
Source: Peer-company SEC filings; comparability notes in 5.7 — see Appendix A.1.
Leverage is where Dover genuinely leads the set. On the one measure that is clean across all three — net debt/EBITDA — Dover at 0.9x carries roughly half the leverage of ITW (1.8x) and Parker (1.8x). This is a real, uncomplicated advantage and it reconciles with the balance-sheet strength documented in Section 3: undrawn revolvers, no near-term maturity wall, and covenant coverage many multiples above its single maintenance test. Total debt/equity tells the same story where it can be read — Dover’s 0.4x sits below Parker’s 0.7x — but ITW’s 2.8x is a treasury-stock distortion, not genuine leverage, and should be disregarded (5.7, C003). Interest coverage of 12.5x places Dover comfortably between the two peers on a like-for-like EBIT-to-interest basis, and its 1.8x current ratio is the strongest of the three, marking Dover as the most liquid.
The interpretive nuance is that Dover’s leverage headroom is the deliberate design of an acquirer that funds bolt-ons largely from free cash flow. It is a strength — it is dry powder for the M&A engine and a genuine downside cushion — but it is not costless: a business that runs this conservatively earns little of the tax shield that lowers a more-levered peer’s cost of capital, which is part of why Dover discounts its cash flows at close to its full cost of equity. The low leverage and the modest ROIC spread are two sides of the same conservative-capital-structure coin.
5.5 Valuation Multiples Comparison
sources Comparative: Current Price
| Metric | Dover Corporation | Illinois Tool Works Inc. | Parker-Hannifin Corporationᵖ |
|---|---|---|---|
| EV/EBITDA | 17.1x | 20.4xᵐ | 27.0xᵐ |
| P/E | 26.3x | 28.4xᵐ | 36.6xᵐ |
| FCF Yield | 4.0% | 3.1%ᵐ | 2.7%ᵐ |
Source: Peer-company SEC filings; comparability notes in 5.7 — see Appendix A.1.
All peer valuation multiples are market-sourced (ᵐ) and pair each peer’s latest annual fundamentals with a current-date share price; they move with the market and are directional. Parker’s (ᵖ) are doubly caveated — June-2025 fundamentals against a current price are ~13 months stale, so PH’s P/E and EV/EBITDA overstate its true forward multiple.
Historical: Dover Corporation EV/EBITDA (period-end price)
| FY2021 | FY2022 | FY2023 | FY2024 | FY2025 |
|---|---|---|---|---|
| 18.5x | 13.5x | 14.7x | 17.6x | 16.3x |
Source: Company SEC filings (10-K) and period-end market prices; comparability notes in 5.7 — see Appendix A.1.
[Rating and price target withdrawn — see the note at the top.] Parker’s premium is overstated by the ~13-month staleness of its June-year fundamentals against a current price, so the cleaner benchmark is ITW: even against ITW’s calendar-aligned figures, Dover is the lower multiple on every line.
The honest way to state the verdict is to hold both facts at once: Dover carries the cheapest multiple and the lowest margins and returns of the three. Those two observations are not in tension — they are the market pricing Dover’s lower profitability and lower ROIC exactly where it should, at a discount to two higher-return franchises. The correct conclusion is therefore not “Dover is a bargain,” but rather that Dover is not expensive relative to its peers — the whole group is richly valued. A ~26.3x earnings multiple and a 4.0% FCF yield are full absolute valuations for a low-single-digit organic grower; they merely happen to be the least stretched in a stretched cohort. Against Dover’s own history, the current 17.1x sits toward the upper end of its five-year range, well above the FY2022 trough, confirming the same read: the peer discount is real, but it is a discount within an elevated absolute band, not cheapness in its own right. [Rating and price target withdrawn — see the note at the top.]
5.6 Efficiency Comparison
| Metric | Dover Corporation | Illinois Tool Works Inc. | Parker-Hannifin Corporationᵖ |
|---|---|---|---|
| Days Sales Outstanding | 61 days | 73 days | 54 days |
| Days Inventory Outstanding | 91 days | 68 days | 83 days |
| Days Payables Outstanding | 65 days | 21 days | 62 days |
| Cash Conversion Cycle | 87 days | 120 days | 74 days |
| CapEx / Revenue | 2.7% | 2.6% | 2.2% |
Source: Peer-company SEC filings; comparability notes in 5.7 — see Appendix A.1.
Working-capital efficiency is a mixed but respectable picture for Dover. Its cash conversion cycle of 87 days is well inside ITW’s 120 days — a genuine relative strength — though longer than Parker’s 74 days. The composition is instructive: Dover collects faster than ITW (DSO of 61 days versus 73 days) and, unlike ITW, uses supplier terms actively, running 65 days of payables against ITW’s unusually low 21 days — the main reason ITW’s cycle is the longest of the three despite its lean model. The offset is inventory: Dover carries the most inventory days of the set (91 days versus ITW’s 68 days and PH’s 83 days), consistent with the order-support and acquisition-related build noted in Section 3. One caveat on Dover’s payables figure: a portion of accounts payable relates to a reverse-factoring (supply-chain-financing) program (forensic flag F004), which modestly lengthens reported DPO and shortens the reported cash cycle; the balance was declining in FY2025, so it is not being used to flatter current-year metrics, but it is the reason to read the DPO advantage with a light touch. Capital intensity is broadly comparable and light across all three — Dover’s 2.7% of revenue is marginally the highest but still characteristic of an assembly-oriented industrial, not a signal of asset heaviness.
5.7 Comparability Caveats
sources This section’s credibility rests on these caveats; none is cosmetic, and each is applied — not merely noted — in the tables above.
-
Parker-Hannifin’s June fiscal year (C001, material). PH closes on 30 June; its FY2025 (July 2024–June 2025) is roughly six months lagged versus Dover’s and ITW’s calendar FY2025, and against a current share price its fundamentals are ~13 months stale. For a cyclical short-cycle industrial this offset captures a different point in the demand cycle. Every PH column is marked ᵖ and every period-sensitive comparison with PH — growth, margins in a turning cycle, and above all its valuation multiples — is directional only, never a precise anchor. Where a clean single-peer benchmark is needed, ITW (calendar-aligned) is the better reference.
-
Parker’s computed EBIT and one-off gain (C002, material). PH’s income statement prints no operating-income subtotal, so its EBIT and EBIT margin are computed (Net Sales - Cost of sales - SG&A) and deliberately exclude a one-off pre-tax gain on business sales, so as to match the operating-earnings concept used for Dover and ITW; a naïve “pre-tax plus interest” definition would instead bake in that gain and overstate operating profitability. Separately, PH carries far heavier acquisition amortization than ITW, which is the main reason its EBIT margin sits below ITW’s even though the two are closer on EBITDA margin. The operating-profitability comparison between the two acquirers should be read on EBITDA margin, and PH’s margins are flagged ᶜ.
-
ITW’s treasury-stock distortion (C003, material). ITW’s book equity is a small fraction of its earnings because of decades of buybacks held as treasury stock. This inflates its ROE to a level that is meaningless as an operating or credit signal and pushes its debt/equity far above its true leverage. Dover’s ROE and debt/equity are not compared to ITW’s (marked ᵗ); net-debt/EBITDA is used for the leverage comparison and ROIC for returns. ITW returns nearly all of its cash to shareholders — the distortion is a feature of that policy, not a red flag.
-
All valuation multiples are market-sourced (C004, material). EV/EBITDA, P/E and FCF yield for both peers (marked ᵐ) pair each peer’s latest annual fundamentals with a current-date, publicly-quoted share price used only to derive market capitalisation and enterprise value. They move with the market and are directional, not precise as of any single clean date. The problem compounds for Parker, whose June-2025 base against a current price materially overstates its true forward EV/EBITDA and P/E. These multiples support the relative ranking in 5.5 but should not be treated as exact.
-
Segment-mix differences (C005, informational). All three report U.S. GAAP, but they overlap only partially: ITW runs seven short-cycle segments on its 80/20 model; Parker is a motion-control and aerospace business with a large, higher-margin aftermarket and heavy acquisition amortization; Dover is five diversified segments (Engineered Products, Clean Energy & Fueling, Imaging & Identification, Pumps & Process Solutions, Climate & Sustainability Technologies). Absolute margin levels therefore reflect portfolio mix as much as operating efficiency, and the rankings above are not a pure efficiency league table.
-
Portfolio actions and one-offs on both sides (C006, informational). Dover’s FY2024–FY2025 figures are continuing operations after divesting the Environmental Solutions Group (October 2024) and De-Sta-Co (March 2024); FY2023-versus-FY2024 revenue is therefore not like-for-like, and FY2024 net income is flattered by the De-Sta-Co pre-tax gain — FY2025 is the clean Dover comparison year. Among peers, PH’s FY2025 net income includes a one-off disposal gain, and ITW’s FY2024 (not FY2025) carried a Wilsonart gain — which is why FY2025 is the clean ITW comparison year used throughout. No comparison in this section is drawn across these one-offs without the adjustment being stated.
-
The Dover GAAP-versus-segment-earnings basis (F001, RED). Finally, and most important for the integrity of the comparison itself: Dover’s benchmarked margins are its GAAP operating margins, not its higher “segment earnings” margin, which excludes recurring restructuring and rising purchase-accounting amortization. Comparing Dover’s segment-earnings margin to peers’ GAAP margins would flatter Dover by several points and misrepresent the roll-up’s true economics. Every Dover margin and return figure above is on the GAAP basis for exactly this reason.
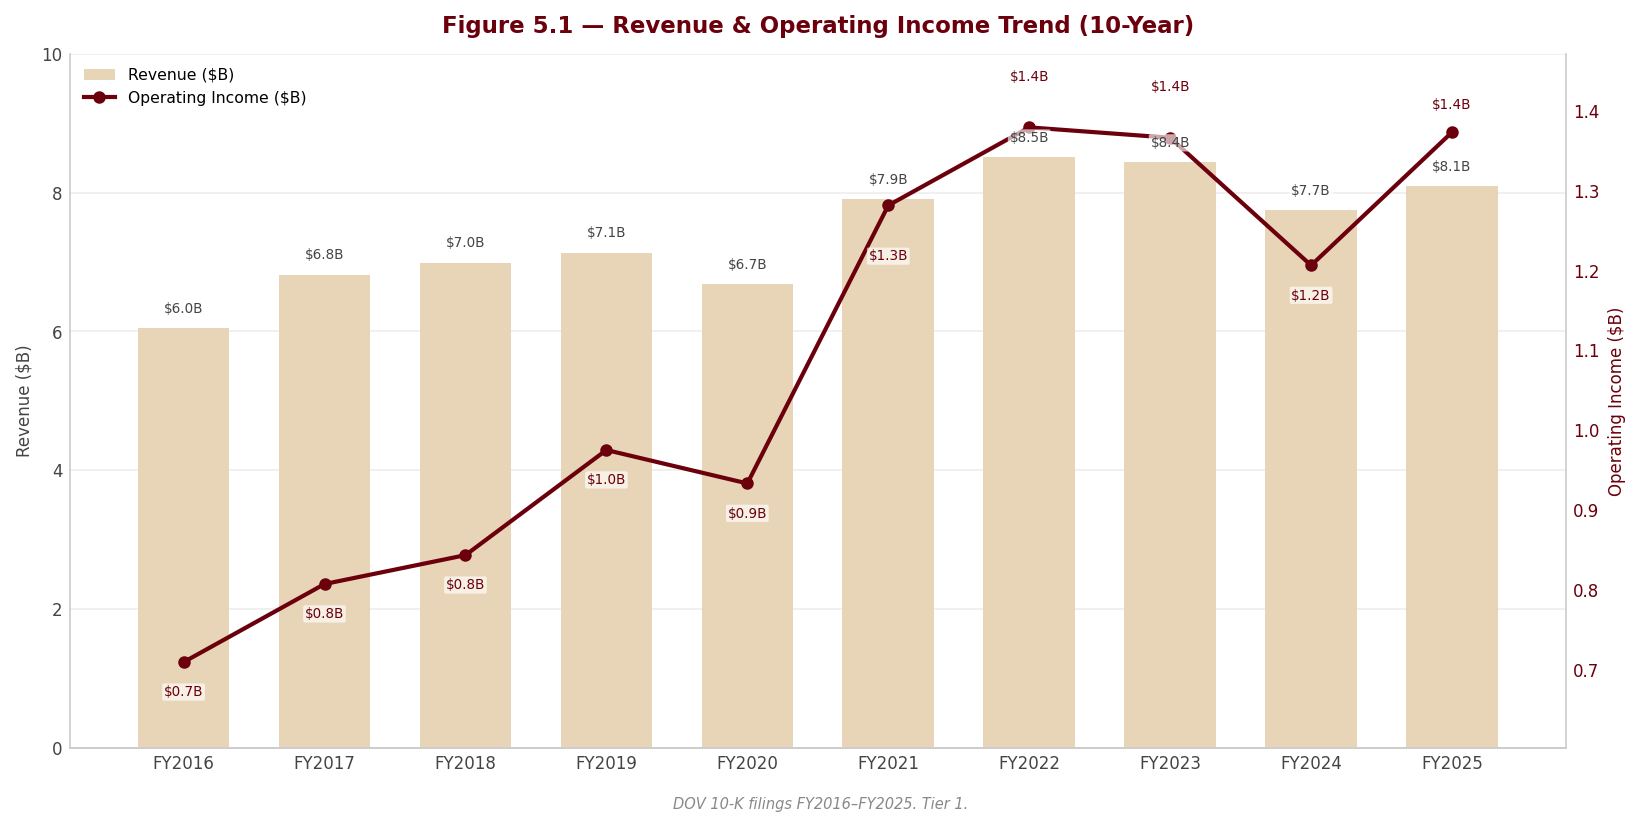
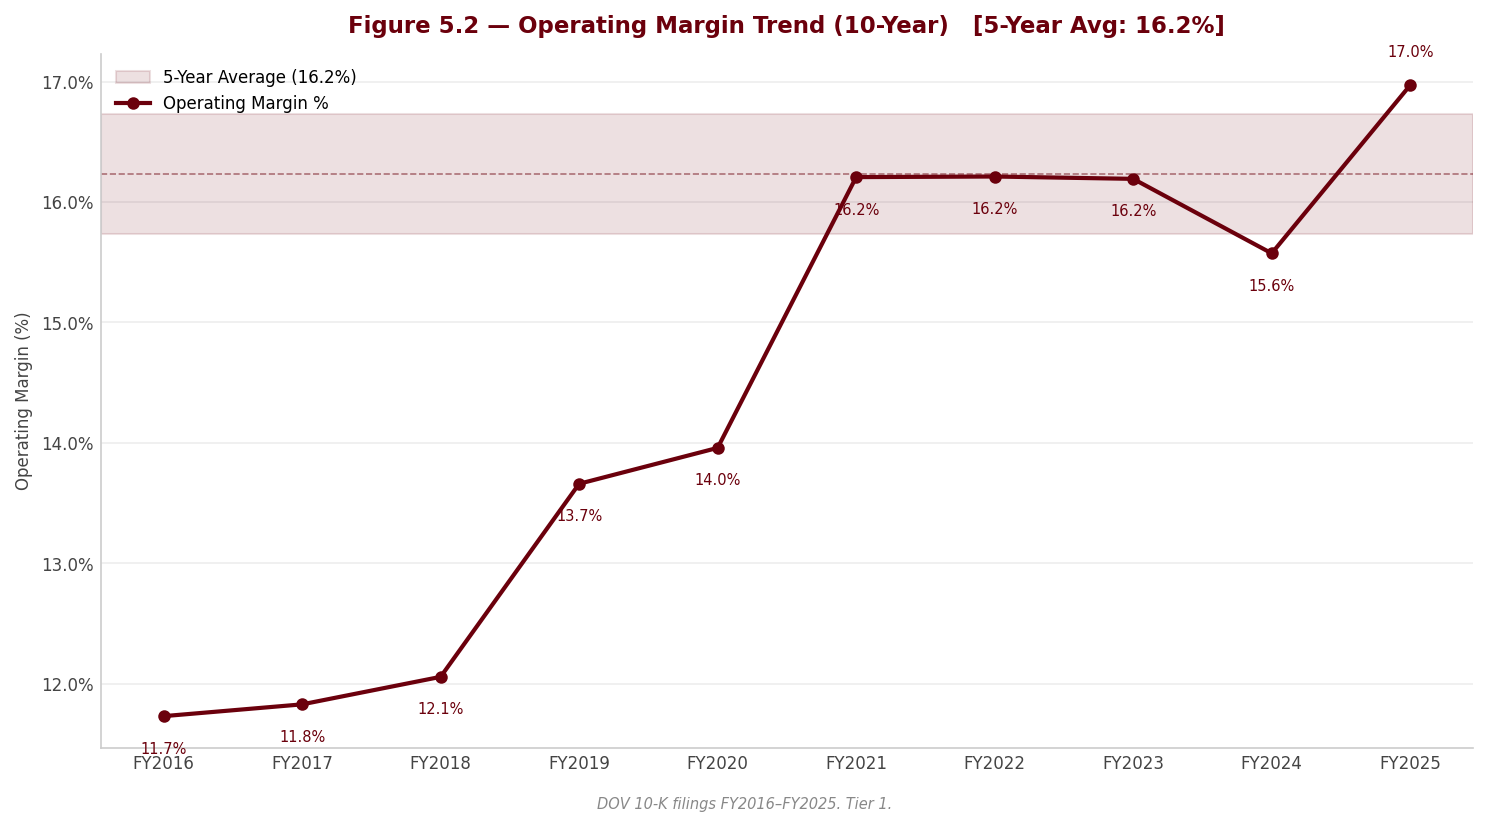
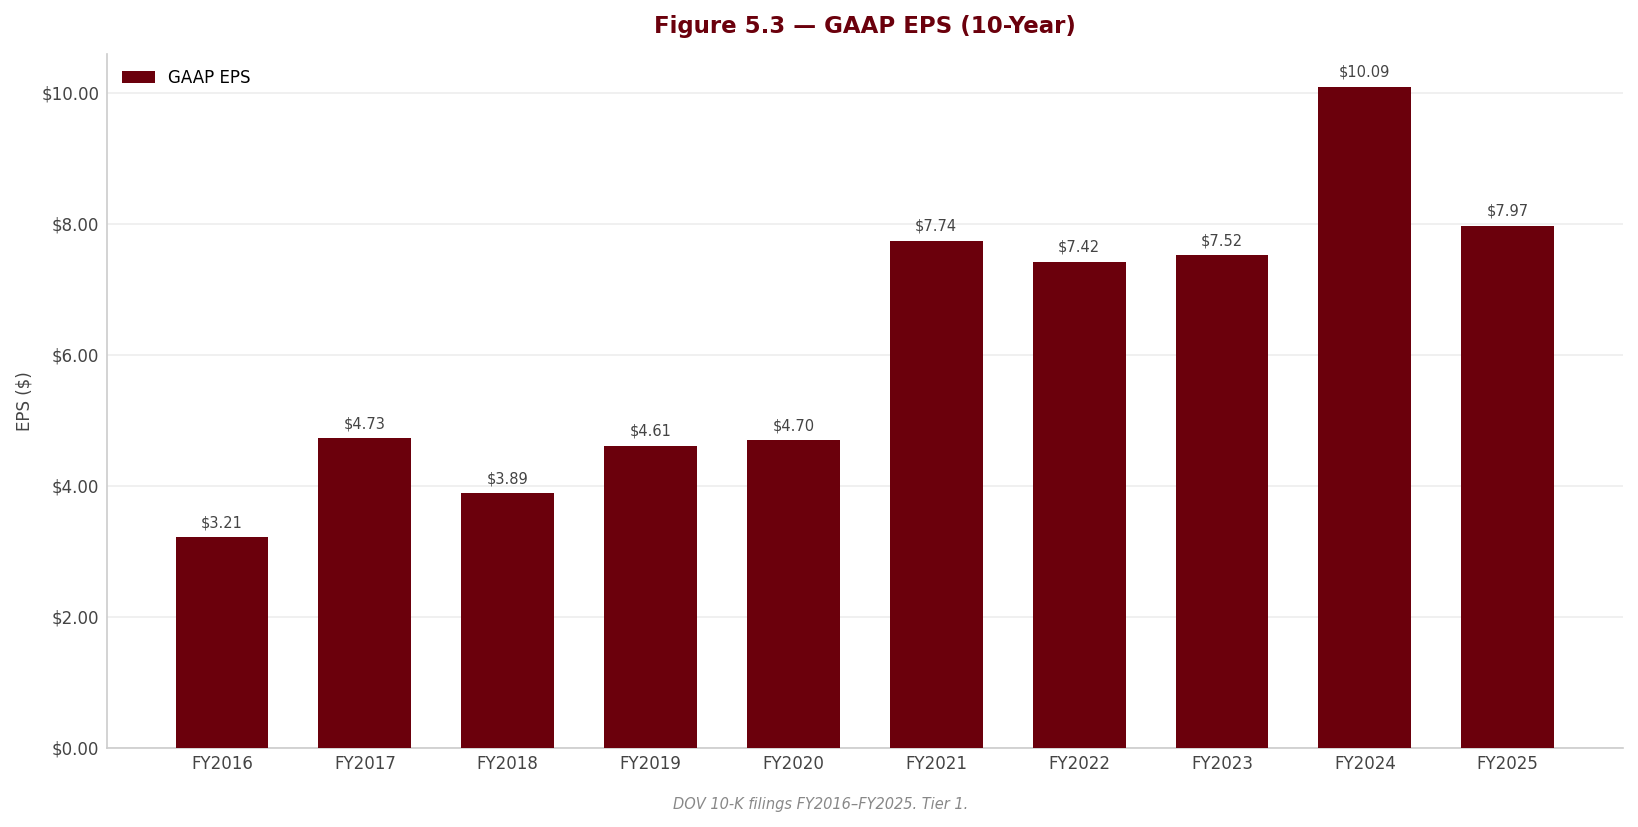
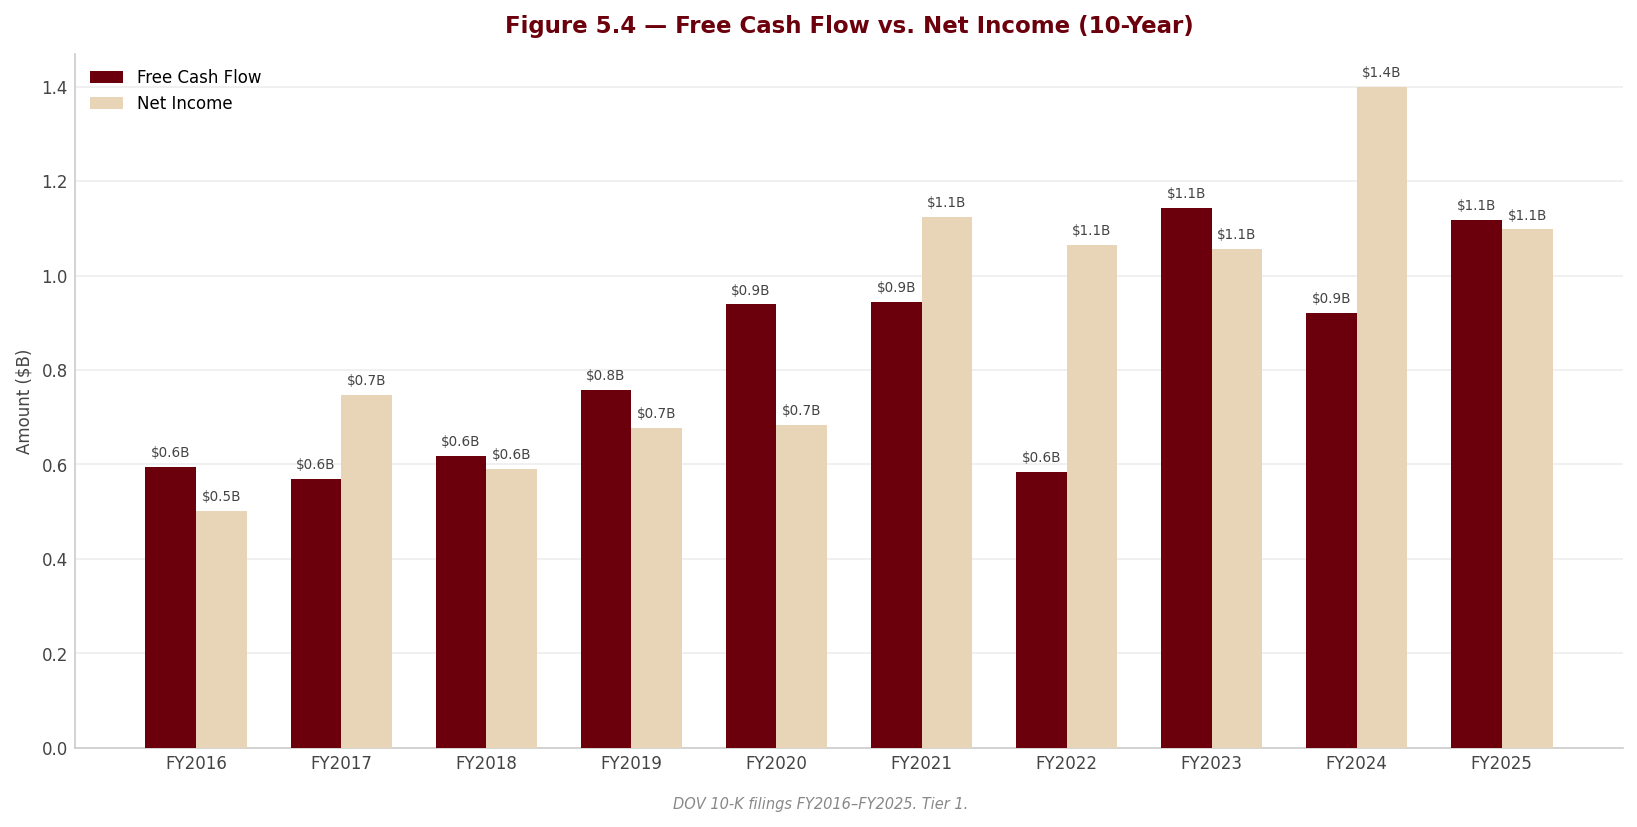
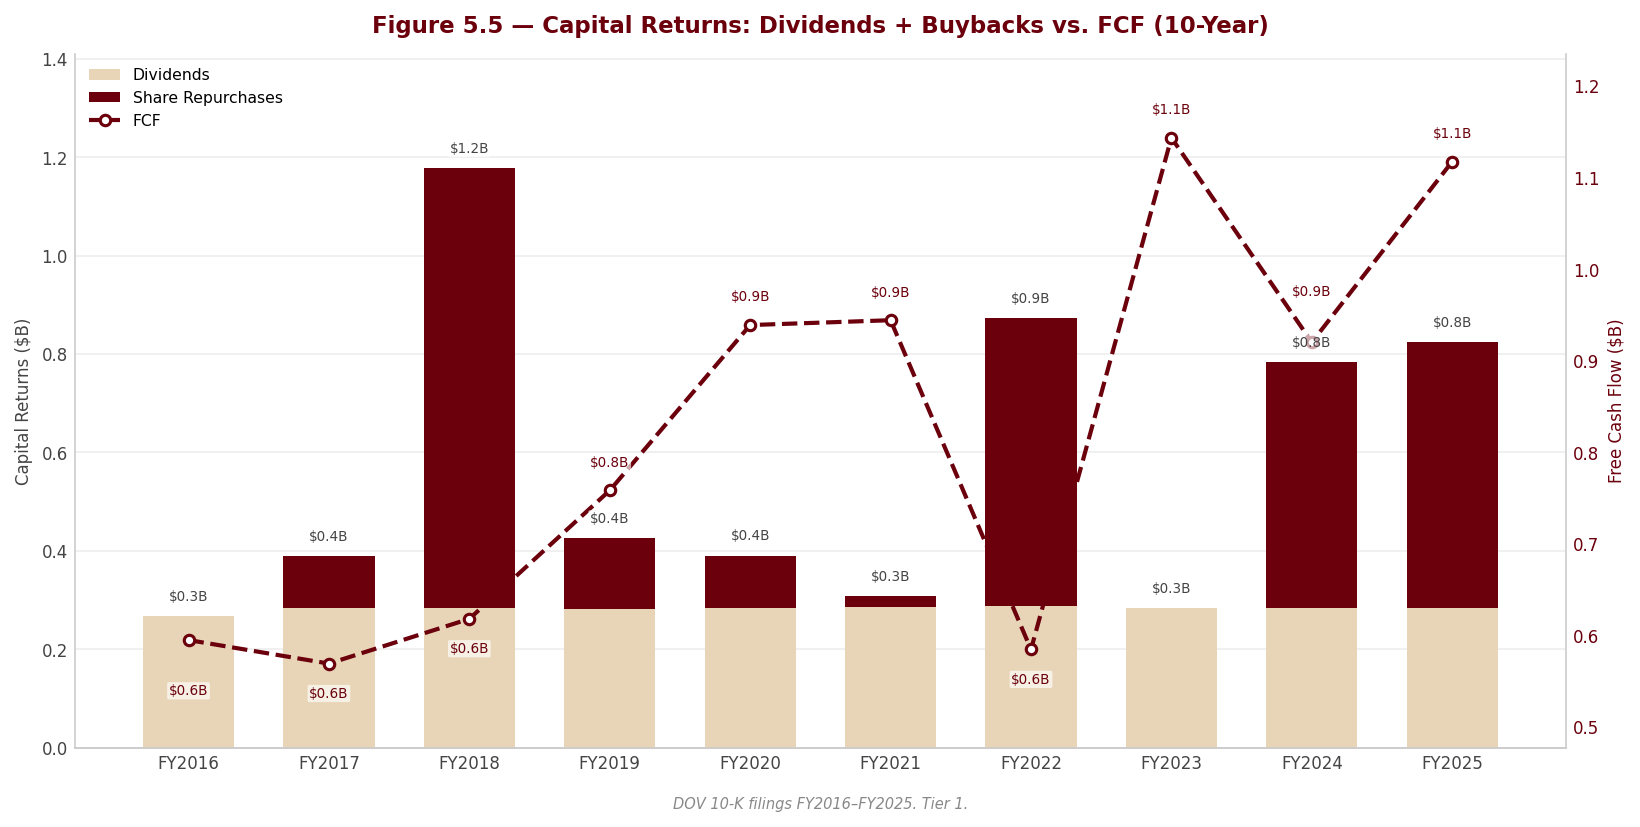
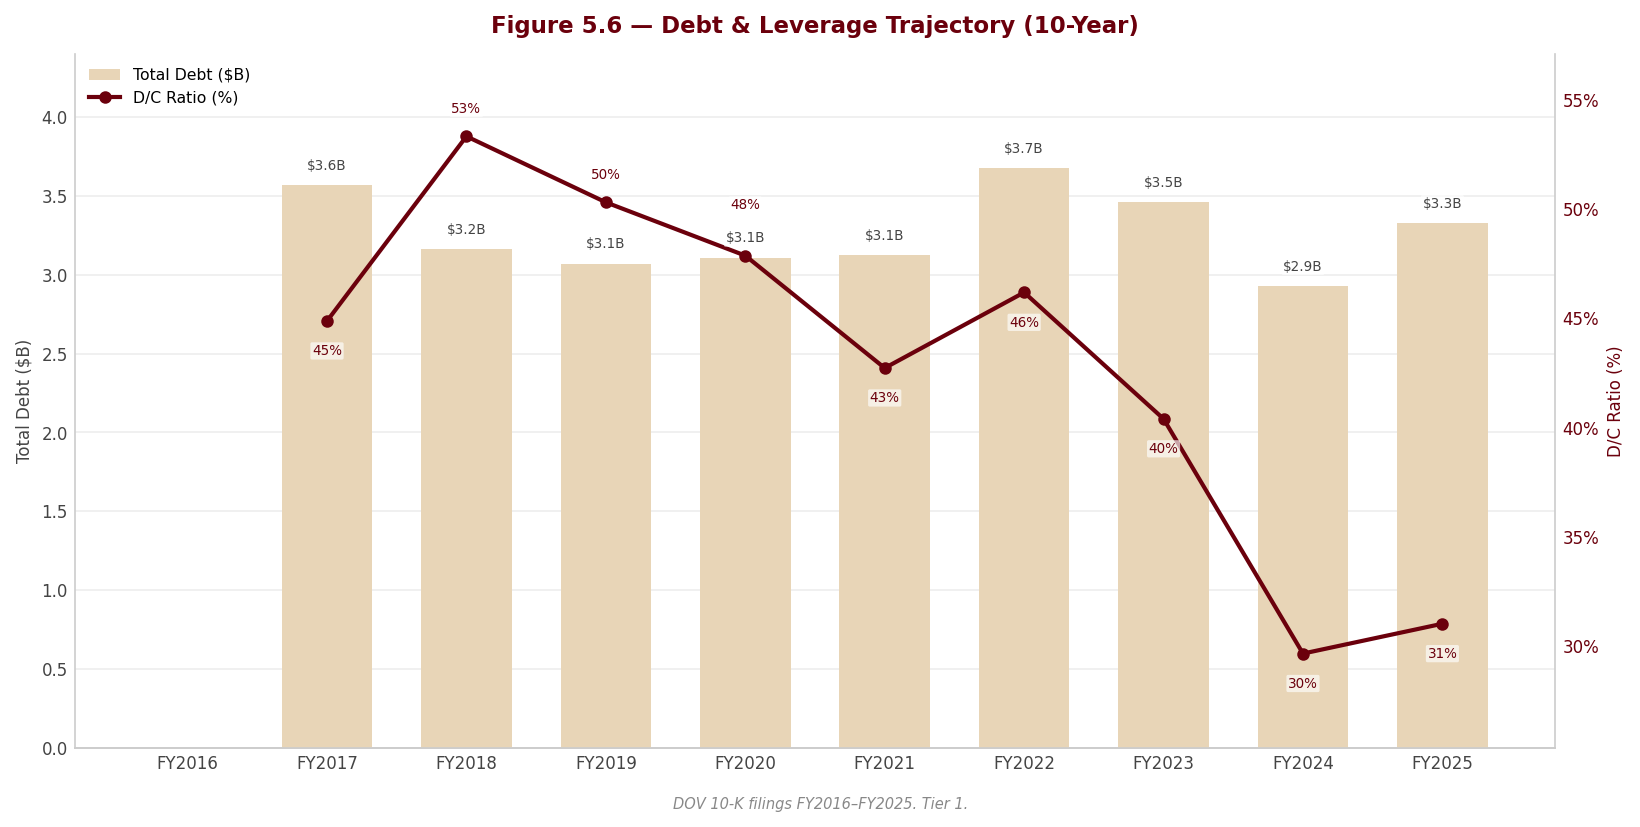
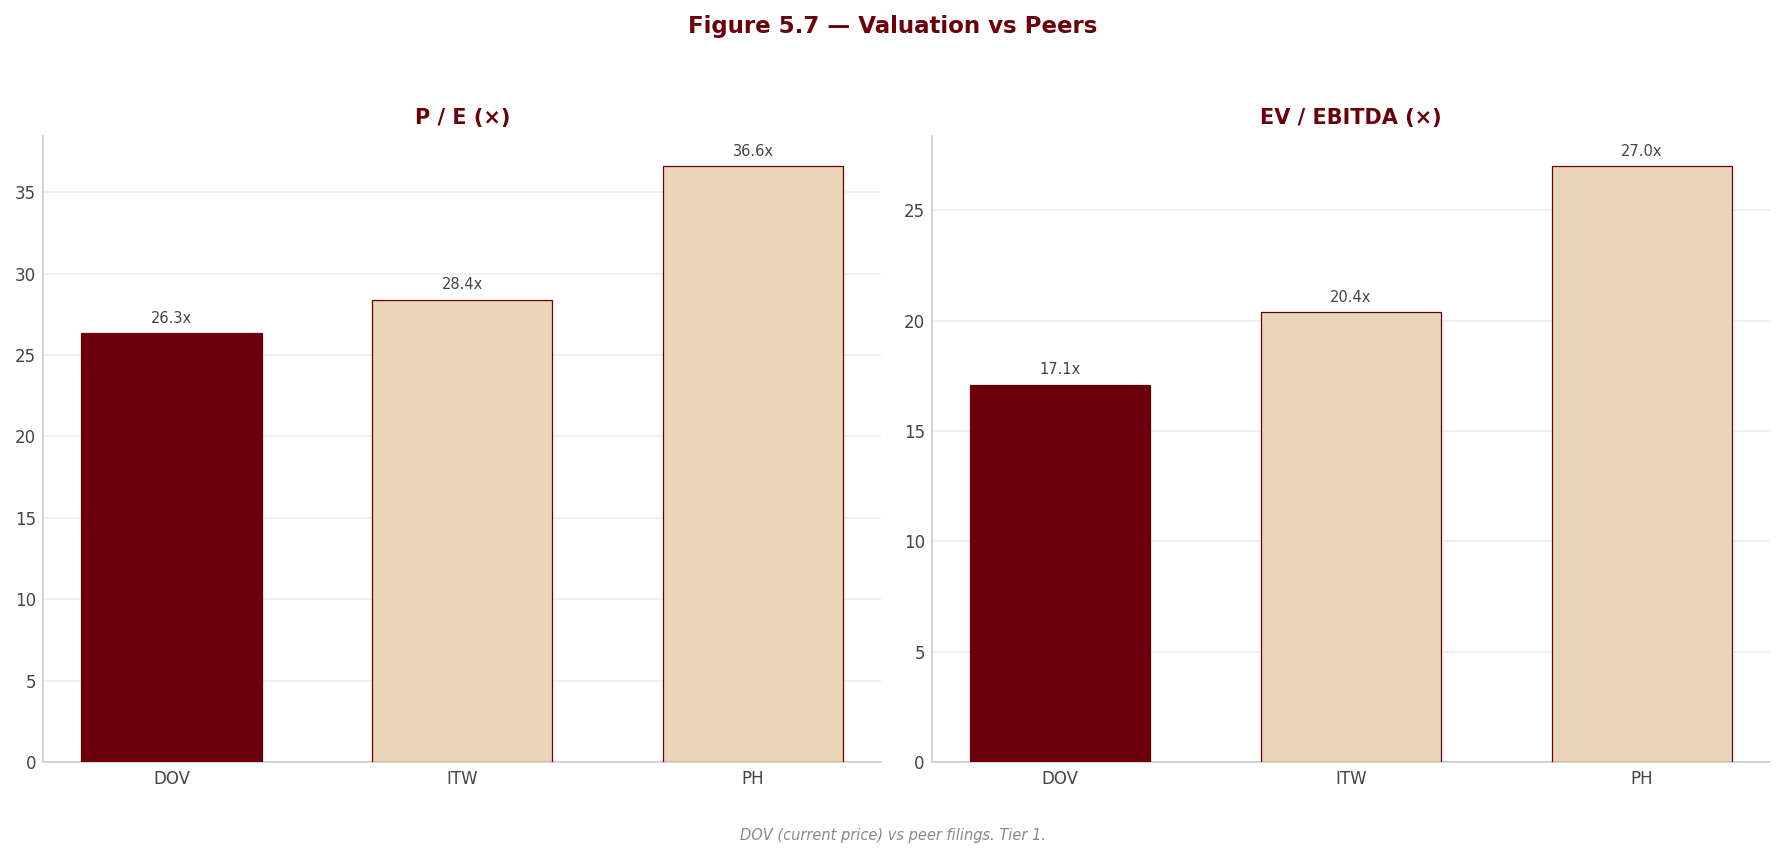
6. Valuation & Price Target withdrawn
This section stated what the shares were worth and what to do about them. It rested on an exit multiple set by hand — across the coverage it averaged 24% below where each company actually traded — so the conclusion largely restated that assumption instead of testing it. Rather than leave it standing, it has been withdrawn while the method is rebuilt.
Nothing else in this report depends on it: the financial analysis above and below is drawn from the company's own filings, and every figure links to the page it was verified against.
Section 7 — Quarterly Update: Q2 2026
Portfolio Action
[Rating and price target withdrawn — see the note at the top.]
| Assessment | |
|---|---|
| Action | [Rating and price target withdrawn — see the note at the top.] |
| Reason | [Rating and price target withdrawn — see the note at the top.] |
| Thesis intact? | PARTIALLY — the operating leg confirmed (organic growth 4.8%, bookings +16.1%, book-to-bill above 1.0 in the two largest growth segments), the capital-deployment leg weakened: $0.7 million of acquisition spend in the six months to 30 June 2026 versus $658.5 million a year earlier (10-Q p. 38), while cash built to $1,756.0M. |
| Trigger to revisit | [Rating and price target withdrawn — see the note at the top.] |
7.1 Results at a Glance
| Metric | Q2 2026 | Q2 2025 | YoY Δ | Q1 2026 | QoQ Δ |
|---|---|---|---|---|---|
| Revenue ($M) | $2,190.0M | $2,049.6M | +6.9% | $2,053.6M | +6.6% |
| Gross Profit ($M) | $880.6M | $818.3M | +7.6% | $798.1M | +10.3% |
| Gross Margin | 40.2% | 39.9% | +0.3 pp | 38.9% | +1.3 pp |
| EBITDA ($M)ᵃ | $488.6M | $449.0M | +8.8% | $403.3M | +21.1% |
| EBITDA Margin | 22.3% | 21.9% | +0.4 pp | 19.6% | +2.7 pp |
| EBIT ($M) | $391.8M | $354.6M | +10.5% | $305.9M | +28.1% |
| EBIT Margin | 17.9% | 17.3% | +0.6 pp | 14.9% | +3.0 pp |
| Net Income ($M)ᵇ | $312.2M | $279.1M | +11.9% | $238.4M | +31.0% |
| Net Margin | 14.3% | 13.6% | +0.6 pp | 11.6% | +2.6 pp |
| Diluted EPS | $2.30 | $2.02 | +13.9% | $1.75 | +31.4% |
YoY Δ is computed as (CQ - PYSQ) / |PYSQ| × 100 — e.g. revenue (2,190.021 - 2,049.592) / 2,049.592 × 100 = +6.9%. QoQ Δ is computed as (CQ - PQ) / |PQ| × 100 — e.g. revenue (2,190.021 - 2,053.623) / 2,053.623 × 100 = +6.6%. Margins are the line item divided by revenue of the same quarter — e.g. gross margin 880.606 / 2,190.021 × 100 = 40.2%; EBITDA margin 488.587 / 2,190.021 × 100 = 22.3%; EBIT margin 391.787 / 2,190.021 × 100 = 17.9%; net margin 312.246 / 2,190.021 × 100 = 14.3%. Margin deltas are stated in percentage points (pp) as CQ margin minus the comparison-quarter margin.
ᵃ Dover does not report EBITDA. It is derived here as operating earnings plus consolidated depreciation and amortisation ($96.8M in Q2 2026, $94.4M in Q2 2025, per the segment note, 10-Q p. 21). It is not a company-defined measure and is not the “segment earnings” measure Dover reports. ᵇ Net income is the bottom line including discontinued operations. The discontinued-operations line was a loss of $0.3 million after tax in Q2 2026 and $1.1 million after tax in Q2 2025 (10-Q p. 1); earnings before tax and the tax provision above the line are continuing operations only. §
Source: Dover Corporation Form 10-Q for the quarterly period ended June 30, 2026, Condensed Consolidated Statements of Earnings (p. 1); depreciation and amortisation from Note 16 — Segment Information (p. 21).
7.2 P&L Drivers
sources Revenue: The +6.9% YoY increase of $140.4 million decomposes into organic growth of 4.8%, acquisition-related growth of 1.2% and favourable foreign currency translation of 0.9%, with organic growth positive in all five segments (10-Q pp. 25, 27); customer pricing alone contributed approximately 2.2% versus 1.9% in Q2 2025, so roughly half the organic growth was price rather than volume. Geographically, organic revenue rose 7.9% in the United States, 8.8% in Other Americas and 8.5% in Asia but fell 5.0% in Europe (10-Q p. 26), and the $2.3 billion of bookings — up $322.8 million or 16.1% YoY (10-Q p. 26) — is the strongest forward signal in the quarter. Segment-wise the growth was led by Clean Energy & Fueling (+8.9% to $595.0 million) and Climate & Sustainability Technologies (+9.4% to $455.1 million), while Pumps & Process Solutions grew 6.2% to $552.7 million of which 4.9 pp was acquisitions (Sikora and ipp) and only 0.4 pp organic (10-Q pp. 30, 33, 34).
Cost and margin: COGS of $1,309.4M in Q2 2026 versus $1,231.3M in Q2 2025 grew +6.3% — computed as (1,309.415 - 1,231.330) / 1,231.330 × 100 — i.e. slower than the +6.9% revenue line, which is the whole of the +0.3 pp gross-margin expansion to 40.2%; management attributes it to favourable price-versus-cost dynamics, operating leverage on volume and benefits from restructuring actions (10-Q p. 27). SG&A of $488.8M rose only +5.4% versus $463.7M, falling to 22.3% of revenue from 22.6% (10-Q p. 27), and D&A of $96.8M versus $94.4M grew just +2.5%, so the +0.6 pp EBIT-margin expansion to 17.9% is roughly two-thirds cost-leverage and one-third gross margin. Two qualifiers on durability: the margin gain is quarter-specific — for the six months to 30 June 2026 gross margin fell 30 bp to 39.6% on unfavourable portfolio mix (10-Q p. 26) — and Q2 2026 GAAP operating earnings already absorb $17.0 million of restructuring and $51.6 million of purchase-accounting expense, both of which Dover’s own “segment earnings” measure excludes (10-Q pp. 12, 20, 37).
[Rating and price target withdrawn — see the note at the top.] Diluted EPS of $2.30 versus $2.02 is +$0.28 or +13.9% YoY and versus $1.75 is +$0.55 or +31.4% QoQ, with roughly 1.8 pp of the YoY EPS growth coming from the 1.8% reduction in diluted shares to 135,553,000 rather than from earnings (10-Q p. 23).
7.3 Balance Sheet & Cash Flow
| Metric | Q2 2026 | Q2 2025 | YoY Δ | Q1 2026 | QoQ Δ |
|---|---|---|---|---|---|
| Cash ($M) | $1,756.0M | $1,264.9M | +38.8% | $1,641.9M | +6.9% |
| Net Debt ($M) | $1,504.0M | $1,804.2M | -16.6% | $1,648.2M | -8.7% |
| Net Debt / LTM EBITDA | 0.8× | — | — | — | —ᶜ |
| Total Assets ($M) | $13,694.2M | $13,161.3M | +4.0% | $13,506.7M | +1.4% |
| Equity ($M) | $7,704.0M | $7,441.3M | +3.5% | $7,489.9M | +2.9% |
| OCF ($M) | $236.2M | $212.3M | +11.3% | $191.0M | +23.7% |
| CapEx ($M)ᵈ | $47.8M | $60.9M | -21.5% | $59.8M | -20.1% |
| FCF ($M) | $188.4M | $151.4M | +24.4% | $131.2M | +43.6% |
| Dividends Paid ($M)ᵈ | $70.0M | $70.6M | -0.8% | $70.4M | -0.6% |
YoY Δ = (CQ - PYSQ) / |PYSQ| × 100 — e.g. net debt (1,504.017 - 1,804.250) / 1,804.250 × 100 = -16.6%. QoQ Δ = (CQ - PQ) / |PQ| × 100 — e.g. net debt (1,504.017 - 1,648.197) / 1,648.197 × 100 = -8.7%.
Net Debt / LTM EBITDA: LTM EBITDA = Q3 2025 $475.7M + Q4 2025 $444.6M + Q1 2026 $403.3M + Q2 2026 $488.6M = $1,812.2M. Net Debt $1,504.0M / $1,812.2M = 0.8×. The Q3 2025 and Q4 2025 standalone quarterly EBITDA figures are taken from the section-7 data pack’s source workbook (Data sheet row 20, columns 20–21), because the section-7 data pack itself carries only the CQ, PYSQ and PQ columns.
ᶜ A trailing-twelve-month leverage ratio is a point-in-time measure; the prior-quarter and prior-year-quarter columns are not populated because the template reserves this row for the current-quarter ratio only. Dover’s own leverage disclosure is net debt to net capitalisation, which fell to 16.3% at 30 June 2026 from 18.2% at 31 December 2025 (10-Q p. 40). ᵈ CapEx and dividends are stored in the model as positive magnitudes and are shown that way here; both are cash outflows. Q2 2026 capital expenditure of $47.8M and dividends paid of $70.0M ($0.52 per share, up from $0.515 in Q2 2025) are outflows (10-Q pp. 4, 21).
Source: Dover Corporation Form 10-Q for the quarterly period ended June 30, 2026 — Condensed Consolidated Balance Sheets (p. 3), Condensed Consolidated Statements of Stockholders’ Equity (pp. 4–5), Condensed Consolidated Statements of Cash Flows (p. 6), Note 10 — Borrowings (p. 13), Note 16 — Segment Information (p. 21) and MD&A Capitalization (p. 40).
Balance sheet note: Net debt fell to $1,504.0M from $1,648.2M sequentially and from $1,804.2M a year ago; Dover attributes the $147.1 million six-month decline to the higher cash balance and to a lower carrying value of the euro-denominated notes on foreign currency translation, with total debt at $3,259,988 thousand versus $3,327,972 thousand at 31 December 2025 (10-Q p. 40) — so the improvement is partly currency, not repayment. The material working-capital movement is the build in adjusted working capital of $219.4 million, or 12.4%, in six months, comprising receivables up $151.0 million and inventories up $148.5 million against accounts payable up $80.1 million (10-Q p. 38), which is why total assets rose 4.0% YoY while equity rose only 3.5%.
Cash flow note: FCF conversion = FCF / Net Income = 188.4 / 312.246 × 100 = 60.3% in Q2 2026, against 54.3% in Q2 2025 and 55.0% in Q1 2026 — improving, but cash still lags earnings by roughly $124 million in the quarter. The divergence is entirely working capital: for the six months, receivables consumed $163.9 million and inventories $167.6 million against only $91.6 million released by accounts payable (10-Q p. 6), and Dover’s own six-month free cash flow of $319.6 million equals just 58.0% of earnings from continuing operations (10-Q p. 39), so the full-year FCF case still depends on the usual second-half unwind.
7.4 Footnote Review
sources Page references are to the printed page numbers of Dover’s Form 10-Q for the quarterly period ended 30 June 2026. All nineteen notes were read in full; each is addressed below.
Note 1 — Basis of Presentation (10-Q p. 7) Interim statements prepared under U.S. GAAP, unaudited, reflecting all adjustments of a normal recurring nature; the 31 December 2025 balance sheet was derived from audited statements. The note restates that the Environmental Solutions Group (“ESG”), formerly within Engineered Products, was sold in Q4 2024 and is reported as discontinued operations, and that all other notes relate solely to continuing operations. Confirmed unchanged in substance vs. Q2 2025 (10-Q p. 7). Analytically this is the point that makes the comparison in 7.1 clean: both Q2 2026 and Q2 2025 are already post-ESG, so no divestiture adjustment is required for any YoY figure in this section.
Note 2 — Revenue (10-Q pp. 7–8) Approximately 95% of revenue is recognised at a point in time and 5% over time; payment terms are 30 to 90 days. Remaining unsatisfied performance obligations were $331,237 thousand at 30 June 2026, of which 65.6% is expected to be recognised through 2027 and 19.4% in 2028. Contract assets rose to $50,956 thousand from $36,018 thousand at 31 December 2025 (+41.5%) and current contract liabilities to $164,945 thousand from $155,025 thousand; revenue recognised in the six months from opening contract liabilities was $106,586 thousand versus $116,466 thousand in the prior-year period. The note gives 31 December 2025 comparatives rather than Q2 2025 ones, so a strict YoY comparison is not available from this note. Significance: with disclosed remaining obligations of $331.2 million against quarterly revenue of $2,190.0M, contracted backlog covers about seven weeks of sales — Dover remains a short-cycle business whose visibility comes from bookings, not backlog, which is why the 16.1% bookings increase matters more than this number.
Note 3 — Acquisitions (10-Q pp. 8–9) One immaterial acquisition was completed in the six months to 30 June 2026, within Engineered Products, for approximately $0.7 million of cash (10-Q pp. 8, 38). In the prior-year six months Dover acquired three businesses for $653,891 thousand net of cash — Sikora AG at $608,459 thousand (goodwill $340,478 thousand; intangibles $309,690 thousand), Cryo-Mach at $28,909 thousand and ipp at $16,523 thousand — all in Pumps & Process Solutions. During the current six months Dover recorded a $5,592 thousand measurement-period adjustment increasing Sikora goodwill. This is the largest change in the filing versus Q2 2025 and it is a thesis item: for a serial acquirer whose ~12.8% ROIC exceeds its ~9.28% WACC, a year in which deployment falls from $658.5 million to $0.7 million while cash rises to $1,756.0M converts the compounding case into an idle-balance-sheet case.
Note 4 — Discontinued and Disposed Operations (10-Q pp. 9–10) ESG was sold to Terex Corporation on 8 October 2024 for $2.0 billion net of cash transferred. Post-closing adjustments produced a discontinued-operations loss of $378 thousand pre-tax ($299 thousand after tax) in Q2 2026 and $778 thousand ($615 thousand after tax) for the six months, versus $1,335 thousand ($1,066 thousand after tax) in Q2 2025 and $11,993 thousand ($9,486 thousand after tax) in the prior-year six months — the drag has shrunk by 72% YoY on a quarterly basis. Changed materially vs. Q2 2025: the note now carries the June 2025 jury verdict against the ESG business of approximately $58.9 million for alleged breach of contract and inducement of breach of fiduciary duty, on which ESG has filed post-trial motions and, if necessary, will appeal to the Seventh Circuit. No expense has been recognised because management does not believe a loss is probable. Significance: an unaccrued contingency of $58.9 million equals 18.9% of Q2 2026 net earnings of $312.2M; it is the single largest quantified off-balance-sheet exposure in the filing and it remains unresolved a full year after the verdict.
Note 5 — Inventories, net (10-Q p. 10) Inventories of $1,421,297 thousand versus $1,272,784 thousand at 31 December 2025 (+11.7%), with raw materials up to $855,244 thousand from $765,453 thousand and reserves slightly lower at $146,571 thousand versus $150,421 thousand. Significance: inventory grew 11.7% in six months against six-month revenue growth of 8.4%, and the reserve fell while gross inventory rose — management says the build supports higher volume deliveries expected over the next several quarters, consistent with the order book (10-Q p. 38). Given a 1.23 book-to-bill in Climate & Sustainability Technologies this is defensible, but it is the main reason Q2 FCF conversion was only 60.3%.
Note 6 — Property, Plant and Equipment, net (10-Q p. 10) Net PP&E of $1,114.0M versus $1,119,623 thousand at 31 December 2025, on gross assets of $2,986,703 thousand and accumulated depreciation of $1,872,685 thousand. Depreciation expense was $43,363 thousand in Q2 2026 versus $43,157 thousand in Q2 2025 — effectively flat, a +0.5% change. Significance: capital expenditure of $47.8M exceeded quarterly depreciation by only about $4.4 million, and full-year capex guidance of $190.0 million to $210.0 million (10-Q p. 39) implies continued maintenance-level spending — a genuinely capital-light industrial, which supports the free-cash-flow characteristics assumed in the valuation.
Note 7 — Credit Losses (10-Q p. 10) The allowance for credit losses rose to $37,388 thousand at 30 June 2026 from $35,418 thousand at 1 January, after a provision of $3,796 thousand and write-offs of $1,239 thousand; the prior-year six months showed a provision of $5,017 thousand ending at $37,913 thousand. Changed vs. Q2 2025: the allowance is $525 thousand lower and the provision 24.3% lower. Significance: receivables grew $151.0 million in the half while the loss allowance shrank in both absolute terms and as a share of receivables (2.5% at 30 June 2026 versus roughly 2.8% a year earlier) — not a red flag at this scale, but the direction is the mild kind of receivable-quality drift worth re-checking next quarter.
Note 8 — Goodwill and Other Intangible Assets (10-Q p. 11) Goodwill fell to $5,376,664 thousand from $5,430,038 thousand at 31 December 2025 — a $58,966 thousand foreign currency translation reduction partly offset by the $5,592 thousand Sikora measurement adjustment — with no impairment recorded. Net intangibles fell to $1,642,517 thousand from $1,759,616 thousand. Amortisation expense was $53,449 thousand in Q2 2026 versus $51,226 thousand in Q2 2025 (+4.3%), and the note states it is primarily acquisition-related. Significance: this is the arithmetic behind forensic flag F001. Intangibles amortised down $117.1 million in six months with essentially no acquisitions to replenish them, so a company that stopped acquiring would see reported GAAP earnings converge upward toward “segment earnings” over time — the gap is a real economic cost only for as long as Dover keeps buying, which in this quarter it did not.
Note 9 — Restructuring Activities (10-Q p. 12) Restructuring charges of $17,012 thousand in Q2 2026 versus $13,529 thousand in Q2 2025 (+25.7%), and $47,223 thousand versus $21,839 thousand for the six months (+116.2%). Q2 charges were concentrated in Climate & Sustainability Technologies ($5,826 thousand) and Engineered Products ($5,087 thousand); $8,282 thousand sits in cost of goods and services and $8,730 thousand in SG&A. The severance and exit accrual rose to $26,851 thousand from $18,594 thousand at 1 January after $33,411 thousand of payments. [Rating and price target withdrawn — see the note at the top.] The company states it “will continue to make proactive adjustments to its cost structure,” which is a recurring-cost admission, not a one-off.
Note 10 — Borrowings (10-Q p. 13) [Rating and price target withdrawn — see the note at the top.] Changed vs. Q2 2025: on 2 April 2026 Dover entered a new $1.5 billion five-year unsecured revolving credit facility maturing 2 April 2031, terminating the previous $1.0 billion facility and letting the $500.0 million 364-day facility expire. Covenant: minimum interest coverage of consolidated EBITDA to consolidated net interest expense of not less than 3.0 to 1; the actual ratio at 30 June 2026 was 36.9 to 1, and there were no outstanding borrowings under the facility. Letters of credit, surety bonds and guarantees totalled approximately $230.0 million. Significance: covenant headroom is roughly twelve times the requirement, the November 2026 euro maturity of $681.8 million is fully covered by cash of $1,756.0M, and liquidity was increased by 50% at a time when the company is not deploying capital — refinancing risk is not a live issue for this name.
Note 11 — Financial Instruments (10-Q pp. 14–15) Cash flow hedges: currency forwards with notional $150,105 thousand versus $153,765 thousand at 31 December 2025, carried at a $1,663 thousand asset and $350 thousand liability (Level 2); non-designated contracts of $104,950 thousand versus $74,403 thousand. Net investment hedges: the €600,000, €500,000 and €550,000 thousand euro notes, which produced a gain of $31,194 thousand in Q2 2026 versus a loss of $95,347 thousand in Q2 2025 ($24,163 thousand gain versus $86,312 thousand loss after tax). [Rating and price target withdrawn — see the note at the top.] Significance: the currency swing is a $126.5 million pre-tax reversal versus the prior-year quarter, but it lands in other comprehensive income, not earnings — which is why total other comprehensive loss of $32,737 thousand in Q2 2026 (against income of $85,932 thousand in Q2 2025, 10-Q p. 2) held equity growth to +3.5% YoY while net income grew +11.9%. None of this touches the P&L.
Note 12 — Income Taxes (10-Q p. 15) [Rating and price target withdrawn — see the note at the top.] Dover states it is routinely audited in its filing jurisdictions with a number of audits underway and believes adequate provision has been made for all income tax uncertainties; no dollar amount of unrecognised tax benefits is disclosed in this interim filing. MD&A adds that the One Big Beautiful Bill enacted 4 July 2025 and the OECD base-erosion work are not expected to have a material impact (10-Q p. 28). [Rating and price target withdrawn — see the note at the top.] The absence of a quantified unrecognised-tax-benefit figure means the audit exposure cannot be sized from this filing.
Note 13 — Equity Incentive Program (10-Q pp. 16–17) In the six months to 30 June 2026 Dover granted SARs over 266,199 shares, 32,294 PSAs and 56,039 RSUs, versus 283,082, 34,458 and 57,625 in the prior-year period — grants down 6% to 8% across all three instruments. Grant price was $231.63 versus $202.33; SAR fair value per share was $61.59 versus $66.39 on lower assumed volatility (23.47% versus 30.50%). Pre-tax stock-based compensation was $6,799 thousand in Q2 2026 versus $7,003 thousand in Q2 2025, and $27,759 thousand versus $30,877 thousand for the six months. Significance: at $6.8 million, share-based compensation is 1.7% of Q2 2026 GAAP operating earnings of $391.8M and is falling YoY — dilution from compensation is immaterial to this thesis and is more than offset by repurchases.
Note 14 — Commitments and Contingent Liabilities (10-Q pp. 17–18) Environmental matters: a few subsidiaries are involved in waste-site cleanup as potentially responsible parties and in remedial activities at current and former plants; estimated liabilities were “not significant” at both 30 June 2026 and 31 December 2025 — no dollar amount is quantified. Other legal proceedings involve product-injury claims, patent infringement, employment and commercial disputes; estimated liabilities were “immaterial” at both dates, and management states no proceeding individually or in aggregate could have a material effect. Warranty accrual: $45,088 thousand at 30 June 2026 versus $43,835 thousand at 30 June 2025, after six-month provisions of $27,688 thousand versus $24,559 thousand and settlements of $27,525 thousand versus $25,822 thousand. Supply chain financing confirmed to financial institutions within accounts payable was $135,801 thousand at 30 June 2026 versus $117,884 thousand at 31 December 2025. Significance: the warranty provision grew 12.7% YoY against 8.4% six-month revenue growth — a small but adverse trend. More usefully, supply-chain financing grew $17.9 million in the half, which is 22.4% of the $80.1 million accounts-payable increase that supported operating cash flow — so part of the payables tailwind is bank-intermediated rather than an operating improvement. The note explicitly cross-refers to Note 4 for the ESG litigation.
Note 15 — Accumulated Other Comprehensive Earnings (Loss) (10-Q p. 18) Reclassifications out of AOCI in Q2 2026 were a $37 thousand foreign currency translation gain (versus a $1,858 thousand loss in Q2 2025), pension amortisation of $570 thousand pre-tax ($450 thousand after tax, versus $1,323 thousand and $1,030 thousand) and cash flow hedge gains reclassified of $768 thousand pre-tax ($603 thousand after tax, versus a $1,184 thousand loss). Significance: every line is under $1 million; none is material to Q2 2026 net earnings of $312.2M. Read and confirmed immaterial vs. Q2 2025.
Note 16 — Segment Information (10-Q pp. 19–22) Five reportable segments. Q2 2026 revenue and segment earnings versus Q2 2025: Engineered Products $283,481 / $57,798 thousand (margin 20.4% versus 19.4%); Clean Energy & Fueling $594,959 / $128,546 thousand (21.6% versus 19.7%); Imaging & Identification $305,101 / $84,976 thousand (27.9% versus 26.3%); Pumps & Process Solutions $552,709 / $178,848 thousand (32.4% versus 30.6%); Climate & Sustainability Technologies $455,097 / $75,826 thousand (16.7% versus 18.6%). Total segment earnings of $525,994 thousand versus $474,985 thousand reconcile to pre-tax earnings after purchase accounting of $51,591 thousand, restructuring and other costs of $24,635 thousand, corporate expense of $47,534 thousand and net interest. Revenue by geography: United States $1,217,390 thousand versus $1,146,736 thousand. Capital expenditure by segment totals $47,783 thousand versus $60,932 thousand. Segment earnings is expressly defined as earnings before purchase accounting expenses, restructuring and other costs, dispositions, corporate expense and interest — it is Dover’s own non-GAAP measure, and every segment margin quoted above is on that basis. Significance: four of five segments expanded margin, but the $123.8 million of purchase accounting, restructuring and corporate costs excluded from the 24.0% “total segments” margin is exactly what separates it from the 17.9% GAAP EBIT margin computed in 7.1. Climate & Sustainability Technologies is the one deteriorating segment — earnings down 1.9% on revenue up 9.4% — because of footprint-consolidation timing and production-ramp costs in retail refrigeration (10-Q p. 34).
Note 17 — Stockholders’ Equity (10-Q p. 22) The $500,000 thousand accelerated share repurchase agreement with JPMorgan entered on 10 November 2025 completed in April 2026 with delivery of 153,652 additional shares, bringing the total to 2,487,662 shares at an average of $200.99. Excluding the ASR, there were no share repurchases in either Q2 2026 or Q2 2025; for the six months Dover repurchased 250,000 shares for $53,937 thousand ($215.75 per share) versus 200,000 shares for $40,700 thousand ($203.50 per share) in the prior-year period. 14,193,056 shares remain authorised under the August 2023 authorisation, which expires 31 December 2026. [Rating and price target withdrawn — see the note at the top.] The authorisation expiring at the end of 2026 is a capital-allocation decision point.
Note 18 — Earnings per Share (10-Q p. 23) Reconciles net earnings of $312,246 thousand to basic EPS of $2.32 and diluted EPS of $2.30, on basic weighted average shares of 134,759,000 (versus 137,226,000 in Q2 2025) and diluted shares of 135,553,000 (versus 137,974,000), a 1.8% reduction; the dilutive effect of SARs, PSAs and RSUs was 794,000 shares versus 748,000, and 46,000 shares were anti-dilutive versus 61,000. Significance: quantifies the buyback contribution — roughly 1.8 pp of the +13.9% YoY diluted EPS growth is share-count reduction rather than earnings, so the underlying earnings growth is the +11.9% net-income figure.
Note 19 — Recent Accounting Pronouncements (10-Q pp. 23–24) Not yet adopted: ASU 2024-03 on expense disaggregation disclosures (fiscal years beginning after 15 December 2026) and ASU 2026-02 on environmental credits (after 15 December 2027) — both under evaluation. Adopted: ASU 2023-09 income tax disclosures (Q4 2025), ASU 2025-05 credit-loss practical expedient (1 January 2026, no material impact) and ASU 2025-06 internal-use software (1 January 2026, no material impact). Changed vs. Q2 2025: ASU 2026-02 is newly disclosed and two standards have since been adopted. Significance: ASU 2024-03 is the one to watch — from FY2027 it will force disaggregation of expense categories at interim dates, which will make the composition of Dover’s cost base, and therefore the size of the segment-earnings adjustments flagged in F001, considerably more visible to outside analysts.
Related-party transactions (10-Q pp. 3, i, 22, 45) Dover discloses no related-party transactions and carries no related-party note: the index of notes lists nineteen notes, none of which covers related parties (10-Q table of contents, p. i). There is no controlling shareholder. There are no non-controlling interests and no equity-method investments on the balance sheet — total stockholders’ equity of $7,704.0M plus total liabilities equals total assets of $13,694.2M exactly, with no minority-interest line (10-Q p. 3), and the only partial ownership disclosed anywhere in the filing is the 0.2% of Sikora AG not acquired, which is not separately presented (10-Q p. 8). The two counterparties with a recurring relationship are arm’s-length commercial banks, and both are quantified: JPMorgan Chase Bank, N.A. as counterparty to the $500,000 thousand ASR Agreement, under which 153,652 shares were delivered in Q2 2026 at an average of $200.99 per share (versus zero ASR activity in Q2 2025, when no such agreement existed), and JPMorgan Chase Bank, N.A. as administrative agent on the $1.5 billion Five-Year Credit Agreement dated 2 April 2026, under which there were no outstanding borrowings at 30 June 2026 and therefore no interest paid (10-Q pp. 13, 22, 45). Terms have not changed on the ASR, which is now complete; the credit facility terms are new this quarter and are described in Note 10. Item 5 confirms that no director or Section 16 officer adopted or terminated any Rule 10b5-1 or non-Rule 10b5-1 trading arrangement during the six months (10-Q p. 44). Analytically, the absence of related-party leakage removes an entire category of governance risk from this name — Dover’s cash flows are not shared with an affiliated parent.
Contingencies and litigation (10-Q pp. 9–10, 13, 17–18, 43) Four open exposures, each read this quarter. (1) ESG jury verdict — approximately $58.9 million, returned June 2025 against the discontinued ESG business for alleged breach of contract and inducement of breach of fiduciary duty; post-trial motions filed, Seventh Circuit appeal contemplated; no expense recognised, as a loss is not considered probable; unchanged in amount versus the prior-year disclosure but now a year old without resolution (10-Q pp. 9–10). (2) Environmental / potentially-responsible-party matters at several subsidiaries plus ongoing remediation at current and former plant sites; estimated liabilities described as “not significant” at both 30 June 2026 and 31 December 2025, with no amount quantified (10-Q p. 17). (3) Other legal proceedings — product injury, patent, employment and commercial claims; estimated liabilities “immaterial” at both dates; management assesses no material effect individually or in aggregate (10-Q pp. 17–18). (4) Letters of credit, surety bonds and performance guarantees of approximately $230.0 million expiring on various dates through 2035, issued as security for insurance, warranty and performance obligations, with default probability described as remote (10-Q p. 13). Part II Item 1 adds nothing beyond a cross-reference to Note 14, and Item 1A states there have been no material changes to the risk factors in the FY2025 Form 10-K (10-Q p. 43). Net assessment: only the $58.9 million ESG verdict is both quantified and unaccrued; at 18.9% of Q2 2026 net earnings it is a real but survivable exposure, and it attaches to a business Dover no longer owns, so any loss would be a one-time cash item rather than an earnings-power impairment.
Subsequent events (10-Q pp. cover, 43, 44, 46) The filing contains no subsequent-events note — the note index runs from Note 1 to Note 19 and none covers subsequent events (10-Q p. i). Three post-quarter facts are disclosed elsewhere in the document: shares outstanding as of 17 July 2026 were 134,680,225 (cover page), which is below the Q2 2026 basic weighted average of 134,759,000 and therefore confirms no post-quarter issuance; management concluded that disclosure controls were effective as of 30 June 2026, with no changes in internal control over financial reporting during Q2 2026 (10-Q p. 43); and the filing was signed on 23 July 2026 by CFO Christopher B. Woenker and Controller Ryan W. Paulson (10-Q p. 46). Item 5 discloses no other information (10-Q p. 44). No acquisition, disposal, financing, guidance change or litigation development is disclosed between 30 June 2026 and the 23 July 2026 filing date.
7.5 What Changed This Quarter
sources - Bookings of $2.3 billion, up $322.8 million or 16.1% YoY, with increases across all five segments (10-Q p. 26). Climate & Sustainability Technologies bookings rose 45.8% to $560,272 thousand for a 1.23 book-to-bill, and Pumps & Process Solutions reached 1.07 (10-Q pp. 33–34). For a business with only $331.2 million of disclosed remaining performance obligations, bookings are the real forward indicator, and they are running well ahead of the 6.9% revenue growth — this is the most thesis-supportive datapoint in the filing and argues that H2 2026 revenue should accelerate. - Acquisition spending collapsed to $0.7 million for the six months, from $658.5 million a year earlier (10-Q p. 38), while cash rose to $1,756.0M and net debt fell to $1,504.0M (0.8× LTM EBITDA). This is the quarter’s central thesis tension: the report declines to anchor on the organic-only DCF precisely because Dover redeploys capital at a ~12.8% ROIC against a ~9.28% WACC. A balance sheet with $1,756.0M of cash, a new $1.5 billion undrawn revolver and 36.9-to-1 covenant coverage but no deployment is capacity that is not yet earning its premium. [Rating and price target withdrawn — see the note at the top.] - Climate & Sustainability Technologies is the one segment moving the wrong way: revenue up 9.4% to $455,097 thousand but segment earnings down 1.9% to $75,826 thousand, margin 16.7% versus 18.6% (10-Q p. 34). The cause is footprint-consolidation timing and production-ramp costs in retail refrigeration, and the same segment absorbed $10,736 thousand of the quarter’s $24,635 thousand restructuring and other costs (10-Q p. 36). It is simultaneously the segment with the strongest order book — an execution risk to watch, not yet a thesis breach. - Working capital consumed $219.4 million in six months (+12.4%), holding Q2 FCF conversion to 60.3% of net income and six-month free cash flow to 58.0% of continuing-operations earnings (10-Q pp. 38–39). Management links the build to expected H2 volumes, and $17.9 million of the offsetting payables increase came from supply-chain financing (10-Q p. 18) rather than operating terms — the full-year cash case still rests on a second-half unwind that has not yet happened. - Capital returned this quarter was $70.0M of dividends ($0.52 per share) plus completion of the $500 million ASR at an average of $200.99 (10-Q pp. 4, 22), with 14,193,056 shares still authorised under an authorisation that expires 31 December 2026. Diluted shares fell 1.8% YoY to 135,553,000 (10-Q p. 23). Buybacks executed at $200.99 to $215.75 are below today’s $209.93 but well above the $160.62 target — on this report’s own numbers, repurchase is not the highest-return use of the cash.
7.6 Portfolio Decision
sources [Rating and price target withdrawn — see the note at the top.] Q2 2026 was operationally the best quarter in the model — revenue $2,190.0M (+6.9% YoY), GAAP operating earnings $391.8M (+10.5%, a 17.9% margin, +0.6 pp YoY) and diluted EPS $2.30 (+13.9%) — and bookings of $2.3 billion, up 16.1%, say the next two quarters should be at least as good. [Rating and price target withdrawn — see the note at the top.] The footnote review adds the argument against upgrading: acquisition spend of $0.7 million in six months versus $658.5 million a year earlier, with $1,756.0M of cash idle and buybacks executed at $200.99 to $215.75 — the ROIC-above-WACC redeployment that justifies paying more than the organic DCF is precisely what did not happen this quarter, and the F001 adjustments Dover excludes from segment earnings ($51.6 million of purchase accounting plus $24.6 million of restructuring and other costs, together 19.5% of GAAP operating earnings) are still fully present in the GAAP numbers used above.
What would change this view: [Rating and price target withdrawn — see the note at the top.] [Rating and price target withdrawn — see the note at the top.]
Report Versions
Every published version of this report, newest first — each one kept so a reader can see what changed and when.
| Version date | Files |
|---|---|
| 2026-08-19 Current | Model (Excel) |
| 2026-08-05-2 | Model (Excel) |
| 2026-08-05 | Model (Excel) |