
CrowdStrike Holdings
Section 1 — Business Overview, Operations & Competitive Positioning
1.1 The Business
sources CrowdStrike sells cybersecurity as a subscription. A single lightweight software sensor, installed once on a customer’s endpoints and cloud workloads, streams security telemetry into the company’s cloud platform; the customer then pays a recurring annual fee for each of the software “modules” it activates across that one sensor. The economic engine is therefore recurring, high-margin subscription revenue that compounds as existing customers switch on more modules and extend coverage to more devices — the “land-and-expand” model — supplemented by a smaller, deliberately lead-generating professional-services arm (incident response, forensics and advisory) that management runs as a funnel into future subscriptions.
The company generated $4,812.0M of revenue in fiscal 2026 (the year ended 31 January 2026), the overwhelming majority of it recurring subscription revenue recognized ratably over multi-year contract terms. It operates globally from an Austin, Texas base through a distributed, remote-first workforce that it has run since inception, sells primarily through a partner-first channel of resellers, MSSPs and cloud marketplaces, and trades on Nasdaq under CRWD. Gross margin sits near the top of the software peer group and a growing share of revenue converts to free cash flow. On the substance of the business there is no argument: this is a category leader with a genuine franchise, not a broken model.
The problem is the price, not the business. [Rating and price target withdrawn — see the note at the top.] It is deliberately, and far, above the intrinsic value the company’s own discounted cash flows support — a cash-flow-based fair value that the separate valuation quantifies and that sits at a fraction of both the current price and our target. The two anchors are different on purpose. The intrinsic figure is what the cash flows are worth today; the target is where a high-quality, high-momentum name can plausibly trade a year out. A discount that wide does not close inside twelve months for a franchise of this quality, and collapsing the two numbers into one would misrepresent the call rather than sharpen it.
Key Information
| Item | Value |
|---|---|
| Ticker | CRWD |
| Sector / Industry | Technology / Cybersecurity |
| Report Date | 2026-08-11 |
| Most Recent FY Revenue | $4,812.0M |
| EBIT Margin (Most Recent FY) | -6.1% |
| Diluted Weighted-Average Shares (post-split basis) | 1,002M |
| Current Price | $214.42 |
Source: CrowdStrike 10-K FY2026 (year ended 31 January 2026); FL valuation model. Tier 1. Rating, target and conviction are analyst judgments; see Appendix A.1.
The revenue trajectory frames both the quality and the risk. Growth has been extraordinary in absolute terms, but its pace has stepped down in each successive year — a deceleration that is the single most important input to any terminal-value judgment, and one Section 3 dissects in full.
| Revenue ($M) | FY2021 | FY2022 | FY2023 | FY2024 | FY2025 | FY2026 |
|---|---|---|---|---|---|---|
| Total revenue | $874.4M | $1,451.6M | $2,241.2M | $3,055.6M | $3,953.6M | $4,812.0M |
Source: CrowdStrike 10-K FY2026, consolidated statements of operations; prior-year 10-Ks. Tier 1.
1.2 Operating Segments
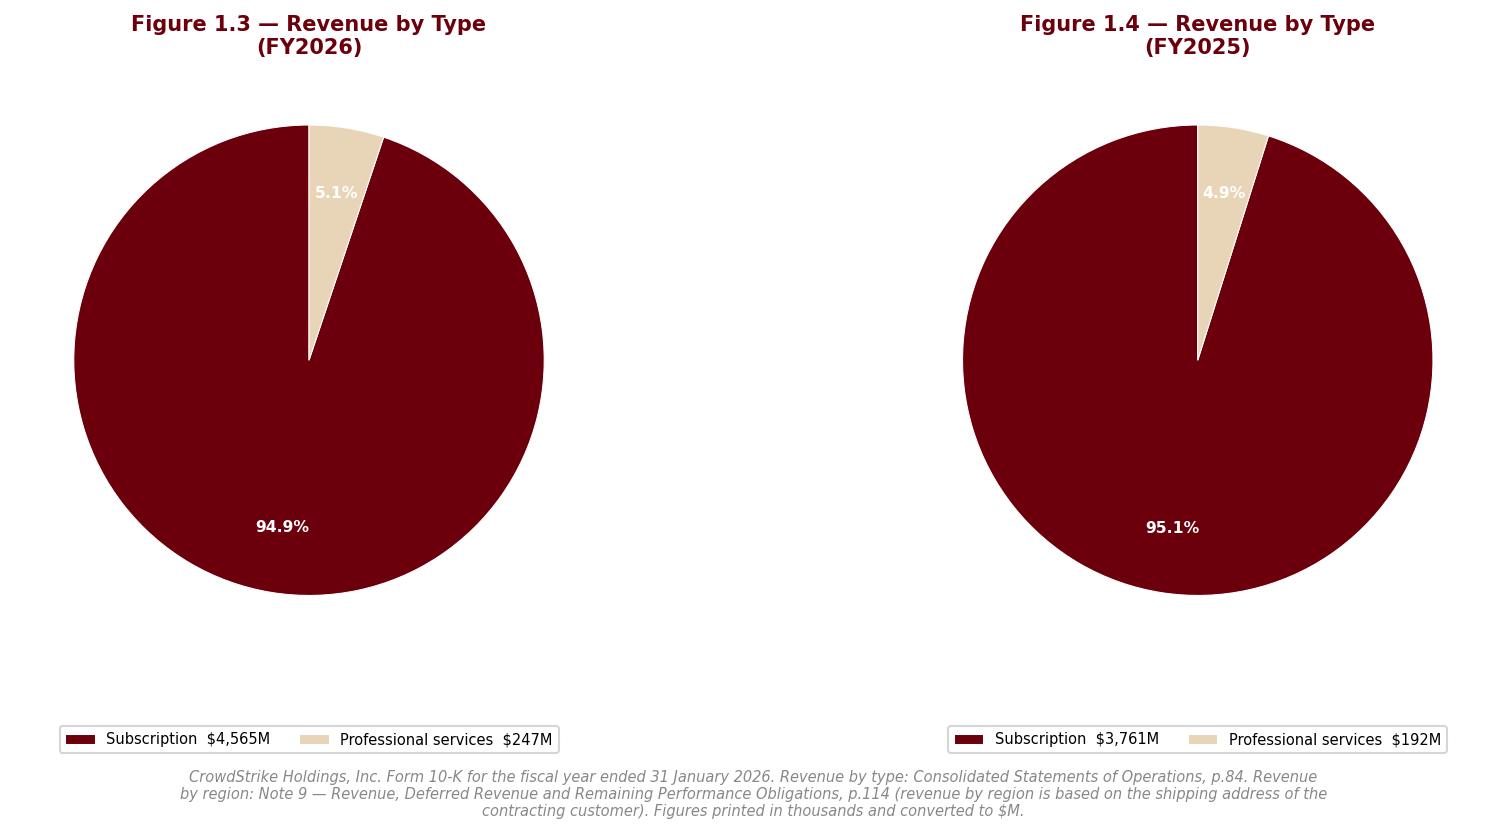
sources CrowdStrike reports as a single operating and reportable segment. The chief operating decision maker — the CEO — manages the business at the consolidated level and measures it on consolidated results, so there is no product-line or geographic segment structure to disaggregate. The economically meaningful way to read the business is instead by revenue type and by the mechanics of the Falcon platform. §
Two revenue streams sit inside the one segment. The first, and by far the larger, is subscription: annual recurring fees for Falcon modules spanning endpoint and workspace security, cloud security, identity protection, exposure management, next-generation SIEM and log management, managed detection and response, threat intelligence, data protection and SaaS security posture management — all delivered through the single sensor. The second is professional services (incident response, proactive assessments, deployment and training), which management explicitly treats not as a profit centre but as a lead engine that converts breach-response engagements into subscription customers. [Rating and price target withdrawn — see the note at the top.] §
As a system, the architecture is the flywheel. Because every module runs off one sensor and one data model — unified by what management calls the Enterprise Graph — data collected once is reused many times, and each incremental module both raises switching costs and, management argues, improves the platform’s AI as more telemetry flows through it. That is a real source of operating leverage and stickiness. The fragility is the mirror image of the strength: the entire model rests on a single sensor (a July 2024 content update to that sensor caused a global outage, examined in Section 2) and on a single expansion metric, ARR, whose measurement for certain customers is the subject of an active federal inquiry (again, Section 2). A business with one sensor and one headline metric has concentrated failure points, and both have been tested.
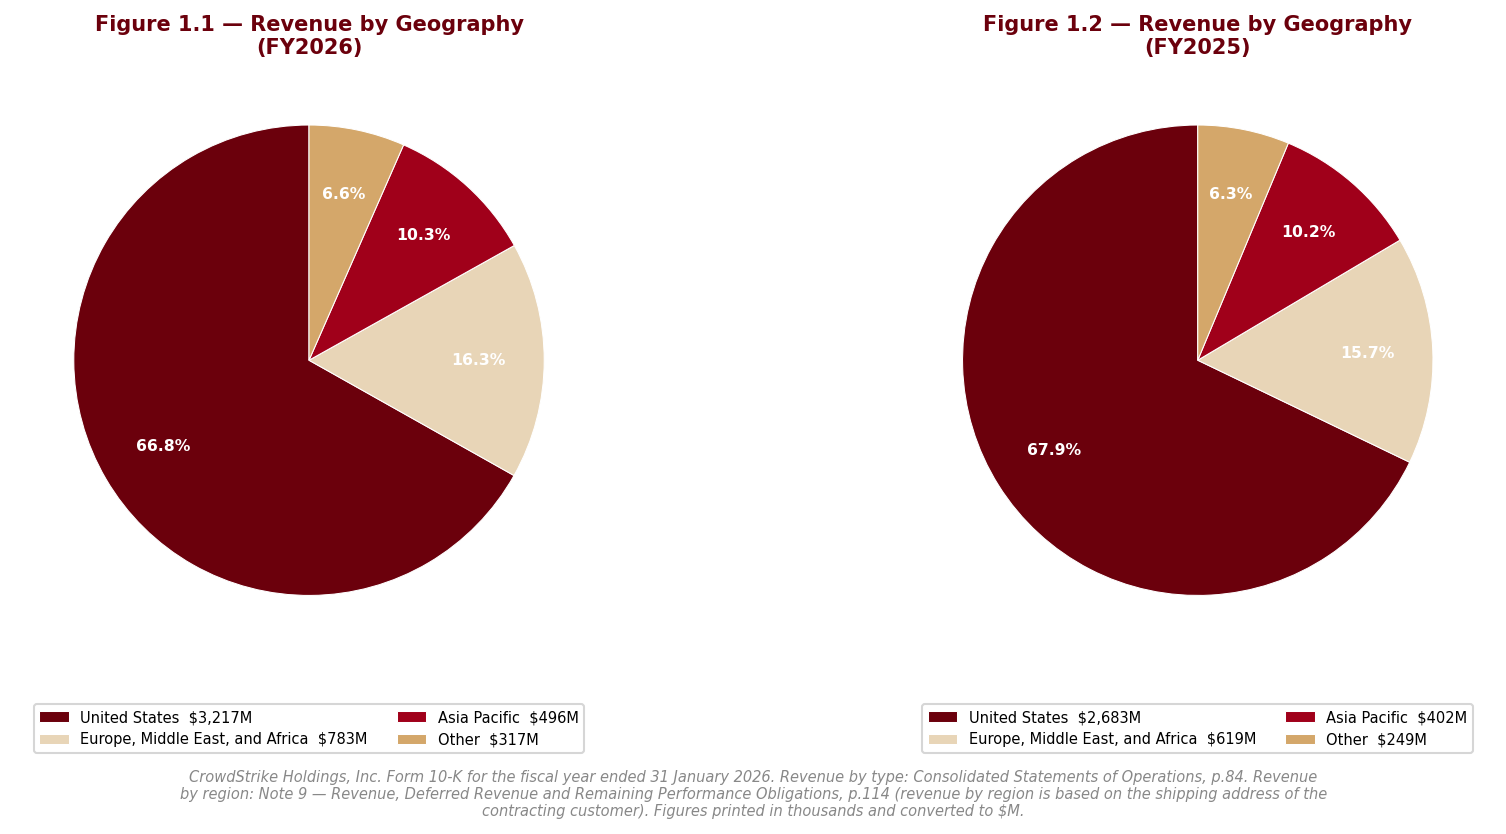
1.3 Geographic Exposure
sources CrowdStrike is a U.S.-centric business expanding internationally, with the United States its single largest market and the balance spread across Europe, the Middle East, Africa and Asia-Pacific; the precise split and its trend belong in the benchmarking discussion. The currency posture is distinctive and worth flagging here: the large majority of customer contracts are denominated in U.S. dollars, so reported revenue carries limited direct FX translation risk, while a growing share of the cost base — headcount and operations outside the United States — is incurred in local currencies. The practical consequence is an asymmetry: currency moves show up more in expenses and margin than in the top line. International expansion also imports data-localization, digital-sovereignty and cross-border data-transfer requirements that raise compliance cost and, for a security vendor handling sensitive telemetry, carry above-average regulatory sensitivity; the detail sits in Section 2.
1.4 Management Team
sources The team’s centre of gravity is co-founder George Kurtz, President, Chief Executive Officer and a director since inception, whom the company itself describes as the person it is highly dependent upon for vision and strategic direction. That is the defining leadership characteristic: a founder-led franchise with a clear architect, and a correspondingly concentrated key-person risk that the filing does not soften. Burt Podbere serves as Chief Financial Officer and Michael Sentonas, previously Chief Technology Officer, is President — a bench that is credible but visibly organized around the founder. §
The most telling recent management action is strategic posture rather than personnel. In May 2025 the company announced a “Strategic Plan” involving a reduction of roles across the global workforce and efficiency actions, substantially completed by year-end — a deliberate shift from growth-at-all-costs toward “focus and discipline” as the business scales. Read charitably, that is a maturing operator taking cost out; read critically, it is an acknowledgement that the prior spending trajectory was not self-sustaining. Two governance matters that bear directly on how much to trust management’s reported numbers — a multi-year stock-compensation timing revision corrected late in the year, and the federal inquiry into revenue and ARR reporting — are material enough to belong to the risk assessment and are handled in full in Section 2.
1.5 Capital Allocation Track Record
sources CrowdStrike has never declared or paid a cash dividend and states it does not intend to, retaining all funds to operate and grow the business. Capital returns are therefore not yet a track record at all. The board authorized a share-repurchase program in June 2025, during fiscal 2026, but no shares were repurchased during the fiscal year — the first purchases under the program were made after the 31 January 2026 year-end, and are disclosed as a subsequent event in the FY2026 10-K. The repurchase line is therefore empty in every year in the table below, and the reader should treat buybacks as an announced intention whose execution begins in fiscal 2027, not as capital that has been returned. Capital expenditure is modest in the classic sense — this is an asset-light software model — but that understates the true capital commitment, because the platform’s real infrastructure obligation is carried off the balance sheet as multi-billion-dollar, multi-year non-cancelable cloud and data-center purchase commitments rather than as owned property; that obligation is quantified in Section 3.
| Year | Dividends Paid ($M) | Share Repurchases ($M) | CapEx ($M) |
|---|---|---|---|
| FY2022 | — | — | $133.0M |
| FY2023 | — | — | $264.1M |
| FY2024 | — | — | $226.0M |
| FY2025 | — | — | $313.8M |
| FY2026 | — | — | $370.9M |
Source: CrowdStrike 10-K FY2026, consolidated statements of cash flows and stockholders’ equity; prior-year 10-Ks. Tier 1.
The signal in the mix is consistent with the story elsewhere in this report. With no dividend and no repurchases yet executed, the total shareholder-return yield for fiscal 2026 is 0.0% — nil. [Rating and price target withdrawn — see the note at the top.] When the buyback does begin to run, it should be read primarily as an offset to stock-based-compensation dilution rather than as clean capital return — the authorized program is small relative to the annual equity grant, so it is a brake on share-count growth, not a reduction of it (developed in Section 3). Growth capital, meanwhile, is deployed less through CapEx than through acquisitions and through the committed cloud spend noted above; the dividend-payout ratio is not a meaningful figure for a company that pays no dividend, and is left blank rather than shown as zero. The net read: management is confident enough to begin returning cash, but the return is small relative to the equity it hands to employees, and the heavier “capital allocation” decision is the fixed, multi-year infrastructure commitment it is locking in as growth decelerates.
1.6 Competitive Positioning & Moat
sources §1.6.1 Industry structure. Endpoint and cloud security is a large, still-expanding market in which returns accrue to vendors that can consolidate multiple point products onto one platform, embed themselves in the customer’s security operations, and earn multi-year recurring revenue with high retention. It is also intensely competitive and fast-moving: legacy antivirus incumbents, next-generation endpoint rivals, network- and cloud-security vendors extending into the endpoint, identity specialists and, increasingly, the large platform vendors that can bundle security into broader enterprise suites all compete for the same budget. Winners are decided less on any single detection feature than on breadth of platform, efficacy, time-to-value and switching cost.
§1.6.2 Competitive advantages. CrowdStrike’s moat is genuine and rests on three supported pillars. First, switching costs: the single-sensor, single-data-model architecture means that once a customer standardizes on Falcon and activates multiple modules, replacing it requires re-tooling security operations rather than swapping one product — the mechanical basis for the high dollar-based net retention management reports. Second, platform breadth and pricing power: the ability to sell a growing catalogue of modules through one sensor produces a gross margin of 74.7%, near the top of the software universe and direct evidence that customers pay for the platform rather than commoditized point tools. Third, distribution and trust assets: a partner-first channel through which the majority of sales flow, plus public-sector credentials (FedRAMP authorization and a Department of Defense provisional authorization) that are slow for competitors to replicate and that anchor a sticky government vertical.
§1.6.3 Competitive vulnerabilities. Three erosions are live. The most acute is trust: the moat’s foundation is a reputation for high-efficacy, reliable security, and the July 2024 global outage — caused by CrowdStrike’s own sensor update — struck precisely that foundation, lengthening sales cycles and inviting competitors to target the installed base (Section 2). The second is competitive bundling: better-resourced platform vendors can embed comparable security into suites customers already own and underprice on a standalone basis, a structural pressure on both new-logo economics and renewal pricing. The third, and most specific to the equity, is that the very metric underpinning the expansion narrative — ARR — is the subject of an open U.S. Department of Justice and Securities and Exchange Commission inquiry into how revenue and ARR are recognized and reported for certain customers, and subscription revenue recognition is the auditor’s sole Critical Audit Matter. When the metric that “proves” the flywheel is itself under regulatory examination, the moat narrative cannot be taken entirely at face value; Section 2 treats this as the report’s foremost governance risk.
§1.6.4 Verdict. The competitive position is strong and the gross-margin moat is durable: switching costs, platform breadth and public-sector credentials are real and not easily dislodged, and the roughly three-quarter gross margin is unlikely to erode materially absent sustained price war. The unresolved question is not gross-margin durability but whether that advantaged gross margin converts into durable GAAP operating profit — and here the honest answer is that it currently does not, with the operating margin -6.1% held below the line chiefly by very large, recurring stock-based compensation. The moat protects revenue quality and gross profitability; it does not, on the present cost structure, protect reported operating returns. That distinction — a high-quality top line whose translation to owner earnings is compromised by equity issuance and now shadowed by a revenue-recognition inquiry — is the analytical hinge of the entire thesis, and it is why the quality of the business and the attractiveness of the stock point in opposite directions.
Section 2 — Key Risks & Catalysts
2.1 Downside Risks
sources The risk that dominates CRWD is not demand, competition, or the balance sheet — those are real but manageable. It is the integrity and durability of the numbers the market values the company on. CrowdStrike is a franchise whose headline growth metric is under active federal examination, whose reported path to profitability is being helped by a non-economic accounting change enacted at exactly that moment, and whose brand still carries the long tail of a self-inflicted global outage. This is a governance-and-earnings-quality risk profile wrapped around an otherwise excellent business, and it is why the quality of the enterprise and the safety of the equity point in opposite directions.
Risk 1 — Open U.S. DOJ and SEC inquiry into revenue recognition and ARR reporting (RED forensic flag)
sources This is the single most important interpretive risk in the file, and it is unambiguously a RED flag. The company discloses that both the U.S. Department of Justice and the Securities and Exchange Commission have requested information relating specifically to how it recognizes revenue and reports Annual Recurring Revenue (ARR) for transactions with certain customers, alongside July 19-related matters. Two features make this far more serious than a routine regulatory request. First, the subject is the exact metric on which the entire equity story rests: ARR is the number management leads with, it is the analytical proxy for the “flywheel,” and subscription revenue recognition is simultaneously the auditor’s sole Critical Audit Matter — so the audit’s single flagged area of highest judgment and the government’s area of inquiry are the same area. Second, the disclosure escalated sharply year over year: the prior-year 10-K named no agency and no subject matter, referring only to unspecified “governmental authorities”; the current filing names DOJ and SEC and specifies the revenue-and-ARR subject. That vague-to-specific progression is the opposite of a matter winding down. The inquiry remains open, with identical language, in the most recent quarterly filing. No amount is accrued and management states any loss is not reasonably estimable — which means an analyst cannot bound the downside. The compounding concern is that ARR is itself a soft, judgment-laden metric (it captures contracts under negotiation after expiration until a customer affirmatively declines to renew), which is precisely the kind of definitional latitude such an inquiry would probe. An adverse finding would not merely produce a fine; it would call into question the reliability of the growth signal underpinning the valuation.
Probability: Medium (inquiry is confirmed and live; an adverse enforcement outcome is uncertain) | Timeframe: Immediate / 1–2 years | Quantified potential impact: Not estimable by design — management establishes no accrual and characterizes any loss as not reasonably estimable. The larger risk is not the cash penalty but a forced restatement or re-presentation of ARR, which would strike the valuation multiple rather than a single line item.
Risk 2 — The July 19 incident’s long commercial and legal tail, with Delta the one material suit still live
sources On July 19, 2024 a faulty Falcon sensor content-configuration update crashed Windows systems globally. Two years on, the litigation picture has materially cleared but is not closed, and getting the distinction right matters. The putative securities class action was dismissed and the judgment became final with no appeal; the consolidated airline-passenger class action was dismissed at the district court and that dismissal was affirmed by the Fifth Circuit in May 2026; and the multiple shareholder derivative suits were dismissed across federal and Delaware courts by early 2026. What remains live is the Delta Air Lines action, filed in Georgia state court, alleging computer trespass, breach of contract, fraud by omission, strict-liability product defect and gross negligence and seeking unspecified compensatory and punitive damages. CrowdStrike’s motion to dismiss was granted in part and denied in part, and discovery is ongoing — the matter has advanced rather than receded. Delta is a large, well-resourced counterparty whose claims survived dismissal in part; a settlement or adverse judgment is a genuine, entirely unquantified tail risk, unaccrued and not reasonably estimable, and thematically linked to the same July 19 events that underlie the DOJ/SEC inquiry. §
Alongside the litigation runs a slower commercial drag that is easy to overlook because it never appears as a discrete charge. Management states it has experienced delays in creating sales opportunities and longer sales cycles, and that the “commitment packages” offered to retain customers after the incident — discounts, additional modules, professional services, flexible payment terms and subscription-period extensions — have resulted, and are expected to continue to result, in increased contraction from elongated subscription terms and lower upsell values. In substance these are embedded price concessions that suppress ARR growth and dollar-based net retention over multi-year terms. Separately, discrete customer-settlement offers are recorded as customer payables fully offset by insurance receivables, so they have zero net income-statement impact — which can make the reported P&L look cleaner than the underlying customer economics. The headline retention metric (quantified in Sections 3 and 5) is therefore being reported net of a drag management expects to persist.
Probability: High for the commercial drag (management states it is ongoing and expected to continue); Medium for a material Delta outcome | Timeframe: Immediate (commercial drag) to 1–2 years (Delta resolution) | Quantified potential impact: The Delta exposure is unbounded and unaccrued; the commitment-package drag is not separately quantified but is described as a persistent suppressant of net-new ARR and upsell — a headwind to the growth line rather than a one-time cost.
Risk 3 — Commission-amortization change flatters margin without economic substance, amid a broader earnings-quality question (RED forensic flag)
sources Effective the coming fiscal year, management lengthened the assumed period of benefit for capitalized sales commissions from four years to five years. The mechanism is worth stating plainly because its effect is entirely presentational. When a company pays a sales commission it does not expense it all at once; it capitalizes the cost as an asset and spreads the charge over an estimated benefit period. Stretching that period over more years lowers the amount expensed in each year — reducing a sales-and-marketing cost, and therefore lifting reported operating margin — without any change in cash paid, in the commissions themselves, or in the underlying customer economics. On a large capitalized-commission base, the effect is meaningful; the most recent quarterly filing quantifies a material single-quarter reduction in commission expense (the figure is carried in Sections 3, 6 and 7), and the company swung toward profitability in that quarter. This is a RED flag not because a four-to-five-year period is indefensible — for a business with genuine multi-year retention it is arguable on its face — but because of the timing. The change lands exactly as the company pushes toward reported profitability and precisely while regulators are asking about revenue and ARR. We do not allege impropriety; we state the fact, the effect and the timing, and note the analytical consequence: a meaningful portion of any forward margin improvement will come from this estimate change rather than operating leverage, and it must be stripped out before management is credited with margin expansion (Section 3 do exactly that).
Two related earnings-quality items sit within the same governance frame. First, a stock-based-compensation timing error — a mechanical attribution mistake spanning awards granted several years earlier — was identified only in the fourth quarter of the year and required a revision of prior-period comparatives; management and the auditor nonetheless concluded internal control over financial reporting was effective, with no deficiency disclosed and a clean auditor opinion. In dollars the revision is genuinely immaterial and non-cash (a reclassification within equity, no cash-flow effect), and we present it at that weight. The forensic point is narrower: a mechanical error persisted undetected for several years, which is a legitimate watch item on the precision of SBC controls given how large stock-based compensation is at this company. Second, that scale matters in its own right — stock-based compensation is the principal reason the business reports a GAAP operating and net loss despite a gross margin near the top of the software universe, and no shares had been repurchased at all through the fiscal year — the programme was authorized in June 2025 but first executed after the year-end — so nothing has yet offset that dilution (developed in Section 3).
Probability: High that the estimate change flatters reported margin (it is enacted and already quantified); Low that the SBC revision reflects a genuine control deficiency | Timeframe: Immediate | Quantified potential impact: The margin benefit is real in reported terms but non-economic; the analytical impact is to reduce trust in headline profitability, not to change cash flows. Figures are carried in Sections 3, 6 and 7.
Risk 4 — Competitive bundling and pricing pressure from larger platform vendors
sources The market is intensely competitive, fragmented and fast-changing, and the most structural competitive threat is not a better point product but a larger vendor’s ability to bundle. Several competitors carry greater financial, technical and marketing resources, broader product lines and larger installed bases, and can embed comparable security capability into enterprise suites customers already license — then underprice CrowdStrike on a standalone basis. That pressure hits both new-logo economics and renewal pricing, and it is amplified precisely when a customer is already reconsidering the relationship after the July 19 incident. Competitors have, per management, aggressively targeted the installed base. The financial channel through which this shows up is gross margin and net-new ARR: sustained discounting or bundling would compress the platform’s premium pricing and slow expansion. The offset is CrowdStrike’s genuine single-platform switching cost — ripping out a standardized, multi-module Falcon deployment means re-tooling a security operation, not swapping one tool — but bundling attacks the new-logo and marginal-module decision, where switching cost is weakest.
Probability: Medium | Timeframe: 1–2 years and ongoing | Quantified potential impact: Not separately quantifiable; would manifest as gross-margin compression and decelerating net-new ARR rather than as a discrete event.
Risk 5 — Concentration: a single agent, a single founder, and a rising vendor-financing book
sources CrowdStrike’s greatest architectural strength is also its most concentrated failure point. The entire platform runs off one lightweight sensor and one data model; that is the source of the moat and of the operating leverage, but it is also why a single flawed content update could take down customers worldwide — as July 19 demonstrated — and management explicitly cites the incident as an example of the defect risk inherent in the model. A comparable concentration exists in leadership: the company describes itself as highly dependent on co-founder and CEO George Kurtz for its vision and strategic direction, an at-will, founder-centric structure in which a leadership transition would be genuinely disruptive. A third, smaller concentration is building in the customer-financing book: the company extends multi-year financing so certain end-users can buy its own products, the receivable balance has grown sharply, and a meaningful share sits with a small number of end users. [Rating and price target withdrawn — see the note at the top.]
Probability: Low for a single catastrophic agent failure in any given year, but High-consequence if it occurs; Medium for key-person disruption over the horizon | Timeframe: Immediate (agent/technical) to 3–5 years (succession) | Quantified potential impact: A repeat sensor-level failure would be reputationally and commercially severe and hard to bound; key-person loss is qualitative but named by management as capable of harming the business.
2.2 Upside Catalysts
sources Honesty about asymmetry is required here: this is a five-risk, three-catalyst situation, and the catalysts are weaker in kind than the risks. The dominant potential positives are not fresh sources of value but the removal of overhangs the company created for itself — and the single largest of them is a binary regulatory outcome outside management’s control. [Rating and price target withdrawn — see the note at the top.]
Catalyst 1 — Clean resolution of the DOJ/SEC inquiry
[Rating and price target withdrawn — see the note at the top.] Because that overhang currently caps how much credit the market can extend to the headline growth metric, a closure — a declination, or a resolution that leaves ARR and revenue recognition intact — would release a discount the equity is carrying today. It is genuinely two-sided: the same event resolved unfavorably is Risk 1 materializing. That is why it is a catalyst and a risk simultaneously, and why it sits at the top of both lists.
Probability: Low-to-Medium within the horizon (government timelines are unpredictable) | Timeframe: 1–2 years | Monitoring trigger: Any disclosed movement — a Wells notice, a subpoena, a formal order, an accrual replacing “not estimable,” or an announced closure/settlement. Movement in either direction is decision-relevant.
Catalyst 2 — A durable, correctly-sourced margin and free-cash-flow inflection
sources Management’s May 2025 Strategic Plan — a workforce reduction and efficiency drive, substantially complete by year-end — signals a deliberate turn from growth-at-all-costs toward “focus and discipline,” and genuine operating leverage on a gross margin near the top of the peer group could convert into sustained GAAP profitability and free-cash-flow expansion. The essential caveat, and the reason this is a qualified catalyst, is that part of the near-term margin lift is the non-economic commission-amortization change of Risk 3. The catalyst is real only to the extent the improvement survives once that benefit is stripped out; a margin inflection sourced from operating leverage is a catalyst, one sourced from the estimate change is not.
Probability: Medium | Timeframe: 1–2 years | Monitoring trigger: GAAP operating margin excluding the estimate-change benefit; the trajectory of stock-based compensation as a share of revenue; free-cash-flow conversion net of committed cloud spend.
Catalyst 3 — Net-new ARR reacceleration as the July 19 drag rolls off
sources As post-incident commitment packages age out of the base and sales cycles normalize, net-new ARR and dollar-based net retention could reaccelerate — supported by the structural tailwind of platform consolidation, continued module cross-sell (including the Charlotte AI agentic capability), and public-sector expansion behind FedRAMP and Department of Defense authorizations that are slow for competitors to replicate. This is the cleanest operationally-driven catalyst because it does not depend on an accounting change or a regulator; it depends on the franchise doing what it has historically done well once a self-inflicted headwind fades.
Probability: Medium | Timeframe: 1–2 years | Monitoring trigger: Stabilization then improvement in dollar-based net retention (Sections 3 and 5); shortening sales cycles; net-new ARR reacceleration; module-count expansion per customer.
Catalyst 4 (optional) — Contained resolution of Delta and full close-out of July 19 litigation
A settlement of the Delta action at a manageable figure, or its dismissal, would remove the last material private-litigation tail from the incident and complete the legal clean-up already achieved on the securities, airline and derivative suits. §
Probability: Medium | Timeframe: 1–2 years | Monitoring trigger: Summary-judgment rulings, an emerging damages theory, or a disclosed settlement.
2.3 Risk & Catalyst Summary
| # | Item | Type | Probability | Timeframe | Status | Monitoring Trigger |
|---|---|---|---|---|---|---|
| 1 | DOJ/SEC inquiry into revenue recognition and ARR reporting (RED) | Risk | Medium | Immediate–2yr | Active | Wells notice, subpoena, accrual, or closure |
| 2 | July 19 long tail — Delta litigation live; commitment-package commercial drag | Risk | High (drag) / Medium (Delta) | Immediate–2yr | Active | Delta rulings/settlement; sales-cycle and retention trend |
| 3 | Commission-amortization change flattering margin; SBC controls watch (RED) | Risk | High | Immediate | Active | GAAP margin ex-estimate-change; further out-of-period corrections |
| 4 | Competitive bundling and pricing pressure from larger platform vendors | Risk | Medium | 1–2yr+ | Monitoring | Gross-margin trend; net-new ARR; discounting intensity |
| 5 | Concentration — single agent, single founder, growing vendor-financing book | Risk | Low-freq/High-impact | Immediate–5yr | Latent | Sensor-reliability events; succession signals; financing-book growth |
| 6 | Clean resolution of the DOJ/SEC inquiry | Catalyst | Low–Medium | 1–2yr | Active | Declination, closure, or settlement without ARR/revenue re-presentation |
| 7 | Durable margin/FCF inflection sourced from operating leverage | Catalyst | Medium | 1–2yr | Monitoring | GAAP margin ex-estimate-change; SBC-to-revenue; FCF conversion |
| 8 | Net-new ARR reacceleration as July 19 drag rolls off | Catalyst | Medium | 1–2yr | Monitoring | Dollar-based net retention; sales-cycle length; module cross-sell |
Source: Company SEC filings (10-K) and forensic footnote review; see Appendix A.1.
2.4 Risk Interdependencies
sources These risks are not independent; the danger is the way they reinforce one another around a single fault line — the credibility of the growth metric. The DOJ/SEC inquiry (Risk 1), the commission-amortization change (Risk 3) and the commitment-package drag inside the July 19 tail (Risk 2) all bear on the same question: how much of the reported revenue, ARR and margin trajectory reflects clean operating performance. Consider the adverse combination. The commission change lifts reported margin at the exact moment regulators are examining revenue and ARR; if that inquiry were to conclude that ARR for certain customers was overstated, the market would simultaneously lose confidence in the growth metric and in a profitability improvement that was partly cosmetic — a double blow to the two pillars of the valuation, arriving together. The vendor-financing book (Risk 5) sharpens this: financed deals are exactly where revenue-timing and ARR-inclusion judgments are most sensitive, so a growing, concentrated financing book is a channel through which a revenue-quality problem could propagate. Layer competitive bundling (Risk 4) on top — which pressures pricing and retention precisely as post-incident customers reconsider — and a growth deceleration becomes more likely just as the multi-billion-dollar, multi-year cloud and data-center purchase commitments (quantified in Section 3) lock in a fixed cost base that assumes continued expansion. The single most damaging scenario is therefore not any one risk in isolation but the correlated one: an adverse regulatory signal on ARR, an operating-margin picture revealed to lean on an estimate change, and decelerating net-new ARR, all surfacing while committed cloud spend cannot be scaled back. Each of these is individually survivable; together they would compress both the growth narrative and the profitability narrative at once, which is the specific combination this equity’s premium cannot absorb.
2.5 ESG & Regulatory Exposure
sources For a cybersecurity vendor, the “S” and “G” in ESG carry more weight than the “E,” and the governance items here are specific rather than generic. On governance, three disclosures stand out. First, the earnings-integrity cluster already detailed — the DOJ/SEC revenue-and-ARR inquiry and the commission-amortization estimate change — is fundamentally a governance and disclosure-quality question, not merely a legal one. Second, the multi-year stock-based-compensation timing error revised late in the year, corrected with a clean controls conclusion, is a precision-of-controls watch item precisely because stock-based compensation is so large relative to earnings. Third, the company sponsors and consolidates the Falcon Funds — venture vehicles co-invested with entities associated with Accel, a party historically connected to CrowdStrike’s board and major-holder base — which give the company early stakes in start-ups it may later acquire; it did exactly that with a post-quarter acquisition of a fund portfolio company, recognizing an accounting remeasurement gain on its previously held interest. The volume is currently small and the structure is disclosed and consolidated, so this is not evidence of value extraction, but it is a related-party acquisition channel that can generate accounting gains on buy-out, and an analyst should review the 2026 proxy (Item 13) for the full related-party terms, which are incorporated by reference and not contained in the 10-K itself. Serial acquisitions also pool a growing goodwill balance into a single reporting unit tested for impairment only qualitatively — a coarse screen that can delay recognition of a problem at any one acquired business, worth watching as management itself flags decelerating growth (Section 3).
Anti-takeover governance is entrenched: a classified board, blank-check preferred stock, restrictions on stockholder action, advance-notice requirements and exclusive-forum provisions collectively limit stockholders’ ability to force change or choose a litigation forum. §
On the regulatory side, exposure is broad and rising in ways specific to this business. The company must comply with a stringent, fragmented and evolving web of global data-privacy and security law — EU and U.K. GDPR, CCPA and a proliferation of state and international regimes — with continuing uncertainty over cross-border data transfers, an acute sensitivity for a vendor whose product is the collection and analysis of sensitive customer telemetry. It is directly in the path of emerging rules targeting AI (it cites the EU AI Act and various U.S. state laws), critical-infrastructure software resiliency, digital sovereignty and concentration risk — the last two of which cut against a single-vendor, single-agent security model. Its products and threat-intelligence work are subject to U.S. export-control and sanctions regimes and foreign encryption-import rules, and its international expansion and partner/agent model create anti-corruption exposure under the FCPA and U.K. Bribery Act. Government sales, a growth pillar, bring their own regulatory dependency — FedRAMP and Department of Defense certification, procurement disputes, audits and shifting political priorities. On the environmental dimension, the direct footprint is modest for an asset-light software model, but management notes that evolving and sometimes contradictory sustainability-disclosure expectations impose incremental cost and legal risk, and that its choices on such initiatives can themselves draw scrutiny from one stakeholder group or another. The net ESG read is that this is a governance-and-regulatory story, not an environmental one, and the governance items overlap precisely with the earnings-integrity risks that anchor the whole section.
Section 3 — Financial Analysis & Historical Performance
sources Three-Statement Linkage Confirmation. The three statements reconcile at the model level. Net income ties: the cash-flow statement begins from the same net loss reported on the income statement, which is then bridged to operating cash flow chiefly by adding back stock-based compensation and depreciation and amortization — the single largest reconciling item, and the crux of this section. Cash ties: ending cash and equivalents on the balance sheet agrees with the closing cash balance on the cash-flow statement. Retained-earnings reconciliation: the accumulated-deficit roll-forward (beginning deficit plus net income or loss equals ending deficit) holds cleanly in FY2024 and FY2025; in FY2026 the opening accumulated-deficit balance carries an adjustment for the stock-based-compensation timing revision described below (Note 16), a within-equity reclassification between additional paid-in capital and accumulated deficit that has no cash effect and does not disturb the cash or net-income linkages.
A note on basis before the numbers. Every figure in this section is presented as originally reported for its fiscal year. In the fourth quarter of FY2026 the company revised prior-period results for a stock-compensation attribution error (graded rather than straight-line) affecting awards granted in FY2022 and FY2023; FY2024 net income, first reported materially higher, was revised down, and FY2025 was also revised. We deliberately retain the as-first-reported figures rather than splicing revised values into a two-year window while earlier years remain on the original basis — doing so would double-count compensation that the revision merely shifted between periods. The restatement is immaterial in dollars, non-cash, and confined to a reclassification within equity; a reader should be aware of it, not alarmed by it. Balance-sheet history is shown from FY2022 onward only: prior years predate the June 2019 IPO, when redeemable convertible preferred stock sat in mezzanine equity outside both liabilities and permanent equity, leaving book equity negative and every book-based ratio meaningless. Per-share and share-count figures are stated on a consistent split-adjusted basis (a four-for-one forward split took effect after year-end).
3.1A Income Statement
Source: CrowdStrike 10-K FY2026, consolidated statements of operations; prior-year 10-Ks. Tier 1. Figures as originally reported. Margins, growth rates and EBITDA are analyst-computed (underlined). Basis note: pre-tax income and the tax provision are CONSOLIDATED figures, while net income is the amount ATTRIBUTABLE TO CROWDSTRIKE. The two therefore do not foot exactly: the residual in each year is net income attributable to the noncontrolling interest in the Falcon Fund entities (Section 2, related parties), a small consolidated-but-not-owned share that the company reports as a separate line and this model does not carry as its own row.
CAGR Summary
| Metric | 3Y CAGR | 5Y CAGR | 10Y CAGR |
|---|---|---|---|
| Revenue | 29.0% | 40.6% | - |
| EBITDA | - | - | - |
| Net Income | - | - | - |
| Free Cash Flow | 22.4% | 33.5% | - |
Source: Company SEC filings (10-K); figures per the FL model — see Appendix A.1–A.2. CAGRs are analyst-computed (underlined).
3.1B Income Statement — Analysis
sources The central tension, resolved up front. This income statement tells two opposite stories about the same company, and a reader is owed a clear statement of which one to believe. On a GAAP basis the business is loss-making and getting worse: operating income was -$293.3M in FY2026 — a negative -6.1% operating margin — and it has deteriorated for two consecutive years from the near-breakeven -$2.0M of FY2024 through -$120.4M in FY2025. Yet the same company generated $1,241.5M of free cash flow at a 25.8% margin (Section 3.3). The entire bridge between the two is stock-based compensation, which reached $1,096.7M in FY2026 — comfortably more than a fifth of revenue and larger than the gross-profit shortfall that produces the operating loss. We rely on free cash flow, not GAAP operating income, as the primary measure of this business’s economic output — but with an explicit and permanent haircut for stock compensation. The logic runs both ways and both corrections matter: GAAP understates cash generation because it charges a large non-cash expense, so a bare reading of the operating loss is misleading; but free cash flow overstates distributable economics because it adds that expense back, and stock compensation is a real, recurring cost that transfers ownership from shareholders to employees year after year. The defensible number sits between the two — free cash flow less a full charge for equity issued — and that is the lens the separate valuation carries into valuation. What we will not do is credit management with either the flattering cash figure taken at face value or dismiss the business on the GAAP loss alone.
Two facts keep the resolution honest. First, the deterioration is not purely a stock-compensation artifact: measured before stock compensation, the operating margin also peaked in FY2024 and has receded in each of the two years since, because operating expenses reaccelerated relative to gross profit after that year. So there is genuine operating deleverage underneath the SBC add-back, not merely a larger non-cash line. Second, “EBITDA” as shown here — -$11.8M in FY2026 — is barely distinguishable from zero precisely because it does not add back stock compensation; it is EBIT plus depreciation only. The gap between that near-zero EBITDA and the $1,241.5M of free cash flow is, once again, the SBC line. The reader should treat the company’s own “adjusted” profitability, which adds SBC back, as the mirror image of this same adjustment — and discount it accordingly.
The revenue story — deceleration is the headline. The single most important fact on this page is not the level of growth but its trajectory. [Rating and price target withdrawn — see the note at the top.] Growth is still enviable in absolute terms and overwhelmingly subscription and recurring in nature, expansion-led within the installed base rather than one-time. But an uninterrupted five-year deceleration is the most important single input to any terminal-value judgment, and it is running through a period in which management itself flags elongated sales cycles and post-incident “commitment packages” — embedded price concessions that it expects to keep suppressing net-new ARR and upsell over multi-year terms (Section 2). The headline growth is therefore reported net of a drag management says will persist, which argues for weighting the trend, not the level.
Margin structure — the moat is above the gross line; the problem is entirely below it. Gross margin has been remarkably stable in the mid-70s, from 73.6% to 74.7%, near the top of the software universe and direct evidence of pricing power and a genuine platform moat. Nothing in the cost of revenue is broken. The operating loss is manufactured entirely below the gross-profit line. After a real improvement in operating leverage that carried EBIT margin from -9.8% in FY2022 up to essentially breakeven in FY2024, the two years since have reversed it, because operating expenses — total opex excluding cost of revenue rose from $2,301.8M to $3,886.4M — grew faster than gross profit. Within that, research and development ($768.5M to $1,384.8M) and stock compensation ($631.5M to $1,096.7M) both outpaced gross-profit growth. The moat protects revenue quality and gross profitability; on the current cost structure it does not protect reported operating returns.
Major movers.
- Stock-based compensation. The dominant driver, at $1,096.7M in FY2026 versus $310.0M in FY2022 — a faster ramp than revenue and the principal reason the company posts a GAAP operating and net loss despite a mid-70s gross margin. This is structural and recurring, not a one-off; it should be modeled as an ongoing cost and a dilution source, not adjusted away (forensic flag F004).
- The commission-amortization estimate change (RED flag F002). Effective FY2027, management lengthened the assumed period of benefit for capitalized sales commissions from four years to five. Mechanically this spreads a large capitalized asset over more years, lowering the sales-and-marketing charge and lifting reported operating margin with no change in cash paid or customer economics. It does not touch FY2026 results shown here, but it will flatter FY2027, and it lands exactly as the company pushes toward reported profitability and precisely while regulators are examining revenue and ARR. A meaningful portion of any forward margin improvement will therefore be presentational; the separate valuation strips it out before crediting operating leverage. [Rating and price target withdrawn — see the note at the top.] [Rating and price target withdrawn — see the note at the top.] The cause is a full valuation allowance against U.S. deferred tax assets (management’s own signal that near-term U.S. taxable profitability is not more-likely-than-not), with cash tax driven by foreign earnings, withholding and intercompany IP transfers. [Rating and price target withdrawn — see the note at the top.]
- Operating-expense reacceleration post-FY2024. The swing from near-breakeven EBIT in FY2024 back to -$293.3M in FY2026 reflects R&D and go-to-market spend, the May 2025 Strategic Plan restructuring, and the residual costs of the July 19 incident all landing in operating expense faster than gross profit grew. This is the item to watch for evidence of durable operating leverage.
Quality of earnings. Three qualifiers belong here. The FY2024 net income shown ($89.3M) is as originally reported and was subsequently revised down for the SBC-timing error (F003) — immaterial and non-cash, but a mechanical attribution mistake that persisted undetected for several years, a legitimate watch item on the precision of controls given how large SBC is. The auditor issued clean opinions on both the financials and internal control, with a single Critical Audit Matter — subscription revenue recognition (F013) — which is precisely the area both regulators are probing (Section 2) and where the commission estimate change operates; the audit’s flagged area of highest judgment and the report’s key forensic risks coincide. And reported ARR and dollar-based net retention are being supported through a period in which post-incident concessions simultaneously suppress them, while the settlement-offer mechanism is fully insurance-offset and never touches the P&L (F008) — so the earnings statement can read cleaner than the underlying customer economics.
⚠ Items to Watch. If gross margin slips below 74.7%, the platform-pricing thesis weakens and the one unambiguously strong part of this income statement is in question. If FY2027 operating margin improves but does so only to the extent of the commission-life benefit — i.e., no improvement once F002 is stripped out — management should not be credited with operating leverage. And if revenue growth decelerates below 21.7% while the committed cost base keeps rising, the gap between a fixed cost structure and a slowing top line becomes the central financial problem.
3.2A Balance Sheet
Source: CrowdStrike 10-K FY2026, consolidated balance sheets; prior-year 10-Ks. Tier 1. Net debt, ratios and book value per share are analyst-computed (underlined). Pre-IPO years excluded (mezzanine preferred renders book equity negative and non-comparable).
3.2B Balance Sheet — Analysis
sources Asset composition — cash-rich and asset-light, with acquisition goodwill the fastest-growing line. The balance sheet is dominated by cash: $5,230.1M of cash and equivalents at FY2026, close to half of $11,086.7M in total assets, alongside a receivables book of $1,361.8M and no inventory to speak of — the signature of a subscription software model. Property and equipment is modest at $976.3M and consists largely of capitalized internal-use software and data-center and leasehold assets rather than heavy plant. The line that is changing fastest, and that deserves scrutiny, is goodwill and intangibles, which more than tripled from $416.4M to $1,363.3M on a run of acquisitions (F009). Because all of that goodwill sits in a single reporting unit tested for impairment only qualitatively, an impairment at any one acquired business is unlikely to surface unless the whole company’s fair value falls below carrying value — a coarse screen that can delay recognition, and one to watch precisely because management is already flagging decelerating growth.
Leverage — there is effectively none, and this is not where the risk sits. The only funded debt is a single tranche of senior notes, carried at $745.5M and maturing in early 2029, against which the company holds far more cash — a net cash position of -$4,484.7M at FY2026, deepening every year (F014). Debt-to-equity is a trivial 0.2x. The Net Debt/EBITDA figures in the table (378.7x) are not meaningful and should be disregarded: with EBITDA hovering around zero and net debt deeply negative, the ratio is arithmetic noise. The substantive fact is the large, growing net-cash pile and the absence of any maturity wall or covenant pressure. Balance-sheet and refinancing risk in this name is negligible; the risk lives in the income statement and in governance, not here. Two off-balance-sheet items do belong in the credit picture, however: multi-billion-dollar, multi-year non-cancelable cloud and data-center purchase commitments — a fixed cash obligation regardless of revenue, with a further large commitment added after year-end (F006) — and a growing, concentrated vendor-financing book with off-balance-sheet unfunded loan commitments (F011). Neither threatens solvency given the cash position, but the committed cloud spend reduces flexibility if growth decelerates, and both deserve to sit in any FCF-durability assessment.
Working capital — the one genuine watch item, read honestly. Reported current liabilities of $4,184.2M are dominated by deferred revenue — prepaid subscriptions that are a source of float, not a claim requiring cash — so the 1.8x current ratio understates true liquidity rather than signaling strain. The item that warrants attention is receivables. Days sales outstanding has drifted up from 76 days to 94 days over the window, and FY2023 in particular saw receivables grow materially faster than revenue — the classic aggressive-revenue-recognition signature, and one we take seriously precisely because the DOJ and SEC are asking about revenue recognition and ARR (Section 2), and because a growing, concentrated vendor-financing book is exactly where revenue-timing judgments are most sensitive (F011). The honest counter-evidence matters just as much: the FY2023 jump was a single-year step, not the start of an accelerating trend. In the years since, receivables growth has broadly tracked revenue and DSO has drifted up only gradually rather than spiking again, so the FY2023 signature did not recur. We flag the receivables build and the financing-book growth as watch items, not as evidence of a present problem — but they are the two places on this balance sheet where the revenue-quality question of Section 2 could first show up in the numbers.
⚠ Items to Watch. A renewed acceleration in receivables or DSO beyond the current 94 days, outrunning revenue growth the way FY2023 did, would move the vendor-financing and revenue-recognition concern from watch to active. A qualitative goodwill-impairment conclusion that persists while acquired-unit growth disappoints would be an early warning on capital deployed through M&A. Leverage is not a threshold to watch here; net cash makes it a non-issue.
3.3A Cash Flow Statement
| FY2022 | FY2023 | FY2024 | FY2025 | FY2026 | |
|---|---|---|---|---|---|
| Cash from Operations ($M) | $574.8M | $941.0M | $1,166.2M | $1,381.7M | $1,612.3M |
| — Depreciation & Amortization ($M) | $68.8M | $93.8M | $145.3M | $214.0M | $281.5M |
| — Stock-Based Compensation ($M) | $310.0M | $526.5M | $631.5M | $865.4M | $1,096.7M |
| Capital Expenditures ($M) | $133.0M | $264.1M | $226.0M | $313.8M | $370.9M |
| Free Cash Flow ($M) | $441.8M | $676.9M | $940.2M | $1,067.9M | $1,241.5M |
| FCF Margin | 30.4% | 30.2% | 30.8% | 27.0% | 25.8% |
| FCF / Share | $0.49 | $0.73 | $0.96 | $1.09 | $1.24 |
| FCF Conversion (FCF/NI) | -188.1% | -369.4% | 1052.6% | -5541.5% | -764.0% |
| CapEx / Revenue | 9.2% | 11.8% | 7.4% | 7.9% | 7.7% |
| CapEx / D&A | 1.9x | 2.8x | 1.6x | 1.5x | 1.3x |
| Dividends Paid ($M) | — | — | — | — | — |
| Share Repurchases ($M) | — | — | — | — | — |
Source: CrowdStrike 10-K FY2026, consolidated statements of cash flows; prior-year 10-Ks. Tier 1. Capital expenditures are defined as purchases of property and equipment plus capitalized internal-use software — the company reports these as two separate investing lines with no combined total; both are deducted because capitalized software is genuine capital investment for a software business and the company’s own free-cash-flow reconciliation deducts both. A source using only the PP&E line will show a higher free cash flow. FCF, margins, per-share and conversion figures are analyst-computed (underlined).
3.3B Cash Flow — Analysis
sources Operating cash flow is the real story, and it is high quality — with one caveat. Operating cash flow has risen every single year, from $574.8M to $1,612.3M, and free cash flow with it, from $292.9M to $1,241.5M — a 33.5% five-year CAGR. This is what makes the GAAP loss misleading if read alone. The caveat is the composition: the largest single item bridging the net loss to operating cash flow is the $1,096.7M stock-compensation add-back, which is a genuine economic cost. So the cash flow is real, but a portion of it is “earned” by paying employees in equity rather than cash — which is why we carry an SBC charge against it rather than banking the headline figure. Note also that the FCF/NI conversion ratios in the table (-764.0%) are meaningless and should be ignored: with GAAP net income negative or near zero, the ratio explodes and flips sign year to year. The conversion metric that is meaningful is FCF-to-revenue, and there the trend is mildly negative — the FCF margin has slipped from 30.4% to 25.8%, so cash generation is growing more slowly than revenue, not faster.
CapEx — rising investment, moderating intensity. Capital expenditure, defined here as property-and-equipment purchases plus capitalized internal-use software (see the table note), rose from $133.0M to $370.9M but has fallen as a share of revenue to 7.7%. CapEx/D&A of 1.3x still exceeds one — the company is investing ahead of depreciation, i.e. in growth mode rather than harvesting — but the multiple has come down from 2.8x in FY2023, consistent with a business past its steepest infrastructure build. The more consequential “capital commitment” is not on this line at all: it is the multi-billion-dollar, multi-year non-cancelable cloud and data-center purchase obligation carried off the balance sheet (F006), which is the true infrastructure spend for a business that rents rather than owns its compute.
Capital allocation — reinvestment and dilution offset, not shareholder return. Of the free cash flow generated across the window, essentially none went to dividends: the company has never paid one, and the dividends-paid line is empty in every year shown. Buybacks are equally absent from the historical record — the repurchase programme was only authorized in FY2026 and not executed until after the year-end. The dominant uses of capital are internal reinvestment and acquisitions (the goodwill build in Section 3.2). Critically, no shares were actually repurchased in any year shown: the programme was authorized in June 2025 but the first purchases were made after the FY2026 year-end. Across the whole window the diluted share count therefore climbed with nothing offsetting it — a 2.4% three-year CAGR to 1,002M shares. When the buyback does run it should be read as dilution management rather than clean capital return, because the authorization is small against the annual equity grant (F004). For a business with this growth opportunity set, prioritizing reinvestment over distributions is defensible; the honest framing is simply that the “capital return” line is really a dilution-management line.
⚠ Items to Watch. If the FCF margin continues to slide below 25.8%, cash generation is decoupling from revenue and the one clearly strong financial attribute is eroding. If the diluted share count keeps compounding above the current 2.4% pace despite buybacks, net dilution is outrunning the repurchase program and the buyback is failing even as a dilution offset. And a step-up in committed cloud spend against decelerating revenue would lock in fixed cost as the top line slows — the specific squeeze this business is most exposed to.
3.4 Returns Analysis
| FY2022 | FY2023 | FY2024 | FY2025 | FY2026 | |
|---|---|---|---|---|---|
| ROIC | - | - | - | - | - |
| ROE | -24.8% | -14.7% | 4.7% | -0.7% | -4.2% |
| ROA | -7.4% | -4.2% | 1.5% | -0.3% | -1.6% |
| Interest Coverage | - | - | - | - | - |
Source: Company SEC filings (10-K); figures per the FL model — see Appendix A.1–A.2. All figures analyst-computed (underlined).
ROIC is the metric that should anchor a long-term view, and here it cannot be struck on reported numbers. Because GAAP operating income is negative across the entire window, reported NOPAT is negative and ROIC is not meaningful — which is why the row resolves as not-applicable. The standard test — is ROIC above the cost of capital? — therefore cannot be run on GAAP figures, and any version computed on the reported operating loss would simply restate that the company does not yet earn a GAAP operating profit. The economically relevant return signal is the cash one: a free-cash-flow margin in the mid-to-high 20s (25.8% in FY2026) on a near-zero invested-capital base net of the large cash pile. Whether that cash return clears the cost of capital is the question the separate valuation (WACC) and the separate valuation (a normalized, SBC-charged cash view) take up; on GAAP operating returns alone, the answer today is that it does not. ROE and ROA tell the same story from the equity and asset side — ROE of -4.2% and ROA of -1.6% in FY2026, negative because the numerator is a net loss, not because the balance sheet is inefficient. Interest coverage is not a constraint in either direction: interest expense of $28.0M on the single small note tranche is trivially serviced out of $1,612.3M of operating cash flow and $5,230.1M of cash, whatever the reported coverage ratio shows.
DuPont decomposition — the problem is the margin, full stop. Decomposing FY2026 ROE of -4.2% into its parts isolates the driver cleanly: net margin of -3.4%, asset turnover of 0.49x, and an equity multiplier of 2.57x. Two of the three are benign — asset turnover is structurally low because the balance sheet is padded with cash, and the equity multiplier is modest, reflecting the near-absence of leverage. The entire negative ROE is driven by the negative net margin. In other words, this is not a returns problem created by weak asset productivity or by over- or under-leverage; it is a single-variable problem — profitability — and every path to a positive return runs through the net margin, which runs through operating expense and stock compensation. The swing factor and the level driver are the same line, which is exactly why the margin discussion above is the whole game.
3.5 Altman Z-Score (Most Recent FY)
| Component | FY2024 | FY2025 | FY2026 |
|---|---|---|---|
| X1 (Working Capital / Total Assets) | 0.310 | 0.305 | 0.292 |
| X2 (Retained Earnings / Total Assets) | -0.159 | -0.124 | -0.116 |
| X3 (EBIT / Total Assets) | 0.000 | -0.014 | -0.026 |
| X4 (Equity / Total Liabilities) | 0.535 | 0.609 | 0.670 |
| X5 (Revenue / Total Assets) | 0.460 | 0.454 | 0.434 |
| Z-Score | 0.93 | 0.97 | 0.94 |
| Zone | Distress | Distress | Distress |
Source: Company SEC filings (10-K); figures per the FL model — see Appendix A.1–A.2. Z-score components analyst-computed (underlined).
Read the Z-score as a false positive, not a distress signal. On its face the model places CrowdStrike in the distress zone every year, and the honest interpretation is that the Altman Z-score is simply the wrong tool for this balance sheet. The model was calibrated on manufacturers, and it misreads an asset-light, deferred-revenue, net-cash software company on three of its five inputs: the retained-earnings term (X2) is deeply negative because the company has funded years of growth with stock-compensation-driven GAAP losses that accumulate in the deficit; the EBIT term (X3) is negative for the same reason the operating margin is negative; and the working-capital term (X1) is depressed because deferred revenue — a customer prepayment, not a distress liability — inflates current liabilities. A model that reads deferred revenue as a claim and cumulative non-cash SBC as erosion of solvency will always score a company like this as distressed. The market-based inputs corroborate that this is a scoring artifact rather than a credit warning: equity coverage of total liabilities (X4) has in fact improved every year, from 0.535 to 0.670. The same caveat explains the pre-IPO history, when the model read the company as severely distressed purely because mezzanine preferred stock left permanent equity negative — again a structural artifact, not a going-concern signal. The genuine credit facts are the ones in Section 3.2: -$4,484.7M of net cash, one small note maturing in 2029, and no covenant pressure.
The screens that do apply are clean. Read alongside the Z-score, the earnings-quality and manipulation screens that are appropriate for this profile point the other way and deserve more weight. The Beneish M-score sits in the “no-manipulation” band, the Sloan accruals ratio is in the acceptable range (indeed strongly negative-accrual, consistent with cash flow exceeding reported earnings rather than the reverse), and the Piotroski F-score sits in the neutral band — depressed mechanically by the GAAP loss and negative operating-margin components rather than by any accounting red flag. None of these detects the aggressive-revenue-recognition signature that would corroborate the DOJ/SEC concern; the one honest exception is the FY2023 receivables build discussed in Section 3.2, which the screens register but which did not recur. The net read on financial-distress and manipulation screens: the credit picture is strong and the accruals quality is clean; the real risks in this name are the growth deceleration and the governance and revenue-recognition questions, not solvency or classical earnings manipulation.
4. Valuation withdrawn
This section stated what the shares were worth and what to do about them. It rested on an exit multiple set by hand — across the coverage it averaged 24% below where each company actually traded — so the conclusion largely restated that assumption instead of testing it. Rather than leave it standing, it has been withdrawn while the method is rebuilt.
Nothing else in this report depends on it: the financial analysis above and below is drawn from the company's own filings, and every figure links to the page it was verified against.
Section 5 — Financial Metrics & Peer Benchmarking
sources Relative valuation is the natural second opinion on an expensive stock, but for this cohort it is a treacherous one, and the reader is owed the hazards before the tables. Two of the four peers report on a fiscal calendar six months behind CrowdStrike; three of the five names in the comparison run GAAP operating losses; every figure below is the audited GAAP number rather than the adjusted figure each management prefers; and one peer is not a pure-software business at all. Each of these is a finding, not a footnote, and each is stated where the reader meets the relevant table. The conclusion the section reaches is narrow and worth stating up front: relative valuation does not rescue the absolute valuation — it corroborates it.
5.1 Peer Selection
sources The peer set is the four listed pure-play or near-pure-play security-software vendors closest to CrowdStrike in franchise and business model: Palo Alto Networks, Inc., SentinelOne, Inc., Zscaler, Inc. and Fortinet, Inc.. All four file under US GAAP in USD, so — unlike a cross-border cohort — there is no accounting-standard or currency translation to weaken the comparison. Every hard figure in this section is taken from the peer’s own primary filing (two from the working folder, two from SEC EDGAR); no aggregator was used for any reported number, and the valuation multiples that would ordinarily require live market data are deliberately absent (Section 5.5).
The set has two structural weaknesses that govern how the tables must be read, and neither is cosmetic. First, fiscal periods do not line up. SentinelOne closes its year on 31 January, identical to CrowdStrike — it is the one exactly-aligned comparison in the group. Fortinet closes on 31 December, a one-month lag that is effectively clean. But Palo Alto Networks and Zscaler both close on 31 July, so their most recent full years ended 31 July 2025 — a full six months before CrowdStrike’s FY2026 close. [Rating and price target withdrawn — see the note at the top.] Second, Fortinet is not a like-for-like software comparable: roughly a third of its revenue is hardware, it carries real inventory, and its margin, working-capital and return metrics are shaped by that mix in ways the pure-cloud names are not (Section 5.7, note C004). We retain it because it is the most relevant scaled, profitable security vendor in the market, but its numbers are a directional benchmark, not a clean one.
| Peer | Ticker | Exchange | Filing Type | Accounting Standard | Fiscal Year End | Comparability Note |
|---|---|---|---|---|---|---|
| Palo Alto Networks, Inc. | PANW | Nasdaq | 10-K | US GAAP | July | 6-month fiscal lag vs CRWD; profitable on GAAP |
| SentinelOne, Inc. | S | NYSE | 10-K | US GAAP | January | Exactly aligned (31 Jan); GAAP operating loss; net margin tax-distorted |
| Zscaler, Inc. | ZS | Nasdaq | 10-K | US GAAP | July | 6-month fiscal lag vs CRWD; near-breakeven GAAP operating loss |
| Fortinet, Inc. | FTNT | Nasdaq | 10-K | US GAAP | December | Hardware-inclusive; not like-for-like; buyback-shrunk equity |
Source: Peer-company SEC filings; comparability notes in 5.7 — see Appendix A.1.
5.2 Profitability Comparison
sources Comparative: Most Recent Full Fiscal Year (GAAP). CrowdStrike is shown on FY2026 (year ended 31 January 2026). Peer fiscal periods differ and are labelled in the first row: SentinelOne is exactly aligned, Fortinet is one month behind, and Palo Alto Networks and Zscaler are six months behind — read their columns accordingly.
| Metric | CrowdStrike | Palo Alto Networks, Inc. | SentinelOne, Inc. | Zscaler, Inc. | Fortinet, Inc. |
|---|---|---|---|---|---|
| Fiscal period | FY2026 (Jan) | FY2025 (Jul) | FY2026 (Jan) | FY2025 (Jul) | FY2025 (Dec) |
| Revenue ($M) | $4,812.0M | $9,221.5M | $1,001.3M | $2,673.1M | $6,799.6M |
| Gross Margin | 74.7% | 73.4% | 74.1% | 76.9% | 80.5% |
| EBITDA Margin | -0.2% | 17.2% | -26.6% | -0.3% | 32.9% |
| EBIT Margin | -6.1% | 13.5% | -32.1% | -4.8% | 30.7% |
| Net Margin | -3.4% | 12.3% | -45.0% | -1.6% | 27.3% |
| FCF Margin | 25.8% | 37.6% | 5.2% | 27.2% | 32.7% |
Source: Peer-company SEC filings; comparability notes in 5.7 — see Appendix A.1. All figures GAAP. EBITDA margin and FCF margin are analyst-computed from filing components.
Two things drive every number in this table and must be separated from genuine operating differences. The first is that all figures are GAAP, and this cohort lives on non-GAAP. Every one of the five leads its investor commentary with an adjusted operating margin and adjusted EPS that add back very large stock-based compensation; the GAAP operating margins shown here therefore sit far below the “adjusted” figures each management emphasises — Palo Alto Networks’ 13.5% GAAP operating margin, for example, is a fraction of the non-GAAP figure it headlines. Critically, the size of that add-back is not uniform, which means a non-GAAP league table would rank these companies differently from a GAAP one. Fortinet’s stock compensation is trivial relative to revenue; SentinelOne’s is the heaviest in the group; CrowdStrike and Zscaler sit toward the SentinelOne end. A portfolio manager comparing “profitability” across these names on management’s preferred basis is comparing figures that have been flattered by very different amounts — the single most useful caution this section can give.
The second is that three of the five run GAAP operating losses — CrowdStrike at -6.1%, SentinelOne at -32.1% and Zscaler at -4.8% — while only Fortinet (30.7%) and Palo Alto Networks (13.5%) are GAAP-profitable at the operating line. This is precisely why the separate valuation’s valuation is DCF-only and why the earnings-based multiples in Section 5.5 are unavailable for most of the group: for three of the five names there is no positive GAAP operating income to build a multiple on. Note also that SentinelOne’s net margin of -45.0% is far worse than its operating margin of -32.1% not because of operating deterioration but because of an unusual income-tax provision booked on a pre-tax loss; its operating margin is the meaningful comparison, its net margin is not (note C003).
Where the comparison is genuine, it is favourable to CrowdStrike on the metrics that matter for a subscription franchise. Gross margin of 74.7% is squarely in the pure-software band — close to SentinelOne’s 74.1% and Zscaler’s 76.9%, and structurally below Fortinet’s 80.5% only because Fortinet blends high-margin software with lower-margin appliances, not because CrowdStrike is less efficient. On cash generation the gap is real and in CrowdStrike’s favour among the loss-makers: its FCF margin of 25.8% dwarfs SentinelOne’s 5.2% and is broadly level with Zscaler’s 27.2%, though it trails the two profitable names — Palo Alto Networks at 37.6% and Fortinet at 32.7%. As the separate valuation stresses, that reported FCF margin sits on top of a stock-compensation add-back the model refuses to treat as free, so it should be read as a liquidity fact, not as economic profit.
Historical: CrowdStrike Own 5-Year Progression (GAAP)
| Metric | FY2022 | FY2023 | FY2024 | FY2025 | FY2026 |
|---|---|---|---|---|---|
| Gross Margin | 73.6% | 73.2% | 75.3% | 74.9% | 74.7% |
| EBITDA Margin | -5.1% | -4.3% | 4.7% | 2.4% | -0.2% |
| EBIT Margin | -9.8% | -8.5% | -0.1% | -3.0% | -6.1% |
| Net Margin | -16.2% | -8.2% | 2.9% | -0.5% | -3.4% |
| FCF Margin | 30.4% | 30.2% | 30.8% | 27.0% | 25.8% |
Source: CrowdStrike 10-K FY2026 and prior-year 10-Ks. Tier 1. Margins are analyst-computed (underlined). Figures as originally reported.
The own-history table is the more important lens on CrowdStrike’s profitability, because it shows the GAAP operating line reaching positive territory in FY2024 and then slipping back into loss in FY2025 and FY2026 — consistent with Section 3’s account of the July-2024 sensor-update incident and the elevated compensation and remediation carried since. Gross margin has held remarkably steady near the top of the peer range throughout, and FCF margin has stayed in the mid-to-high twenties; the volatility is entirely below the gross line, in operating spend and stock compensation, not in the core unit economics of the platform.
5.3 Returns Comparison
sources Comparative: Most Recent Full Fiscal Year (GAAP).
| Metric | CrowdStrike | Palo Alto Networks, Inc. | SentinelOne, Inc. | Zscaler, Inc. | Fortinet, Inc. |
|---|---|---|---|---|---|
| ROICᶜ | — | 12.5%ᶜ | -17.7%ᶜ | -2.9%ᶜ | 73.7%ᶜ |
| ROE | -4.2% | 17.5% | -29.0% | -2.7% | 135.7% |
| ROA | -1.6% | 5.2% | -18.6% | -0.7% | 18.4% |
| Asset Turnover | 0.43x | 0.42x | 0.41x | 0.48x | 0.67x |
Source: Peer-company SEC filings; comparability notes in 5.7 — see Appendix A.1. Asset turnover here is struck on PERIOD-END total assets, the only basis available for every peer from a single filing; Section 3’s DuPont decomposition uses AVERAGE assets, as that analysis requires, so the two figures differ for the same year and neither is wrong. ᶜ ROIC is analyst-computed and directional: NOPAT = GAAP EBIT × (1 - 21%), invested capital = total debt + total equity (cash not netted); it is not a company-disclosed figure (note C005). CrowdStrike’s ROIC is not shown — with a GAAP operating loss in FY2026, NOPAT is negative and the ratio is not meaningful.
The returns table is where a naive reading does the most damage, and two cells demand explicit handling. CrowdStrike’s ROIC is blank by design: its FY2026 GAAP operating loss produces a negative NOPAT, so a computed ROIC would be negative and analytically empty — the value question here is answered by the discounted cash flows in the separate valuation, not by a return-on-capital screen. At the other extreme, Fortinet’s headline returns — ROE of 135.7% and ROIC of 73.7% — are genuine, not data errors, but they are not a superior operating return. They are the arithmetic of a denominator that years of sustained share buybacks have shrunk: Fortinet has repurchased stock aggressively enough to compress its book equity well below its annual net income, so any return-on-equity or return-on-capital ratio mechanically explodes. Set beside the equity-heavy, loss-making software names, those figures are not like-for-like and should not be read as evidence that Fortinet earns a structurally better return on incremental capital than the cohort.
Stripping those two out, the honest read is that no name in this group is currently generating a clean, positive GAAP return on capital that is both comparable and impressive. Palo Alto Networks earns a modest positive ROE (17.5%) and ROIC (12.5%); the three loss-makers — CrowdStrike, SentinelOne (-29.0% ROE) and Zscaler (-2.7% ROE) — post negative book returns. Asset-turnover figures cluster tightly between roughly 0.41x and 0.67x, confirming these are all capital-light businesses whose value is in recurring revenue and intangibles, not in the balance sheet. CrowdStrike’s returns will only screen well once the GAAP operating line turns durably positive; until then, a returns-based relative case cannot be made, and we do not attempt one.
Historical: CrowdStrike Own 5-Year Progression
| Metric | FY2022 | FY2023 | FY2024 | FY2025 | FY2026 |
|---|---|---|---|---|---|
| ROE | -24.8% | -14.7% | 4.7% | -0.7% | -4.2% |
| ROA | -7.4% | -4.2% | 1.5% | -0.3% | -1.6% |
Source: CrowdStrike 10-K FY2026 and prior-year 10-Ks. Tier 1. Ratios are analyst-computed on average balances (underlined). ROIC is omitted — negative NOPAT in every year shown renders it not meaningful.
CrowdStrike’s own return history traces the same arc as its margins: book returns crossed into positive territory in FY2024 and then reversed in FY2025–FY2026 as the operating line slipped back into loss. The pattern reinforces the central judgment of this report — the franchise is high quality, but its GAAP economics have not yet compounded into a positive, durable return on capital, and the current price does not wait for them to.
5.4 Leverage & Liquidity Comparison
sources Comparative: Most Recent Full Fiscal Year (GAAP).
| Metric | CrowdStrike | Palo Alto Networks, Inc. | SentinelOne, Inc. | Zscaler, Inc. | Fortinet, Inc. |
|---|---|---|---|---|---|
| Net Debt / EBITDA | — | -1.4x | — | — | -0.7x |
| Total Debt / Equity | 0.2x | 0.0x | 0.0x | 0.9x | 0.8x |
| Interest Coverage | — | 414.3x | — | — | 103.7x |
| Current Ratio | 1.8x | 0.9x | 1.4x | 2.0x | 1.2x |
| FCF Margin | 25.8% | 37.6% | 5.2% | 27.2% | 32.7% |
Source: Peer-company SEC filings; comparability notes in 5.7 — see Appendix A.1. Net Debt/EBITDA and Interest Coverage are marked “—” where EBITDA is negative or the company runs an operating loss (CrowdStrike, SentinelOne, Zscaler) — the ratios are not meaningful. CrowdStrike’s net-debt/EBITDA and interest coverage are not meaningful given its FY2026 GAAP operating loss and are marked accordingly; its debt/equity and current ratio are shown.
Leverage is the least differentiating dimension in this cohort, because every one of the five names is net cash. Palo Alto Networks and SentinelOne carry no drawn debt at all; Zscaler and Fortinet carry convertible or term borrowings but hold cash and investments well in excess of them; CrowdStrike runs a single tranche of senior notes against a large net-cash balance — its own debt/equity of 0.2x and current ratio of 1.8x confirm a conservatively financed, liquid balance sheet (Section 3, a GREEN forensic flag). The debt-to-equity readings that look elevated — Zscaler at 0.9x and Fortinet at 0.8x — reflect gross borrowings against modest book equity (Fortinet’s shrunk by buybacks), not financial stress; both remain net-cash. Net-debt-to-EBITDA and interest coverage are simply not meaningful for the three loss-makers, whose GAAP EBITDA is negative or near zero, which is why those cells are blank for CrowdStrike, SentinelOne and Zscaler rather than filled with an artefact.
The practical implication is that balance-sheet risk is not a live differentiator within this group, and it is not part of the CrowdStrike thesis either way. What varies is cash conversion, not solvency — and there CrowdStrike’s FCF margin of 25.8% places it comfortably ahead of SentinelOne, level with Zscaler and behind the two profitable names, exactly as in Section 5.2. The reader should take from this table financial flexibility, not leverage: none of these companies is capital-constrained, and CrowdStrike least of all.
5.5 Valuation Multiples Comparison
sources Peer multiples are deliberately absent, and the reason matters. EV/EBITDA, P/E and FCF yield are not shown for any peer because they require live market capitalisation — a Tier-2 input — and the aggregator price and share-count data available for this run were internally inconsistent to the point that recording a multiple from them would have manufactured a false-looking number (note C006). Refusing to publish an unreliable figure is a standard, not a gap. Just as important, GAAP EV/EBITDA and P/E are not meaningful for three of the five names in the first place: CrowdStrike, SentinelOne and Zscaler have negative or near-zero GAAP EBITDA and GAAP net losses, so an earnings multiple built on them would be nonsensical regardless of price quality. This is the same reasoning that makes the separate valuation’s fair value a DCF, not a multiple.
| Metric | CrowdStrike | Palo Alto Networks, Inc. | SentinelOne, Inc. | Zscaler, Inc. | Fortinet, Inc. |
|---|---|---|---|---|---|
| EV/EBITDA (GAAP) | — (NM) | — | — (NM) | — (NM) | — |
| P/E (GAAP) | — (NM) | — | — (NM) | — (NM) | — |
| FCF Yield | — | — | — | — | — |
Source: Comparability note C006 — peer valuation multiples withheld (unreliable market inputs; not meaningful for the loss-making names). CrowdStrike GAAP EV/EBITDA and P/E are not meaningful (negative/near-zero GAAP EBITDA, net loss).
What can be stated cleanly is where CrowdStrike’s own equity is priced, on multiples that survive its loss-making GAAP profile. These are current-price, market-based figures (Tier 2), and they are unambiguous about the premium embedded in the stock.
| CrowdStrike — Current Valuation | Multiple |
|---|---|
| Price / Sales | 45.4x |
| Price / Free Cash Flow | 175.9x |
| Price / Book | 48.5x |
| Free Cash Flow Yield | 0.6% |
| EV / EBITDA (GAAP) | — (NM) |
| P / E (GAAP) | — (NM) |
Source: FL valuation model (Market and Metrics sheets), current price. Tier 2. Multiples are analyst-computed from market price (underlined). GAAP EV/EBITDA and P/E not meaningful.
[Rating and price target withdrawn — see the note at the top.] Because the peer valuation multiples are withheld, this section cannot rank CrowdStrike numerically against Palo Alto Networks or Fortinet on price. But the analytical point stands on the fundamentals already tabled: CrowdStrike carries the group’s premium multiple on sales while generating a GAAP operating loss, whereas the two peers that actually convert revenue into GAAP profit — Palo Alto Networks and Fortinet — are the larger, more mature businesses, and the two names that share CrowdStrike’s loss-making profile (SentinelOne, and near-breakeven Zscaler) are smaller. Relative valuation, in other words, offers no cheaper-quality alternative that reframes CrowdStrike as inexpensive; it places CrowdStrike as the most richly priced asset in a group where price is highest exactly where current GAAP profitability is lowest.
5.6 Efficiency Comparison
| Metric | CrowdStrike | Palo Alto Networks, Inc. | SentinelOne, Inc. | Zscaler, Inc. | Fortinet, Inc. |
|---|---|---|---|---|---|
| Days Sales Outstanding | 94 days | 117 days | 105 days | 136 days | 91 days |
| Days Inventory Outstanding | — | — | — | — | 110 days |
| Days Payables Outstanding | 35 days | 35 days | 14 days | 28 days | 63 days |
| Cash Conversion Cycle | 59 days | 83 days | 91 days | 108 days | 137 days |
| CapEx / Revenue | 7.7% | 2.7% | 2.5% | 9.2% | 5.4% |
Source: Peer-company SEC filings; comparability notes in 5.7 — see Appendix A.1. Inventory (and therefore DIO) applies only to Fortinet, the sole hardware-inclusive name; the pure-software companies hold no inventory, so their cash-conversion cycle has no inventory leg and is not directly comparable to Fortinet’s (note C004).
The efficiency comparison is clean for the software names and misleading for Fortinet unless the inventory leg is isolated. Among the pure-cloud businesses the working-capital profile is receivables-driven: days sales outstanding sit in a broad band from CrowdStrike’s 94 days up to Zscaler’s 136 days, reflecting billing seasonality and enterprise payment terms rather than any structural difference in collection quality. CrowdStrike’s cash-conversion cycle of 59 days is the tightest of the SaaS group, helped by payables of 35 days. Fortinet’s cash-conversion cycle of 137 days is not comparable to those figures — it carries roughly 110 days of inventory that the software names simply do not have, so its longer cycle is a function of holding appliances, not weaker working-capital discipline. Placing Fortinet’s cycle in the same column as the SaaS names without that caveat would invert the reading.
Capital intensity is uniformly low, as expected for the model: peer capex runs from the low-single-digits of revenue at the asset-lightest names (2.7% at Palo Alto Networks, 2.5% at SentinelOne) up to Zscaler’s 9.2%, which builds more of its own cloud infrastructure. CrowdStrike’s own capex intensity of 7.7% of revenue sits toward the higher end of the group — below Zscaler’s 9.2% but above the asset-lightest names — reflecting its continued cloud-platform build; the point for benchmarking is that none of these businesses requires heavy fixed investment, so free-cash-flow generation is governed by operating spend and stock compensation, not by the balance sheet — which returns the analysis, once again, to the profitability and valuation questions rather than to efficiency.
5.7 Comparability Caveats
sources This section’s credibility rests on the caveats below; each is material, each is reflected in the table commentary above, and none is raised only to be ignored.
Fiscal-period misalignment (Palo Alto Networks, Zscaler — all metrics; note C001). CrowdStrike’s comparison period is FY2026, ended 31 January 2026. SentinelOne’s fiscal year is identical and is the only exactly-aligned comparison; Fortinet’s ended 31 December 2025, a one-month lag that is effectively clean. Palo Alto Networks and Zscaler both closed their most recent full years on 31 July 2025 — six months earlier. [Rating and price target withdrawn — see the note at the top.] Their revenue, margin and return columns are directional as at their own year-end, not contemporaneous with CrowdStrike; the reader should mentally advance them before drawing any size or growth conclusion.
GAAP versus non-GAAP (all peers — operating margin, EBITDA margin, net margin, EPS; note C002). Every figure in this section is the audited GAAP number. All five companies lead their commentary with non-GAAP operating income and EPS that add back very large stock-based compensation, so the GAAP margins shown here are far below the “adjusted” margins management highlights. The size of the add-back varies enough across the group to change the ranking: Fortinet’s stock compensation is trivial relative to revenue, SentinelOne’s is the heaviest, and CrowdStrike and Zscaler sit toward the SentinelOne end. Any comparison drawn from these names’ preferred non-GAAP figures is comparing numbers that have been flattered by materially different amounts, and should be treated with corresponding caution.
Loss-making peers and a tax artefact (SentinelOne, Zscaler — net margin, net income; note C003). CrowdStrike, SentinelOne and Zscaler all run GAAP operating losses, transcribed here as losses with no sign flips or non-GAAP substitution. SentinelOne’s net margin of -45.0% is far worse than its operating margin of -32.1% because of an unusual income-tax provision recorded on a pre-tax loss — a tax item, not operating deterioration. SentinelOne’s operating margin is therefore the cleaner comparison; its net margin should not be read as an operating signal. Zscaler’s small net loss is close to breakeven and is cushioned by interest income on its cash balance.
Business-model difference (Fortinet — gross margin, DIO, cash-conversion cycle, ROE, ROIC, capex; note C004). Fortinet is a hardware-plus-software vendor: roughly a third of revenue is product, and it carries real inventory, unlike the pure-cloud names. Its 80.5% gross margin blends high-margin service with lower-margin appliances; its inventory cycle of 110 days has no counterpart at the software names; and its ROE of 135.7% and ROIC of 73.7% — while genuine — reflect years of aggressive buybacks that shrank its book equity below its annual net income, not a superior operating return. Every Fortinet metric that touches product economics, working capital or the equity base is a directional benchmark only.
[Rating and price target withdrawn — see the note at the top.] CrowdStrike’s ROIC is not shown because its negative NOPAT makes it not meaningful.
Valuation multiples withheld (all peers — EV/EBITDA, P/E, FCF yield; note C006). Peer valuation multiples are not recorded because they require live market data that was internally inconsistent this run, and because GAAP EV/EBITDA and P/E are not meaningful for CrowdStrike, SentinelOne or Zscaler in any case. The relative-valuation discussion is therefore built on the profitability and efficiency evidence and on CrowdStrike’s own market-based multiples, with every valuation figure flagged Tier 2. Peer valuation should be sourced from the pipeline’s controlled market-data flow, not from these filings or ad-hoc web numbers.
Capex and leverage conventions (all peers; notes C007, C008). Capex is defined consistently with CrowdStrike — purchases of property and equipment plus capitalised internal-use software where reported as a separate investing line; Palo Alto Networks and Fortinet report capex on a single property-and-equipment line, while SentinelOne, Zscaler and CrowdStrike split out capitalised software. Leverage reflects interest-bearing borrowings only, excluding operating-lease liabilities to match CrowdStrike’s convention; all five names are net cash, and net-debt-to-EBITDA is shown only where EBITDA is positive (Palo Alto Networks, Fortinet) and marked not-meaningful for the loss-making or near-breakeven names.
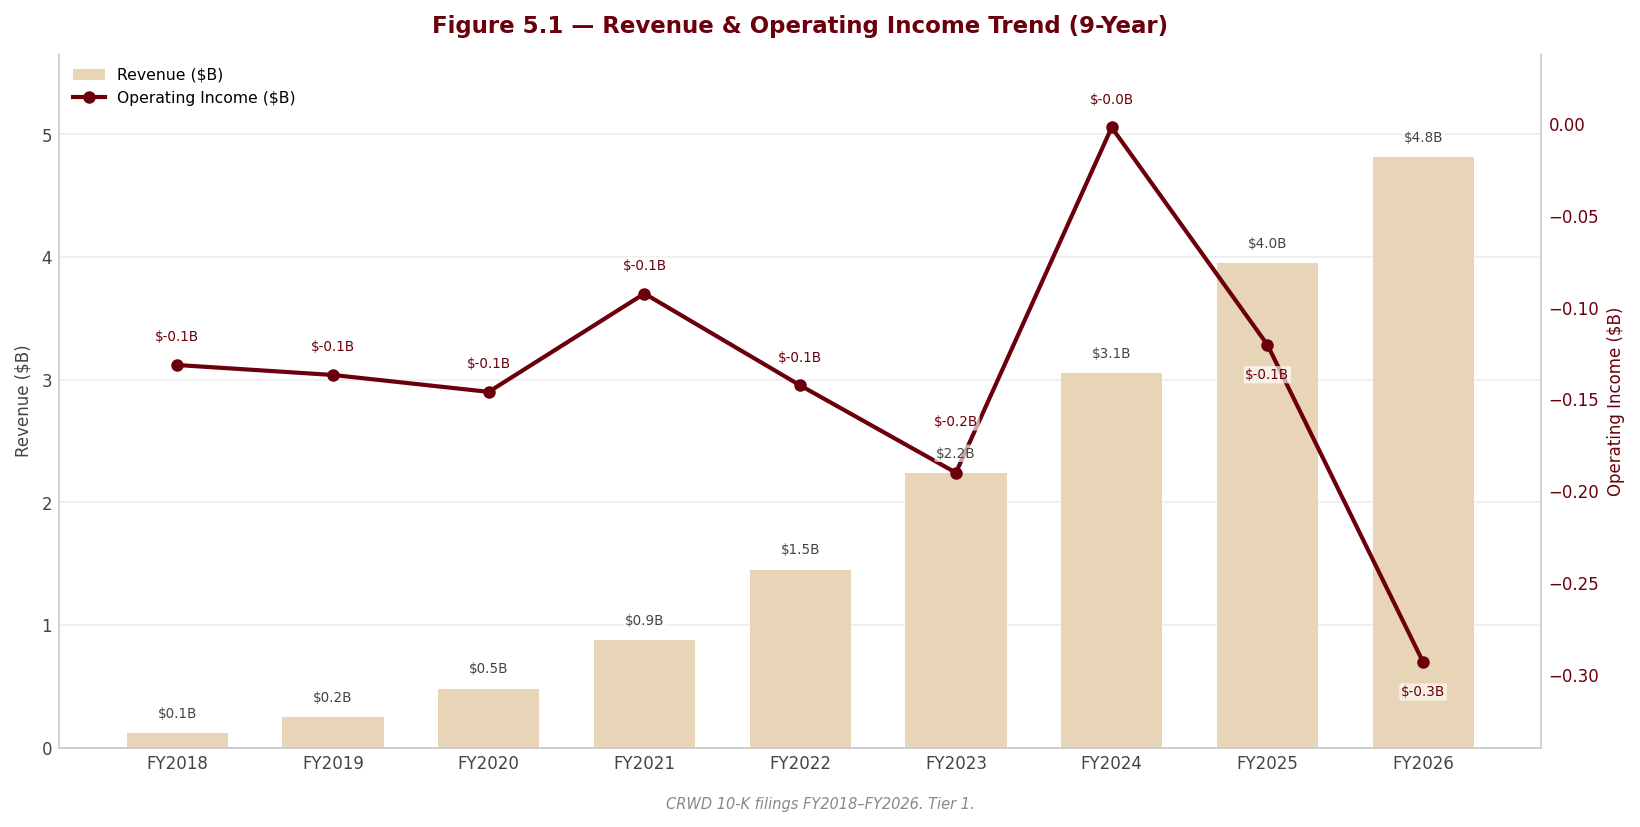
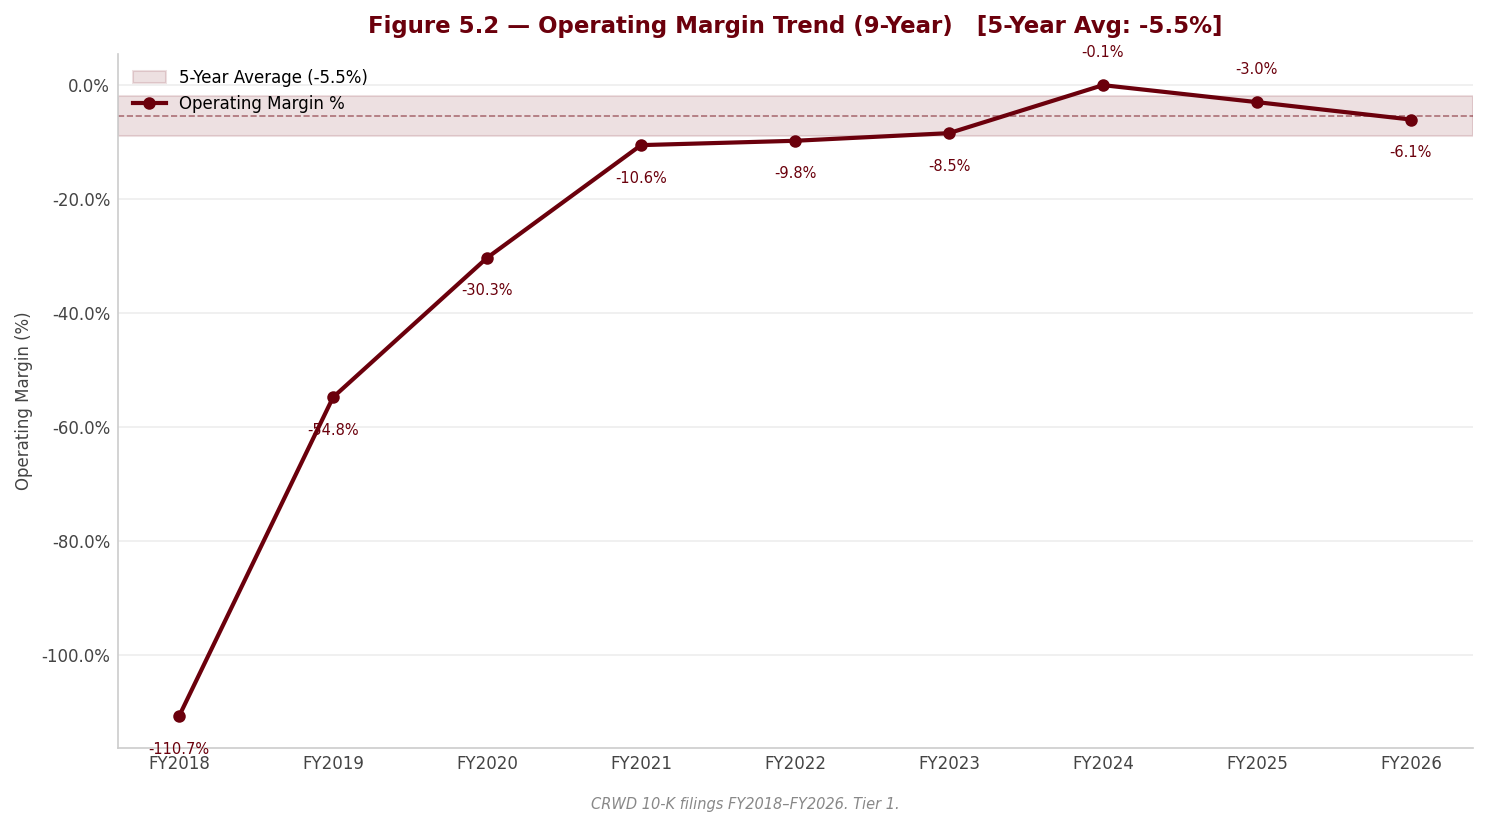
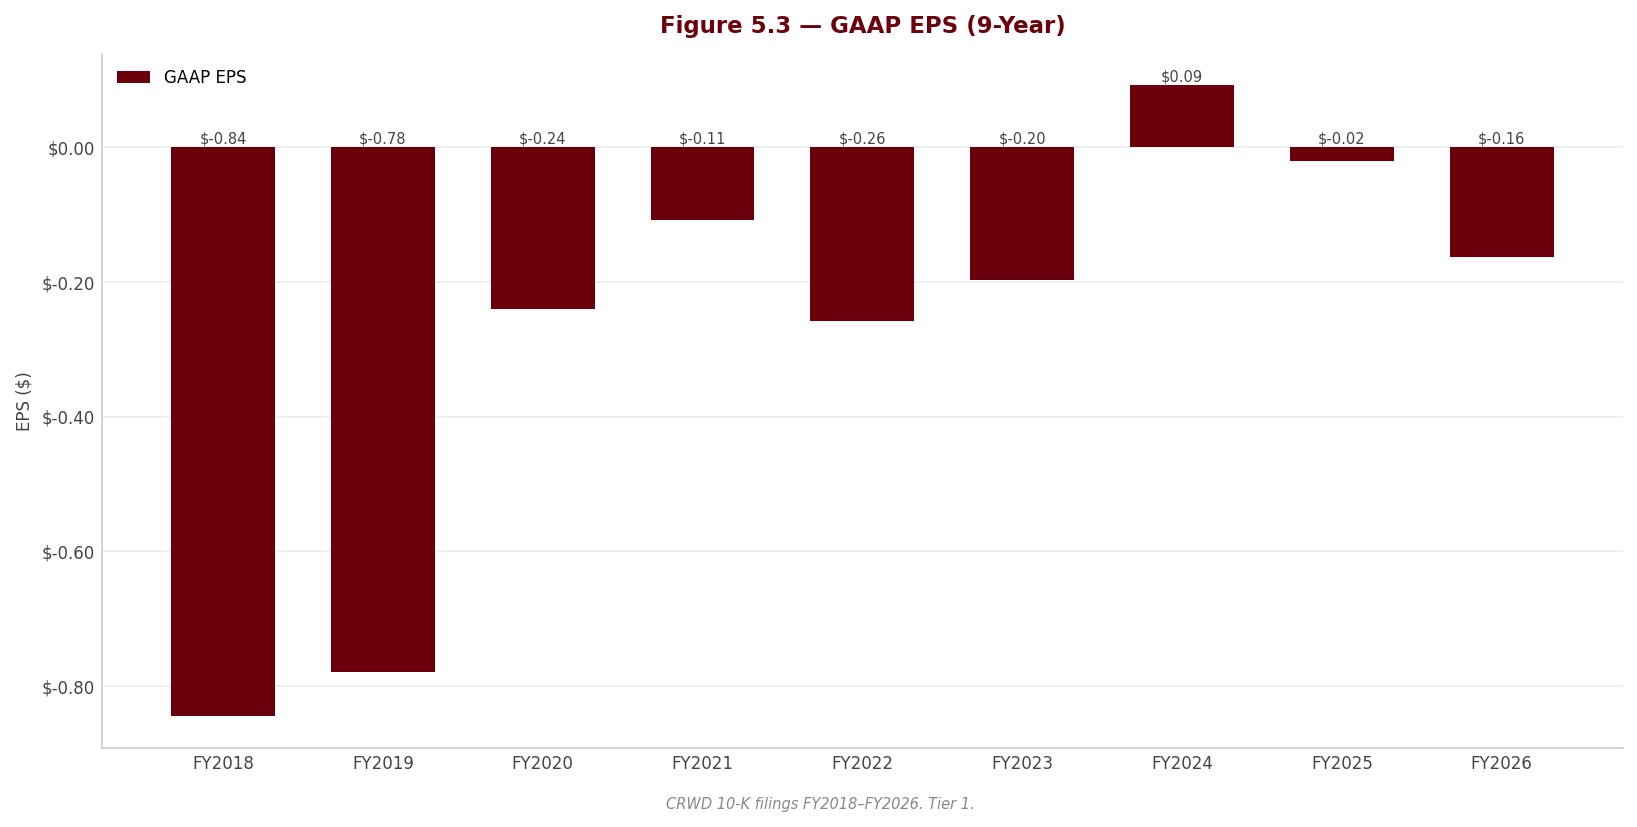
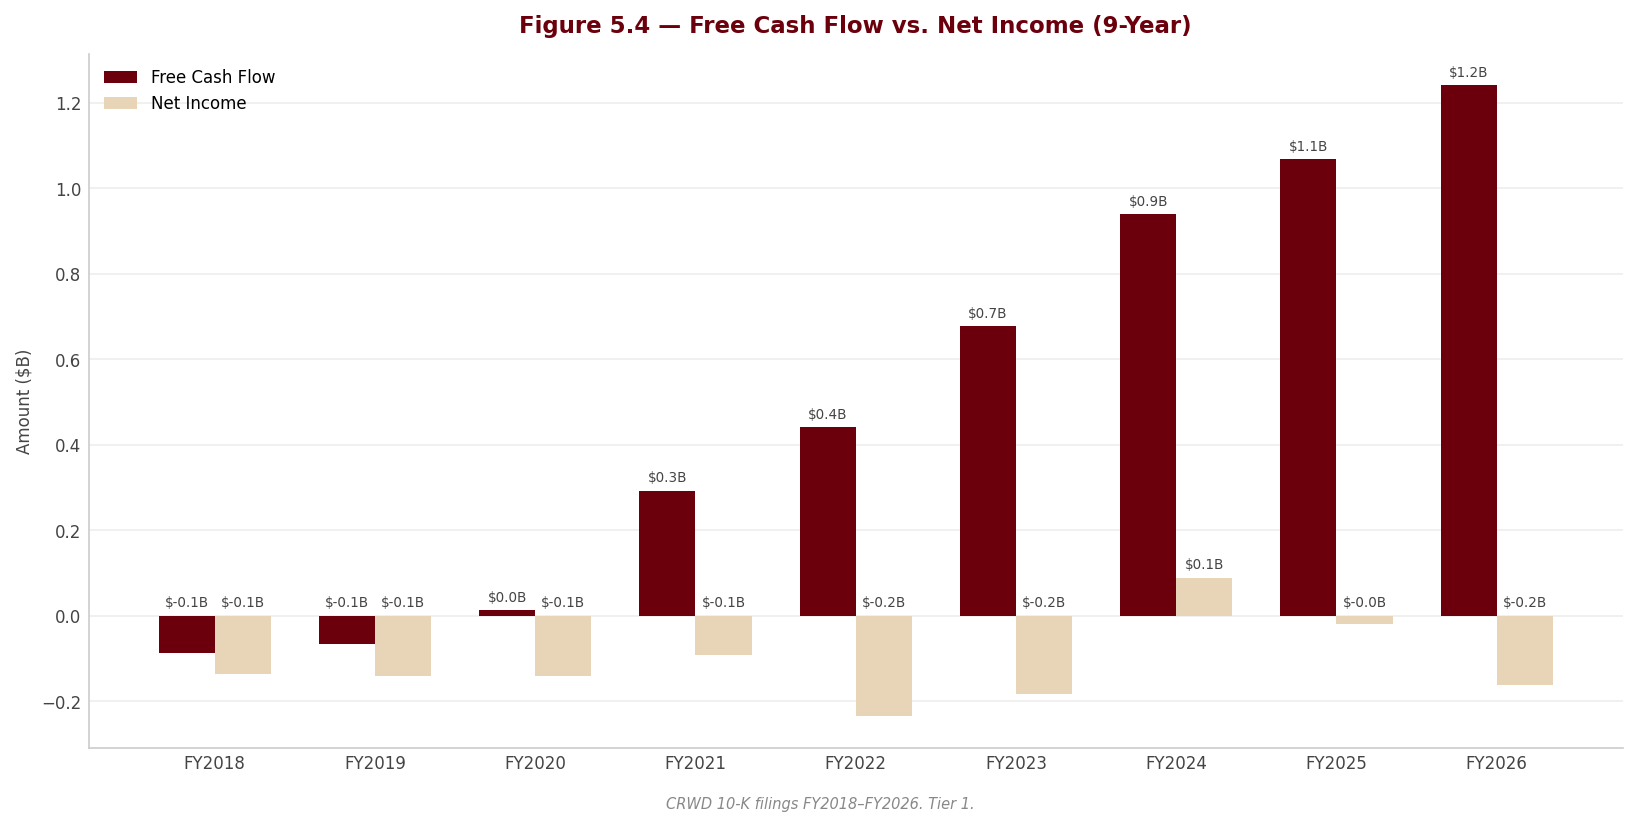
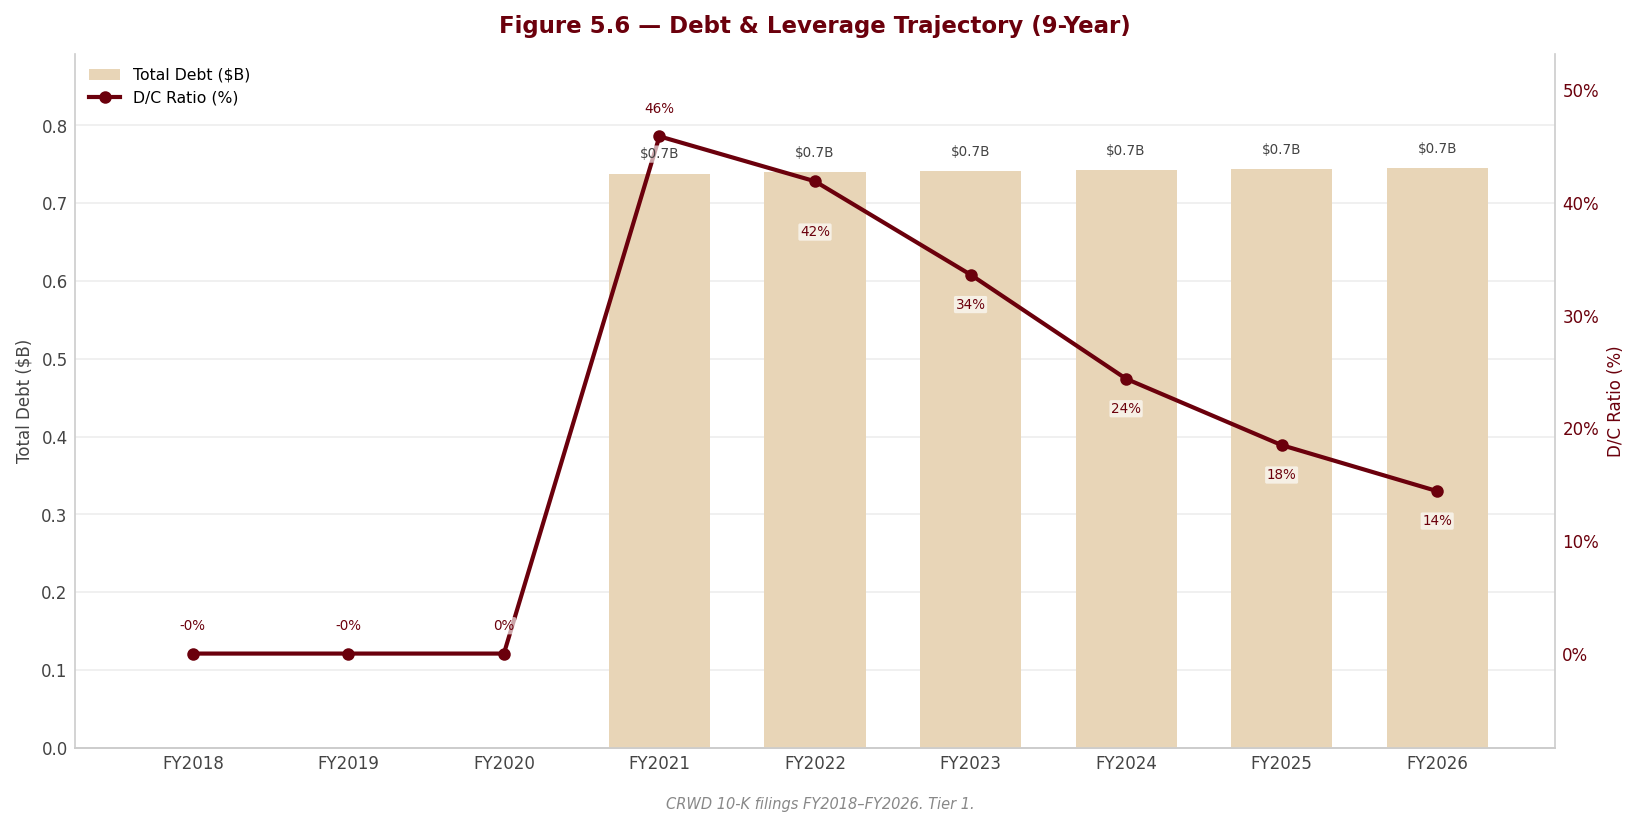
6. Valuation & Price Target withdrawn
This section stated what the shares were worth and what to do about them. It rested on an exit multiple set by hand — across the coverage it averaged 24% below where each company actually traded — so the conclusion largely restated that assumption instead of testing it. Rather than leave it standing, it has been withdrawn while the method is rebuilt.
Nothing else in this report depends on it: the financial analysis above and below is drawn from the company's own filings, and every figure links to the page it was verified against.
Section 7 — Quarterly Update: Q1 2027
sources Fiscal Q1 2027 = the three months ended 30 April 2026. CrowdStrike’s fiscal year ends 31 January. Comparatives: Q1 2026 = three months ended 30 April 2025 (prior-year same quarter); Q4 2026 = three months ended 31 January 2026 (prior sequential quarter). All per-share figures in this section are on the PRE-split basis — the 4-for-1 forward split had a record date of 25 June 2026 and split-adjusted trading from 2 July 2026 (10-Q p. 34), after this quarter-end, whereas the market price used elsewhere in this report is post-split. See 7.4, Note 17.
Portfolio Action
sources [Rating and price target withdrawn — see the note at the top.]
This was the best quarter the bear case has had to absorb: CrowdStrike turned its first GAAP net profit since FY2024 and revenue growth re-accelerated for the first time in five years. Neither fact changes the call, and 7.6 sets out why.
| Assessment | |
|---|---|
| Action | [Rating and price target withdrawn — see the note at the top.] |
| Reason | The first GAAP net profit since FY2024 ($27.8M) sits on an operating line still in deficit (-$30.6M), and $27.9M of the $94.1M operating improvement is a change in the commission amortisation period (10-Q Note 1, p. 11) rather than operating leverage. |
| Thesis intact? | PARTIALLY — two of its supports weakened. GAAP profitability arrived, and the FY2022–FY2026 growth decay broke: revenue +25.6% YoY against 22.0% assumed in the DCF’s first year, with ARR growth up from 22% to 24% (10-Q p. 37). The valuation conclusion survives both, because terminal value is 85% of enterprise value — see 7.6. |
| Trigger to revisit | [Rating and price target withdrawn — see the note at the top.] |
Source: CRWD 10-Q for the quarterly period ended April 30, 2026 (Note 1, p. 11; Statements of Operations, p. 7); CRWD_Portfolio.xlsx Data and Valuation sheets. Analyst assessment.
7.1 Results at a Glance
| Metric | Q1 2027 | Q1 2026 | YoY Δ | Q4 2026 | QoQ Δ |
|---|---|---|---|---|---|
| Revenue ($M) | $1,385.6M | $1,103.4M | +25.6% | $1,305.4M | +6.1% |
| Gross Profit ($M) | $1,043.4M | $814.3M | +28.1% | $993.7M | +5.0% |
| Gross Margin | 75.3% | 73.8% | +1.5 pp | 76.1% | -0.8 pp |
| EBITDA ($M) | $57.3M | -$60.6M | +194.6%ᵃ | $91.3M | -37.2% |
| EBITDA Margin | 4.1% | -5.5% | +9.6 pp | 7.0% | -2.9 pp |
| EBIT ($M) | -$30.6M | -$124.7M | +75.5%ᵃ | $13.8M | -322.0%ᵃ |
| EBIT Margin | -2.2% | -11.3% | +9.1 pp | 1.1% | -3.3 pp |
| Net Income ($M) | $27.8M | -$110.2M | +125.2%ᵃ | $59.4M | -53.2% |
| Net Margin | 2.0% | -10.0% | +12.0 pp | 4.5% | -2.5 pp |
| Diluted EPS | $0.11 | -$0.44 | +125.0%ᵃ | —ᵇ | —ᵇ |
YoY Δ = (CQ - PYSQ) / |PYSQ| × 100; e.g. Revenue: (1,385.629 - 1,103.434) / |1,103.434| × 100 = +25.6%. QoQ Δ = (CQ - PQ) / |PQ| × 100; e.g. Revenue: (1,385.629 - 1,305.375) / |1,305.375| × 100 = +6.1%. Margins are the line item divided by revenue for the same quarter: Gross Margin CQ = 1,043.352 / 1,385.629 × 100 = 75.3%; EBITDA Margin CQ = 57.300 / 1,385.629 × 100 = 4.1%; EBIT Margin CQ = -30.600 / 1,385.629 × 100 = -2.2%; Net Margin CQ = 27.774 / 1,385.629 × 100 = 2.0%. Margin deltas are in percentage points: Gross Margin YoY = 75.3% - 73.8% = +1.5 pp.
ᵃ Percentage change computed off a negative base. [Rating and price target withdrawn — see the note at the top.] ᵇ Diluted EPS for Q4 2026 is not separable as a standalone quarter (annual EPS is not the sum of four quarterly EPS figures once the share count moves), so no figure is carried in the workbook and no QoQ change can be computed. CrowdStrike declares no dividend, so no per-share payout comparison applies.
Source: CrowdStrike Holdings, Inc. Form 10-Q for the quarterly period ended April 30, 2026, Condensed Consolidated Statements of Operations, p. 7. Quarter-end labels per the CRWD figure manifest. Growth rates, margins and margin deltas are analyst-computed. Q1 2026 comparatives in this table are the figures as originally reported; see 7.4, Note 16.
7.2 P&L Drivers
sources Revenue: Revenue of $1,385.6M grew +25.6% YoY and +6.1% QoQ, and management attributes the subscription increase — 95% of the total in both quarters — to a combination of new customer additions and the sale of additional sensors and modules to existing customers, with professional services up on a higher number of billed service hours (10-Q MD&A, pp. 41–42). Critically for the thesis, this is the first quarter in which the multi-year deceleration did not continue: annual recurring revenue grew 24% to $5.51B at 30 April 2026 against 22% growth to $4.44B a year earlier, with net new ARR of $255.8M in the quarter versus $193.8M in Q1 2026 (10-Q p. 37). International revenue was 34% of the total, the highest of the four periods the company discloses on that basis — 32% in FY2024, 32% in FY2025, 33% in FY2026 (10-Q p. 60), and no single customer or channel partner reached 10% of revenue (10-Q p. 12).
Cost and margin: COGS of $342.3M against $289.1M a year earlier rose more slowly than revenue, lifting gross margin +1.5 pp YoY to 75.3%, which management attributes to hosting efficiencies on the subscription line and higher consultant utilisation on services (10-Q p. 42). Below gross profit, the operating loss narrowed to -$30.6M from -$124.7M, but $27.9M of that $94.1M improvement — roughly 30% — comes from the change in the estimated period of benefit for capitalised sales commissions from four years to five, effective this quarter (10-Q Note 1, p. 11); on the same revenue base that benefit is worth 2.0 pp of the 9.1 pp YoY EBIT-margin improvement, or about 22% of it. D&A of $87.9M versus $64.1M rose +37.1% YoY as the data-centre build-out and acquired intangibles came into service, so the EBITDA improvement to $57.3M flatters the operating picture further than EBIT does; excluding the commission-estimate benefit, EBIT would have been about -$58.5M (-4.2% of revenue) and EBITDA about $29.4M.
Below the line: The gap between the -$30.6M operating loss and a positive pre-tax result of $39.1M is entirely non-operating: $40.5M of interest income on the cash pile, $35.2M of other income — of which $36.4M is a one-off realised gain on sales of privately held strategic investments — less interest expense of $6.1M (10-Q pp. 7 and 44). A $6.9M income tax benefit, driven by deferred tax assets realised on the recent acquisitions, then adds to net income before $18.2M is attributed to the Falcon Funds’ non-controlling holders, leaving $27.8M attributable to CrowdStrike. Diluted EPS of $0.11 against -$0.44 is a swing of $0.55 per share (+125.0% YoY), on a pre-split basis; there is no comparable standalone Q4 2026 EPS figure.
7.3 Balance Sheet & Cash Flow
| Metric | Q1 2027 | Q1 2026 | YoY Δ | Q4 2026 | QoQ Δ |
|---|---|---|---|---|---|
| Cash ($M) | $4,552.8M | $4,614.2M | -1.3% | $5,230.1M | -13.0% |
| Net Debt ($M) | -$3,807.0M | -$3,869.8M | +1.6%ᶜ | -$4,484.7M | +15.1%ᶜ |
| Net Debt / LTM EBITDA | n.m. — net cashᵈ | — | — | — | — |
| Total Assets ($M) | $11,270.1M | $8,720.4M | +29.2% | $11,086.7M | +1.7% |
| Equity ($M) | $4,633.9M | $3,450.9M | +34.3% | $4,428.4M | +4.6% |
| OCF ($M) | $590.9M | $384.1M | +53.8% | $497.9M | +18.7% |
| CapEx ($M) | $120.2M | $103.2M | +16.5% | $119.7M | +0.4% |
| FCF ($M) | $470.7M | $280.9M | +67.6% | $378.2M | +24.5% |
| Dividends Paid ($M) | $0.0M | $0.0M | —ᵉ | —ᵉ | —ᵉ |
Same formulas as 7.1: YoY Δ = (CQ - PYSQ) / |PYSQ| × 100; e.g. OCF: (590.9 - 384.1) / |384.1| × 100 = +53.8%. QoQ Δ = (CQ - PQ) / |PQ| × 100; e.g. FCF: (470.7 - 378.2) / |378.2| × 100 = +24.5%. CapEx is stored and shown as a positive magnitude; it is a cash outflow in the period.
ᶜ Net debt is negative — CrowdStrike holds net cash. A positive Δ therefore means the net cash position shrank: net cash fell from $4,484.7M at 31 January 2026 to $3,807.0M at 30 April 2026. ᵈ LTM EBITDA derivation: Q2 2026 (-$45.0M) + Q3 2026 ($2.4M) + Q4 2026 ($91.3M) + Q1 2027 ($57.3M) = $106.0M LTM EBITDA. Net Debt CQ / LTM EBITDA = -3,806.958 / 105.964 = -35.9×. The ratio is negative because the company has net cash, so it carries no leverage information and is reported as not meaningful. The two intervening quarters used in the sum are taken from the workbook’s quarterly EBITDA row (Data sheet, row 20, quarterly columns); the Section 7 data pack itself carries only Q1 2027, Q4 2026 and Q1 2026. ᵉ CrowdStrike has never declared or paid a cash dividend and does not anticipate doing so (10-Q p. 75). Both comparison quarters are zero, so no percentage change is defined; the Q4 2026 cell is not separately carried in the workbook.
Source: CrowdStrike 10-Q for the quarter ended April 30, 2026 — Condensed Consolidated Balance Sheets, p. 6; Condensed Consolidated Statements of Cash Flows, p. 10; MD&A Cash Flows, p. 45. Growth rates, LTM EBITDA and the leverage ratio are analyst-computed.
Balance sheet note: Cash fell 13.0% sequentially, from $5,230.1M to $4,552.8M, for two identifiable reasons and not because of operations: $881.4M of cash paid for the SGNL and Seraphic acquisitions and $175.6M of share repurchases, against $590.9M of operating cash generated (10-Q p. 10). The other large sequential moves are the seasonal collection of Q4 billings — accounts receivable down from $1,361.8M to $933.9M — and goodwill up from $1,363.3M to $2,267.5M on the two closings, which together lifted total assets to $11,270.1M (10-Q pp. 6 and 17); funded debt is unchanged at $750.0M principal (10-Q p. 17).
Cash flow note: FCF conversion = FCF / Net Income = $470.7M / $27.8M = 1,694.8%, a ratio that is meaningless as a quality signal and instructive as a structural one: operating cash flow of $590.9M is built on $442.7M of non-cash add-backs, of which $297.7M is stock-based compensation and $98.9M is amortisation of deferred contract acquisition costs (10-Q p. 45). OCF and net income diverged by design rather than by working capital distress — the $428.8M release from accounts receivable is the normal post-Q4 collection cycle, and it was partly offset by a $92.7M build in deferred contract acquisition costs and a $36.7M decline in deferred revenue (10-Q p. 45).
7.4 Footnote Review
sources Note 1 — Description of Business and Significant Accounting Policies (10-Q pp. 11–13) This note carries the single most consequential disclosure in the filing. In February 2026 management completed an assessment of the estimated period of benefit for commissions earned on initial contracts and upsells and lengthened it from four years to five, effective FY2027, and quantifies the effect for this quarter as “a reduction in sales commission expense of $27.9 million” (p. 11). This is new versus Q1 2026, where the four-year period applied. The mechanism is non-economic: no cash payment to a salesperson changed, only the number of years over which an already-capitalised balance is expensed. Corroboration is visible elsewhere in the filing — amortisation of deferred contract acquisition costs fell to $98.9M from $102.9M a year earlier (p. 10) even though the capitalised balance grew to $1,097.1M from $847.9M (p. 25). The note also confirms concentration is immaterial: no channel partner or direct customer at 10% or more of receivables or revenue in either quarter, though one end user represents 13% of financing receivables versus two users at an aggregate 27% at 31 January 2026 (p. 12). ASU 2025-05 was adopted 1 February 2026 with no material impact; ASU 2025-06 and ASU 2024-03 remain under evaluation (pp. 12–13). Analytical significance: about 30% of the YoY operating improvement is an accounting election, and the trend line in operating margin cannot be read as clean operating leverage until FY2028 comparatives are on a like-for-like five-year basis.
Note 2 — Investments and Fair Value Measurements (10-Q pp. 13–15) Cash equivalents measured at fair value total $1,720.9M (money-market funds $910.1M Level 1, U.S. Treasuries $795.3M Level 2), down from $2,018.2M at 31 January 2026, and exclude a further $1.4B of time deposits carried at cost (pp. 13–14). Strategic investments fell to $66.3M from $76.8M. The change versus Q1 2026 is the realised gain line: $36.4M of realised gains on sales of privately held equity securities this quarter against nil a year earlier, when the company instead booked $1.6M of unrealised losses (p. 14). This single item is larger than the quarter’s reported net income attributable to CrowdStrike and is not repeatable; any read of “profitability” that ignores it is wrong.
Note 3 — Financing Receivables (10-Q p. 15) The vendor-financing book grew again: gross short-term receivables $107.5M (from $81.7M) and gross long-term $239.5M (from $213.6M) since 31 January 2026, with the allowance for credit losses rising to $2.4M and $3.0M respectively. [Rating and price target withdrawn — see the note at the top.] Management states there was no significant allowance activity and no material past-due amounts in either quarter. [Rating and price target withdrawn — see the note at the top.]
Note 4 — Balance Sheet Components (10-Q pp. 15–17) Property and equipment, net rose to $1,066.2M from $976.3M, with construction in progress of $282.4M including $225.0M of data-centre equipment purchased but not yet in service (p. 16). Depreciation and amortisation of property and equipment was $75.5M versus $56.4M in Q1 2026. Intangible assets, net more than doubled to $285.7M from $136.7M on the two acquisitions, and goodwill rose to $2,267.5M from $1,363.3M — $886.6M acquired plus $17.6M of FX translation (p. 17). Accrued commissions fell to $144.8M from $207.4M, the normal post-Q4 payout. Significance: goodwill is now 20.1% of total assets and all of it sits in a single reporting unit tested qualitatively; the amortising intangible base is small relative to the price paid.
Note 5 — Debt (10-Q pp. 17–18) The capital structure is unchanged from Q1 2026: $750.0M of 3.00% Senior Notes maturing February 2029, carried at $745.8M, with interest expense of $6.0M in both quarters. The indenture covenants restrict liens, subsidiary guarantees, dividends and mergers, and “As of April 30, 2026, the Company was in compliance with all of its financial covenants under the Indenture” (p. 18). Fair value is $715.4M against $718.2M at 31 January 2026 — below par. The one change since the 10-K is the expiry of the undrawn $750.0M revolver in January 2026, which reduced interest expense this quarter by removing the amortisation of its issuance costs (p. 44). No refinancing risk before 2029 and no covenant pressure against a net cash position of $3,807.0M.
Note 6 — Income Taxes (10-Q pp. 18–19) [Rating and price target withdrawn — see the note at the top.] The benefit came from deferred tax assets realised in connection with the recent acquisitions and from excess tax benefits (p. 18). [Rating and price target withdrawn — see the note at the top.] The full valuation allowance on U.S. federal, state and certain foreign deferred tax assets is retained and reassessed quarterly (p. 19). Significance: this is a company recording a tax benefit while still holding a full valuation allowance — the tax line contributed to the GAAP profit and cannot be annualised; a future release of the allowance would create a large one-off gain that is not operating improvement.
Note 7 — Leases (10-Q p. 19) Non-cancelable operating lease liabilities have a present value of $75.5M against undiscounted payments of $85.9M running to fiscal 2039. A further $103.7M of undiscounted minimum payments relates to leases not yet commenced, expected to start in October 2026 and August 2027 on 11.2- to 11.3-year terms (p. 19). Immaterial against the balance sheet, but the not-yet-commenced amount is larger than the recognised liability and belongs in any fixed-cost view.
Note 8 — Stock-Based Compensation (10-Q pp. 20–23) Total SBC expense was $297.7M this quarter versus $247.7M in Q1 2026, or 21.5% of revenue, with the largest increases in R&D ($125.8M from $104.1M) and G&A ($70.3M from $46.3M) (p. 23). Unrecognised expense has grown to $2.4B on unvested RSUs (2.6-year weighted-average vesting), plus $351.5M on PSUs, $258.0M on the Special PSU Awards and $42.0M on options (pp. 20–22). A new 2027 Special PSU Award of 175,000 target units (up to 350,000) was granted on relative-TSR terms against the S&P 500 over the period to December 2028, alongside the existing 2026 award (p. 21). Significance: SBC in this single quarter is more than ten times the quarter’s reported net income and 1.7 times the $175.6M of buybacks executed — the repurchase programme offsets 59.0% of quarterly SBC and does not neutralise dilution.
Note 9 — Revenue, Deferred Revenue and Remaining Performance Obligations (10-Q pp. 23–25) Revenue by region: United States $913.7M (66%), EMEA $235.3M (17%), Asia Pacific $146.2M (11%), Other $90.4M (6%), against 67%/16%/10%/7% a year earlier — a modest mix shift out of the U.S. (p. 23). Deferred revenue ended at $4,722.2M versus $3,771.4M a year earlier, and remaining performance obligations are $8.8B, of which 52% is expected to be recognised within 12 months and 42% in months 13–36 (p. 24). The costs-to-obtain policy is where the five-year period of benefit is now stated in the accounting language itself: commissions on initial contracts and upsells “are amortized over an estimated period of benefit of five years” (p. 24) — in Q1 2026 the same sentence read four years. Significance: RPO gives good near-term revenue visibility, and the policy wording confirms the estimate change is now embedded in the revenue-cost accounting, not a one-quarter adjustment.
Note 10 — Commitments and Contingencies, incl. the July 19 Incident (10-Q pp. 25–28) See the dedicated contingencies entry below; the non-litigation content is here. Non-cancelable purchase obligations in excess of one year total $2,618.8M at 30 April 2026, weighted to fiscal 2028–2030 ($678.8M / $680.8M / $520.4M) (p. 27) — versus approximately $2.77B at 31 January 2026 per the 10-K. Materially, “Subsequent to April 30, 2026, the Company entered into a non-cancellable purchase commitment in the amount of $1.7 billion, commencing from the second quarter of fiscal 2027 through fiscal 2037”, excluded from that table (p. 27). Off-balance-sheet unfunded loan commitments fell to $34.8M from $89.9M at year-end (p. 27). The July 19 incident accrual rolled from $15.5M to $17.1M on $18.1M of expenses incurred net of insurance and $16.5M of payments (p. 26); settlement offers to customers are “entirely offset by recoveries under the Company’s insurance policies” and therefore had no income-statement impact this quarter (p. 26). Significance: total committed cloud and data-centre spend after the post-quarter addition is roughly $4.3B — more than seven times the quarter’s operating cash flow — locked in against a growth outlook management itself describes as subject to elongated sales cycles.
Note 11 — Acquisitions (10-Q pp. 28–30) Two deals closed inside the quarter. SGNL.AI closed 20 February 2026 for $627.9M cash net of cash acquired plus $9.2M of replacement awards, allocated to developed technology of $87.9M (96-month life), net tangible liabilities of $11.9M and goodwill of $561.1M (p. 28). Seraphic Algorithms closed 3 February 2026 for $327.5M cash net plus $13.7M of replacement awards, allocated to developed technology of $69.8M (96 months), net tangible liabilities of $16.0M and goodwill of $325.5M (pp. 28–29). Both allocations are preliminary. Pangea ($209.9M goodwill) and Onum ($233.1M goodwill) closed in FY2026 and are restated here for reference (pp. 29–30). Q1 2026 contained no acquisitions at all. Significance: $886.6M of goodwill added in one quarter against $157.7M of identifiable developed technology — 85% of the value acquired is unamortised and untested, and it lands in the single reporting unit described in Note 4.
Note 12 — Net Income (Loss) Per Share (10-Q pp. 30–31) Basic and diluted EPS are both $0.11 on 253,732k basic and 257,881k diluted weighted-average shares, against -$0.44 on 248,432k shares in Q1 2026 where basic and diluted were identical because all equivalents were antidilutive in a loss period (p. 31). Diluted share count is therefore up 3.8% YoY, and the dilutive effect of equivalents (4,149k shares) enters the calculation for the first time. Antidilutive exclusions collapsed to 1,082k from 12,093k. Founders’ holdbacks of $43.8M settle in a variable number of shares; 3,492 shares were issued this quarter at a weighted-average $439.30 (p. 31). Significance: the return to profit mechanically brings 4.1M shares into the denominator, so EPS growth will lag net-income growth from here.
Note 13 — Segment Information (10-Q p. 31) One operating and reportable segment; the CODM is the CEO and uses consolidated net income to measure segment profit. Confirmed unchanged vs. Q1 2026 (10-Q p. 31). Property and equipment plus operating lease ROU assets are $1,136.3M, of which $947.1M is in the United States and $102.3M in Germany (p. 32). No analytical implication beyond the absence of any segment-level margin disclosure to test the commission-change effect against.
Note 14 — Strategic Plan (10-Q p. 32) The May 2025 restructuring — roughly 500 roles, 5% of the global workforce — was “substantially completed as of April 30, 2026”, with the residual liability down to $42k from $66k and $24k of payments in the quarter (p. 32). Q1 2026 carried the charge; this quarter carries essentially none, and MD&A separately identifies a $6.6M YoY reduction in Strategic Plan charges as a driver of the G&A line (p. 43). Significance: a real but small YoY tailwind to operating expense that will not repeat.
Note 15 — Share Repurchases (10-Q p. 32) The authorisation was raised by $500.0M on 6 April 2026 to $1.5B in total, and the company executed its first purchases under it: 480k shares for $175.6M in the quarter, leaving $1.3B available (p. 32). Item 2 breaks this into February 144k at $351.99, March 269k at $371.31 and April 67k at $372.20 average price paid per share (p. 83). Q1 2026 had no repurchases at all — the programme was only announced in June 2025. Significance: the buyback is real cash return, but shares issued and outstanding still rose from 253,363k to 254,537k over the quarter (p. 9), and the $175.6M spent is 59.0% of the quarter’s $297.7M SBC charge. All purchases were executed at pre-split prices between $352 and $372 — well above the DCF base value of $11.92 on a post-split-equivalent basis.
Note 16 — Revision of Prior Period Financial Statements (10-Q p. 33) The immaterial SBC-timing error identified in Q4 FY2026 required revision of the Q1 2026 interim comparatives. As revised, Q1 2026 total cost of revenue is $287.9M (from $289.1M as reported), gross profit $815.6M (from $814.3M), loss from operations $(118.7)M (from $(124.7)M) and net loss attributable to CrowdStrike $(104.3)M (from $(110.2)M), with EPS $(0.42) rather than $(0.44); there was no cash-flow impact and the equity effect is a $36.5M reclassification between APIC and accumulated deficit (p. 33). This section’s Q1 2026 comparatives are the as-originally-reported figures, consistent with the workbook’s as-reported convention. The practical effect is that the YoY improvement shown in 7.1 is $5.9M larger at both the operating and net lines than a like-for-like revised comparison would give: EBIT improvement of +$94.1M as reported versus +$88.1M revised, which raises the commission-change share of the improvement from about 30% to about 32%. Significance: the direction of the analysis is unchanged, but the revised basis makes the accounting change a larger, not smaller, share of the improvement.
Note 17 — Subsequent Event (10-Q p. 34) See the subsequent-events entry below.
Related-party transactions (10-Q pp. 28–29, 47; Note 1 p. 11) CrowdStrike has no controlling shareholder and no dual-class control block — the Class B stock was retired in December 2024 — so there is no parent-company related-party stream. The material related-party structure is the Falcon Funds: CrowdStrike committed up to $10.0M to the Original Falcon Fund and $50.0M to Falcon Fund II for 50% of each fund’s sharing percentage, with entities associated with Accel committing the matching $10.0M and $50.0M for the other 50% (10-Q p. 47). CrowdStrike is the manager, controls investment decisions, and consolidates both funds; the Accel side is the non-controlling interest on the balance sheet. Transactions with those non-controlling holders in the quarter, with the Q1 2026 comparison:
| Falcon Funds / non-controlling interest item | Q1 2027 | Q1 2026 |
|---|---|---|
| Net income (loss) attributed to non-controlling interest | $18.192M | $(0.786)M |
| Cash distributions to non-controlling interest holders | $(20.952)M | $0.000M |
| Capital contributions from non-controlling interest holders | $0.000M | $1.500M |
| Non-controlling interest carried in equity, period end | $41.455M | $40.137M |
| Gain on the Seraphic remeasurement attributed to NCI | $15.500M | not applicable |
Source: CRWD 10-Q for the quarter ended April 30, 2026 — Condensed Consolidated Statements of Stockholders’ Equity, p. 9; Condensed Consolidated Statements of Cash Flows, p. 10; Note 11, pp. 28–29.
The transaction that matters is Seraphic. [Rating and price target withdrawn — see the note at the top.] In plain terms: CrowdStrike bought a company its own Accel-co-invested fund was already a shareholder in, and the buy-out crystallised a roughly $31.0M gain, half of which accrued to the Accel side. The terms of the fund arrangements themselves are unchanged from Q1 2026 (10-Q p. 47). This is disclosed, consolidated and small, but it is an acquisition pipeline that runs through a related-party vehicle and produces accounting gains on exercise, and $18.2M of this quarter’s consolidated net income was attributed away to those holders. Full Item 13 related-party terms are incorporated by reference to the proxy, which is not part of this filing and should be reviewed separately.
Contingencies and litigation (10-Q pp. 25–27) Four matters, and the picture changed materially versus the 10-K:
- Airline passenger class actions (W.D. Tex.) — consolidated negligence and public nuisance claims by passengers whose flights were delayed or cancelled, unspecified damages. Dismissed by the district court on 18 June 2025; on 20 May 2026 the Fifth Circuit affirmed the dismissal (p. 25). Resolved in the company’s favour, after quarter-end.
- Shareholder derivative actions — three W.D. Texas suits consolidated in November 2024 were dismissed on 16 April 2026; two further W.D. Texas suits were dismissed on 7 April 2026; two Delaware Chancery suits were dismissed on 18 March 2026 (pp. 25–26). All derivative litigation is now resolved.
- Delta Air Lines (Fulton County, Georgia) — computer trespass, trespass to personalty, breach of contract, fraud by omission, strict-liability product defect, gross negligence and deceptive-practices claims, seeking unspecified compensatory and punitive damages. The motion to dismiss was granted in part and denied in part on 16 May 2025 and “Discovery is ongoing” (p. 26). Unchanged versus the 10-K and still live. No amount is accrued and no loss is estimable.
- DOJ and SEC inquiry — “The Company has received requests for information from the U.S. Department of Justice and the U.S. Securities and Exchange Commission relating to the Company’s recognition of revenue and reporting of ARR for transactions with certain customers, the July 19 Incident and related matters” (p. 26). Repeated verbatim from the 10-K and therefore still open. No accrual; management states a loss is reasonably possible but not estimable.
The accounting treatment is unchanged from Q1 2026: no accrual where a loss is reasonably possible but not estimable, and the company warns that “unfavorable or unexpected developments or outcomes could result in a material impact to the Company’s results of operations” (p. 26). Analytical significance: the private-litigation tail from July 19 has shrunk to a single matter, which is a genuine de-risking. The DOJ/SEC inquiry has not moved at all — and it concerns exactly the two metrics this equity is valued on, subscription revenue recognition and ARR, in the same quarter in which the company changed a revenue-related cost estimate in its own favour. §
Subsequent events (10-Q p. 34, and p. 27) Three post-quarter items are disclosed. First, the 4-for-1 forward stock split: approved 3 June 2026, effected as a stock dividend, record date 25 June 2026, three additional shares delivered per share after the close on 1 July 2026, split-adjusted trading from 2 July 2026 (p. 34). The 10-Q presents pro-forma per-share figures for every period: on the post-split basis the quarter’s basic and diluted EPS are $0.03 on 1,014,928k basic and 1,031,524k diluted weighted-average shares. Every per-share figure in this section is pre-split; the $214.42 market price and the $148.54 target used elsewhere in this report are post-split, and the two bases cannot be compared without applying the 4× factor. Second, the $1.7B non-cancelable purchase commitment entered after 30 April 2026 and running through fiscal 2037, excluded from the quarter-end obligations table (p. 27). Third, the Fifth Circuit’s 20 May 2026 affirmance of the airline class-action dismissal (p. 25). Disclosure controls were concluded effective as of 30 April 2026 and there was no change in internal control over financial reporting during the quarter (10-Q pp. 48–49).
7.5 What Changed This Quarter
sources - The first GAAP net profit since FY2024: $27.8M against -$110.2M a year earlier (+125.2% YoY). This is the single biggest change and it addresses the thesis’ weakest point directly. The company itself now lists profitability “in certain periods, including the first quarter of fiscal 2027” in its risk factors (10-Q p. 45). But the operating line is still a loss of -$30.6M: the profit is manufactured below EBIT by $40.5M of interest income, $36.4M of one-off realised investment gains and a $6.9M tax benefit (10-Q p. 7). - The commission amortisation period was lengthened from four years to five, effective this quarter, reducing sales commission expense by $27.9M (10-Q Note 1, p. 11). That is about 30% of the $94.1M YoY improvement in EBIT and 2.0 pp of the 9.1 pp improvement in EBIT margin — and it is almost exactly equal to the entire $27.8M of net income attributable to CrowdStrike. Without it, and before any tax gross-up, the quarter would have been at best around break-even at the GAAP net line. For the thesis this means the reported margin trajectory cannot be extrapolated: FY2028 will be the first year with a clean like-for-like comparison. - The five-year growth deceleration broke: revenue +25.6% YoY, with ARR growth accelerating from 22% to 24% and net new ARR of $255.8M against $193.8M (10-Q p. 37). This is the single strongest piece of evidence against this report’s own thesis, and it deserves to be stated before it is qualified. [Rating and price target withdrawn — see the note at the top.] On the other side, three things in the filing argue that part of the acceleration is rebound rather than new demand. First, Q1 2026 is a suppressed comparative: management states the July 19 commitment packages “have resulted, and are expected to continue to result, in increased contraction, due to elongated subscription terms, and decreased upsell dollar values” (10-Q p. 36) — the drag was compressing the base year and has not ended. [Rating and price target withdrawn — see the note at the top.] Third, Onum and Pangea (closed September 2025) and Seraphic and SGNL (closed in this quarter) all contribute to Q1 2027 revenue and none to Q1 2026; the company describes each as immaterial individually (10-Q pp. 28–30) but never quantifies them in aggregate, so an unmeasured part of the 3.9-point acceleration is inorganic. [Rating and price target withdrawn — see the note at the top.] - $886.6M of goodwill was added in one quarter from SGNL ($561.1M) and Seraphic ($325.5M), lifting goodwill to $2,267.5M — 20.1% of total assets — against $157.7M of identifiable developed technology (10-Q pp. 17, 28–29). All of it sits in a single reporting unit tested qualitatively first. The company spent $881.4M of cash on these deals in a quarter in which it generated $590.9M of operating cash flow. - The buyback started, and it is not keeping up with dilution. The authorisation was raised to $1.5B on 6 April 2026 and 480k shares were repurchased for $175.6M — the first purchases ever executed under the programme (10-Q pp. 32, 83). Against $297.7M of SBC in the same quarter, shares outstanding still rose from 253,363k to 254,537k. Capital return is offsetting 59.0% of one quarter’s equity compensation. - The July 19 private-litigation tail collapsed, but the regulatory tail did not. The Fifth Circuit affirmed dismissal of the airline class action on 20 May 2026 and all derivative suits were dismissed between March and April 2026 (10-Q pp. 25–26). The Delta suit is in discovery and the DOJ/SEC inquiry into revenue recognition and ARR reporting is repeated word-for-word from the 10-K — still open, still unaccrued, still not estimable (10-Q p. 26). - Committed off-balance-sheet spend escalated. Purchase obligations of $2,618.8M at quarter-end plus a further $1.7B commitment entered after 30 April 2026 running to fiscal 2037 (10-Q p. 27) take total committed cloud and data-centre spend to roughly $4.3B — a fixed obligation payable whether or not growth holds. - Every per-share figure in this section is pre-split. The 4-for-1 split has a record date of 25 June 2026 and split-adjusted trading from 2 July 2026 (10-Q p. 34); post-split, the quarter’s diluted EPS is $0.03. Annualising that gives roughly $0.12 of post-split GAAP earnings against a $214.42 share price — the profitability inflection is real in sign and negligible in size relative to the price.
7.6 Portfolio Decision
sources [Rating and price target withdrawn — see the note at the top.] Two of this report’s load-bearing bear arguments weakened this quarter, and both should be conceded before anything is argued. First, the claim that CrowdStrike had never sustainably earned a GAAP profit: it earned $27.8M, with free cash flow of $470.7M up +67.6% YoY and gross margin up +1.5 pp to 75.3%. Second, and more important, the claim that growth decelerates monotonically: revenue grew +25.6% YoY against the 22.0% assumed in the DCF’s first year, and ARR growth accelerated from 22% to 24% (10-Q p. 37). The valuation memo named re-accelerating growth as one of only three developments that would break the bear case, and it happened. That has to be scored honestly.
It does not change the call, for a reason that is arithmetic rather than rhetorical. In this model 85% of enterprise value sits in the terminal value, so near-term growth barely moves fair value. Re-running the base DCF with first-year growth at the delivered 25.6% instead of 22.0% lifts enterprise value 3.0% and fair value per share 1.9%, about $0.23. Assume the acceleration is durable and lift the entire five-year growth path by 3.6 points and fair value rises 10.5%. Lift the whole path and raise terminal growth from 3% to 4% — an aggressive reading of one quarter — and fair value rises 19.7%, to roughly $14.27. Against a $214.42 share price the downside on that most generous case is still about -93%, versus -94.4% in the base case. The gap is not created by the growth assumption and cannot be closed by fixing it; it is created by margins, the terminal multiple and the price.
The quality of the reported profit is the second reason. Operating income was still negative at -$30.6M; $27.9M of the $94.1M YoY operating improvement is the commission amortisation change (10-Q Note 1, p. 11), not operating leverage; and the entire net profit is bridged from that operating loss by $40.5M of interest income, a $36.4M non-repeating realised investment gain and a $6.9M tax benefit booked while a full deferred-tax valuation allowance is still retained (10-Q pp. 7, 18–19). Strip the accounting change and the investment gain and the quarter is an operating loss of roughly $58.5M and a net result around break-even. The footnote review adds two further weights: $886.6M of goodwill added in one quarter into a single qualitatively-tested reporting unit, and a DOJ/SEC inquiry into revenue recognition and ARR reporting repeated verbatim from the 10-K, still open and unaccrued (10-Q p. 26) — an inquiry into the precise metric that just accelerated. [Rating and price target withdrawn — see the note at the top.]
What would change this view: - Upgrade condition: ARR growth holding at or above the 24% recorded at 30 April 2026 for two further quarters — which would make the re-acceleration a trend rather than a rebound off a suppressed base — combined with two consecutive quarters of positive GAAP operating income after neutralising a commission-estimate benefit of the $27.9M order, i.e. reported EBIT above roughly +$28M against -$30.6M this quarter. Growth alone is not sufficient: on this model even a durably higher growth path leaves fair value near $13, so an upgrade requires the margin assumptions to be wrong, not just the growth ones. [Rating and price target withdrawn — see the note at the top.] - Downgrade condition: Any escalation in the DOJ/SEC matter from “not possible to estimate” to a Wells notice, subpoena or recorded accrual (10-Q p. 26); an adverse Delta ruling or a settlement of material size; or ARR growth falling back below the 22% recorded at 30 April 2025 while the $2,618.8M of purchase obligations plus the post-quarter $1.7B commitment (10-Q p. 27) remain fixed. Any of these would move the action to EXIT.
Report Versions
Every published version of this report, newest first — each one kept so a reader can see what changed and when.
| Version date | Files |
|---|---|
| 2026-08-11 Current | Model (Excel) |