
Catalyst Pharmaceuticals
Section 1 — Business Overview, Operations & Competitive Positioning
sources
1.1 The Business
sources Catalyst Pharmaceuticals was a U.S. rare-disease specialty pharmaceutical company that made money not by discovering drugs but by acquiring or in-licensing the rights to already-approved orphan therapies and then selling them, at high per-patient prices, into very small and hard-to-identify patient populations through a tightly controlled specialty-pharmacy channel. [Rating and price target withdrawn — see the note at the top.]
At the close of its life as a standalone public company, Catalyst marketed three commercial products — FIRDAPSE (amifampridine) for Lambert-Eaton myasthenic syndrome (LEMS), AGAMREE (vamorolone) for Duchenne muscular dystrophy (DMD), and FYCOMPA (perampanel) for epilepsy — and generated revenue of $589.0M in FY2025. FIRDAPSE was the lead product and the economic engine; AGAMREE was the growth product; FYCOMPA was a legacy franchise in deliberate, generic-driven decline. Operations were overwhelmingly U.S.-based and the workforce was predominantly commercial in composition — a field sales force, market-access and patient-services staff, and medical liaisons — consistent with a company that commercialised acquired products rather than running laboratories. The stock traded on Nasdaq under CPRX until its acquisition. §
The arc of the business is best read through its revenue. Through FY2018 Catalyst was effectively pre-revenue and ran consistent operating losses: it recorded $0.0M, $0.0M and $0.0M in the three years to 2017 and only $0.5M in 2018. The FIRDAPSE launch in early 2019 changed the company’s economics in a single step — revenue reached $102.3M in FY2019 and $119.1M in FY2020 — and each subsequent purchase added a further, visible step. Revenue climbed to $140.8M in FY2021, $214.2M in FY2022 and $398.2M in FY2023 as the FYCOMPA franchise was absorbed, then to $491.7M in FY2024 and $589.0M in FY2025 as AGAMREE launched and scaled. The transformation from a loss-making shell to a substantially profitable, cash-generative platform is the story of this position, and it was achieved by buying commercial rights, not by inventing molecules.
Key Information
| Item | Value |
|---|---|
| Ticker | CPRX |
| Sector / Industry | Health Care / Specialty Pharma |
| Report Date | 2026-08-10 |
| Most Recent FY Revenue | $589.0M |
| EBIT Margin (Most Recent FY) | 43.8% |
| Diluted Weighted-Average Shares | 127M |
| Last Price (delisted) | $31.50 |
| Status | [Rating and price target withdrawn — see the note at the top.] |
| Cash Consideration / Share | $31.50 |
| Position | [Rating and price target withdrawn — see the note at the top.] |
Source: Company SEC filings (10-K); see Appendix A.1.
1.2 Operating Segments
sources Catalyst reported as a single segment — the development and commercialisation of drug products — but the economics were driven at the product level, and the three products behaved very differently. The company disaggregated revenue by product, which made the underlying dynamics transparent rather than buried in a segment reshuffle.
FIRDAPSE was the foundation of the business. It was the first FDA-approved treatment for LEMS, a rare autoimmune neuromuscular disorder, launched in the U.S. in early 2019 and subsequently expanded to pediatric patients and a higher maximum daily dose. The single economic variable that drove FIRDAPSE was patient identification: LEMS is small, frequently associated with an underlying small-cell lung cancer, and management estimated that only roughly half of U.S. patients were diagnosed. Growth therefore came primarily from finding undiagnosed and misdiagnosed patients — a slow, education-led process rather than a pricing or reimbursement lever — supported by the addition of LEMS guidance to the NCCN oncology guidelines. FIRDAPSE dominated revenue and profit, and that dominance is the central structural fact of the portfolio (discussed as a risk below and developed in Section 2).
AGAMREE was the growth product. Licensed from Santhera Pharmaceuticals for North America, approved in late 2023 and launched in early 2024, it is a differentiated corticosteroid for DMD positioned as a better-tolerated alternative within a drug class management regarded as the foundational standard of care. Its economic driver was share capture within an established, competitive steroid market rather than the discovery of new patients, and it carried the longest runway of regulatory protection of the three products. AGAMREE was the reason revenue stepped up in FY2024 and FY2025, and the reason the company began building inventory and transitioning manufacturing ahead of scale.
FYCOMPA was a legacy franchise in managed decline. Acquired from Eisai as an asset purchase together with a long-term supply agreement, it is an anti-epileptic AMPA-receptor antagonist carrying a boxed warning for serious psychiatric and behavioral events. Its defining variable had become generic erosion: FYCOMPA lost patent exclusivity, multiple generic versions of both the tablet and oral-suspension formulations entered the market, management ceased active marketing effective at the end of 2025, and it expected revenue to keep falling. FYCOMPA was being run for the residual cash it still produced, not grown.
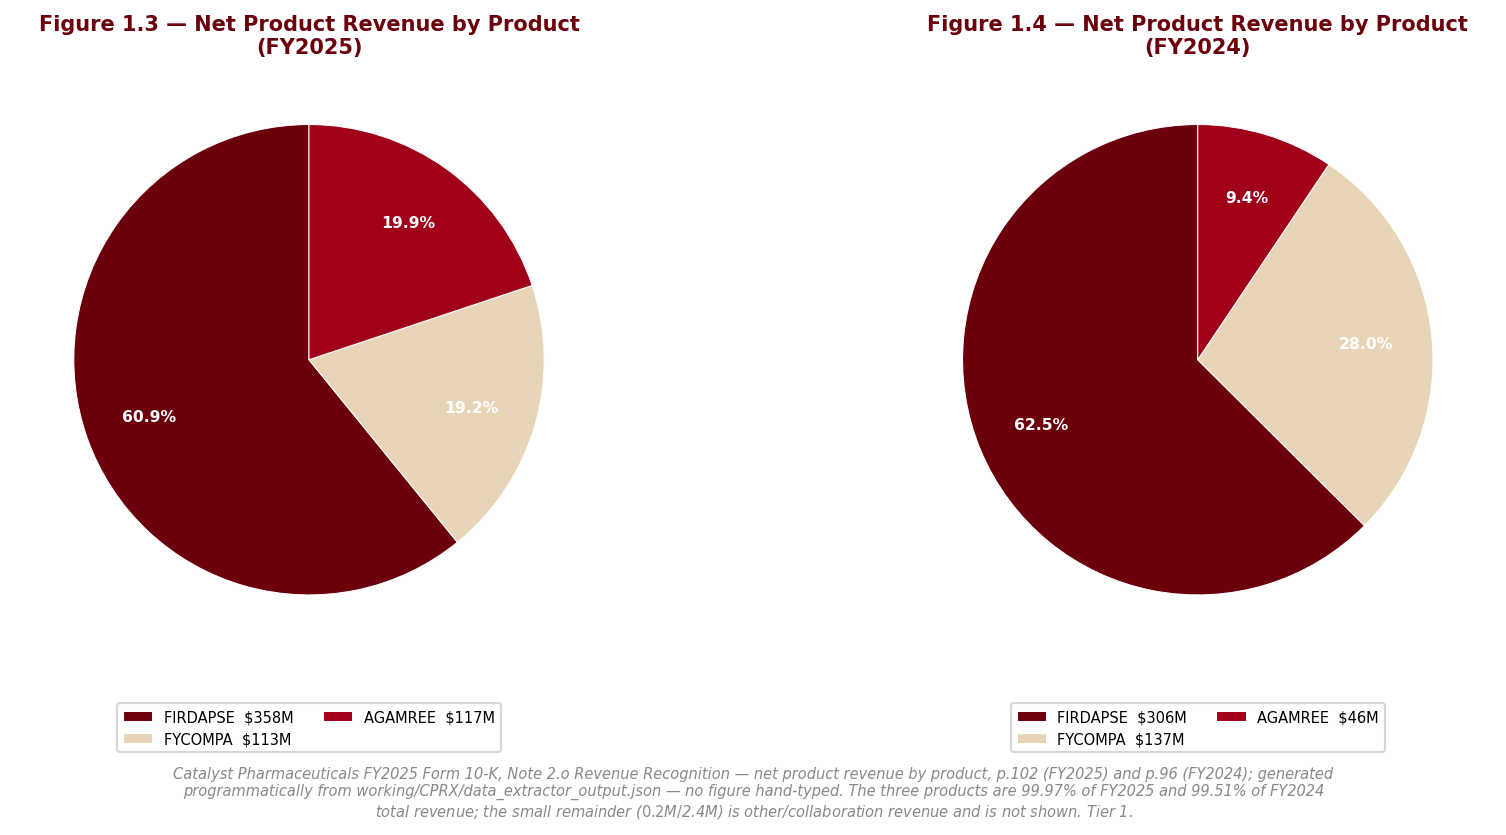
Figures 1.3 and 1.4 set the FY2025 revenue mix beside FY2024 and make the reshaping visible in one step: AGAMREE roughly doubled its share of net product revenue in a single year while FYCOMPA’s fell by nearly a third on generic entry, leaving FIRDAPSE’s share broadly unchanged as the anchor. The franchise did not simply grow — it rotated, replacing a declining legacy product with a launch asset, and the two pies show that rotation happening inside one twelve-month period.
As a system, the portfolio worked as a shared commercial platform: a single rare-disease sales, market-access and patient-services infrastructure that could be pointed at a newly acquired asset. That is the flywheel — the established U.S. commercial presence was the reusable capability that made the next acquisition accretive, and management said so explicitly. The fragility is the mirror image of that strength: two of the three products (FIRDAPSE and AGAMREE) drove essentially all of the growth, one product (FIRDAPSE) drove the bulk of profit, and the third (FYCOMPA) was structurally shrinking. A concentrated engine on a shared chassis is efficient when it works and exposed when a single product stumbles.
1.3 Geographic Exposure
sources Catalyst was, for practical purposes, a U.S. business. Its commercial organisation, its patient-support programs and the overwhelming majority of its revenue were domestic. Because it operated as a licensed “virtual” manufacturer with no in-house production, it relied entirely on third-party contract manufacturers and on its licensing partners for supply — a structural dependency addressed in Section 2 rather than a geographic revenue exposure.
Ex-U.S. activity was limited and, by management’s own characterisation, immaterial. FIRDAPSE was commercialised for LEMS in Canada through sublicensee KYE Pharmaceuticals and in Japan through DyDo Pharma, which launched the product in early 2025; AGAMREE was licensed to KYE for Canada and, through Santhera, reached several European and other markets that sat with the licensor rather than with Catalyst directly. In each case Catalyst earned milestones and a transfer price or royalty rather than direct in-market sales, and management expected these arrangements to remain immaterial in the near term. Direct operating currency exposure was therefore minimal; the one meaningful non-dollar exposure — the Swiss-franc-denominated equity stake in Santhera — was financial rather than commercial and is addressed in the financial sections.
1.4 Management Team
sources Catalyst’s leadership operated a lean, commercially-oriented organisation, and the chief executive served as the chief operating decision-maker reviewing the business on a consolidated basis — appropriate for a single-segment company of this size. Governance was clean and unencumbered: there was no controlling shareholder, a single class of common stock with one vote per share, and no material related-party transactions in recent years. For an outside investor assessing the reliability of the reported earnings that ultimately supported the cash exit, the absence of dual-class structures, controlling blocks or related-party leakage is a genuine positive.
The principal management risk was concentration of institutional knowledge in a small number of key people. The company had no employment or retention agreements with most of its officers and key employees and carried no key-man insurance, so the departure of a senior figure was a real operational exposure rather than a formality. That exposure was tested during 2025, when a former executive officer retired and the company recorded a stock-based compensation charge on the separation; notably, there was no CEO change, no restatement and no disruption to the reporting narrative, which suggests the transition was managed within an established team. The auditor, Grant Thornton, had served since 2006 and issued clean, unqualified opinions on both the financial statements and internal controls — a long, stable relationship rather than a recent or contentious appointment. The fair reading is a competent, disciplined commercial team with a thin bench: effective at running the model it had built, but structurally dependent on continuity of a few individuals.
1.5 Capital Allocation Track Record
| Year | Dividends Paid ($M) | Share Repurchases ($M) | CapEx ($M) |
|---|---|---|---|
| FY2021 | — | $12.1M | $1.0M |
| FY2022 | — | $6.9M | $0.0M |
| FY2023 | — | — | $0.2M |
| FY2024 | — | — | $0.6M |
| FY2025 | — | $25.3M | $0.1M |
Source: Company SEC filings (10-K); see Appendix A.1.
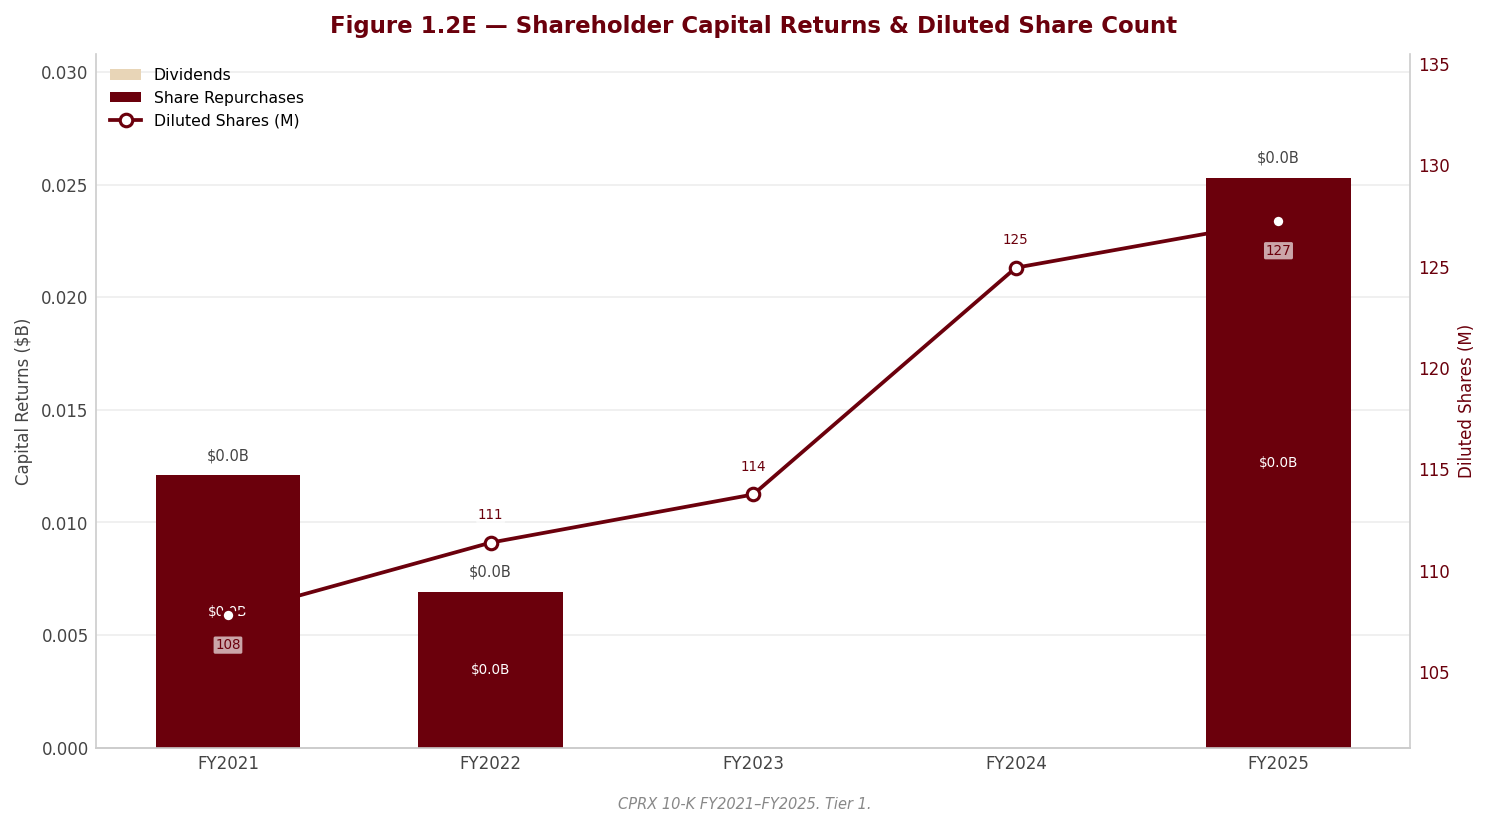
Catalyst’s capital-allocation posture was conservative by design and revealing about management’s priorities. The company never declared or paid a cash dividend and told investors plainly that any return depended on share-price appreciation, not income. It carried no funded debt, no pension and no meaningful lease obligations, and — as a virtual manufacturer with no plants to build or maintain — required only minimal capital expenditure to run the business. The result was a company that accumulated a large cash balance relative to its size.
That cash was not idle capital held for its own sake; it was explicitly earmarked for business development — the acquisition or in-licensing of the next orphan asset that management described as the primary lever for creating value. The clearest signal of confidence in the standalone model came late: in October 2025 the board authorised a new share-repurchase program running through the end of 2026, funded from cash on hand, with management stating it believed it could execute the buyback without impairing its acquisition strategy. In other words, capital was neither returned as a dividend nor sunk into fixed assets; it was held as strategic optionality for the next deal, with a buyback layered on top once the balance sheet had grown comfortably beyond operating needs. For a business whose entire growth model depended on having cash ready to deploy when a suitable asset appeared, holding a war chest rather than distributing it was internally consistent — though it also meant shareholders were asked to trust management’s deal-making, since no definitive acquisition had been signed as of the final annual report.
1.6 Competitive Positioning & Moat
sources Industry structure. Returns in ultra-orphan pharmaceuticals are earned in an unusual way. Because the target patient populations are tiny, a product cannot rely on volume; it must achieve high market penetration within a small identified population and command a high per-patient price to generate meaningful gross margins. The winners are companies that secure the approved, on-label standard for a disease with no good alternatives, protect it with regulatory exclusivity and patents, and build a specialised channel and patient-support apparatus that competitors find uneconomic to replicate for so few patients. Catalyst’s model fit this template precisely — and its low R&D burden and royalty-based cost of sales meant that, once a product was established, the incremental economics were highly attractive.
Competitive advantages. The moat was regulatory and legal, not technological. FIRDAPSE was the first FDA-approved, on-label treatment for LEMS in a market that had previously relied on unapproved, compounded and off-label therapies, and orphan-drug exclusivity plus a patent estate extending into the 2030s were what protected its pricing. AGAMREE carried New Chemical Entity and orphan-drug exclusivity running further into the decade, giving it the longest protected runway in the portfolio. Around both products sat the second, subtler advantage: a purpose-built rare-disease commercial and patient-access infrastructure — a dedicated field force, insurance-navigation specialists and the branded patient-support and co-pay assistance programs — that lowered the barrier for patients to start and stay on therapy and that a generic entrant, competing on price alone, would not economically rebuild.
Competitive vulnerabilities. The moat’s weaknesses were structural and well understood. First, exclusivity is finite: FIRDAPSE’s orphan-drug exclusivity for LEMS expired in November 2025, after which the only remaining protection was the patent estate — and that estate was contested, with four generic filers having challenged the FIRDAPSE patents through the Paragraph IV process. FYCOMPA had already crossed to the other side of this cliff, its exclusivity lost and its revenue eroding under generic competition, and it stood as the clearest live demonstration of what the loss of protection does to an orphan franchise. Second, and most important, the business was acutely concentrated: FIRDAPSE dominated revenue and profit, and — a point developed in Section 2 — a single exclusive distributor accounted for the large majority of net product revenue, a share that had increased every year, making the entire top line dependent on one channel relationship. Third, growth depended on continuing to buy assets; with no discovery engine of its own, a period without an accretive acquisition would leave the company reliant on maturing products against approaching exclusivity dates.
Verdict. Catalyst’s competitive position was real but time-bounded. Its advantages generated genuinely high, cash-rich margins and were durable for as long as regulatory exclusivity and the patent estate held — which, for FIRDAPSE, meant the durability of the moat rested squarely on the outcome of patent litigation once orphan-drug exclusivity lapsed, and for AGAMREE on a longer but still finite protected window. The margin profile was structurally strong, but its long-run durability was always capped by the twin exposures of finite exclusivity and single-product, single-channel concentration. That combination — high current cash generation with a defined protection horizon and concentrated dependencies — is precisely the profile that lends itself to a clean cash valuation, which is how the position ultimately resolved.
Section 2 — Key Risks & Catalysts
sources
2.1 Downside Risks
sources Read as a closed position, Catalyst’s risk profile was dominated not by operational fragility but by two structural dependencies of the ultra-orphan model — a single distribution channel and a single, heavily judgmental revenue-deduction estimate — layered over one overhanging binary event, the loss of patent protection on the lead product. What follows is the set of risks the business actually carried into its final year, and how each stood or resolved by the time Angelini Pharma acquired the company for $31.50 per share in cash. The most important point for a reader is sequencing: the risk that a 10-K-only assessment would have ranked first — imminent generic competition to FIRDAPSE — had, in fact, cleared in the weeks before the deal was signed. The concentration and gross-to-net risks, by contrast, were live and unresolved at close, and are precisely what the acquirer was underwriting.
Risk 1 — Single-distributor customer and receivables concentration (worsening)
sources This was the primary business risk, and it was deteriorating. Catalyst sold FIRDAPSE and AGAMREE in the United States through one exclusive distributor, which in turn resold to a small group of exclusive specialty pharmacies (primarily AnovoRx). One customer accounted for the large majority — more than four-fifths — of total net product revenue in FY2025, and that share had risen in each of the last three fiscal years, from roughly two-thirds two years earlier. This is a structural, single-point-of-failure dependency, not a one-off: the filing states plainly that the distributor and specialty pharmacies “account for principally all of its trade receivables and net product revenues” for these products (Note 2.s, Concentration of Risk, p.106 / F-18). The consequence is that essentially the entire receivables balance sat with one counterparty as well — and that balance itself nearly doubled year over year, concentrating both revenue recognition and collection risk in a single relationship.
Two things make a rising concentration percentage more than a disclosure footnote. First, reported demand was one step removed from the patient: channel inventory held at the distributor or specialty-pharmacy level can distort any single period’s revenue. Second, the trend direction matters — a dependency that grows every year is increasing single-point-of-failure risk, not a stable operating characteristic. Loss, disruption, or even a change in payment behaviour at that one distributor (or at AnovoRx) would have immediately impaired the majority of revenue and receivables. For the exit, the durability of the top line rested heavily on the continuity of this one channel — a risk that stood entirely unresolved at close.
Probability: High | Timeframe: Immediate / structural | Status at close: Live and unresolved — this is a core exposure the acquirer inherited. Impact: A disruption at the single distributor would have impaired the large majority of net product revenue and essentially all trade receivables.
Risk 2 — Gross-to-net revenue-deduction estimation, elevated to a Critical Audit Matter
sources For a specialty-pharma issuer, reported net product revenue — the top line on which the entire valuation rests — is what remains after a large, judgmental set of gross-to-net deductions: chargebacks, government and Medicaid rebates, managed-care and payor rebates, co-pay assistance, returns and distributor fees. This is the single most subjective estimate in the accounts, and the auditor said so: Grant Thornton elevated the estimation of FYCOMPA Medicaid and Managed-Care rebates to a Critical Audit Matter, describing the work as “complex” and involving “significant judgment, particularly in assessing the reasonableness of estimated payor mix” (Auditor’s Report, p.91 / F-3). Notably, the area the auditor singled out was the product in decline, where payor mix and rebate dynamics were shifting fastest as generics took share. The on-balance-sheet accrued gross-to-net liability grew faster than revenue over the year, consistent with the rising weight of these deductions.
There is a second, growth-quality dimension to this risk that a reader must not miss. Part of FY2025 net-revenue growth did not come from selling more drug. Management disclosed that it renegotiated a contract with a customer under which it now pays reduced fees — recorded, in its own words, “as a reduction in gross-to-net expenses” (MD&A, p.76). Lower deductions mechanically lift reported net revenue. That is a favourable one-time contractual change, not organic volume, and it is not extrapolable growth. The same renegotiation shifted the customer’s payment cadence from semi-monthly to monthly, so that a large receipt — a sum in the tens of millions — that would have been collected at end-December 2025 under the prior terms was instead received on 2 January 2026, which is the principal reason the receivables balance surged and operating cash flow fell despite higher earnings. Management asserted prior-period true-ups had been immaterial in all periods and the auditor obtained comfort through sensitivity and claims testing, so this is a matter of high estimation uncertainty rather than evidence of manipulation. But the absence of a category-level gross-to-net roll-forward — the granular table many peers disclose — limits an outside analyst’s ability to independently test reserve adequacy, and it is where any future revenue surprise would have originated.
Probability: Medium (estimation uncertainty, not a control failure) | Timeframe: Ongoing / structural | Status at close: Live. Impact: Net product revenue is stated after the hardest estimate in the audit; a portion of FY2025 growth reflected a fee reduction rather than demand and should not be annualised.
Risk 3 — FIRDAPSE loss of exclusivity and generic patent litigation (the dominant 10-K risk — resolved before the deal)
sources On the face of the FY2025 10-K, this was the single largest risk the company carried, and a risk assessment written from that document alone would have led with it — and would have been wrong within months. The mechanics were stark: FIRDAPSE’s seven-year orphan-drug exclusivity for LEMS had already expired in November 2025, removing the regulatory wall that had protected the lead product’s pricing, leaving only a contested patent estate between FIRDAPSE and generic entry. Four generic filers — Teva, Inventia, Lupin and Hetero — had challenged the FIRDAPSE patents through the Paragraph IV (Hatch-Waxman) process, and the outcome of such litigation is never certain. Because FIRDAPSE drove the bulk of revenue and profit, an adverse ruling that let a generic in early would have collapsed the economics of the entire business.
The resolution is the most important fact in this section, and its timing is decisive. All four challengers settled. Teva settled to a February 2035 entry date; Lupin settled in August 2025 on substantially the same terms; Inventia acknowledged the validity and infringement of the patents; and the last remaining defendant, Hetero — whose case was scheduled for trial and represented the single largest unresolved contingency in the 10-K — settled on 6 May 2026, agreeing not to market a generic version of FIRDAPSE in the United States any earlier than January 2035, in exchange for an $11.0 million litigation-avoidance fee recognised in second-quarter 2026 general and administrative expense (Q1 FY2026 10-Q, Note 17, Subsequent Events, p.34). With that, FIRDAPSE’s U.S. exclusivity was effectively protected to roughly January 2035. Angelini Pharma signed the merger agreement to acquire Catalyst on the same day — 6 May 2026. The inference is difficult to avoid: the acquirer committed at the precise moment the patent overhang cleared. The overhang that dominated the standalone risk narrative was, in the event, converted from a binary threat into a decade of protected cash flow, and that conversion is what made the clean cash valuation possible.
Probability (as it stood in the 10-K): High and near-term | Timeframe: Immediate at the filing date | Status at close: Fully resolved — all four ANDA challengers settled; generic FIRDAPSE entry deferred to no earlier than January 2035. Impact: Had it materialised, it would have eroded the lead franchise; instead it was neutralised, and the deal followed immediately.
Risk 4 — Product concentration in FIRDAPSE and the structural decline of FYCOMPA
sources Even with the patent overhang resolved, the business remained acutely concentrated on one product. FIRDAPSE generated the bulk of revenue and the large majority of profit, so the whole enterprise moved with a single drug whose growth depended on the slow, education-led task of identifying undiagnosed and misdiagnosed LEMS patients in a small, hard-to-find population. Patients who discontinue therapy in so small a pool are not easily replaced, and management itself cautioned that even substantial market share may not sustain profitability given the tiny population. This is the mirror image of the moat: the same on-label, protected franchise that generated high margins also concentrated the company’s fate.
At the other end of the portfolio, FYCOMPA was the live demonstration of what the loss of protection does to an orphan franchise. Its Orange Book patents had expired, multiple generics of both formulations had entered, revenue was falling, and management ceased active marketing effective at year-end 2025, expecting the decline to continue. A related watch item sits here: despite generic entry, a marketing shutdown and a first-ever slow-moving-inventory reserve, the FYCOMPA intangible carried no impairment charge in FY2025. That conclusion is defensible under the undiscounted-cash-flow recoverability test given the asset’s short remaining life against a still-material revenue base, and the intangible fully amortises regardless within about two years — but it means reported operating income was not yet absorbing any FYCOMPA write-down, and a sharper-than-expected erosion would both accelerate impairment and shorten the amortisation tail. The company’s own risk factors flagged possible future FYCOMPA impairment. A second, connected watch item is the inventory build: total inventory nearly doubled while sales grew far more slowly, with raw materials rising several-fold — operationally logical ahead of the AGAMREE supply transition, but a genuine divergence from the sales trend that raised obsolescence risk if AGAMREE uptake or the transition slipped, or if FYCOMPA eroded faster than planned.
Probability: High (structural, by design of the model) | Timeframe: Ongoing | Status at close: Live — FIRDAPSE concentration unchanged; FYCOMPA in managed decline with no impairment yet taken. Impact: A stumble in FIRDAPSE would have moved the whole business; FYCOMPA’s decline was contained but not finished.
Risk 5 — Sole-supplier dependence and the Santhera four-way counterparty entanglement
sources As a licensed “virtual” manufacturer with no in-house production, Catalyst depended entirely on third-party contract manufacturers and on its licensing partners for supply — a structural exposure rather than a geographic one. The sharpest version of this was AGAMREE, the fastest-growing product, for which Santhera Pharmaceuticals was the sole source of supply. That single-supplier dependency was the reason management was building inventory ahead of transitioning AGAMREE finished-goods manufacturing to a U.S. site and adding a second supplier, a process targeted for completion by the end of 2026; until that qualified, an interruption at Santhera would have directly threatened the growth product.
Santhera warrants specific attention because it was not merely a supplier. It was simultaneously a minority equity holding that Catalyst carried on its balance sheet, the sole AGAMREE supplier, the AGAMREE licensor, and the counterparty entitled to substantial sales-based and indication-based milestones plus tiered royalties — four distinct economic exposures concentrated in one non-U.S. entity, with a joint steering committee between the two companies. Catalyst determined it did not have significant influence, so this was not a formal related-party arrangement under the accounting rules, and there is no such footnote in the statements. But it is a genuine related-party-like entanglement in substance, and it had a second-order effect on reported earnings: because the equity stake was marked to fair value each quarter with changes flowing through pre-tax other income, Santhera’s Swiss-listed share price and currency movements injected non-operating volatility into pre-tax income that had nothing to do with drug operations. The size of that swing is not trivial — the single-quarter mark in early 2026 was several times the entire prior-year gain — and it is why the equity-securities line should be stripped out when assessing operating quality (developed in Section 3).
Probability: Medium | Timeframe: Until the second AGAMREE supplier was qualified (targeted end-2026) | Status at close: Live — sole-supplier dependency unresolved; entanglement intact. Impact: A Santhera supply interruption would have hit the growth product directly; its mark-to-market swings distorted pre-tax income.
2.2 Upside Catalysts
sources The catalyst picture for Catalyst is unusual precisely because the position is closed: the dominant catalysts did not remain prospective — they materialised, in sequence, in the first half of 2026. The honest framing is not one of a balanced risk/reward set awaiting resolution, but of a company whose single largest overhang cleared and which was then acquired at a premium within the same day. Two of the catalysts below are realised events rather than possibilities; the remainder are the operating levers that were live at the final 10-K.
Catalyst 1 — Clearance of the FIRDAPSE patent overhang
sources [Rating and price target withdrawn — see the note at the top.] As set out under Risk 3, the Hetero settlement of 6 May 2026 deferred any generic FIRDAPSE entry to no earlier than January 2035 and completed the set — all four challengers settled — converting a binary patent-litigation risk into a roughly decade-long protected runway on the lead product. This is the catalyst that reframed the entire investment: it turned the most dangerous line in the risk factors into the foundation of a durable cash-flow forecast.
Probability: Realised | Timeframe: 6 May 2026 | Monitoring trigger (in retrospect): The settlement filing and its submission to the FTC and DOJ for review confirmed the deferral of generic entry to January 2035.
Catalyst 2 — Acquisition by Angelini Pharma at a cash premium
sources The ultimate catalyst, and the one that realised value for shareholders, was the all-cash acquisition by Angelini Pharma at $31.50 per share, signed on 6 May 2026 — the same day the Hetero settlement cleared the patent overhang — and closed on 16 July 2026, after which Catalyst was delisted and deregistered. The simultaneity is the analytical point: the acquirer moved at the moment the last major uncertainty resolved, underwriting a debt-free, cash-generative, two-product rare-disease platform with a decade of FIRDAPSE protection newly secured. For a standalone investor, the cash exit removed all forward execution and concentration risk in a single step.
Probability: Realised | Timeframe: Signed 6 May 2026; closed 16 July 2026 | Monitoring trigger (in retrospect): Merger agreement and subsequent Form 15 deregistration.
Catalyst 3 — FIRDAPSE royalty step-down (a margin tailwind)
sources [Rating and price target withdrawn — see the note at the top.] FIRDAPSE net sales stepped down substantially, with only a modest offsetting step-up on the Jacobus royalty. Because royalties are the principal component of cost of sales, the net effect was a meaningful reduction in the FIRDAPSE royalty burden and therefore a gross-margin tailwind flowing into FY2026 — an improvement in the unit economics of the very product whose exclusivity had just been secured.
Probability: Realised / mechanical | Timeframe: From early 2026 | Monitoring trigger: Cost-of-sales-to-revenue ratio on FIRDAPSE in FY2026 reporting.
Catalyst 4 — AGAMREE growth and FIRDAPSE oncology-led patient identification
sources The residual operating catalysts were the two growth engines management was still pressing at the final 10-K: continued AGAMREE share capture within the foundational DMD steroid class, supported by additional-indication studies and a real-world registry; and broader FIRDAPSE diagnosis following the addition of LEMS and amifampridine guidance to the NCCN small-cell-lung-cancer guidelines, which opened an oncology-led channel for identifying previously undiagnosed patients. These were the slower-compounding, execution-dependent levers — genuine but unproven — that the acquirer, rather than public shareholders, ultimately stood to capture.
Probability: Medium / execution-dependent | Timeframe: Multi-year | Monitoring trigger: AGAMREE quarterly revenue trajectory and FIRDAPSE volume growth in oncology settings.
2.3 Risk & Catalyst Summary
| # | Item | Type | Probability | Timeframe | Status | Monitoring Trigger |
|---|---|---|---|---|---|---|
| 1 | Single-distributor customer & receivables concentration | Risk | High | Immediate / structural | Live at close | Change in distributor / AnovoRx relationship or payment behaviour |
| 2 | Gross-to-net deduction estimation (Critical Audit Matter) | Risk | Medium | Ongoing | Live at close | Prior-period rebate true-ups; share of growth from fee reduction vs volume |
| 3 | FIRDAPSE loss of exclusivity & generic litigation | Risk | High (in 10-K) | Immediate | Resolved 6 May 2026 | ANDA settlement filings; FTC/DOJ review |
| 4 | FIRDAPSE product concentration & FYCOMPA decline | Risk | High | Ongoing | Live at close | FIRDAPSE volume; FYCOMPA erosion pace; intangible impairment test |
| 5 | Sole-supplier / Santhera counterparty entanglement | Risk | Medium | Until 2nd supplier qualified | Live at close | AGAMREE supply continuity; Santhera mark-to-market swings |
| 6 | Clearance of FIRDAPSE patent overhang | Catalyst | Realised | 6 May 2026 | Realised | Hetero settlement; entry deferred to Jan 2035 |
| 7 | Angelini Pharma acquisition at cash premium | Catalyst | Realised | Signed May / closed Jul 2026 | Realised | Merger agreement; Form 15 deregistration |
| 8 | FIRDAPSE royalty step-down (margin tailwind) | Catalyst | Realised | From early 2026 | Realised | FIRDAPSE cost-of-sales ratio in FY2026 |
Source: Company SEC filings (10-K and subsequent 10-Q) and forensic footnote review; see Appendix A.1.
2.4 Risk Interdependencies
sources The risks above were not independent; their danger lay in how they compounded. The tightest coupling was between customer concentration (Risk 1), gross-to-net estimation (Risk 2) and the receivables surge: the same renegotiated contract that lifted reported net revenue by cutting fees also changed the payment cadence that inflated the year-end receivable — and that enlarged receivable sat almost entirely with the single distributor. So a favourable revenue optic, a judgmental deduction estimate, and a concentrated collection exposure all traced back to one counterparty relationship. Had that distributor come under stress, the damage would not have been confined to revenue; it would have simultaneously hit the largest asset on the balance sheet and the reliability of the gross-to-net accruals booked against its sales.
The second compounding axis ran through FIRDAPSE. Before 6 May 2026, product concentration (Risk 4) and the generic-litigation overhang (Risk 3) multiplied each other: because one product carried the business, an adverse patent ruling would not have dented earnings — it would have removed the earnings base. The single most damaging simultaneous scenario the standalone company faced was a lost Hetero trial (early FIRDAPSE generic entry) colliding with the existing single-channel dependency, since a price collapse on the lead product would have flowed through the one distributor that carried essentially all of it. That this scenario resolved the other way — all four challengers settled, and the acquisition followed the same day — is why the interdependencies that could have been catastrophic in combination instead unwound cleanly. On the supply side, the inventory build (Risk 4 watch item) and the sole-supplier dependence on Santhera (Risk 5) were two faces of one exposure: the near-doubling of inventory was the deliberate hedge against the single-supplier risk during the manufacturing transition, so a slip in that transition would have converted a prudent stockpile into an obsolescence problem.
2.5 ESG & Regulatory Exposure
sources The governance profile was a genuine strength and should be stated plainly: there was no controlling shareholder, a single class of common stock carrying one vote per share, and no material related-party transactions in recent years, with any potential conflict routed to the Audit Committee under a standing policy. Grant Thornton had audited the company since 2006 and issued unqualified opinions on both the financial statements and internal controls, with no restatement and no going-concern language. For an acquirer underwriting the reported earnings behind the cash price, the absence of dual-class structures, controlling blocks or related-party leakage removed a whole category of governance risk. The main social/human-capital exposure was the mirror of that lean structure — dependence on a small number of key executives, with no employment or retention agreements for most officers and no key-man insurance, so continuity risk was real; it was tested when a former executive officer retired during 2025 (with a stock-compensation charge on separation) without disruption to the reporting narrative.
The regulatory exposures were those of an orphan-drug pricing model, and they were substantive. Reimbursement and drug-pricing pressure was pervasive: coverage for high-priced rare-disease therapies is negotiated payor-by-payor, and the Inflation Reduction Act’s price-negotiation and inflation-rebate provisions, executive-branch “Most Favored Nation” pricing initiatives, proposed international-reference-price demonstration models, and state-level measures each threatened the net prices the company could realise — with orphan-drug pricing singled out for political scrutiny. The orphan-drug framework on which the FIRDAPSE and AGAMREE exclusivity thesis rested was itself a policy risk: management flagged that the Orphan Drug Act could be amended, or the FDA’s interpretation of it challenged in court, in ways that narrow the exclusivity these products relied on. The company’s patient-access apparatus — the branded patient-support program, co-pay assistance and charitable-foundation donations — while central to the commercial model, also sat squarely within the reach of anti-kickback, false-claims and healthcare-transparency laws, where a compliance failure could trigger enforcement, penalties and exclusion from government programs. Finally, operational-regulatory disruption was a live concern: management specifically referenced a prolonged 2025 federal government shutdown during which the FDA halted non-essential activity, alongside broader uncertainty about agency staffing and the new Administration’s initiatives, any of which could slow reviews and approvals. One forward regulatory item bridges into the closed chapter: the Hetero settlement that cleared the patent overhang was itself submitted to the FTC and DOJ for antitrust review — the standard reverse-payment scrutiny that accompanies pharmaceutical patent settlements — a final regulatory checkpoint on the event that ultimately de-risked the acquisition.
Section 3 — Financial Analysis & Historical Performance
sources
Three-Statement Linkage Confirmation
- Net Income ties (Income Statement → Cash Flow Statement): Confirmed. Reported net income of $214.3M in FY2025 is the opening line of the operating cash-flow reconciliation, and the same figure carries into shareholders’ equity; the FY2025 audit was clean and unqualified with no restatement.
- Cash ties (Balance Sheet → Cash Flow Statement): Confirmed. The FY2025 period-end cash and equivalents of $709.2M on the balance sheet reconciles to the ending cash position on the cash-flow statement, up from $517.6M a year earlier.
- Retained Earnings reconciliation: Confirmed. Beginning retained earnings of $285.2M plus FY2025 net income of $214.3M, less share repurchases of $25.3M charged against equity and with no dividend ever paid, reconciles to closing retained earnings of $474.2M.
3.1A Income Statement
Source: Company SEC filings (10-K); figures per the FL model — see Appendix A.1–A.2.
CAGR Summary
| Metric | 3Y CAGR | 5Y CAGR | 10Y CAGR |
|---|---|---|---|
| Revenue | 40.1% | 37.7% | - |
| EBITDA | 42.1% | 48.2% | - |
| Net Income | 37.1% | 23.4% | - |
| Diluted EPS | 30.8% | 18.8% | - |
| FCF | 21.6% | 35.9% | - |
Source: Company SEC filings (10-K); figures per the FL model — see Appendix A.1–A.2.
3.1B Income Statement — Analysis
sources The revenue arc. Catalyst’s income statement is the clearest commercial-transition record an analyst is likely to encounter. The company recorded essentially no product revenue through FY2018 — $0.0M, $0.0M and $0.0M in the three years to 2017, and only $0.5M in FY2018 — while running consistent operating losses. The FIRDAPSE launch in early 2019 inverted the model in a single step, taking revenue to $102.3M in FY2019 and $119.1M in FY2020, and from there each acquired product added a further visible step: $140.8M in FY2021, $214.2M in FY2022, $398.2M in FY2023 as FYCOMPA was absorbed, and $491.7M then $589.0M as AGAMREE launched and scaled. The five-year revenue CAGR of 37.7% understates the drama because it straddles a base that was already commercial; the true inflection was FY2019. Critically, this growth was purchased, not discovered — each step change maps to an asset acquisition or in-licence (FIRDAPSE, then FYCOMPA/RUZURGI, then AGAMREE), not to organic pipeline output.
FY2025 growth was volume-led but not purely organic. Management attributed FY2025 growth of 19.8% primarily to a full year of AGAMREE together with higher FIRDAPSE volumes, partly offset by generic-driven FYCOMPA erosion — a growing two-product core more than absorbing a shrinking legacy franchise. That is the healthy reading. The important qualification, developed under quality of earnings below, is that a portion of reported FY2025 net-revenue growth reflected a customer-contract renegotiation that reduced the fees Catalyst pays — a lower gross-to-net deduction that mechanically lifts net revenue — rather than incremental drug demand, and should not be extrapolated as organic growth.
Margin trajectory. Reported gross margin was structurally high — 85.2% in FY2025 — but a like-for-like caveat applies from the outset: cost of sales consisted principally of royalties, third-party manufacturing and freight and excluded amortisation of the acquired product-rights intangibles, which was carried as a separate operating line. Gross margin is therefore high by construction and is not directly comparable to a peer that folds intangible amortisation into cost of goods sold. Below the gross line, operating leverage was the real story: EBIT margin climbed from 31.1% in FY2019 to 47.5% in FY2022 as revenue scaled against a largely fixed commercial infrastructure, then reset to 21.8% in FY2023 before recovering to 39.7% in FY2024 and 43.8% in FY2025. The FY2023 dip was not operating deterioration — it was an accounting artifact, explained next. EBITDA margin reached 50.2% in FY2025, a level that reflects the asset-light, royalty-cost model rather than any pricing power beyond the orphan positioning already discussed in Section 1.
Major movers.
-
AGAMREE launch and scale (structural, positive). The addition of AGAMREE was the single largest driver of the FY2024–FY2025 revenue step, carrying total revenue to $589.0M in FY2025. Because it entered a competitive corticosteroid market by share capture rather than by finding new patients, its contribution is a genuine, repeatable revenue stream — but one dependent on a single supplier and licensor (Santhera), a dependency addressed in Section 2.
-
The FY2023 acquired in-process R&D charge (temporary, distorting). Research and development was $93.2M in FY2023 versus $12.6M in FY2024 and $12.7M in FY2025. [Rating and price target withdrawn — see the note at the top.] This single item is why total operating expense excluding cost of sales spiked to $259.4M in FY2023 and why FY2023 EBIT margin printed at 21.8%. Read without this context, the R&D line looks as though spending collapsed to a fraction of the prior year; in fact the underlying commitment to R&D barely moved. Management itself frames R&D as a modest share of costs, consistent with a buy-not-build model. The charge was non-recurring and does not reflect the earnings power of the platform.
-
[Rating and price target withdrawn — see the note at the top.] This was not operating performance — it was a one-time deferred-tax benefit from releasing the valuation allowance once the company became durably profitable. [Rating and price target withdrawn — see the note at the top.]
-
FYCOMPA generic erosion (structural, negative). FYCOMPA moved into managed decline as its Orange Book patents expired, generics entered both formulations, and management ceased active marketing at the end of 2025. It is the live demonstration within Catalyst’s own portfolio of what loss of exclusivity does to an orphan franchise, and it acted as a growing drag that the FIRDAPSE/AGAMREE core had to overcome each year.
-
SG&A and the executive-retirement charge (mixed). Selling, general and administrative expense rose to $193.8M in FY2025 from $177.7M in FY2024 on higher compensation, headcount and business-development consulting — spending that supports the growth core but that management expects to remain substantial. [Rating and price target withdrawn — see the note at the top.]
Quality of earnings. The reported earnings that supported the $31.50-per-share exit are, on balance, sound: the audit was clean and unqualified, income-tax accounting carried no valuation allowance and no uncertain tax positions, and the FY2023 R&D distortion is a comparability issue, not an accounting inconsistency. Two quality qualifications matter for anyone reading the top and bottom lines. First — a Critical Audit Matter — net product revenue is stated after a large, judgmental set of gross-to-net deductions (chargebacks, government and payor rebates, co-pay assistance, returns and distributor fees); Grant Thornton elevated the estimation of FYCOMPA Medicaid and managed-care rebates to a Critical Audit Matter, and the filing provides no category-level gross-to-net roll-forward with which an outside analyst could independently test reserve adequacy. As noted above, part of FY2025 net-revenue growth was a fee reduction (a lower deduction) rather than volume. Second, “other income” carried non-operating volatility from the Santhera equity stake, which is marked to market each quarter with the change running through pre-tax income; the FY2025 mark was modest, but its scale is unpredictable, and analysts assessing operating quality should strip the Santhera fair-value movement out of pre-tax income entirely. Neither qualification points to manipulation; both point to where a future surprise would originate.
⚠ Items to Watch. If EBIT margin were to fall back toward the 21.8% FY2023 trough for reasons other than a repeat one-off charge, it would signal genuine erosion of the operating leverage that defined the FY2021–FY2025 record. If reported net-revenue growth persisted while volume-based demand did not — that is, if growth continued to lean on gross-to-net fee reductions of the kind that flattered FY2025 — the quality of the top line would be deteriorating even as the headline held.
3.2A Balance Sheet
| FY2021 | FY2022 | FY2023 | FY2024 | FY2025 | |
|---|---|---|---|---|---|
| ASSETS | |||||
| Cash & Equivalents ($M) | $171.4M | $298.4M | $137.6M | $517.6M | $709.2M |
| Receivables ($M) | $6.6M | $10.4M | $53.5M | $65.5M | $126.5M |
| Inventory ($M) | $7.9M | $6.8M | $15.6M | $19.5M | $37.2M |
| Total Current Assets ($M) | $210.1M | $320.8M | $219.3M | $623.6M | $894.0M |
| PP&E, net ($M) | $1.0M | $0.8M | $1.2M | $1.4M | $1.0M |
| Goodwill & Intangibles ($M) | $0.0M | $32.5M | $194.0M | $156.7M | $131.7M |
| Total Assets ($M) | $237.8M | $375.6M | $470.1M | $851.4M | $1,104.0M |
| LIABILITIES & EQUITY | |||||
| Short-term Debt ($M) | $0.0M | $0.0M | $0.0M | $0.0M | $0.0M |
| Total Current Liabilities ($M) | $27.1M | $57.6M | $76.1M | $120.7M | $147.2M |
| Long-term Debt ($M) | $0.0M | $0.0M | $0.0M | $0.0M | $0.0M |
| Total Debt ($M) | $0.0M | $0.0M | $0.0M | $0.0M | $0.0M |
| Net Debt ($M) | -$171.4M | -$298.4M | -$137.6M | -$517.6M | -$709.2M |
| Total Liabilities ($M) | $31.0M | $75.2M | $82.2M | $123.8M | $149.7M |
| Shareholders’ Equity ($M) | $206.8M | $300.4M | $387.9M | $727.6M | $954.3M |
| Retained Earnings ($M) | -$26.3M | $49.9M | $121.3M | $285.2M | $474.2M |
| Key Ratios | |||||
| Current Ratio | 7.8x | 5.6x | 2.9x | 5.2x | 6.1x |
| Net Debt / EBITDA | -3.3x | -2.9x | -1.1x | -2.2x | -2.4x |
| Debt / Equity | 0.0x | 0.0x | 0.0x | 0.0x | 0.0x |
| Book Value / Share | $1.92 | $2.70 | $3.41 | $5.82 | $7.50 |
Source: Company SEC filings (10-K); figures per the FL model — see Appendix A.1–A.2.
3.2B Balance Sheet — Analysis
sources Asset composition. Catalyst’s balance sheet was cash-dominated and asset-light, exactly as the operating model implies. Cash and equivalents reached $709.2M at FY2025 year-end, up from $517.6M, against total assets of $1,104.0M — the single largest asset on the sheet by a wide margin. PP&E was negligible ($1.0M in FY2025), consistent with a “virtual” manufacturer that owned no plants; the only other material asset category was acquired product-rights intangibles ($131.7M in FY2025), the capitalised cost of the rights the company bought rather than discovered. There was essentially no goodwill overhang, because each product was acquired as an asset acquisition (value concentrated in a single identifiable intangible) rather than as a business combination — so there was no annual goodwill-impairment test to fail. Book value per share was $7.50 in FY2025, but book value materially understates economic value here, since the earning power sat in intangible rights carried at amortised cost, not at fair value.
Leverage — there was none. This is the defining feature of the balance sheet and it must be stated plainly rather than left as blank cells: Catalyst carried no funded debt in any year of the period. Total debt, net debt, the net-debt/EBITDA and debt/equity ratios, and interest coverage are therefore not applicable — not missing data, but genuinely absent exposures. There was no interest expense, no maturity wall, no covenants and no off-balance-sheet financing. The company also never paid a dividend. The result was a fortress liquidity position — a current ratio of 6.1x in FY2025 — and a capital structure whose only real question was how the accumulating cash would be deployed, a question answered under capital allocation below. For an acquirer, a debt-free target with this much cash is unusually clean to underwrite; the exit price effectively bought a large net-cash balance alongside the operating franchise.
Working capital. The one area where the balance sheet moved against the grain of the income statement was working capital, and it is a monitored (YELLOW) item. Receivables surged to $126.5M in FY2025 from $65.5M — a near-doubling against revenue growth of 19.8% — while inventory rose to $37.2M from $19.5M, again far faster than sales. Both bear directly on cash generation and are analysed in the cash-flow section that follows. The receivables jump is largely a timing artifact: the same customer renegotiation that reduced Catalyst’s fees also shifted the customer’s payment cadence from semi-monthly to monthly, pushing a large end-December receipt into early January 2026, so the FY2025 balance is inflated by a collection that simply arrived a few days late. The inventory build is operationally rational — a pre-build ahead of the AGAMREE supply-chain transition to a U.S. site — but it ties up cash and raises obsolescence risk if AGAMREE uptake or the transition slips, or if FYCOMPA erodes faster than planned (a first-ever slow-moving-inventory reserve was taken on FYCOMPA in FY2025). Because both balances sit almost entirely with the single distributor, the enlarged receivable also concentrates counterparty exposure; that concentration is treated as a primary risk in Section 2 and is not re-litigated here.
⚠ Items to Watch. With no debt to monitor, the balance-sheet watch items are working-capital quality, not solvency. If receivables days were to stay elevated into FY2026 rather than normalising once the January collection cleared, the “timing” explanation would need re-examination as a possible collectibility or channel-inventory issue. If the inventory build were to continue outpacing sales without the AGAMREE manufacturing transition completing on schedule, the risk of an obsolescence write-down — particularly on declining FYCOMPA stock — would rise materially.
3.3A Cash Flow Statement
| FY2021 | FY2022 | FY2023 | FY2024 | FY2025 | |
|---|---|---|---|---|---|
| Cash from Operations ($M) | $60.4M | $116.0M | $143.6M | $239.8M | $208.7M |
| — Depreciation & Amortization ($M) | $0.2M | $1.2M | $32.9M | $37.8M | $37.9M |
| Capital Expenditures ($M) | $1.0M | $0.0M | $0.2M | $0.6M | $0.1M |
| Free Cash Flow ($M) | $59.4M | $116.0M | $143.4M | $239.3M | $208.6M |
| FCF Margin | 42.1% | 54.2% | 36.0% | 48.7% | 35.4% |
| FCF / Share | $0.55 | $1.04 | $1.26 | $1.91 | $1.64 |
| FCF Conversion (FCF/NI) | 150.3% | 139.6% | 200.8% | 146.0% | 97.3% |
| CapEx / Revenue | 0.7% | 0.0% | 0.1% | 0.1% | 0.0% |
| CapEx / D&A | 5.3x | 0.0x | 0.0x | 0.0x | 0.0x |
| Dividends Paid ($M) | — | — | — | — | — |
| Share Repurchases ($M) | $12.1M | $6.9M | — | — | $25.3M |
Source: Company SEC filings (10-K); figures per the FL model — see Appendix A.1–A.2.
3.3B Cash Flow — Analysis
sources Operating cash quality. For most of the period Catalyst converted earnings into cash cleanly, and often more than fully — FCF conversion was 146.0% in FY2024, above 100% because non-cash intangible amortisation ran through the income statement while requiring no cash outlay. FY2025 is the exception that proves the point: despite net income rising to $214.3M, operating cash flow fell to $208.7M from $239.8M, and FCF conversion dropped to 97.3%. The decline was not an earnings-quality failure — it was the working-capital drag identified above. The receivables build alone (to $126.5M from $65.5M) absorbed the bulk of it, driven materially by the ~end-December-to-2-January payment shift, with the inventory pre-build a secondary use of cash. Normalised for the timing shift, underlying cash generation tracked earnings; the reported FY2025 shortfall is largely a calendar effect that should reverse in FY2026 as the delayed receipt cleared in the first days of January.
CapEx — effectively zero. Capital intensity was trivial and is a core feature of the model, not an oversight. CapEx was $0.1M in FY2025 against D&A of $37.9M, a CapEx/D&A ratio far below 1.0x (0.0x) and CapEx/revenue of 0.0%. A ratio this far below 1.0x would normally flag underinvestment or harvest mode; here it simply reflects a virtual manufacturer with no plant to build or maintain. The “D&A” that dwarfs CapEx is almost entirely amortisation of acquired product rights — a non-cash charge on assets that were bought, not built — so the gap carries none of the usual warning signal about a decaying asset base needing reinvestment. In this model, growth capital was deployed not through CapEx but through business-development payments to acquire the next product’s rights.
Capital allocation waterfall. Of the substantial free cash flow generated across FY2021–FY2025, the overwhelming majority was retained on the balance sheet as cash — which is why the cash pile grew to $709.2M — and earmarked for product-rights acquisitions, the company’s stated primary value lever. No dividend was ever paid. Buybacks were modest and episodic until late in the period: $12.1M in FY2021 and $6.9M in FY2022, then a step up to $25.3M in FY2025 following a new authorisation, funded from cash on hand and explicitly sized so as not to impair the acquisition war chest. This mix — retain-and-redeploy, with a small buyback layered on only once liquidity exceeded operating and deal needs — is internally consistent with a business whose growth depended on having cash ready when an asset appeared. The reasonable critique is the mirror image: a persistently large idle cash balance depressed returns on capital measured against a bloated asset base (see Section 3.4), and asked shareholders to trust management’s deal-making, since as of the final annual report no new definitive acquisition had been signed.
⚠ Items to Watch. If FCF conversion did not recover toward the historical norm in FY2026 once the January receivable cleared — i.e., if it lingered near the 97.3% FY2025 level — it would suggest the working-capital drag was structural (channel or collection) rather than a one-off timing shift, and would warrant re-examining the quality of reported earnings.
3.4 Returns Analysis
| FY2021 | FY2022 | FY2023 | FY2024 | FY2025 | |
|---|---|---|---|---|---|
| ROIC | 105.1% | - | 26.2% | 64.2% | 85.6% |
| ROE | 21.0% | 32.8% | 20.7% | 29.4% | 25.5% |
| ROA | 18.4% | 27.1% | 16.9% | 24.8% | 21.9% |
| Interest Coverage | - | - | - | - | - |
Source: Company SEC filings (10-K); figures per the FL model — see Appendix A.1–A.2.
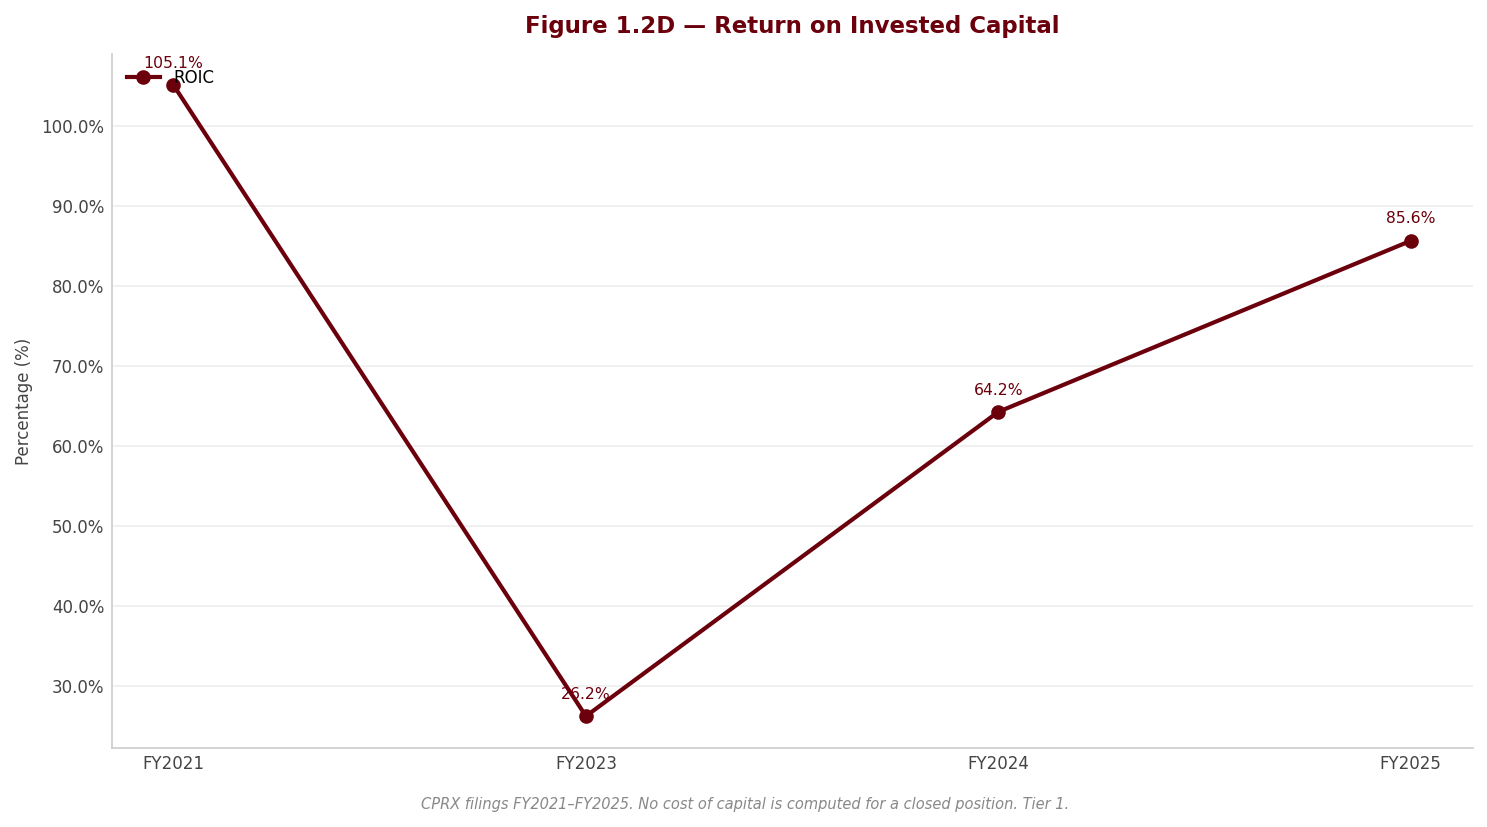
ROIC and the spread over cost of capital. Where it is defined, Catalyst’s return on invested capital was extraordinarily high — 105.1% in FY2021, 64.2% in FY2024 and 85.6% in FY2025 — comfortably above any reasonable estimate of the company’s cost of capital. [Rating and price target withdrawn — see the note at the top.] But the level must be read for what it is: the signature of an asset-light business that bought commercial rights rather than building productive capacity, so the invested-capital denominator is structurally small relative to the operating profit it supports. This is a capital-structure artifact as much as it is operational excellence — genuinely attractive economics, but not evidence of superior manufacturing or R&D efficiency, of which Catalyst had little of either. Two years, FY2019 and FY2022, are correctly left blank because ROIC is undefined for them: with no debt and a cash balance roughly equal to equity, invested capital (equity + debt - cash) collapses toward zero, and a ratio with a near-zero denominator has no economic meaning. That the model declines to print a number in those years is a correctness feature, not a gap.
DuPont decomposition. Decomposing FY2025 ROE of 25.5% into its drivers isolates where the return came from. Net margin of 36.4% was the dominant contributor — a high-margin, low-tax specialty business. Asset turnover was low at 0.60x, dragged down not by operating inefficiency but by the enormous cash balance sitting in the asset base and earning only interest. The equity multiplier was just 1.16x, barely above 1.0x, confirming that leverage contributed essentially nothing to ROE — the company was debt-free and its assets were funded almost entirely by equity. The clear read: profitability drove the return, the swing factor over time was net margin (most vividly in the FY2020 tax-benefit distortion), and the low asset turnover is the price of holding the acquisition war chest. Correspondingly, ROA of 21.9% in FY2025 sits close to ROE, exactly as one expects when there is no financial leverage. Interest coverage is shown as not applicable in every year because there was no interest expense to cover.
3.5 Altman Z-Score (Most Recent FY)
| Component | FY2023 | FY2024 | FY2025 |
|---|---|---|---|
| X1 (Working Capital / Total Assets) | 0.305 | 0.591 | 0.677 |
| X2 (Retained Earnings / Total Assets) | 0.258 | 0.335 | 0.430 |
| X3 (EBIT / Total Assets) | 0.185 | 0.229 | 0.233 |
| X4 (Equity / Total Liabilities) | 4.717 | 5.878 | 6.374 |
| X5 (Revenue / Total Assets) | 0.847 | 0.578 | 0.534 |
| Z-Score | 3.84 | 4.46 | 4.78 |
| Zone | Safe | Safe | Safe |
Source: Company SEC filings (10-K); figures per the FL model — see Appendix A.1–A.2.
Interpretation. The Altman Z-Score placed Catalyst firmly in the safe zone throughout and moving further into it — 3.84 in FY2023, 4.46 in FY2024 and 4.78 in FY2025, well above the model’s 2.90 safe-zone threshold with no drift toward a boundary. The score is unsurprising given the balance-sheet facts already established: a debt-free capital structure lifts the equity-to-liabilities term, a large cash position and profitability lift the working-capital and earnings terms, and rising retained earnings lift that component too. The practical implication is that credit and bankruptcy risk were negligible — which is consistent with the clean audit, the absence of any going-concern language, and the fortress liquidity that made the company such a clean cash-acquisition target. The one caveat is interpretive rather than numerical: the Z-Score measures distress risk, not the durability of the revenue base, and Catalyst’s real vulnerabilities — single-channel concentration and finite product exclusivity — are precisely the risks a solvency score is not designed to capture.
4. Valuation withdrawn
This section stated what the shares were worth and what to do about them. It rested on an exit multiple set by hand — across the coverage it averaged 24% below where each company actually traded — so the conclusion largely restated that assumption instead of testing it. Rather than leave it standing, it has been withdrawn while the method is rebuilt.
Nothing else in this report depends on it: the financial analysis above and below is drawn from the company's own filings, and every figure links to the page it was verified against.
Section 5 — Financial Metrics & Peer Benchmarking
sources This section places Catalyst’s final full year against five specialty-pharmaceutical peers. One asymmetry governs everything that follows and must be stated at the outset: Catalyst’s own multiples are frozen. They were struck at the $31.50 cash price Angelini paid, on FY2025 results, and — the equity having been extinguished on delisting — they no longer move. The peer multiples, by contrast, are live market context sourced on or about 7 August 2026. When this section compares Catalyst’s valuation to its peers’, it is therefore not comparing two market quotes; it is comparing what an acquirer paid for a whole, de-risked company against what the public market was paying, on that date, for similar businesses. The operating and returns comparisons carry no such asymmetry — every figure in them is drawn from an audited FY2025 filing — but they carry a different problem, which is that two of the five peers ran a GAAP operating loss in FY2025 for one-off acquisition reasons, so their headline profitability is not a clean read of underlying economics. Both issues are developed below and catalogued in 5.7.
5.1 Peer Selection
sources The peer set is built around the one attribute that defined Catalyst as an asset: a small-to-mid-cap, high-margin, cash-generative specialty franchise built on acquired or in-licensed product rights rather than internal discovery. Harmony Biosciences is the closest single-company analogue — a single-product rare-neurology franchise (WAKIX in narcolepsy against Catalyst’s FIRDAPSE in LEMS), run on the same product-rights, low-R&D, high-margin model. Collegium is the next closest on business model: a levered, acquired-products specialty-pain house with the same buy-don’t-build strategy. Corcept supplies the debt-free, net-cash, profitable balance-sheet analogue, but on a very different cost structure — it runs heavy internal discovery, which is precisely why it is instructive. Jazz and Supernus, both sourced from primary 10-Ks in the company folder, anchor the larger end of the specialty-neuro space and provide scale reference; both, however, are compromised comparables this year for reasons that dominate their FY2025 numbers.
The set has three stated weaknesses. First, scale: Jazz at $4,267.6M of revenue is an order of magnitude larger than Catalyst’s $589.0M, while the tighter comparables (Harmony, Corcept, Collegium) sit within a plausible band of it. Second, cost-structure divergence: Corcept and Harmony run internal-discovery models with R&D intensity many times Catalyst’s, so their lower operating margins are a business-model difference, not inefficiency. Third, and most important for FY2025 specifically, Jazz and Supernus each absorbed a one-off acquisition charge large enough to turn GAAP operating income negative; their margin, return and earnings-multiple rows are not meaningful this year and are treated as directional-only throughout.
| Peer | Ticker | Exchange | Filing Type | Accounting Standard | Fiscal Year End | Comparability Note |
|---|---|---|---|---|---|---|
| Jazz Pharmaceuticals plc | JAZZ | Nasdaq | 10-K | US GAAP | December | Irish-domiciled, large FY2025 tax benefit and IPR&D-driven operating loss; net-based and earnings multiples not comparable this year. |
| Supernus Pharmaceuticals, Inc. | SUPN | Nasdaq | 10-K | US GAAP | December | Debt-free/net-cash like Catalyst, but FY2025 operating loss from the Sage acquisition; treat as a transition year. |
| Harmony Biosciences Holdings, Inc. | HRMY | Nasdaq | 10-K | US GAAP | December | Closest business-model match; gross margin not like-for-like (amortization and royalties folded into COGS). |
| Corcept Therapeutics Incorporated | CORT | Nasdaq | 10-K | US GAAP | December | Balance-sheet analogue (debt-free, net-cash) but heavy internal R&D; low operating margin is structural, not weak. |
| Collegium Pharmaceutical, Inc. | COLL | Nasdaq | 10-K | US GAAP | December | Same product-rights model but materially levered; gross margin shown ex-amortization on a disclosed basis. |
Source: Peer-company SEC filings; comparability notes in 5.7 — see Appendix A.1.
5.2 Profitability Comparison
sources Comparative: Most Recent Full Fiscal Year (FY2025)
| Metric | Catalyst Pharmaceuticals Inc | Jazz Pharmaceuticals plc | Supernus Pharmaceuticals, Inc. | Harmony Biosciences Holdings, Inc. | Corcept Therapeutics Incorporated | Collegium Pharmaceutical, Inc. |
|---|---|---|---|---|---|---|
| Revenue ($M) | $589.0M | $4,267.6M | $719.0M | $868.5M | $761.4M | $780.6M |
| Gross Margin | 85.2% | 88.2% | 89.6% | 77.2% | 98.3% | 87.8%ᶜ |
| EBITDA Margin | 50.2% | 6.2% | 4.1% | 26.9% | 6.0% | 52.0% |
| EBIT Margin | 43.8% | -10.1% | -8.7% | 24.0% | 5.9% | 23.0% |
| Net Margin | 36.4% | -8.3% | -5.4% | 18.3% | 12.9% | 8.1% |
| FCF Margin | 35.4% | 30.4% | 6.4% | 40.1% | 18.6% | 42.0% |
Source: Peer-company SEC filings; comparability notes in 5.7 — see Appendix A.1.
Flag legend: ᶠ = IFRS-translated (directional only); ᵐ = market-sourced; ᶜ = computed from disclosed filing components. Collegium’s gross margin is shown ex-amortization from a separately disclosed cost line; its reported (post-amortization) gross margin is materially lower. Jazz and Supernus EBIT, EBITDA and net margins are FY2025 GAAP losses distorted by one-off acquisition charges — not meaningful, see 5.7. Harmony’s gross margin includes intangible amortization and Bioprojet royalties in COGS and is therefore understated relative to Catalyst’s ex-amortization basis.
Read only across the columns that are genuinely comparable, Catalyst’s profitability was, in its final year, the strongest clean profile in the group beneath the gross-margin line. Its gross margin of 85.2% sits mid-pack among the ex-amortization reporters — a shade below Jazz’s 88.2%, Supernus’s 89.6% and Collegium’s disclosed 87.8%, and well below Corcept’s 98.3%, which reaches that near-costless level only because Corcept’s cost of sales is negligible. Harmony’s 77.2% looks lower still, but that is a presentation artifact: Harmony folds intangible amortization and royalties into cost of sales, so its gross margin is not on Catalyst’s basis and should not be ranked against it.
The distinction that matters opens up below gross profit. Catalyst converted its revenue into an EBIT margin of 43.8% — comfortably the highest of any peer that earned an operating profit at all, against Harmony’s 24.0% and Collegium’s 23.0%, and far above Corcept’s 5.9%. This gap is real, but its cause must be named precisely, because it is not simply that Catalyst was “more efficient.” It is that Catalyst spent almost nothing on research: R&D of $12.7M, or roughly 2.2% of revenue, against Corcept, which directs roughly a third of revenue to research, and Harmony, whose R&D intensity is many times Catalyst’s. Catalyst bought its products rather than discovering them, and the operating-margin premium is the direct accounting consequence of that model — the mirror image of the thin internal pipeline it therefore carried. A reader should treat the EBIT-margin lead as a structural feature of a low-R&D, product-rights business, not as evidence of superior operational execution against companies that were funding their own future franchises. Jazz’s -10.1% and Supernus’s -8.7% are GAAP operating losses and carry no comparative signal this year: Jazz’s operating line was pushed negative by a $947.9M acquired-IPR&D charge (ex-charge operating income of roughly $517.6M, a ~12.1% margin), and Supernus’s by the Sage acquisition, which lifted SG&A to $485.6M from $321.6M and added a $25.4M contingent-consideration loss, turning +$81.7M of FY2024 operating income into a $(62.3)M loss.
The same pattern holds through net income and cash flow, with two caveats. Catalyst’s net margin of 36.4% led the clean set, but the comparison to Corcept’s 12.9% flatters Catalyst less than it appears, because Corcept’s net margin was lifted above its pre-tax margin by a deferred-tax benefit. On free cash flow — the least distortable line — Catalyst’s 35.4% margin was strong but not exceptional, sitting below Collegium’s 42.0% and Harmony’s 40.1% and only modestly ahead of Jazz’s 30.4% (Jazz’s cash generation being clean because the IPR&D charge was largely non-cash). Supernus’s 6.4% is depressed by acquisition-related working-capital movement.
Historical: Catalyst Pharmaceuticals Inc Own 5-Year Progression
| Metric | FY2021 | FY2022 | FY2023 | FY2024 | FY2025 |
|---|---|---|---|---|---|
| Gross Margin | 84.5% | 83.9% | 86.9% | 86.0% | 85.2% |
| EBITDA Margin | 37.3% | 48.1% | 30.1% | 47.4% | 50.2% |
| EBIT Margin | 37.2% | 47.5% | 21.8% | 39.7% | 43.8% |
| Net Margin | 28.0% | 38.8% | 17.9% | 33.3% | 36.4% |
| FCF Margin | 42.1% | 54.2% | 36.0% | 48.7% | 35.4% |
Source: Peer-company SEC filings; comparability notes in 5.7 — see Appendix A.1.
Catalyst’s own five-year path reconciles with the Section 3 narrative: gross margin held remarkably stable across the entire period, while the operating and EBITDA margins expanded as the acquired revenue base scaled over a largely fixed commercial cost structure — the 21.8% EBIT margin in FY2023 being the one visible dip, driven by that year’s acquisition-related charge rather than any operating deterioration. By FY2025 the margin structure had reached its mature, pre-acquisition-charge shape, which is the profile the peer table above compares.
5.3 Returns Comparison
sources Comparative: Most Recent Full Fiscal Year (FY2025)
| Metric | Catalyst Pharmaceuticals Inc | Jazz Pharmaceuticals plc | Supernus Pharmaceuticals, Inc. | Harmony Biosciences Holdings, Inc. | Corcept Therapeutics Incorporated | Collegium Pharmaceutical, Inc. |
|---|---|---|---|---|---|---|
| ROIC | 85.6% | NM | NM | 14.9% | 5.5% | 11.0% |
| ROE | 25.5% | -8.2% | -3.6% | 18.2% | 15.2% | 20.8% |
| ROA | 21.9% | -3.1% | -2.7% | 12.5% | 11.9% | 3.8% |
| Asset Turnover | 0.53x | 0.37x | 0.49x | 0.68x | 0.91x | 0.47x |
Source: Peer-company SEC filings; comparability notes in 5.7 — see Appendix A.1.
One warning must precede any reading of this table. The ROIC row is not internally consistent across the columns and cannot be ranked ordinally. The peer ROIC figures are computed on gross invested capital — NOPAT divided by total debt plus total equity, with no netting of cash — a deliberate convention (see 5.7) that avoids the distorting artifacts that cash-netting produces for deeply net-cash companies. Catalyst’s own ROIC cell, 85.6%, is drawn from the model on a different basis and is far higher than the peer figures precisely because Catalyst carried an unusually small invested-capital base against its earnings. The correct conclusion is not that Catalyst out-returned its peers by the margin the two numbers imply; it is that Catalyst’s returns on capital were high — as one would expect of a debt-free, asset-light franchise — but that the cross-column comparison of the ROIC row specifically is distorted by definition and should be read with that in mind. Jazz and Supernus ROIC are not meaningful at all this year, both having run operating losses.
ROE and ROA are cleaner. Catalyst’s ROE of 25.5% and ROA of 21.9% led the profitable peers — Collegium at 20.8% ROE, Harmony at 18.2%, Corcept at 15.2% — and did so on an unlevered balance sheet, which makes the ROE the more impressive of the two: Collegium reached a comparable ROE only with the help of heavy leverage (its ROA of 3.8% is a fraction of Catalyst’s), whereas Catalyst generated its equity return with no debt at all. Jazz’s and Supernus’s negative ROE and ROA are acquisition-charge artifacts and, in Jazz’s case, further complicated by an Irish-domicile tax benefit; neither is comparable. The low asset-turnover figures across the group — Catalyst at 0.53x — are characteristic of specialty-pharma balance sheets weighted with acquired intangibles and, for the net-cash names, large cash balances that depress the ratio without reflecting any operating weakness. One basis note, so the figures reconcile across sections: the asset-turnover row here is struck on PERIOD-END total assets, to sit on the same footing as the peer figures, whereas the DuPont decomposition in Section 3.4 uses AVERAGE total assets and therefore reports a slightly higher turnover for Catalyst. The ROA row above is likewise on an average-asset basis, so the three figures in this table do not multiply out to the DuPont identity; that identity is presented, complete and internally consistent, in Section 3.4.
Historical: Catalyst Pharmaceuticals Inc Own 5-Year Progression
| Metric | FY2021 | FY2022 | FY2023 | FY2024 | FY2025 |
|---|---|---|---|---|---|
| ROIC | 105.1% | - | 26.2% | 64.2% | 85.6% |
| ROE | 21.0% | 32.8% | 20.7% | 29.4% | 25.5% |
| ROA | 18.4% | 27.1% | 16.9% | 24.8% | 21.9% |
Source: Peer-company SEC filings; comparability notes in 5.7 — see Appendix A.1.
Catalyst’s own return series is volatile in a way that itself tells the story of the business model. The very high ROIC of 105.1% in FY2021 reflects a tiny invested-capital base being lapped by fast-growing earnings; the step-down to 26.2% in FY2023 tracks the acquisition charges and the enlargement of the capital base as each new product was bought onto the balance sheet, after which the ratio rebuilt to 64.2% and 85.6%. The FY2022 cell is deliberately blank, as Section 3 explains: with no debt and a cash balance almost exactly equal to equity, invested capital collapsed to near zero that year and the ratio ceases to carry economic meaning, so the model declines to print one. ROE and ROA followed a steadier upward path once the franchise matured. The pattern is consistent throughout: returns were high because capital employed was low, and the acquisitions that drove revenue growth were also what periodically reset the return ratios.
5.4 Leverage & Liquidity Comparison
sources Comparative: Most Recent Full Fiscal Year (FY2025)
| Metric | Catalyst Pharmaceuticals Inc | Jazz Pharmaceuticals plc | Supernus Pharmaceuticals, Inc. | Harmony Biosciences Holdings, Inc. | Corcept Therapeutics Incorporated | Collegium Pharmaceutical, Inc. |
|---|---|---|---|---|---|---|
| Net Debt / EBITDA | -2.4x | 11.0x | -10.5x | -3.1x | -11.6x | 1.0x |
| Total Debt / Equity | 0.0x | 1.2x | 0.0x | 0.2x | 0.0x | 2.7x |
| Interest Coverage | - | NM | NA | 14.2x | NA | 2.2x |
| Current Ratio | 6.1x | 1.9x | 1.9x | 3.6x | 2.9x | 1.6x |
| FCF Margin | 35.4% | 30.4% | 6.4% | 40.1% | 18.6% | 42.0% |
Source: Peer-company SEC filings; comparability notes in 5.7 — see Appendix A.1. Interest coverage and net-debt/EBITDA marked NA/net-cash where the company carries no funded debt; Jazz and Supernus ratios reflect FY2025’s distorted EBITDA.
This is the comparison Catalyst wins cleanly and without qualification. It was debt-free — total debt to equity of 0.0x — with net cash of $709.2M against $589.0M of revenue, giving a net-debt/EBITDA of -2.4x (negative because it is net cash) and a current ratio of 6.1x, by far the highest liquidity buffer in the group. Interest coverage is not applicable because there was no interest to cover. The peer group, however, is anything but uniform, and any EV-based or leverage ranking is meaningless unless each peer’s structure is stated. Supernus and Corcept are, like Catalyst, debt-free and net-cash — their large negative net-debt/EBITDA figures (-10.5x and -11.6x) are net-cash positions, not distress. Harmony carries modest debt (0.2x debt-to-equity) but is comfortably net-cash and covers interest 14.2x. At the other end sit the two levered names: Jazz, with debt-to-equity of 1.2x (its 11.0x net-debt/EBITDA is inflated further by the IPR&D-depressed EBITDA denominator), and Collegium, the sharpest contrast to Catalyst — debt-to-equity of 2.7x, net-debt/EBITDA of 1.0x and interest coverage of only 2.2x. Collegium runs essentially the same product-rights business model as Catalyst but funds it with substantial leverage; the two balance sheets are opposite poles of the same commercial strategy. For an acquirer, Catalyst’s un-levered, net-cash balance sheet was a material part of what was being bought — a point where the cash pile is shown to compress enterprise value well below the equity price paid.
5.5 Valuation Multiples Comparison
sources Comparative: Catalyst frozen at the $31.50 deal price; peers at live market prices (~7 Aug 2026)
| Metric | Catalyst Pharmaceuticals Inc | Jazz Pharmaceuticals plc | Supernus Pharmaceuticals, Inc. | Harmony Biosciences Holdings, Inc. | Corcept Therapeutics Incorporated | Collegium Pharmaceutical, Inc. |
|---|---|---|---|---|---|---|
| EV/EBITDA | 10.6x† | NMᵐ | NMᵐ | 3.8xᵐ | 242.4xᵐ | 3.7xᵐ |
| P/E | 18.8x† | NMᵐ | NMᵐ | 10.1xᵐ | 118.9xᵐ | 17.3xᵐ |
| FCF Yield | 5.4%† | 8.2%ᵐ | 1.8%ᵐ | 21.6%ᵐ | 1.2%ᵐ | 30.1%ᵐ |
Source: Peer-company SEC filings; comparability notes in 5.7 — see Appendix A.1.
Flag legend: † = Catalyst multiples frozen at the $31.50 Angelini cash consideration on FY2025 results — an exit multiple, not a live quote, and it does not move; ᵐ = peer multiple market-sourced (Tier 2, market caps from public aggregators ~7 Aug 2026). Jazz and Supernus EV/EBITDA and P/E are not meaningful for FY2025 (GAAP losses). Supernus’s market cap is influenced by its 3 Aug 2026 announced merger of equals with Indivior; Harmony’s available market cap was somewhat stale. All peer multiples are directional context, not precise.
This table must be read for what it is and nothing more. It does not, and cannot, produce a fair value or an implied price for Catalyst — the equity is retired, and no peer-multiple exercise revives it. What it shows is the relationship between the exit multiple Angelini actually paid and what the market was, on the same date, paying for comparable businesses. On FY2025 results the deal was struck at 10.6x EV/EBITDA — the identical figure carried in the separate valuation — 18.8x earnings and a 5.4% free-cash-flow yield. Against the peer set, that exit multiple sits above the two closest live comparables: Harmony traded at 3.8x EV/EBITDA and 10.1x earnings, Collegium at 3.7x and 17.3x. In other words, Angelini paid a meaningful premium to where the public market was valuing similarly de-risked, cash-generative specialty franchises — consistent with the control premium a strategic buyer pays to take out an entire company, as the separate valuation sets out.
The more arresting fact in the row, however, is how depressed the live small-cap multiples themselves were. Harmony and Collegium — both profitable, both cash-generative — were trading at low-single-digit EV/EBITDA multiples (3.8x and 3.7x) on low-to-mid-teens earnings multiples, valuations that embed the market’s deep and persistent discount of single-product, patent-dependent specialty pharma. Corcept sits at the opposite extreme, at 242.4x EV/EBITDA and 118.9x earnings, but that is a growth premium on currently low GAAP earnings (suppressed by its heavy internal R&D), not a clean read of value. Jazz and Supernus are not meaningful on either multiple this year. The honest summary is that the acquirer’s exit multiple was full relative to the market’s marked-down pricing of the closest comparables, yet unremarkable in absolute terms — a mid-teens-and-below cluster is not a rich valuation by any broad-market standard, and it reflects exactly the concentration and patent risks the comparables’ own multiples were already discounting.
Historical: Catalyst Pharmaceuticals Inc EV/EBITDA (period-end price)
| FY2021 | FY2022 | FY2023 | FY2024 | FY2025 |
|---|---|---|---|---|
| 10.6x | 17.2x | 14.8x | 9.0x | 7.6x |
Source: Peer-company SEC filings; comparability notes in 5.7 — see Appendix A.1.
[Rating and price target withdrawn — see the note at the top.] The 10.6x deal multiple therefore sits above the 7.6x the market was applying just before the transaction — the premium to a base the market had already discounted, which is the central finding of the exit-price analysis.
5.6 Efficiency Comparison
| Metric | Catalyst Pharmaceuticals Inc | Jazz Pharmaceuticals plc | Supernus Pharmaceuticals, Inc. | Harmony Biosciences Holdings, Inc. | Corcept Therapeutics Incorporated | Collegium Pharmaceutical, Inc. |
|---|---|---|---|---|---|---|
| Days Sales Outstanding | 59 days | 71 days | 95 days | 41 days | 29 days | 99 days |
| Days Inventory Outstanding | 119 days | 302 days | 403 days | 10 days | NM | 156 days |
| Days Payables Outstanding | 58 days | 88 days | NM | 33 days | NM | 41 days |
| Cash Conversion Cycle | 120 days | 285 days | NM | 18 days | NM | 214 days |
| CapEx / Revenue | 0.0% | 1.4% | 0.2% | 0.0% | 0.0% | 0.2% |
Source: Peer-company SEC filings; comparability notes in 5.7 — see Appendix A.1. Supernus reports payables combined with accrued liabilities, so its DPO and cash conversion cycle are not isolable; Corcept’s cost of sales is negligible, so its inventory and payables days are not meaningful.
The efficiency picture is unremarkable in the reassuring sense: Catalyst sat in the middle of the group, with no working-capital red flag and no standout advantage. Its cash conversion cycle of 120 days was materially tighter than the levered, inventory-heavy names — Jazz at 285 days and Collegium at 214 days both carry very long cycles, driven by large inventory balances (302 days and 156 days of inventory respectively) — but looser than Harmony’s exceptionally tight cycle of 18 days. Catalyst’s receivables discipline (DSO of 59 days) is worth one caveat that Section 3 develops: the receivable sits overwhelmingly with a single exclusive distributor, so the DSO is a clean number attached to a concentrated counterparty rather than a diversified book. Capital intensity is negligible across the entire peer set — Catalyst’s CapEx/revenue of 0.0% is barely distinguishable from Harmony’s 0.0% or Corcept’s 0.0% — which is the defining financial signature of the asset-light, product-rights specialty-pharma model: these companies convert almost all of their operating profit into free cash flow because they build almost nothing.
5.7 Comparability Caveats
sources This peer comparison is usable only if the reader carries its limitations forward into every table above. The material issues, drawn from the peer-research comparability review, are as follows.
One-off acquisition charges make Jazz and Supernus FY2025 profitability not meaningful (affects EBIT, EBITDA, net margin, ROIC, ROE, ROA, P/E, EV/EBITDA, interest coverage, net-debt/EBITDA). Both folder peers posted GAAP operating losses in FY2025 for reasons that have nothing to do with underlying economics. Jazz absorbed a $947.9M acquired-IPR&D charge, largely non-cash, which turned operating income into a loss; on an ex-charge basis operating income was roughly $517.6M, a ~12.1% margin. Supernus’s Sage Therapeutics acquisition lifted SG&A to $485.6M from $321.6M and added a $25.4M contingent-consideration loss, converting +$81.7M of FY2024 operating income into a $(62.3)M loss. Their FY2025 margins, returns and earnings multiples are flagged not-meaningful and are used for directional context only; Catalyst’s clean full-year margins cannot be ranked ordinally against them.
Jazz’s Irish domicile makes its net-based metrics non-comparable (affects net margin, ROE, ROA, P/E). Jazz files US GAAP but is Irish-domiciled, and its FY2025 result includes a large tax benefit of $272.4M reflecting that structure. Its net income, net margin, ROE and ROA are therefore not comparable to the US-domiciled, normally-taxed names even setting aside the IPR&D distortion.
Leverage varies enormously across the group, so all EV-based and leverage rankings require the structure to be stated (affects net-debt/EBITDA, EV/EBITDA, debt-to-equity, interest coverage). Catalyst was debt-free with net cash of $709.2M against $589.0M of revenue. Supernus and Corcept are likewise debt-free/net-cash; Harmony carries modest debt but is net-cash; Jazz is materially levered; Collegium is heavily levered with interest coverage of only 2.2x. For all net-cash names, net-debt/EBITDA is negative and denotes cash, not distress.
Gross margins are not presented on a uniform basis (affects gross margin, EBITDA margin). Catalyst, Jazz, Supernus and Corcept exclude amortization of acquired intangibles from cost of sales. Harmony folds intangible amortization (~$23.8M) and Bioprojet royalties into cost of product sold, so its reported gross margin is understated relative to Catalyst’s basis and should not be ranked against it. Collegium folds a large amortization charge into COGS, giving a reported gross margin far below the figure shown here; the 87.8% used in 5.2 is Collegium’s separately disclosed ex-amortization gross margin — a disclosed component, not an analyst normalization — and is comparable to Catalyst. Collegium’s high EBITDA margin is correspondingly inflated by that amortization add-back and should be compared with care.
Catalyst’s operating-margin lead is a business-model difference, not pure efficiency (affects EBIT margin, ROIC). Catalyst spent roughly 2.2% of revenue on R&D ($12.7M) because it acquired product rights rather than discovering them, and that is the principal reason its EBIT margin sits far above Corcept, which runs a heavy internal-discovery model, and Harmony, which likewise funds substantial internal R&D. The margin gap should be read as the accounting consequence of a low-R&D franchise carrying a thin internal pipeline, not as evidence that Catalyst executed more efficiently than peers investing in their own future products.
Acquired-IPR&D charges distort single-year R&D and operating margin for Jazz and Harmony (affects EBIT margin, ROIC). Jazz’s FY2025 R&D/operating line carries the $947.9M IPR&D charge; Harmony’s FY2025 R&D includes a $34.25M acquired-IPR&D charge. Catalyst’s own large acquired-IPR&D charge fell in FY2023, not FY2025, so Catalyst’s FY2025 R&D line is on cleaner footing than these two acquiring peers this year.
ROIC is computed on gross invested capital and is not cross-comparable to Catalyst’s model ROIC (affects ROIC). Peer ROIC is NOPAT divided by total debt plus total equity, not netted for cash, which understates the cash drag for net-cash names but avoids the distorting artifacts that cash-netting produces. Catalyst’s own 85.6% cell comes from the model on a different, lower-invested-capital basis and is not on the same footing as the peer figures; the ROIC row must not be ranked ordinally across columns. [Rating and price target withdrawn — see the note at the top.]
All peer valuation multiples are Tier 2, market-sourced, and two peers are in live M&A (affects EV/EBITDA, P/E, FCF yield). Peer market caps come from public aggregators dated on or about 7 August 2026, while every operating figure is from the primary 10-K. Supernus’s cap is influenced by its 3 August 2026 announced merger of equals with Indivior; Harmony’s available cap was somewhat stale. Jazz and Supernus P/E and EV/EBITDA are not meaningful for FY2025. Catalyst’s multiples, by contrast, are frozen at the $31.50 Angelini consideration and represent what an acquirer paid, not a live quote. All peer multiples should be treated as directional context.
Working-capital days are not available or not meaningful for two peers (affects DIO, DPO, CCC). Supernus reports accounts payable combined with accrued liabilities, so its DPO and cash conversion cycle cannot be isolated. Corcept’s cost of sales is negligible, so its inventory and payables days are not meaningful. These cells should be read as unavailable rather than as favourable or unfavourable comparisons.
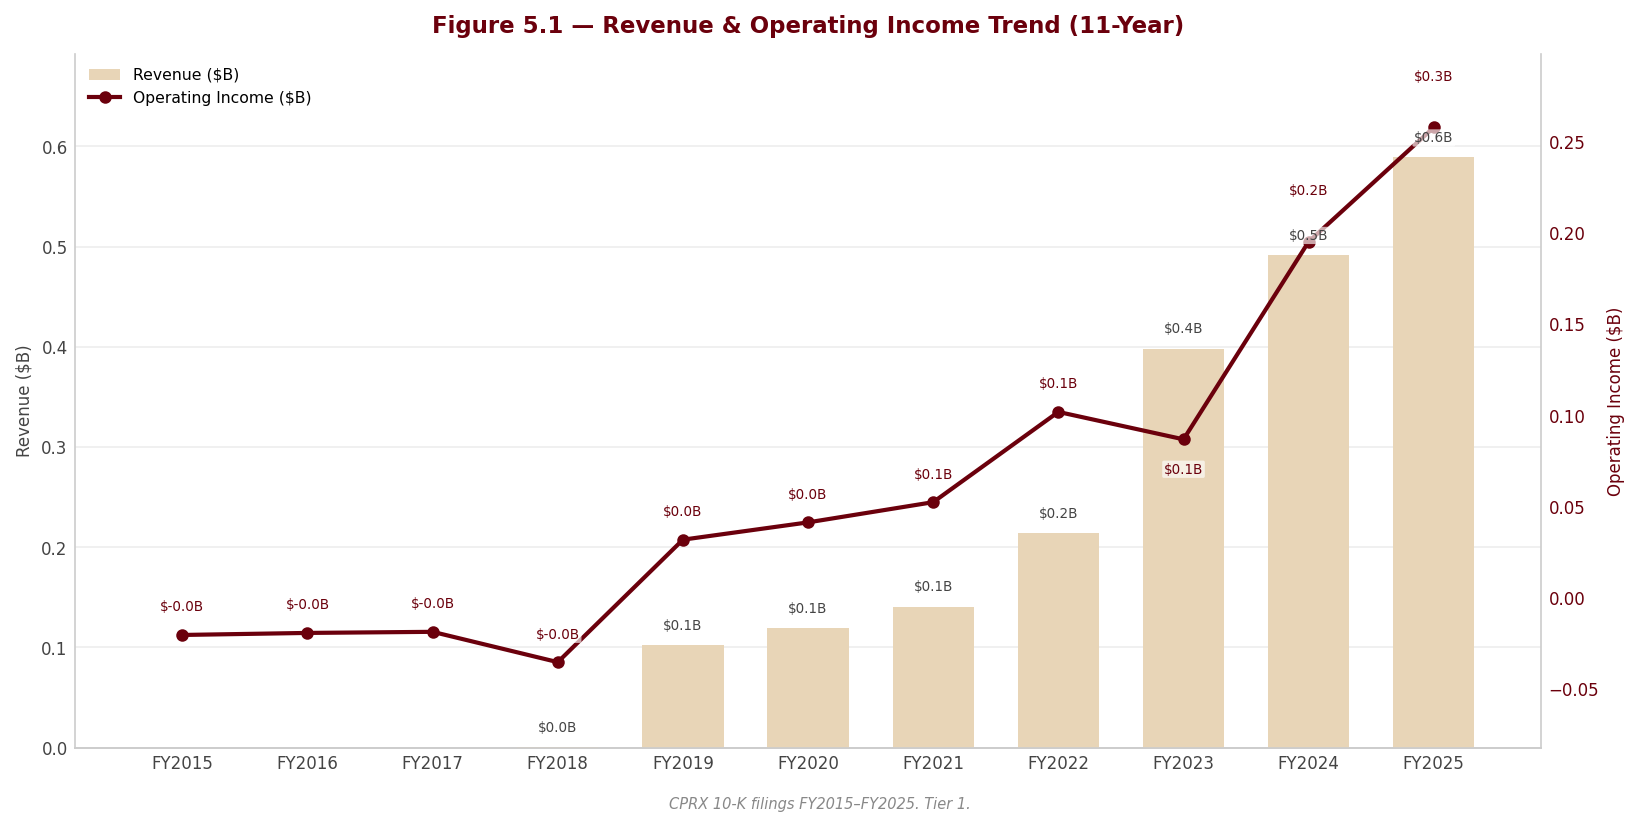
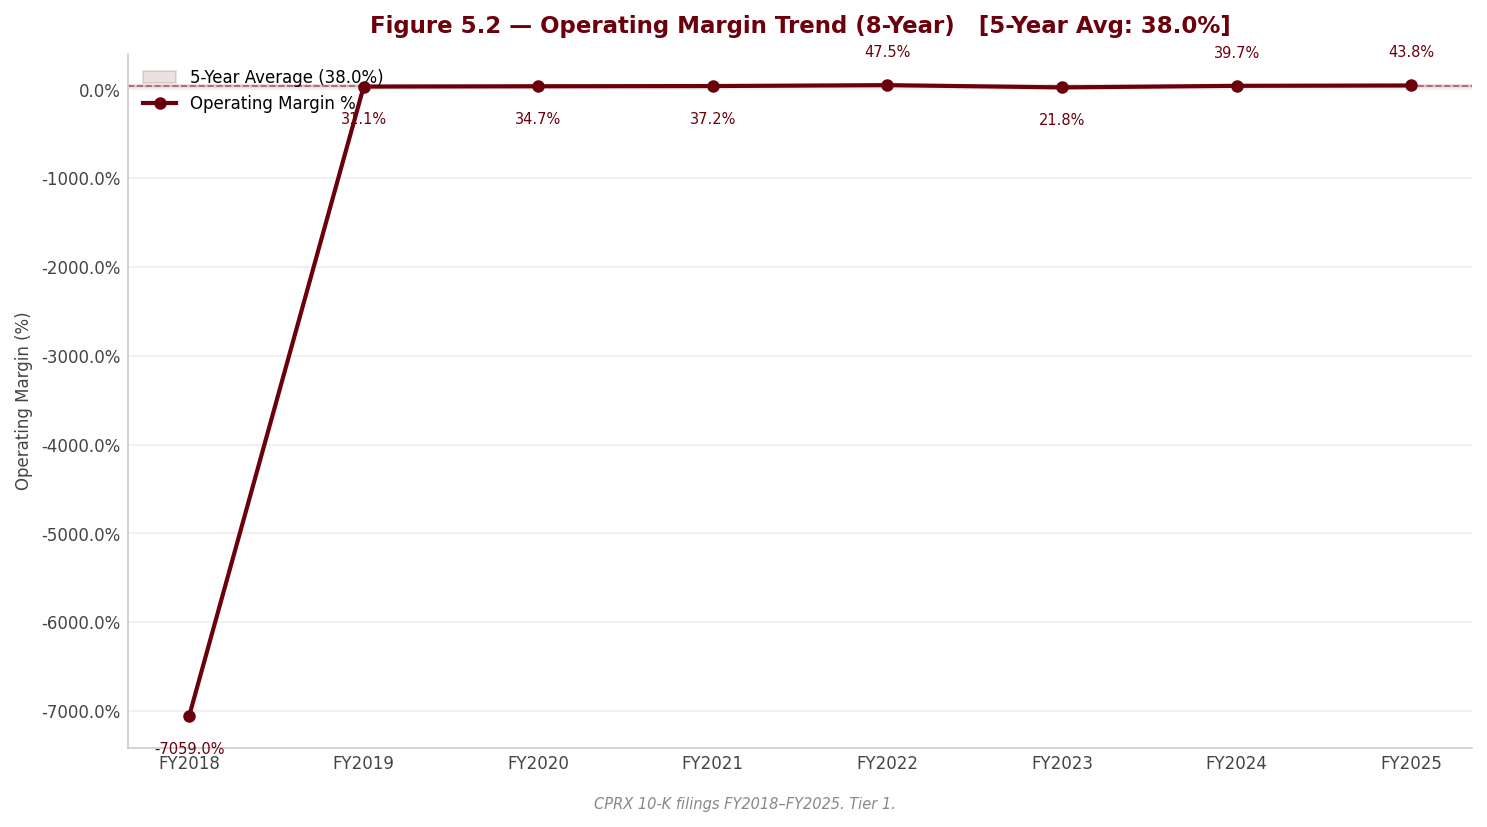
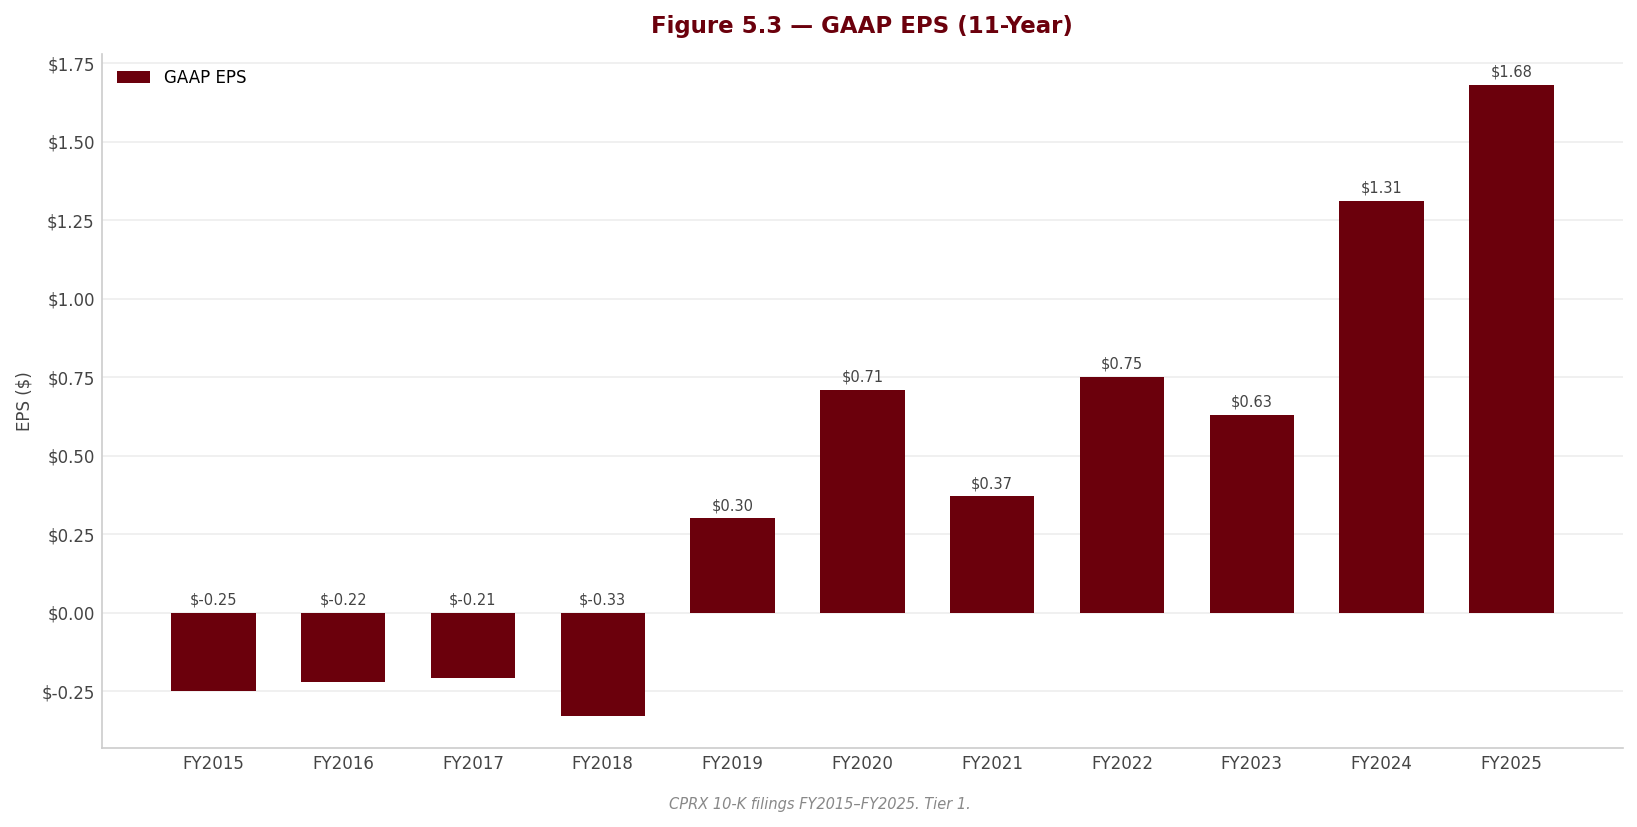
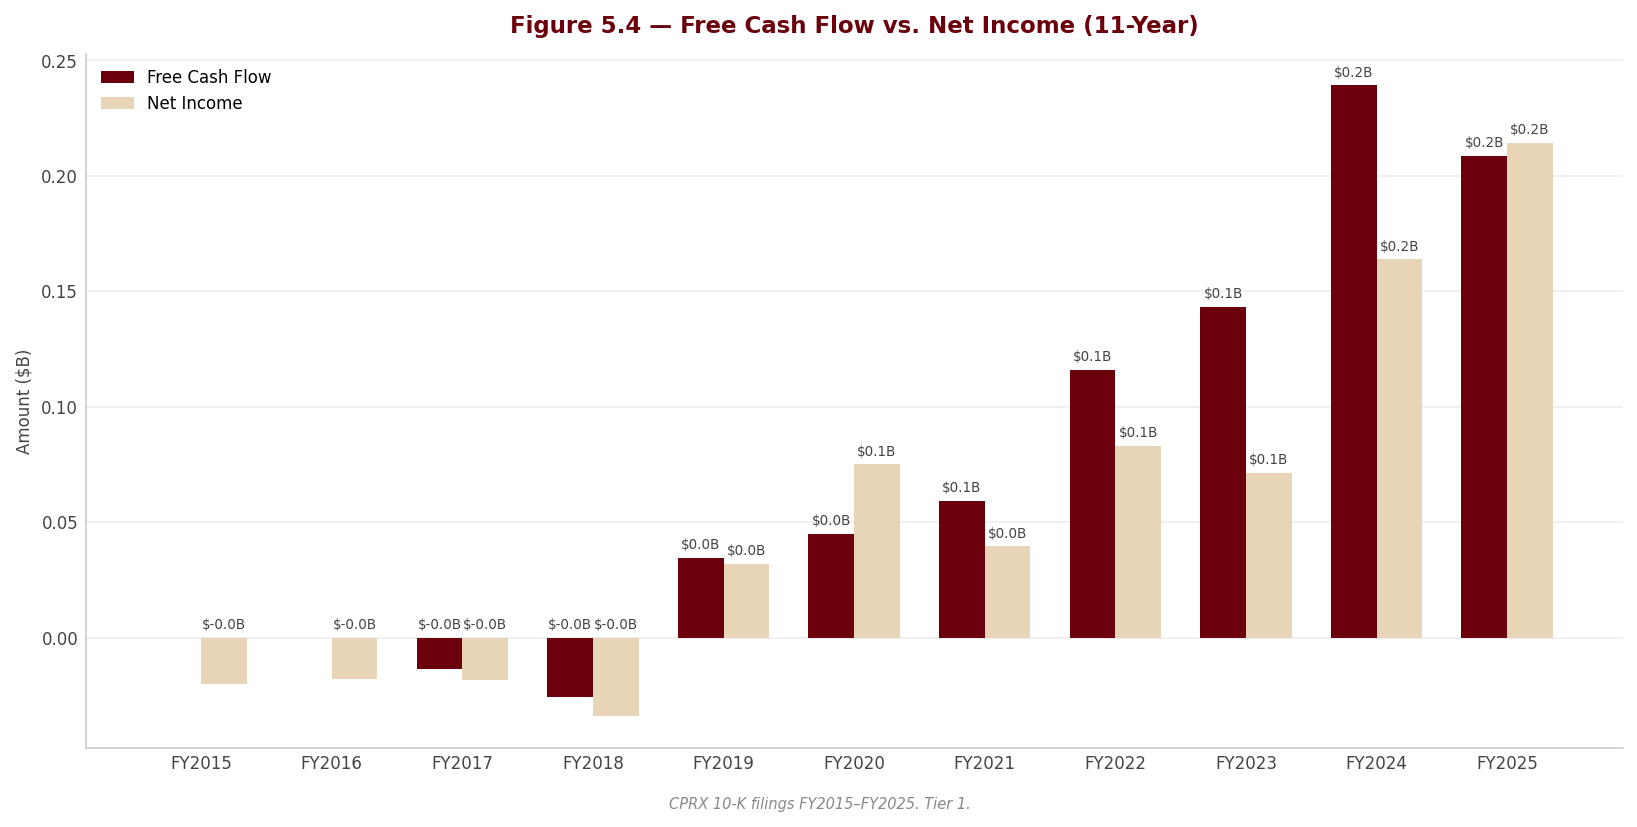
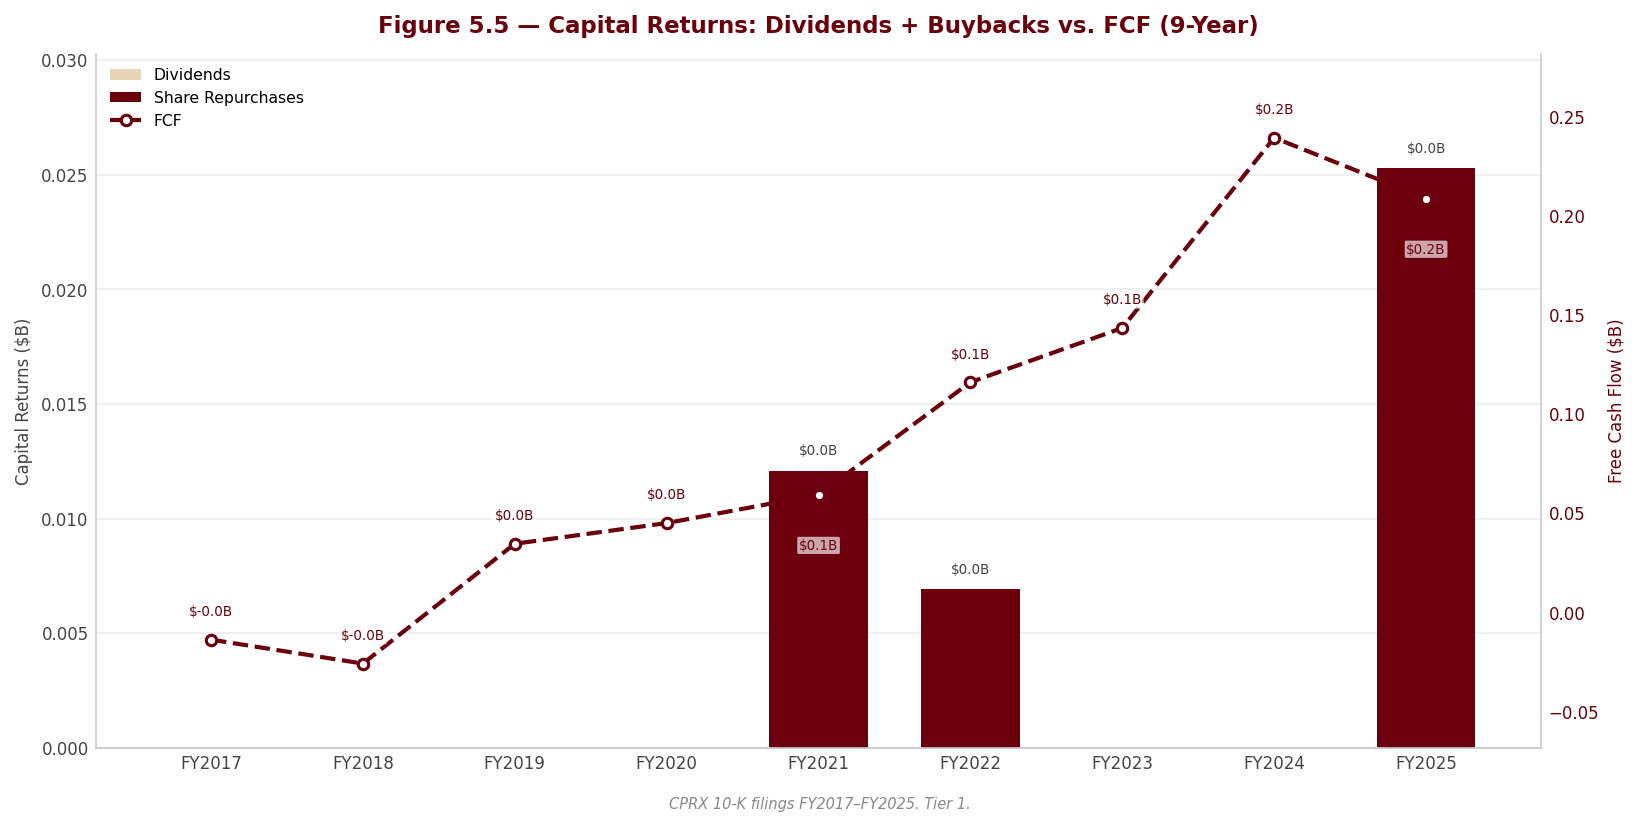
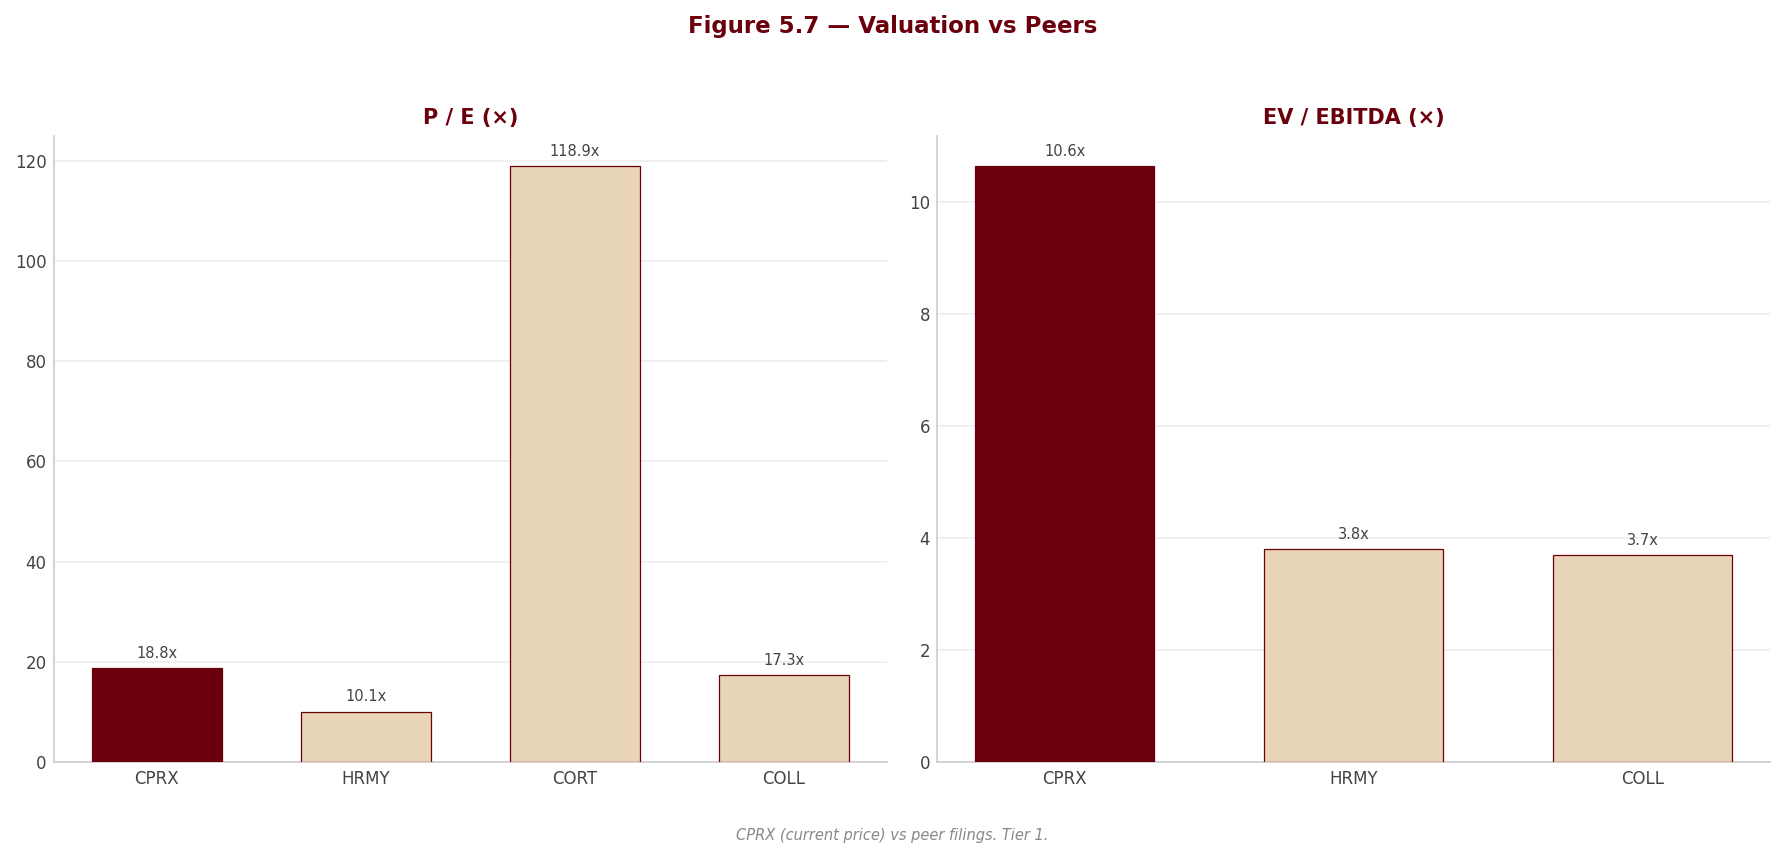
6. Valuation & Price Target withdrawn
This section stated what the shares were worth and what to do about them. It rested on an exit multiple set by hand — across the coverage it averaged 24% below where each company actually traded — so the conclusion largely restated that assumption instead of testing it. Rather than leave it standing, it has been withdrawn while the method is rebuilt.
Nothing else in this report depends on it: the financial analysis above and below is drawn from the company's own filings, and every figure links to the page it was verified against.
Section 7 — Quarterly Update: Q1 2026
sources This is the last quarter Catalyst Pharmaceuticals ever reported as a public company. The Form 10-Q for the quarterly period ended 2026-03-31 was signed on 2026-05-11, five days after the merger agreement with Angelini Pharma was executed, and it is the final clean read on the operating business before that business was absorbed. Nine weeks later the transaction closed at $31.50 per share in cash, the common stock was delisted from Nasdaq and registration was terminated by the filing of Form 15-12G on 2026-07-24. What follows is therefore not a decision note. [Rating and price target withdrawn — see the note at the top.] The question this section answers is narrower and more useful for the file: what was the operating business actually doing in the quarter immediately before it was taken out, and does the last set of accounts support or undercut the reading of the exit and 6.
Status of the position
| Assessment | |
|---|---|
| Position status | Closed. Cashed out at $31.50 per share in cash on 2026-07-16; no continuing security, therefore no action to state. |
| What the quarter showed | Revenue of $149.4M against $141.4M a year earlier, with EBIT of $73.2M against $63.4M — earnings growing faster than the top line as the FIRDAPSE royalty burden stepped down. |
| Thesis reading | Confirmed on operations, unchanged on structure. The compounding was real and still running; the two structural qualifications — one customer, one flagship product — did not improve, and customer concentration deepened materially in the quarter. |
| Why no action is stated | The merger agreement was signed on 2026-05-06 and closed on 2026-07-16. Every holder received a fixed cash sum; there is no forward return on which an action could bear. |
Source: Catalyst Pharmaceuticals Form 10-Q for the quarterly period ended March 31, 2026 (pp. 4, 17, 34); FL model (Data sheet, quarterly columns) — see Appendix A.1–A.2.
7.1 Results at a Glance
| Metric | Q1 2026 | Q1 2025 | Q4 2025 |
|---|---|---|---|
| Revenue ($M) | $149.4M | $141.4M | $152.6M |
| Cost of sales ($M) | $14.5M | $17.9M | $26.1M |
| Gross profit ($M) | $134.9M | $123.5M | $126.5M |
| SG&A ($M) | $49.3M | $46.9M | $53.4M |
| D&A ($M) | $9.8M | $9.5M | $9.5M |
| EBITDA ($M) | $83.0M | $72.9M | $71.3M |
| EBIT ($M) | $73.2M | $63.4M | $61.8M |
| Interest expense ($M) | $0.0M | $0.0M | —ᵃ |
| Net income ($M) | $63.7M | $56.7M | $52.7M |
| Diluted EPS | $0.50 | $0.45 | —ᵇ |
ᵃ The company carried no funded debt in any period shown, and the Q4 2025 column is derived (full year less nine months), so no standalone interest figure is separable for it (10-Q p. 3). ᵇ Earnings per share are not additive across quarters, so a Q4 2025 figure cannot be derived from the annual and nine-month statements; no standalone prior-quarter EPS is stated.
Source: Catalyst Pharmaceuticals Form 10-Q for the quarterly period ended March 31, 2026, condensed consolidated statements of operations (p. 4) and balance sheets (p. 3); FL model (Data sheet, quarterly columns) — see Appendix A.1–A.2.
The shape of the quarter is best stated plainly before it is explained. Against Q1 2025, revenue rose by roughly six per cent, gross profit by roughly nine, EBITDA by roughly fourteen, EBIT by roughly sixteen and net income by roughly twelve — a clean, ordered progression in which each line down the statement grew faster than the one above it, which is the arithmetic signature of margin expansion rather than volume alone. Diluted EPS advanced by five cents, or roughly eleven per cent, the gap to net-income growth explained by a diluted share count that was essentially flat year on year. Sequentially the picture inverts at the top and holds beneath it: revenue fell by roughly two per cent against Q4 2025 while gross profit rose by roughly seven, EBITDA by roughly sixteen and net income by roughly twenty-one.
Expressed as margins, gross profit of $134.9M on revenue of $149.4M is a gross margin near ninety per cent, some three percentage points above the equivalent Q1 2025 calculation and more than seven above the derived Q4 2025 column. EBIT of $73.2M on the same revenue base is an operating margin near forty-nine per cent against roughly forty-five a year earlier, and net income of $63.7M is a net margin near forty-three per cent against roughly forty. One caution governs every sequential comparison in this section: the Q4 2025 column is a derived one, computed as the full year less the nine months reported through September, so it absorbs all year-end true-ups — reserve adjustments, milestone accruals and inventory charges alike — and is structurally the noisiest of the three columns. The year-on-year comparison, drawn from two directly reported three-month periods on the same page of the filing, is the one that carries analytical weight.
7.2 P&L Drivers
sources Revenue. The top line advanced on a genuine reordering of the product mix rather than on uniform growth. FIRDAPSE net product revenue grew by roughly a fifth year on year and AGAMREE by roughly two-thirds, both attributed by management to higher sales volumes; FYCOMPA fell by roughly three-fifths following generic entry after the loss of exclusivity in 2025, with three generic tablet versions and one generic oral suspension on the market by the filing date (10-Q pp. 42, 39). The franchise therefore grew $149.4M of revenue while absorbing the near-collapse of one of its three products — the two growth assets more than covering the eroding one. This is also why the sequential decline against $152.6M should not be read as deterioration: FYCOMPA’s erosion is continuous and management expects it to continue, and the derived Q4 2025 column carries the year-end true-ups described above. Management expects revenue from the KYE and DyDo territories to remain immaterial through 2026 (10-Q p. 40); revenue from the DyDo arrangement was around a million dollars in the quarter, marginally below the prior-year figure (10-Q p. 26).
Cost and margin. The margin expansion is structural, contractual and dated, which is what makes it credible. [Rating and price target withdrawn — see the note at the top.] Against that, the quarter absorbed an inventory write-down of about half a million dollars in cost of sales relating to slow-moving FYCOMPA and unsalable AGAMREE inventory, where the prior-year quarter carried none (10-Q p. 21). D&A of $9.8M against $9.5M rose only marginally, reflecting the AGAMREE sales-based milestone capitalised at the end of 2025. SG&A of $49.3M against $46.9M grew more slowly than revenue: selling costs were flat to slightly down, and the increase sits in general and administrative, which management attributes to consulting fees on business-development activity (10-Q p. 43). [Rating and price target withdrawn — see the note at the top.]
Below the line and the $11.0M Hetero fee. There was no interest expense ($0.0M), the company having carried no funded debt at any point. [Rating and price target withdrawn — see the note at the top.] One point requires correction because it is easy to get wrong: the $11.0M litigation-avoidance fee payable to Hetero is not a charge in this quarter. The Hetero settlement was reached on 2026-05-06, after the 2026-03-31 quarter end, and is disclosed as a subsequent event (10-Q p. 34); management states expressly that general and administrative expenses will be affected by the payment in the second quarter of 2026 (10-Q p. 43). Q1 2026 EBIT of $73.2M and EBITDA of $83.0M therefore carry none of it, and no accrual for it appears in the quarter’s operating costs. The coincidence that the quarter’s other income, net — interest on the cash pile plus the Santhera mark-to-market — happens to be of almost identical magnitude is precisely that, a coincidence, and the two must not be conflated. Read forward, the fee is a single-quarter, one-off cost of roughly a seventh of this quarter’s operating profit, incurred to convert the last open patent challenge into a term-certain runway to approximately January 2035.
7.3 Balance Sheet & Cash Flow
| Metric | Q1 2026 | Q1 2025 | Q4 2025 |
|---|---|---|---|
| Cash & equivalents ($M) | $755.9M | $580.7M | $709.2M |
| Net debt / (net cash) ($M) | -$755.9M | -$580.7M | —ᶜ |
| Net debt / LTM EBITDA | —ᵈ | —ᵈ | —ᵈ |
| Total assets ($M) | $1,147.6M | $908.9M | $1,104.0M |
| Stockholders’ equity ($M) | $1,012.7M | $794.3M | $954.3M |
| Property & equipment, net ($M) | $1.0M | $1.2M | $1.0M |
| Operating cash flow ($M) | $59.6M | $60.0M | $44.9M |
| Capital expenditure ($M) | $0.0M | $0.0M | $0.0M |
| Free cash flow ($M) | $59.6M | $60.0M | $44.9M |
| Dividends paid ($M) | $0.0M | $0.0M | —ᶜ |
ᶜ The Q4 2025 column is derived (full year less nine months); the model carries no standalone net-debt or dividend figure for it. The company paid no dividend in any period covered by this report and reported no funded debt at either balance-sheet date (10-Q p. 3). ᵈ Not meaningful. Total liabilities comprise trade payables, accrued expenses and a small operating lease obligation; there is no borrowing of any kind, so net debt is net cash and a leverage multiple has no interpretation (10-Q p. 3).
Source: Catalyst Pharmaceuticals Form 10-Q for the quarterly period ended March 31, 2026, condensed consolidated balance sheets (p. 3) and statements of cash flows (p. 6); FL model (Data sheet, quarterly columns) — see Appendix A.1–A.2.
Balance sheet note. Cash rose to $755.9M from $709.2M at the year-end and $580.7M a year earlier — an increase of roughly seven per cent in three months and roughly thirty per cent in twelve — and the company remained entirely unlevered, so net debt of -$755.9M is net cash of that amount, against -$580.7M a year earlier (10-Q p. 3). Two composition changes inside that balance are worth recording. First, the great majority of the cash balance was moved into U.S. Treasuries classified as cash equivalents during the quarter, where the year-end balance had sat in money market funds — a maturity and yield decision, not a change in liquidity (10-Q pp. 11–12, 20). Second, within current liabilities, accrued licence fees and amounts due to the licensor fell sharply as the AGAMREE sales-based milestone earned in Q4 2025 was paid, while accrued revenue allowances — the gross-to-net reserve — rose materially and accrued income tax rose from a nominal year-end balance (10-Q p. 25). The rise in the revenue-allowance accrual is the line to watch in a business whose reported revenue is stated after judgmental deductions; it moved up faster than revenue in the quarter, which is consistent with the deepening channel concentration described below and with normal first-quarter reserve build, but it is an estimate, not an observation. Equity of $1,012.7M rose against both comparatives despite share repurchases, on retained earnings.
Cash flow note. Operating cash flow of $59.6M was marginally below the $60.0M of a year earlier and roughly a third above the derived $44.9M; with capital expenditure immaterial at $0.0M, free cash flow of $59.6M converted roughly ninety-four per cent of net income of $63.7M. The year-on-year shortfall in operating cash despite higher earnings has a single identified cause: the AGAMREE sales-based milestone, earned when the product crossed its revenue threshold in Q4 2025, was paid in cash this quarter, and management names it as the primary reconciling item (10-Q p. 45). Adjusting for that one payment, cash generation tracked earnings comfortably. The other significant working-capital movements were a receivables build broadly in line with revenue and a reduction in accrued expenses; financing outflows were dominated by share repurchases (10-Q p. 6).
7.4 Footnote Review
sources Note 1 — Organization and Description of Business (10-Q pp. 7–8). Describes the three-product commercial base (FIRDAPSE, AGAMREE, FYCOMPA) and, under Recent Developments, discloses the 2026-05-06 merger agreement with Angelini Pharma S.p.A. and Angelini Cielo Inc., cross-referring to Note 17. Changed materially versus Q1 2025, which carried no such disclosure. Analytically this is the note that converts every forward-looking statement elsewhere in the filing into a statement about a company that was already being sold.
Note 2 — Basis of Presentation and Significant Accounting Policies (10-Q pp. 9–19). Read in full. Sub-sections a through o (interim basis, consolidation, estimates, cash, investments, receivables, inventory, prepaid, property, asset-acquisition accounting, intangibles, fair value, leases, share repurchases) are consistent in policy with the prior-year presentation; the substantive content sits in the sub-sections below, which are treated separately. The fair-value tables show the cash balance moving from money market funds at the year-end into money market funds plus U.S. Treasuries at 2026-03-31, all Level 1 (10-Q pp. 11–12).
Note 2.p — Revenue recognition and disaggregation by product (10-Q pp. 13–16). FIRDAPSE and AGAMREE are sold through a single exclusive distributor which resells to a small group of specialty pharmacies; FYCOMPA is sold directly to wholesalers. The disaggregation table gives the product split described in 7.2: FIRDAPSE up roughly a fifth, AGAMREE up roughly two-thirds, FYCOMPA down roughly three-fifths against Q1 2025 (10-Q p. 13). Net product revenue is stated after a full set of gross-to-net deductions — trade discounts and wholesaler fees, prompt-payment discounts, co-pay assistance, product returns, provider chargebacks, government rebates including the IRA inflation-penalty rebates, and payor rebates — each an estimate under the expected-value method (10-Q pp. 13–15). The Company states that adjustments to prior-period revenues from variance in these estimates were immaterial for all periods presented (10-Q p. 13). Unchanged in method versus Q1 2025; unchanged, therefore, in the judgment risk it carries, which the separate valuation identifies as one of the two structural qualifications on the record.
Note 2.t — Concentration of risk (10-Q p. 17). This is the most consequential disclosure in the filing after the subsequent events. A single customer accounted for roughly nine-tenths of total net product revenue in Q1 2026, against roughly three-quarters in Q1 2025 — a jump of some sixteen percentage points in twelve months. The deepening is arithmetically inevitable given the mix shift (the concentrated FIRDAPSE/AGAMREE channel grew while directly-distributed FYCOMPA collapsed), but the effect is real: by the final quarter, both the revenue line and the enlarged receivable sat almost entirely with one counterparty. The note also records sole-source supply dependence for AGAMREE on Santhera, with a second supplier in process. Changed materially and adversely versus Q1 2025.
Note 2.u — Royalties (10-Q p. 17). Royalties are expensed to cost of sales as product revenue is recognised. Records that the minimum annual royalty under the RUZURGI agreement rises for calendar years from 2026 through the expiry of the FIRDAPSE royalty term, unless a competing or generic amifampridine product is marketed in the U.S. Changed versus Q1 2025 in that the higher minimum is now in force; directly relevant to the cost-of-sales movement in 7.2.
Note 2.v — Income taxes (10-Q p. 18). Asset-and-liability method; no material uncertain tax positions at either 2026-03-31 or 2025-12-31, and open to examination from 2022. Confirmed unchanged in substance versus Q1 2025 (10-Q p. 18).
Note 2.x — Net income per share (10-Q p. 18). Reconciles basic to diluted weighted-average shares. The dilutive effect narrowed year on year while basic shares rose, leaving diluted shares broadly flat; antidilutive common stock equivalents excluded from the calculation increased. This is why diluted EPS of $0.50 grew slightly less than net income.
Note 2.y — Segment information (10-Q p. 18). One reportable segment; the CODM is the chief executive and reviews consolidated operating margin and net income. The significant-expense table splits selling from general and administrative: selling expense was flat to slightly lower year on year while general and administrative rose, corroborating the SG&A analysis in 7.2. Unchanged in structure versus Q1 2025.
Note 2.z–aa — Reclassifications and recently issued standards (10-Q p. 19). Certain prior-year amounts were reclassified to conform to current presentation. ASU 2025-05 (credit losses on receivables) was adopted prospectively at 2026-01-01 with the practical expedient elected and no material impact; ASU 2024-03 (expense disaggregation) and ASU 2025-06 (internal-use software) are effective later and remain under evaluation. No effect on the quarter’s reported figures.
Note 3 — Investments (10-Q p. 20). U.S. Treasuries held as cash equivalents at 2026-03-31 carried a negligible gross unrealised gain and no unrealised losses; there were none at 2025-12-31. Net gains on the Santhera equity securities were recognised in other income and were materially higher than in Q1 2025, all of them unrealised on shares still held; there were no purchases or sales. Changed versus Q1 2025 in magnitude, not in kind. Analytically: a meaningful part of the year-on-year growth in other income is a mark-to-market on a listed Swiss holding, not operating performance, and it does not touch EBIT.
Note 4 — Accumulated other comprehensive income (10-Q p. 21). The only component is unrealised gains and losses on available-for-sale securities; the balance moved from nil at the year-end to a negligible positive figure, against a small negative movement in Q1 2025. No reclassifications out of AOCI in either period. Immaterial to the thesis.
Note 5 — Inventory (10-Q p. 21). Raw materials, work-in-process and finished goods all declined against the year-end. The Company recorded inventory write-downs of about half a million dollars in cost of sales relating to slow-moving FYCOMPA and unsalable AGAMREE inventory, and identified a similar amount of unsalable product carried in prepaid expenses because it expects reimbursement. There were no inventory reserves in Q1 2025. Changed versus Q1 2025; small in absolute terms, but it is the first visible inventory consequence of the FYCOMPA generic entry and it depressed the quarter’s gross margin rather than flattering it.
Note 6 — Prepaid expenses and other current assets (10-Q p. 22). Composition consistent with the prior period; the largest movements are a decline in prepaid tax and interest receivable against increases in prepaid commercialisation, subscription and conference costs. No analytical significance.
[Rating and price target withdrawn — see the note at the top.] No finance leases. Confirmed unchanged versus Q1 2025 in all material respects (10-Q p. 23).
Note 8 — Property and equipment, net (10-Q p. 24). Net book value of $1.0M against $1.0M at the year-end and $1.2M a year earlier, on furniture, leasehold improvements and software. The scale of this line against revenue of $149.4M is the clearest single statement of how asset-light the business was: it owned essentially no physical capital, which is why capital expenditure of $0.0M rounds to nothing and free cash flow tracks operating cash flow almost exactly.
Note 9 — License and acquired intangibles, net (10-Q p. 24). The intangible base comprises the RUZURGI, FYCOMPA and AGAMREE rights, amortised straight-line over approximately 14.5, 5 and 10.5 years respectively; gross carrying value was unchanged from the year-end and the net balance declined by the quarter’s amortisation. The FYCOMPA intangible remains the largest of the three by net carrying value. No impairment charge was recognised in either Q1 2026 or Q1 2025, and the weighted-average remaining amortisation period shortened to about 4.4 years. This is the footnote most worth flagging: FYCOMPA revenue fell by roughly three-fifths year on year, the product lost exclusivity, marketing was discontinued at the end of 2025, and management lists FYCOMPA intangible impairment among its own forward risk factors (10-Q p. 48) — yet the asset was carried without write-down at the last reporting date. On the undiscounted-cash-flow recoverability test this may well be defensible; it nonetheless means the final balance sheet carries a declining asset at a value the accounting had not yet been forced to revisit.
Note 10 — Accrued expenses and other liabilities (10-Q p. 25). Accrued revenue allowances rose materially against the year-end and accrued income tax rose from a nominal balance, while accrued licence fees and amounts due to the licensor fell sharply on payment of the AGAMREE milestone, and accrued compensation fell on payment of year-end bonuses. Net of these, total current accrued liabilities declined. Changed versus the year-end in composition rather than direction; the gross-to-net reserve build is the item with thesis relevance, for the reason given in 7.3.
Note 11 — Collaborative and licensing arrangements (10-Q pp. 25–26). Two arrangements: KYE (FIRDAPSE and AGAMREE in Canada), from which revenues were not material in either period and are recorded in licence and other revenue; and DyDo (FIRDAPSE in Japan, launched January 2025), from which revenue of about a million dollars was recorded in product revenue, marginally below Q1 2025. Both accounted for under Topic 606. Unchanged in terms versus Q1 2025; the international franchise remained immaterial to the numbers throughout.
Note 12 — Commitments and contingencies (10-Q pp. 27–28). Set out in full under Contingencies and litigation below.
Note 13 — Agreements (10-Q pp. 29–32). The four underlying commercial agreements — the BioMarin/SERB licence for FIRDAPSE, the Jacobus licence and asset purchase for RUZURGI, the Eisai asset purchase for the U.S. FYCOMPA rights, and the Santhera licence and investment for AGAMREE — are restated with their consideration, royalty tiers and milestone obligations. No new agreement was entered into during the quarter and no term was amended, other than the previously agreed amendment permitting Catalyst to establish its own AGAMREE supply chain, expected to complete by the end of 2026 (10-Q p. 46). The contingent obligations that survived into the acquirer’s hands are the AGAMREE regulatory milestones for additional indications and the balance of the sales-based milestones, none of which was payable in the quarter. Confirmed unchanged in terms versus Q1 2025 (10-Q pp. 29–32).
[Rating and price target withdrawn — see the note at the top.] No material uncertain tax positions at either date. [Rating and price target withdrawn — see the note at the top.]
Note 15 — Stockholders’ equity (10-Q p. 33). No preferred stock outstanding. Under the repurchase programme authorised in October 2025 and running to the end of 2026, the Company retired just over six hundred thousand shares during the quarter, all of them in January and February; none were repurchased in Q1 2025, and none in the month of March 2026 (10-Q pp. 33, 51). The observation for the record is arithmetic: the average price paid to retire that stock was roughly a quarter below the $31.50 per share Angelini paid ten weeks later. Those repurchases were value-accretive to the holders who did not sell.
Note 16 — Stock compensation (10-Q pp. 33–34). Stock-based compensation rose modestly year on year across options and restricted stock units, with unrecognised compensation on unvested awards to be recognised over roughly two and a half years. Grants in the quarter were in line with the prior year. Changed only in degree; no acceleration, modification or change-of-control treatment is disclosed in this note, which is notable given that the merger agreement was signed before the filing date.
Note 17 — Subsequent events (10-Q p. 34). Set out in full under Subsequent events below.
Related-party transactions (10-Q pp. 9, 20, 31–32, 46). The filing presents no related-party transactions note, and no controlling shareholder, parent, affiliate or equity-method entity is disclosed anywhere in it; there are no management fees, no affiliate purchases or sales, and no intercompany transactions other than with the wholly-owned Irish subsidiary, which is eliminated on consolidation (10-Q p. 9). This entry cannot therefore be discharged by a transaction list, so the analytically equivalent relationship is documented instead. Catalyst held a block of ordinary shares in Santhera Pharmaceuticals Holding AG — a little over eleven per cent of that company at the time of purchase, and somewhat under ten per cent on the disclosure made as of 2026-04-29 — while Santhera was simultaneously its licensor for AGAMREE, its sole source of AGAMREE supply, and the counterparty to its royalty and milestone obligations on that product (10-Q pp. 9, 31–32, 37). Catalyst was therefore both shareholder in and commercial counterparty to the same company. The quarter’s dollar consequences of that relationship are three, each disclosed: an unrealised mark-to-market gain on the shareholding recorded in other income, materially larger than the equivalent gain in Q1 2025 (10-Q p. 20); AGAMREE royalties recognised in cost of sales, at approximately the same aggregate amount as in Q1 2025 (10-Q p. 47); and the AGAMREE sales-based milestone, earned in Q4 2025 and paid in cash during Q1 2026 (10-Q p. 45). No terms changed during the quarter. The point of substance is that a rising Santhera share price flattered reported net income through a line that has nothing to do with drug sales, while the same counterparty relationship carried the supply-concentration risk named in Note 2.t. [Rating and price target withdrawn — see the note at the top.]
Contingencies and litigation (10-Q pp. 27–28, 50). Four matters, all patent, and their status at the quarter end is the reason the timing of the sale matters. (1) Teva — settled 2025-01-08; agreed not to market a generic FIRDAPSE before 2035-02-25. (2) Inventia — settled 2024-07-30; acknowledged validity and infringement, agreed not to commercialise before the scheduled 2037 patent expiry or earlier entry of another qualifying ANDA product. (3) Lupin — converted five Paragraph IV certifications to Paragraph III in June 2024 and settled on substantially the Teva terms on 2025-08-26. (4) Hetero — still pending at 2026-03-31, on all FIRDAPSE Orange Book-listed patents, with trial scheduled to begin on 2026-05-18 and the thirty-month stay expiring on 2026-05-26; the filing states expressly that there could be no assurance the litigation would not allow a generic FIRDAPSE before 2035-02-25 (10-Q p. 28). Separately, the FYCOMPA Paragraph IV litigation settled in June 2024, and generics of both the tablet and oral-suspension formulations are now on the market (10-Q p. 28). No other litigation is considered material, and Item 1 Legal Proceedings adds nothing beyond the notes (10-Q p. 50). The exposure this quarter closed on was genuine: FIRDAPSE orphan-drug exclusivity had already lapsed in November 2025 (10-Q p. 36), one challenger remained unsettled, and its trial was eight weeks away.
Subsequent events (10-Q p. 34). Two, on consecutive days, and they are the whole story of the exit. First, on 2026-05-06 the Company entered into the Agreement and Plan of Merger with Angelini Pharma S.p.A. and its wholly-owned Delaware merger subsidiary, under which each outstanding share converts into the right to receive $31.50 per share in cash without interest; the agreement restricts the conduct of the business pending closing and provides for a termination fee of approximately one hundred and fifty-five and a half million dollars payable by the Company in specified circumstances. Second, also on 2026-05-06 and announced by press release the following day, the Company and its licensor SERB entered into a settlement agreement with Hetero under which Hetero will not market its generic FIRDAPSE in the United States earlier than January 2035, terminating all pending patent litigation, with the Company agreeing to pay a litigation-avoidance fee of $11.0M — a fee management states will affect general and administrative expenses in the second quarter of 2026, not this one (10-Q pp. 34, 43). Both agreements are to be submitted to the Federal Trade Commission and Department of Justice for review as required by law. Risk factors added in this filing address only the Merger — the consequences of delay or failure to close, the restrictions on the business in the interim, the break fee, and the prospect of stockholder litigation over the transaction (10-Q pp. 50–51).
7.5 What Changed This Quarter
sources - The last generic challenger settled, days after quarter end. Hetero, unsettled at 2026-03-31 with trial set for 2026-05-18 and the stay expiring 2026-05-26, agreed on 2026-05-06 not to market before January 2035 (10-Q pp. 28, 34). All four ANDA filers had then settled. This is the event that converted an open litigation front — on a product whose orphan-drug exclusivity had already lapsed in November 2025 — into a term-certain runway of nearly a decade, and it happened on the same day the merger agreement was signed. - The cost of that certainty is a $11.0M fee that lands in the next quarter, not this one. It is a subsequent-event obligation disclosed in Note 17 and confirmed by management as a Q2 2026 general and administrative charge (10-Q pp. 34, 43). Q1 2026 EBIT of $73.2M is unaffected by it, and the reported margins in 7.1 should not be adjusted for it. [Rating and price target withdrawn — see the note at the top.] FIRDAPSE net sales to 6%, from a previous maximum roughly three times as high (10-Q pp. 45–46). Cost of sales fell to $14.5M from $17.9M on a larger revenue base — the mechanism behind gross profit of $134.9M against $123.5M, and a structural, non-reversing margin gain the acquirer inherited. - Customer concentration deepened sharply. One customer moved from roughly three-quarters to roughly nine-tenths of net product revenue in twelve months (10-Q p. 17), as the concentrated FIRDAPSE/AGAMREE channel grew and directly-distributed FYCOMPA collapsed. The structural vulnerability identified in the separate valuation was worse at the end than at the beginning. - The mix completed its rotation. FIRDAPSE up roughly a fifth, AGAMREE up roughly two-thirds, FYCOMPA down roughly three-fifths (10-Q p. 42). The franchise grew revenue of $149.4M while absorbing the near-total erosion of one of its three products — and the FYCOMPA intangible was still carried without impairment at the final balance-sheet date (10-Q p. 24). - The balance sheet ended stronger than it began. Cash of $755.9M against $709.2M at the year-end and $580.7M a year earlier, no debt of any kind, net cash of -$755.9M, and free cash flow of $59.6M on capital expenditure of $0.0M — all of it acquired along with the operating business. - The company was buying its own stock below the exit price. Just over six hundred thousand shares were retired in January and February 2026 at an average price roughly a quarter below the $31.50 subsequently paid, with no repurchases in March (10-Q pp. 33, 51).
7.6 What the Final Quarter Tells the Record
sources The reading. The operating business was still compounding when it was taken out, and it was compounding in the highest-quality way available to it. Revenue of $149.4M against $141.4M is respectable growth; EBIT of $73.2M against $63.4M on that revenue is a great deal more than respectable, because the incremental margin came from a contractual royalty step-down that does not reverse, not from a price increase, a reserve release or a one-off. [Rating and price target withdrawn — see the note at the top.] Nothing in the last set of accounts weakens the appraisal in the separate valuation; the final quarter is the strongest of the three columns in 7.1 on every margin measure.
The sequencing. The two decisive facts sit outside the quarter but days beyond its edge, and reading them together is the point of this section. At 2026-03-31 Catalyst was a company whose flagship product had lost orphan-drug exclusivity four months earlier and whose last generic challenger was eight weeks from trial. On 2026-05-06 that challenger settled to January 2035 for $11.0M, and on the same day the company agreed to be sold for $31.50 per share in cash. The de-risking did not follow the sale or precede it by a comfortable margin; it was simultaneous with it. An acquirer paid a control premium for a term-certain annuity at the precise moment the term became certain, and the operating quarter reported three weeks later shows exactly what that annuity was producing — high-nineties gross margins on a growing FIRDAPSE base, an AGAMREE franchise scaling fast, and a legacy product in orderly decline.
The qualifications, unchanged. The final filing does not retire either structural criticism in the record; on one of them it makes the case worse. Revenue remained the output of judgmental gross-to-net estimation, with the reserve accrual building faster than sales in the quarter (10-Q p. 25). Channel dependence deepened to roughly nine-tenths of net product revenue on a single distributor (10-Q p. 17). The FYCOMPA intangible stood unimpaired at the last balance-sheet date against revenue down roughly three-fifths and marketing discontinued (10-Q pp. 24, 39). And the pipeline the acquirer inherited was, as ever, a business-development function rather than a discovery engine — research and development remained a low-single-digit share of operating costs, and the filing states that no definitive agreement for any additional product had been reached (10-Q pp. 42, 39). The honest close is the one the separate valuation reaches: a genuinely well-run, cash-generative, patent-dependent single-channel franchise, sold at the moment its principal risk was retired, by a management team that had just been buying its own stock a quarter below the price it accepted. Both halves of that sentence belong on the record.
Report Versions
Every published version of this report, newest first — each one kept so a reader can see what changed and when.
| Version date | Files |
|---|---|
| 2026-08-19 Current | Model (Excel) |
| 2026-08-11 | Model (Excel) |