
American Water Works
Section 1 — Business Overview, Operations & Competitive Positioning
sources
1.1 The Business
sources [Rating and price target withdrawn — see the note at the top.]
American Water Works Company, Inc. is the largest and most geographically diverse publicly traded water and wastewater utility in the United States, measured by both operating revenue and population served. [Rating and price target withdrawn — see the note at the top.] The company is a Delaware holding company; its shares trade on the New York Stock Exchange under the ticker AWK, and it operates with a substantial, largely unionized workforce supported by a centralized shared-services subsidiary.
The single most consequential forward event for the equity is a pending, transformational combination. On the announcement of an all-stock agreement to acquire Essential Utilities — a fixed-exchange-ratio, stock-for-stock deal under which Essential would become a wholly owned subsidiary — American Water agreed to materially enlarge its scale, share count and regulatory footprint, and to add a natural gas distribution business that lies outside its historical water-and-wastewater franchise. The transaction has not closed: it remains conditioned on approvals from multiple state utility commissions and on federal antitrust clearance, with management expecting completion by the end of the first quarter of 2027. This report values American Water on a standalone basis; the merger is treated throughout as strategic context and as a risk/catalyst, not as an event reflected in the reported figures.
Key Information
| Item | Value |
|---|---|
| Ticker | AWK |
| Sector / Industry | Utilities / Water Utilities |
| Report Date | 2026-08-10 |
| Most Recent FY Revenue | $5,140.0M |
| EBIT Margin (Most Recent FY) | 36.6% |
| Diluted Weighted-Average Shares | 195M |
| Current Price | $135.45 |
Source: Company SEC filings (10-K); see Appendix A.1.
1.2 Operating Segments
sources American Water reports a single reportable segment — the Regulated Businesses — a point that is easy to under-appreciate but central to reading the company correctly: there is no multi-segment operating-margin mosaic to decompose here, and the company’s disclosed measure of segment profit is net income, not operating income. The Regulated Businesses own the utilities that supply water and wastewater service to residential, commercial, industrial, public-authority, fire-service and sale-for-resale customers under PUC regulation. Residential customers are the largest class. The customer base is weighted heavily toward water with a much smaller wastewater component — which management frames not as a weakness but as a runway, since it can consolidate wastewater systems in territories where it already serves water. [Rating and price target withdrawn — see the note at the top.]
The non-regulated remainder sits in “Other,” principally the Military Services Group (MSG), which operates the water and wastewater systems on numerous U.S. military installations under long-term, multi-decade contracts awarded through the federal Utilities Privatization Program. MSG’s economics differ fundamentally from the regulated core: its scope is operation-and-maintenance plus an asset-replacement capital program, historically funded from the contract fee rather than the company’s own balance sheet (recent solicitations have begun requiring the winning bidder to finance initial capital, which the company is meeting from internal liquidity for the handful of contracts affected); prices reset through periodic redetermination or annual economic price adjustment; and it carries a substantial revenue backlog with a long average remaining contract term. [Rating and price target withdrawn — see the note at the top.] §
As a system, the pieces fit together around the regulated engine. [Rating and price target withdrawn — see the note at the top.] Financing is likewise centralized: because the parent is a holding company with no substantive operations, external debt is raised through a finance subsidiary (AWCC) that on-lends to the utilities and the parent under a support agreement functioning as a guarantee. The fragility in this design is concentration of dependency — the entire structure rests on constructive PUC treatment and on the parent’s ability to draw upstream dividends from regulated subsidiaries that are separate legal entities.
1.3 Geographic Exposure
sources Revenue and customers are concentrated in a limited number of states. Management identifies its “Top Five States” by operating revenue as Pennsylvania, New Jersey, Missouri, Illinois and California, which together account for the substantial majority of regulated revenue and customers; the balance is spread across additional states including Georgia, Hawaii, Indiana, Iowa, Kentucky, Maryland, Tennessee, Virginia and West Virginia. [Rating and price target withdrawn — see the note at the top.] The physical asset base is more concentrated still: nearly half of owned properties are located in New Jersey and Pennsylvania, and the corporate headquarters sits in Camden, New Jersey. §
Water supply is drawn from surface water (the largest source in aggregate), groundwater and purchased water, with treatment intensity varying by source; the company generally owns the infrastructure but not the water itself, which is held in public trust and allocated through permits and rights. Management argues that geographic diversity mitigates localized weather and supply shocks. The one geography-specific operational reality that matters most is California, where a multi-year drought history and cease-and-desist limits on Carmel River diversions at the Monterey system have forced reliance on an alternative-supply project — a concentration of regulatory-recovery and condemnation risk that is analyzed in Section 2 rather than here. §
1.4 Management Team
sources Leadership assessment turns less on individual pedigree than on continuity at a moment of unusual strategic complexity. The company installed a new chief executive during the year through internal promotion — the incoming CEO had previously served as chief financial officer and then president — which favors institutional and financial continuity precisely as the company undertakes the largest transaction in its history and a step-up in its capital program. That is the central tension in the bench: an internally developed, finance-literate leadership team is well matched to a business whose value creation is fundamentally a financing-and-regulatory exercise, but the same team must now execute a multi-state regulatory-approval campaign and integrate an out-of-franchise natural gas business it has never operated.
Board oversight is distributed across four standing committees — Safety/Environmental/Technology/Operations, Audit/Finance/Risk, Executive Development and Compensation, and Nominating/Corporate Governance — a structure that maps deliberately onto the company’s principal risk axes (operational and cybersecurity, financial and regulatory-accounting, and succession). The operating organization is reinforced by the shared-services subsidiary, which concentrates scarce technical expertise (engineering, licensed operators, cybersecurity) that individual small utilities could not economically retain. The workforce is substantial and heavily unionized under numerous collective bargaining agreements, several of which come up for renegotiation in the near term; management describes modest turnover and formal succession programs, and disclosed a work-related employee fatality that the board reviewed and determined non-preventable. The succession the market should watch is not the CEO seat, which was filled smoothly, but the durability of the finance and regulatory leadership through the merger-integration period.
1.5 Capital Allocation Track Record
| Year | Dividends Paid ($M) | Share Repurchases ($M) | CapEx ($M) |
|---|---|---|---|
| FY2021 | $428.0M | — | $1,764.0M |
| FY2022 | $467.0M | — | $2,297.0M |
| FY2023 | $532.0M | — | $2,575.0M |
| FY2024 | $585.0M | — | $2,856.0M |
| FY2025 | $633.0M | — | $3,126.0M |
Source: Company SEC filings (10-K); see Appendix A.1.
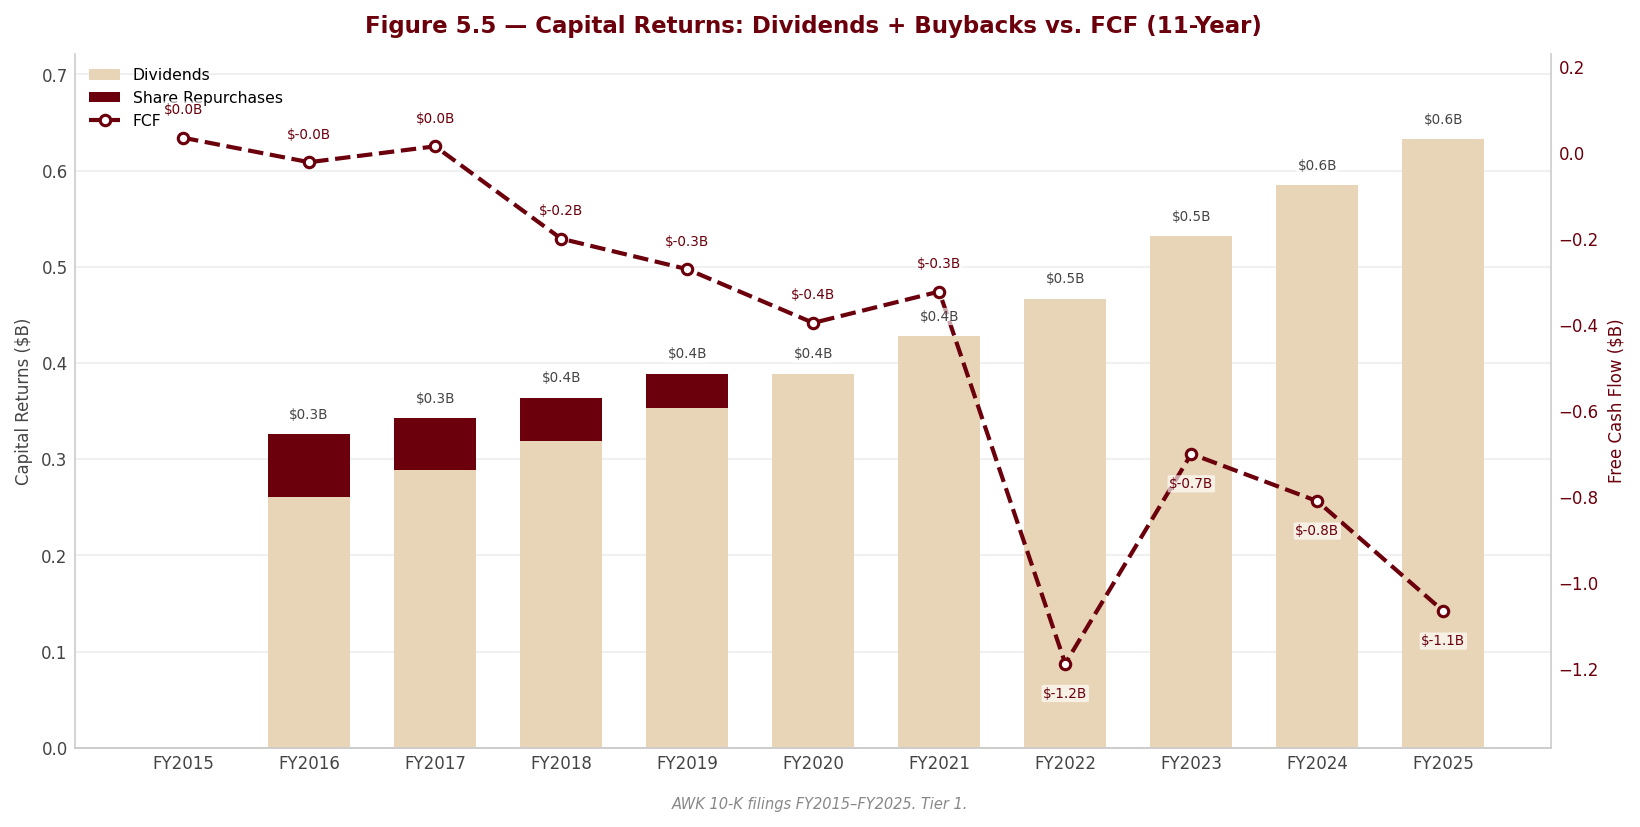
The defining feature of American Water’s capital allocation is that capital expenditure dwarfs both operating cash flow and shareholder distributions, every single year — and for this business that is the point, not a warning sign. [Rating and price target withdrawn — see the note at the top.] The company funds the structural gap between capex and internally generated cash with a disciplined mix of long-term debt and equity, and during the year it added a forward equity sale as a delayed-issuance funding tool for the program — the mechanism through which growth is financed rather than a distress signal.
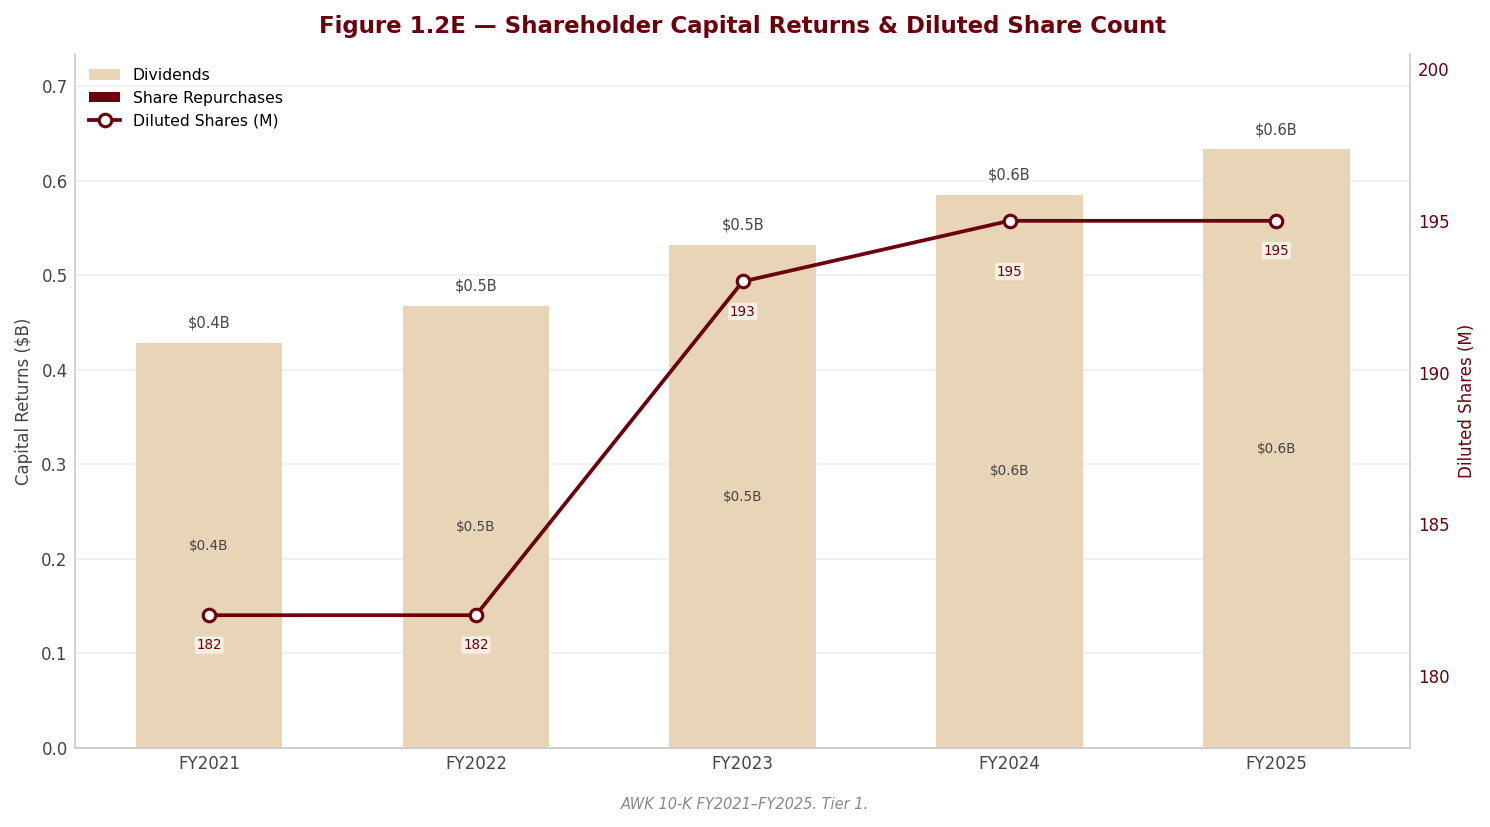
Distributions are managed conservatively and secondarily to reinvestment. Management runs a stated dividend-growth strategy — quarterly dividends it intends to keep raising, funded by upstream distributions from the regulated subsidiaries — and pairs it with a share-repurchase program that is explicitly anti-dilutive rather than return-of-capital in character: it exists to offset dilution from dividend-reinvestment, employee-purchase and compensation plans, and the company made no repurchases during the year. The signal from the mix is unambiguous: capital is being deployed into the asset base, not returned; the dividend is a steady, growing claim funded out of regulated earnings; and buybacks are a housekeeping tool, not a lever. [Rating and price target withdrawn — see the note at the top.]
1.6 Competitive Positioning & Moat
sources §1.6.1 Industry structure. Returns in regulated water are manufactured, not competed for. [Rating and price target withdrawn — see the note at the top.] The industry sits on top of a highly fragmented, largely municipal ownership base — thousands of mostly small systems — that is aging, capital-starved and facing tightening water-quality and cybersecurity standards, which management argues will push more municipalities to sell. Scaled investor-owned operators that can finance capital cheaply, absorb compliance costs and integrate acquired systems are the structural winners.
§1.6.2 Competitive advantages. The moat is genuine and multi-layered, and each layer is grounded in a specific disclosure rather than asserted. First, a regulatory monopoly: the Regulated Businesses face no direct competition in their existing markets because they operate under franchises, certificates of public convenience and necessity or similar authorizations, and because the cost of building a duplicate network is a prohibitive barrier to entry. Second, scale — as the largest U.S. water utility, American Water can spread engineering, treatment, cybersecurity and financing capabilities across the widest base, which lowers its cost of pursuing and integrating acquisitions relative to smaller peers. [Rating and price target withdrawn — see the note at the top.] Fourth, a four-decade research-and-development program focused on contaminants of emerging concern such as PFAS, which management says gives it early insight into forthcoming regulation — a real advantage when compliance capital is itself the growth driver. Fifth, in the adjacency, MSG’s long-term multi-decade federal contracts carry a substantial backlog and high switching costs for the counterparty. Its principal competitors surface only when it pursues acquisitions — other regulated utilities such as Essential, American States Water and California Water Service, plus occasional infrastructure funds — and MSG competes primarily with American States Water.
§1.6.3 Competitive vulnerabilities. The same features that make the moat wide also define where it can erode. [Rating and price target withdrawn — see the note at the top.] Contingent exposure is concentrated in California (the Monterey supply-recovery and condemnation cluster), and the pending Essential combination introduces integration and out-of-franchise (natural gas) execution risk — both detailed in Section 2. [Rating and price target withdrawn — see the note at the top.]
[Rating and price target withdrawn — see the note at the top.]
Section 2 — Key Risks & Catalysts
sources
2.1 Downside Risks
sources American Water’s risk profile is unusual for a company of its quality: the dominant risks are neither accounting nor competitive but regulatory-judgment risks — the recovery of invested capital rests on the discretion of fourteen separate state commissions — layered on top of two large, self-inflicted corporate overhangs (a transformational merger and a heavy, equity-funded capital program). It is worth stating plainly what is not the concern here. The forensic review found a conservatively accounted business: PricewaterhouseCoopers has issued an unqualified opinion on both the financial statements and internal controls and has served as auditor since the mid-twentieth century; there is a single critical audit matter, no restatement, no going-concern language, one reportable segment unchanged year over year, and no controlling-shareholder or value-extraction vector. The independent earnings-quality screens are clean, and reported earnings are backed by cash. The risk in this name is concentrated regulatory judgment — chiefly in California — together with merger and funding overhang, not aggressive revenue recognition or balance-sheet engineering. That distinction should shape how a portfolio manager weights the risks below.
Risk 1 — Regulatory cost-recovery and disallowance, concentrated in California (Monterey)
sources [Rating and price target withdrawn — see the note at the top.] That abstract risk is presently concrete at the California subsidiary’s Monterey Peninsula Water Supply Project. This is a RED forensic flag and the single most important item in the filing. Management discloses that the California subsidiary has incurred aggregate costs on the project that far exceed the construction-cost amount the state commission has actually approved for recovery, and it states explicitly that it cannot assure recovery of the excess. A large portion of the incurred figure is non-cash allowance for funds used during construction, so reported project “cost” overstates cash outlay — but the recovery risk attaches to the full deferred balance, and if the commission ultimately disallows the excess it becomes a direct charge to earnings that is not reflected in current book value. This is precisely the “unrecoverable regulatory asset equals hidden impairment” scenario, and it is escalating rather than static: the incurred-versus-approved gap has widened since the prior year, and in mid-2026 local agencies filed a new complaint at the state commission seeking to halt the phased desalination project and alleging the subsidiary violated a prior final decision.
The same California operation carries a paired exposure: local authorities are pursuing condemnation of the Monterey system through eminent domain, at a disputed valuation, with an evidentiary hearing scheduled on whether a further approval is required before the action can proceed. [Rating and price target withdrawn — see the note at the top.] Together these two matters concentrate a meaningful share of the company’s contingent exposure in a single subsidiary. [Rating and price target withdrawn — see the note at the top.]
[Rating and price target withdrawn — see the note at the top.] The exposure is bounded by the disclosed deferred balance and disputed asset valuation but is not quantifiable in advance of the commission’s and courts’ decisions.
Risk 2 — The Essential Utilities merger: completion, and integration/dilution risk if it completes
sources The pending all-stock acquisition of Essential Utilities is the most consequential event in the filing for the equity thesis, and it cuts in both directions. This is a RED forensic flag. The deal is structured at a fixed share-exchange ratio that does not adjust for movements in either company’s stock price, so American Water bears the value risk between signing and closing and cannot walk away solely because that value shifts. Closing is expected by the end of the first quarter of 2027 but is not assured: it is conditioned on approvals from multiple state utility commissions — each held to a standard that the terms not produce a “burdensome effect” — and on federal antitrust clearance, any of which could delay, deny or attach costly conditions such as required divestitures. The failure/delay leg is real: if the merger is not completed, the company faces sunk transaction costs, a termination fee, management distraction and business restrictions while it is pending, and likely share-price pressure.
The completion leg carries its own risks. Existing holders would see reduced ownership and voting interests; the combination adds a natural gas distribution business that lies entirely outside American Water’s historical water-and-wastewater franchise and jurisdictions where it does not currently operate; management itself cautions the merger may not be accretive to earnings and could require it to record goodwill and later impairments; and it materially changes the company’s size, capital plan, share count and regulatory footprint. This report values American Water on a standalone basis — all historical and per-share figures should be read as pre-merger — precisely because the transaction’s terms, timing and pro-forma economics are not yet fixed.
Probability: High (the merger is a defining variable, though its outcome is uncertain) | Timeframe: Immediate to 1–2 years | Impact: Binary and large. Failure destroys sunk costs and a termination fee and removes the strategic rationale; completion re-bases the entire equity — share count, leverage, business mix and regulatory footprint all change, with integration of an unfamiliar gas business the key execution risk.
Risk 3 — Capital-funding dependence and a rising cost of capital
sources [Rating and price target withdrawn — see the note at the top.] In a regulated utility this is the growth engine, not a distress signal; but it makes the equity structurally sensitive to two forces that the model does not control. [Rating and price target withdrawn — see the note at the top.] Covenant headroom remains comfortable and a large revolver plus incoming forward-sale and note-repayment cash provide a cushion, so this is a margin-of-safety erosion rather than a solvency risk — but the incremental cost of capital is moving the wrong way.
Second, sustained equity issuance dilutes per-share growth. This is a YELLOW forensic flag: a stacked dilution overhang. The company layered a large forward equity sale on top of exchangeable notes and, prospectively, the all-stock merger consideration — multiple simultaneous share-issuance channels. The forward and notes were not dilutive to reported diluted earnings per share in the latest year because the average share price sat below the relevant forward and exchange prices; that non-dilutive status flips if the share price rises above those thresholds, and the forward’s remaining shares are due to be settled by year-end. The honest framing is that per-share metrics are hostage to how the capex program is financed: equity-heavy funding, a higher share price triggering the forward/note dilution, or the merger issuance could each dilute the compounding the thesis relies on.
Probability: Medium-High (the funding need is certain; adverse pricing is the variable) | Timeframe: Immediate and ongoing | Impact: Higher incremental debt cost compresses the spread between allowed return and financing cost; equity issuance dilutes per-share earnings and return on equity. Both erode returns at the margin rather than threatening the balance sheet.
Risk 4 — Environmental and water-quality liability
sources As a supplier of drinking water, American Water sits under an expanding and tightening body of environmental and water-quality regulation — the Safe Drinking Water Act, the Lead and Copper Rule, the Clean Water Act and, increasingly, PFAS rules — where non-compliance can bring fines, remediation obligations, reputational damage and, in the most serious cases, litigation and forced asset disposal. The forward-looking magnitude here is the EPA’s PFAS drinking-water standard, which the company estimates will require a very large multi-year capital program plus meaningful incremental annual operating expense to meet, on top of continued lead-and-copper service-line replacement. It is important to characterize PFAS correctly: on the litigation side American Water is a plaintiff and net recipient, not a defendant — its subsidiaries have received escrowed settlement proceeds from manufacturers that are booked as a regulatory liability to be passed back to customers, not as income, and personal-injury complaints that had named certain subsidiaries were dismissed without prejudice. [Rating and price target withdrawn — see the note at the top.]
On the operational-litigation side the picture is contained. The cluster of incident-driven customer class actions — the Dunbar main failure (settled, largely insured) and the Mountaineer Gas main-break matters (moved to a proposed settlement substantially covered by insurance, with the regulator finding no systemic failure) — are individually immaterial and largely insurance-funded. One water-quality matter warrants explicit note as a watch item: a manganese-related putative class action against the Pennsylvania subsidiary (following a “Do Not Drink” notice) appears in the latest quarterly filing but not in the annual report, exactly the “visible only in the later 10-Q” pattern. It should not be overstated — class certification was denied in mid-2026 and summary judgment was decided, so the matter is presently contained — but it is a reputational and regulatory item in a large jurisdiction and should be tracked. No securities class action was found in the later quarterly filing.
[Rating and price target withdrawn — see the note at the top.] The residual risk is recovery timing and CERCLA liability, not a quantifiable earnings hit today.
Risk 5 — Physical, climate and operational-resilience risk
sources [Rating and price target withdrawn — see the note at the top.] The sharpest supply-availability constraint is again California, where cease-and-desist orders require the Monterey subsidiary to significantly reduce Carmel River diversions until it secures a certified permanent replacement supply — the very supply the contested Water Supply Project is meant to provide, which ties this operational constraint directly to the recovery risk in Risk 1. [Rating and price target withdrawn — see the note at the top.] Operational resilience also spans cybersecurity: as a critical-infrastructure operator the company faces heightened physical and cyber-attack risk, and it discloses a prior cybersecurity incident that it states has not, to date, been material — a reminder that its protections may not prevent a future, potentially disruptive, event.
[Rating and price target withdrawn — see the note at the top.]
2.2 Upside Catalysts
sources [Rating and price target withdrawn — see the note at the top.] There is no manufacturing of catalysts for false balance here — the honest read is roughly five substantive risks against a smaller set of catalysts, most of which are the ordinary machinery of a well-run utility working as designed.
Catalyst 1 — Constructive rate-case and surcharge outcomes compounding rate base
sources [Rating and price target withdrawn — see the note at the top.] Every constructive outcome — an allowed return and equity-weighted capital structure at or near what management proposes, promptly — converts the capital program into earnings growth. This is the mechanism by which a regulated utility compounds, and its steady operation is the single most reliable source of upside.
Probability: High | Timeframe: Ongoing | Monitoring trigger: Authorized return on equity and permitted equity layer in decided cases; the speed of decisions (regulatory lag); adoption or extension of decoupling, future-test-year and surcharge mechanisms in new jurisdictions.
Catalyst 2 — Essential Utilities merger completion on accretive terms
sources The same transaction that heads the risk list is also the largest potential catalyst. [Rating and price target withdrawn — see the note at the top.] The asymmetry is that the market cannot yet price this with confidence, because completion, terms and accretion all remain uncertain; it is a genuine catalyst only in the event, and a substantial risk in the interim.
Probability: Medium (completion is plausible but conditioned) | Timeframe: ~1 year to close, benefits thereafter | Monitoring trigger: State commission approvals under the “burdensome effect” standard; federal antitrust clearance; any revision to the expected close timing; the value gap created by the fixed exchange ratio.
Catalyst 3 — Accretive municipal-system acquisitions under fair-market-value legislation
The U.S. water industry is highly fragmented and dominated by small, aging, capital-starved municipal systems, and tightening water-quality and cybersecurity standards are expected to push more of them to sell. [Rating and price target withdrawn — see the note at the top.] §
[Rating and price target withdrawn — see the note at the top.]
Catalyst 4 — PFAS/lead compliance capital as rate-base growth, plus settlement recoveries
[Rating and price target withdrawn — see the note at the top.]
[Rating and price target withdrawn — see the note at the top.]
2.3 Risk & Catalyst Summary
| # | Item | Type | Probability | Timeframe | Status | Monitoring Trigger |
|---|---|---|---|---|---|---|
| 1 | Regulatory cost-recovery / disallowance — Monterey Water Supply Project & condemnation (California) | Risk | Medium | 1–2 years | Active | Commission cost-recovery proceedings; new complaint to halt project; condemnation hearing outcome |
| 2 | Essential Utilities merger — completion, integration & dilution | Risk | High (outcome uncertain) | Immediate–2 years | Active | State PUC approvals; antitrust clearance; revised close timing; fixed-ratio value gap |
| 3 | Capital-funding dependence & rising cost of capital / dilution stack | Risk | Medium-High | Immediate/ongoing | Active | New debt coupons vs. portfolio; liquidity & commercial-paper reliance; forward-share settlement; price vs. forward/exchange thresholds |
| 4 | Environmental & water-quality liability — PFAS/lead compliance capex; water-quality litigation | Risk | High (compliance); Low (litigation) | 3–5 years | Monitoring | PFAS/lead recovery mechanisms; CERCLA liability; manganese class-action appeals |
| 5 | Physical, climate & operational-resilience risk (drought, Carmel River, cyber) | Risk | Medium | Ongoing | Latent | Drought/conservation trends; California supply status; cyber-incident disclosures |
| 6 | [Rating and price target withdrawn — see the note at the top.] | Catalyst | High | Ongoing | Active | Authorized ROE & equity layer; decision speed; mechanism adoption |
| 7 | Essential merger completion on accretive terms | Catalyst | Medium | ~1 year to close | Monitoring | PUC approvals; antitrust clearance; accretion confirmation |
| 8 | [Rating and price target withdrawn — see the note at the top.] | Catalyst | Medium-High | Ongoing–5 years | Active | [Rating and price target withdrawn — see the note at the top.] |
Source: Company SEC filings (10-K) and forensic footnote review; see Appendix A.1.
2.4 Risk Interdependencies
sources The risks in this name are not independent — they cluster and compound in two places, and a portfolio manager should treat each cluster as a single correlated exposure rather than a set of separate bets. The first and most dangerous is California/Monterey, where the regulatory-recovery risk (the Water Supply Project excess over approved cost), the physical supply constraint (cease-and-desist limits on Carmel River diversions that make the same disputed project operationally necessary), and the condemnation/eminent-domain action against the Monterey system all attach to one subsidiary. [Rating and price target withdrawn — see the note at the top.] If the commission disallows the excess and the condemnation succeeds, the subsidiary would take an earnings charge on unrecovered cost while simultaneously losing the asset base — a disproportionately damaging combination concentrated in one operation, and precisely the judgment that the auditor’s single critical audit matter is built around.
[Rating and price target withdrawn — see the note at the top.] The capital program requires continuous market access; the all-stock merger, the forward equity sale and the exchangeable notes are three overlapping share-issuance channels; and a rising cost of debt narrows the spread between allowed return and financing cost. These compound in a specific adverse scenario: a higher share price that would ordinarily be welcome actually turns on the forward and note dilution, while a delayed or renegotiated merger extends the overhang and the associated cost drag. [Rating and price target withdrawn — see the note at the top.]
2.5 ESG & Regulatory Exposure
sources American Water’s ESG profile is, unusually, close to the core of its investment case rather than a peripheral overlay, because water quality, affordability and environmental compliance are its regulated product. On the environmental axis, the dominant exposures are the EPA’s PFAS drinking-water standard and the Lead and Copper Rule — both requiring large, multi-year capital programs — together with Clean Water Act discharge permitting and an emerging focus on PFAS in wastewater and biosolids. The company positions itself constructively (a four-decade research program on contaminants of emerging concern, plaintiff status in PFAS manufacturer litigation, and advocacy for CERCLA passive-receiver protection), but the unresolved CERCLA passive-receiver question remains a genuine regulatory tail risk. [Rating and price target withdrawn — see the note at the top.] Physical safety is a real operational-ESG item — the company disclosed a work-related employee fatality that the board reviewed and determined non-preventable — as is its heavily unionized workforce, several of whose collective bargaining agreements come up for renegotiation in the near term.
On governance, the forensic review is reassuring and should be weighted accordingly. There is no controlling shareholder and no value-extraction vector: the parent is a widely held holding company, and the only related-party activity in the statements is ordinary intercompany financing and shared-services allocation, all eliminated in consolidation. The audit is clean — an unqualified opinion from a long-tenured auditor, effective internal controls, no restatement — and board oversight is distributed across four standing committees mapped onto the company’s principal risk axes. [Rating and price target withdrawn — see the note at the top.]
Section 3 — Financial Analysis & Historical Performance
sources Three-Statement Linkage Confirmation: - Net Income ties (Income Statement → Cash Flow Statement): Confirmed. Reported net income is the opening line of the operating-cash-flow reconciliation in every year presented; there is no discontinued-operations break in the period, as the Homeowner Services Group divestiture (FY2021) was recorded within continuing operations. - Cash ties (Balance Sheet → Cash Flow Statement): Confirmed. The ending cash and cash equivalents reconciled on the statement of cash flows agree with the balance-sheet cash position each year ($98.0M at the most recent year-end). - Retained Earnings reconciliation (Beg RE + NI - Dividends = End RE): Confirmed within rounding. Beginning retained earnings plus net income less common dividends reconciles to ending retained earnings; share-based compensation, forward-sale equity and other capital-account movements route through additional paid-in capital rather than retained earnings, so they do not disturb the tie.
3.1A Income Statement
[Rating and price target withdrawn — see the note at the top.] Its income statement runs operating revenues → total operating expenses, net → operating income. There is no cost of goods sold, no gross profit and no gross margin — “operation and maintenance” is an operating expense, not a cost of sales — so those lines are omitted as not applicable rather than populated.*
Source: Company SEC filings (10-K); figures per the FL model — see Appendix A.1–A.2.
CAGR Summary
| Metric | 3Y CAGR | 5Y CAGR | 10Y CAGR |
|---|---|---|---|
| Revenue | 10.7% | 6.4% | 5.0% |
| EBITDA | 13.0% | 8.4% | - |
| Net Income | 10.7% | 9.4% | 8.8% |
| Diluted EPS | 8.1% | 7.8% | 8.0% |
| FCF | - | - | - |
Source: Company SEC filings (10-K); figures per the FL model — see Appendix A.1–A.2.
3.1B Income Statement — Analysis
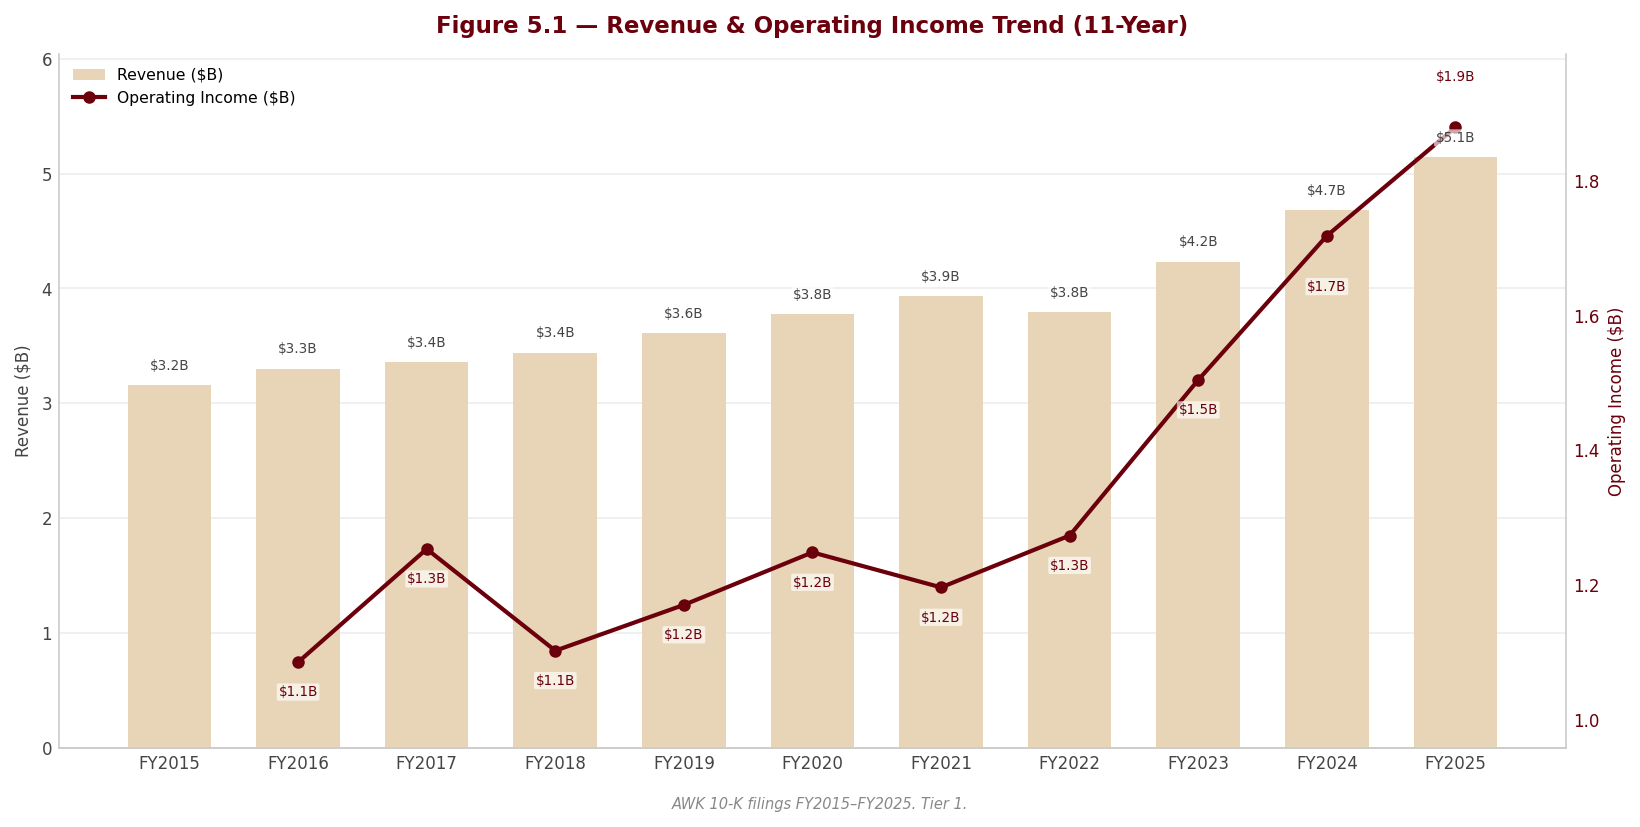
sources [Rating and price target withdrawn — see the note at the top.] That distinction is the single most important lens for reading the revenue trajectory. [Rating and price target withdrawn — see the note at the top.] The one interruption — the -3.5% decline in FY2022 — is easily misread as the utility shrinking. It was not. It reflects the removal of the lower-margin, non-regulated Homeowner Services Group, which had been sold in FY2021; the regulated core continued to grow underneath. Because the FY2022 comparison base (FY2021) still contained a full year of that divested revenue, the reported contraction is a composition effect, and the underlying regulated engine never went into reverse.
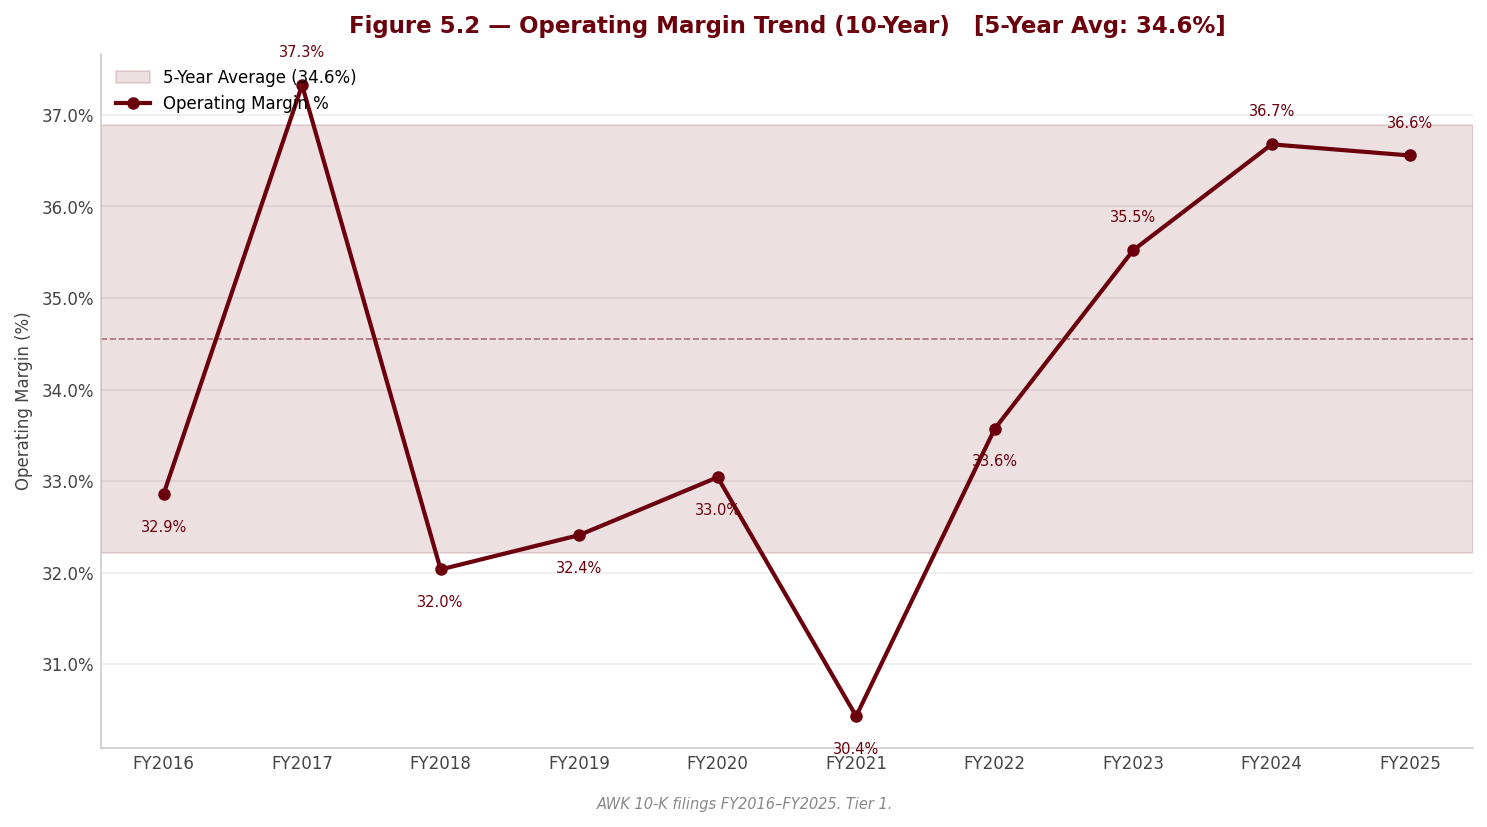
Margin trajectory — structural, not cyclical. Operating margins expanded materially and durably over the window: EBIT (operating) margin widened from 30.4% to 36.6%, and EBITDA margin from 46.6% to 53.9%. Two forces drove this, and both are structural. First, mix: the FY2021 divestiture of the lower-margin Homeowner Services business lifted the blended margin from FY2022 onward, which is why the sharpest single-year step is between FY2021 and FY2022. [Rating and price target withdrawn — see the note at the top.] The margin is therefore high-quality but capped — the ceiling is the regulator’s allowed return, a point.
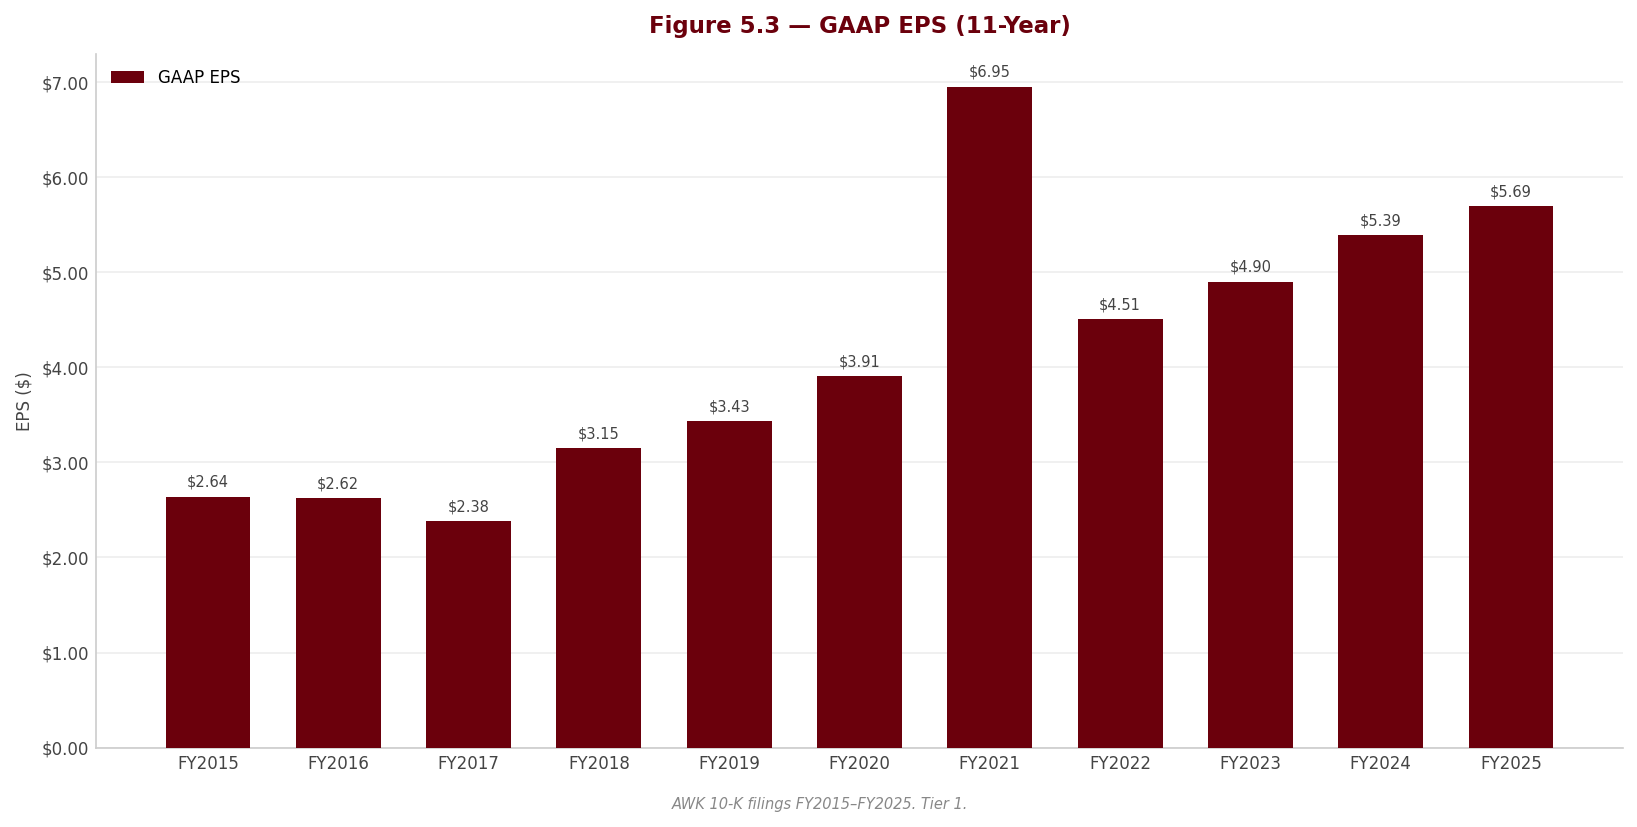
[Rating and price target withdrawn — see the note at the top.] (2) The Homeowner Services divestiture gain (FY2021) is the most important non-recurring distortion in the whole income statement and must be handled with care: it produced a large pre-tax gain recorded within continuing operations with no prior-year restatement, inflating FY2021 net income (up 78.1%) and GAAP EPS (up 77.7%), then mechanically reversing in FY2022 (net income -35.1%, EPS -35.1%) once the gain fell out of the base and the business was gone. [Rating and price target withdrawn — see the note at the top.] (4) Interest expense climbed steeply, from $403.0M to $615.0M, as debt and coupons both rose — the single fastest-growing cost line and a direct consequence of the equity-and-debt-funded capital program (developed in 3.2B and 3.3B). [Rating and price target withdrawn — see the note at the top.]
Quality of earnings. This is the analytically richest part of the AWK story, and it is nuanced rather than alarming. Management publishes an adjusted (“core”) diluted EPS reconciled from GAAP; core EPS of $5.64 in FY2025 sits below GAAP diluted EPS of $5.69, and the reconciliation is instructive because of what it strips out: favourable weather, the interest income earned on the Homeowner Services seller note, and — new in FY2025 — transaction costs on the pending Essential Utilities merger. Three points deserve a portfolio manager’s attention. [Rating and price target withdrawn — see the note at the top.] Re-investment of the returned principal will not replace the note’s high contractual yield, so FY2026 “Other”/non-operating income should not be read as a like-for-like decline. Third, and favourably, the independent forensic and earnings-quality screens are clean: there is no earnings-manipulation signal, the accrual profile indicates earnings backed by cash rather than accrual build, and the audit opinion has been unqualified for decades with a single critical audit matter (the recovery judgment on regulatory assets, discussed below). A further, smaller quality note: the equity component of the allowance for funds used during construction is a real GAAP credit to income but is non-cash — modest against roughly a billion dollars of net income, but rising with the construction program, and worth recognizing when bridging reported earnings to cash. Finally, one item sits outside the reported numbers entirely and must be disclosed here: the California (Monterey) Water Supply Project — a RED forensic flag — where aggregate costs incurred materially exceed the construction cost the state commission has approved for recovery, and management states it cannot assure recovery of the excess. If the commission ultimately disallows the excess-over-approved balance, it becomes a direct charge to earnings that is not reflected in current book value; it is the live driver of the auditor’s sole critical audit matter and the largest single earnings tail-risk in the filing.
[Rating and price target withdrawn — see the note at the top.] And any commission signal of disallowance on the Monterey excess would move that contingent earnings charge from footnote to reported result.
3.2A Balance Sheet
Note: FY2015 has no balance sheet and FY2016 no balance sheet in the source filings; balance-sheet trend analysis therefore begins at FY2017. The “Inventory” line below is materials and supplies (spare pipe, meters and treatment consumables) — not merchandise — so inventory-turnover, days-inventory and cash-conversion-cycle framing is not meaningful for this business and is not applied.
Source: Company SEC filings (10-K); figures per the FL model — see Appendix A.1–A.2.
3.2B Balance Sheet — Analysis
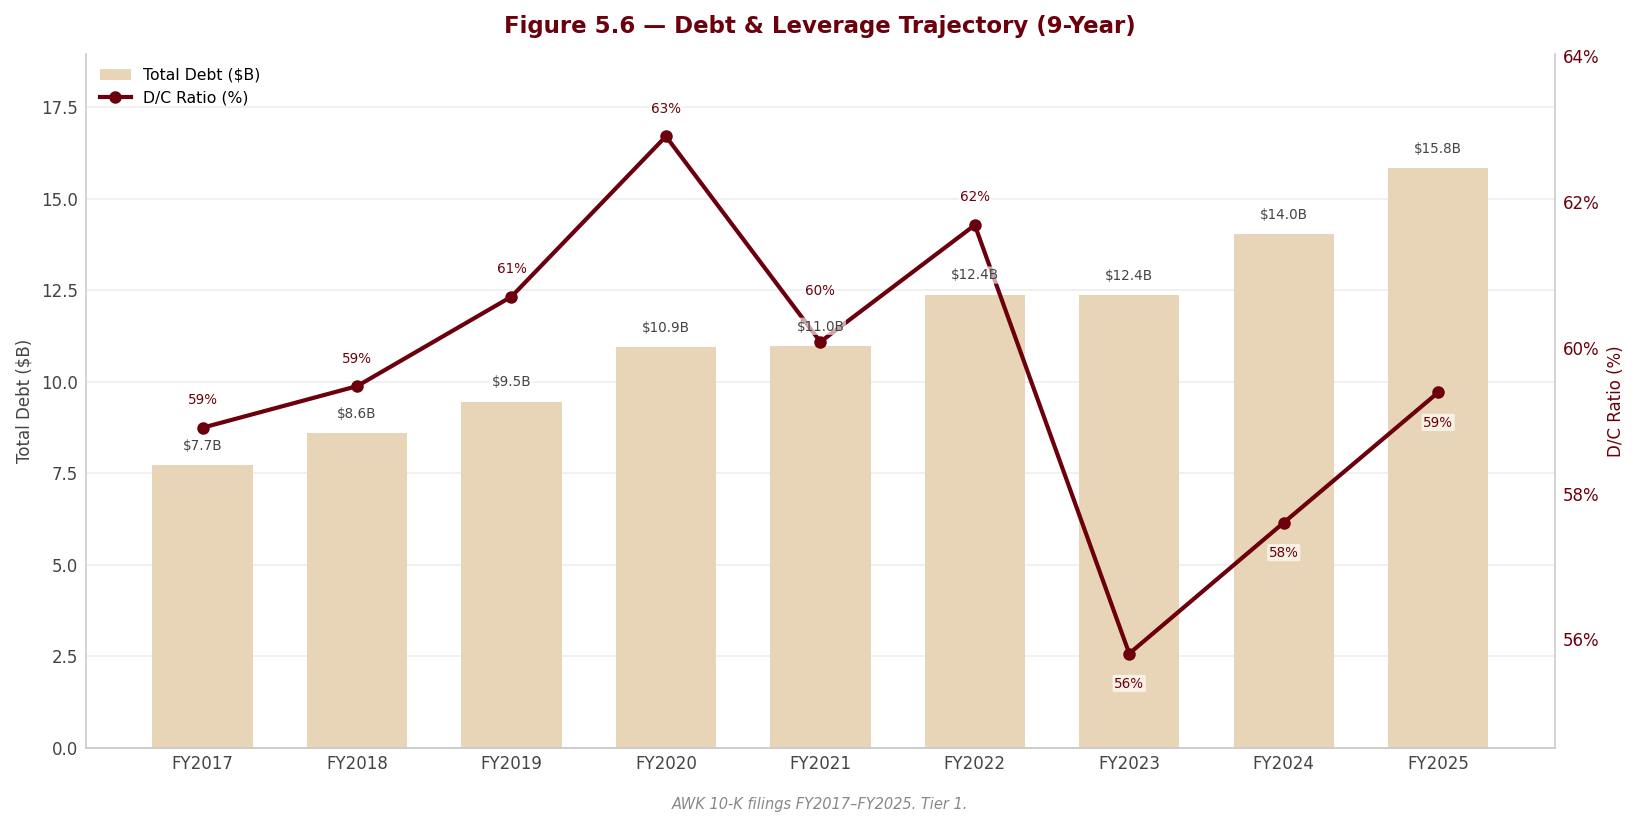
sources Asset composition. This is one of the most capital-intensive balance sheets in the equity market, and deliberately so. [Rating and price target withdrawn — see the note at the top.] Goodwill and intangibles ($1,156.0M) are small and stable, largely a legacy of the 2003 take-private, and are tested annually without impairment. [Rating and price target withdrawn — see the note at the top.] It is a small item today but a marker of a rising acquisition cadence (and, prospectively, the all-stock Essential merger) that should be watched for impairment sensitivity.
Leverage trajectory. Leverage is high and rising, which for this model is expected rather than alarming. Total debt climbed from $10,982.0M to $15,844.0M over the window — and has roughly doubled from $7,717.0M at the start of the balance-sheet history — as debt funded its share of the capital program. Net debt/EBITDA sits at 5.7x and debt/equity at 1.5x, both elevated in absolute terms but ordinary for an investment-grade regulated utility whose asset lives span decades. The trajectory is fully consistent with management’s stated priorities — reinvestment first, a steadily growing dividend, no buybacks — and the disclosed consolidated debt-to-capitalization ratio remains comfortably inside its covenant limit, so there is headroom rather than a covenant concern. The equity side of the funding shows up too: shareholders’ equity jumped from $7,693.0M to $9,797.0M as equity issuance helped fund the program, and a large forward equity sale layered on during FY2025 is a delayed-issuance tool for the same purpose. That said, the funding mix is now leaning harder on short-term debt: the short-term balance rose sharply to $3,067.0M in FY2025 (from $1,516.0M) as commercial paper roughly doubled and total available liquidity fell meaningfully year over year — a YELLOW forensic item. New long-term issuance is also carrying coupons well above the existing portfolio average, so the incremental cost of debt is moving the wrong way against a chunky near-term refinancing wall that includes the exchangeable notes.
Working capital. The relevant working-capital metric for a utility is receivables collection, not an inventory cycle. [Rating and price target withdrawn — see the note at the top.] The current ratio of 0.5x sits below one — normal here, because heavy commercial-paper use parks a large short-term-debt balance in current liabilities and a regulated utility does not need current-asset liquidity to fund operations. The one working-capital signal worth flagging is credit quality: uncollectible-accounts (bad-debt) expense has roughly doubled over two years — a YELLOW forensic item — growing faster than revenue over the same period. [Rating and price target withdrawn — see the note at the top.]
⚠ Items to Watch. If net debt/EBITDA were to push materially above the current 5.7x — or the consolidated debt-to-capitalization ratio to approach its covenant ceiling — it would begin to constrain the equity/debt funding flexibility on which the capital program depends. A continued rise in short-term/commercial-paper reliance from the FY2025 $3,067.0M level, or a further leg up in bad-debt expense, would each warrant a closer look at refinancing risk and affordability, respectively.
3.3A Cash Flow Statement
| FY2021 | FY2022 | FY2023 | FY2024 | FY2025 | |
|---|---|---|---|---|---|
| Cash from Operations ($M) | $1,441.0M | $1,108.0M | $1,874.0M | $2,045.0M | $2,059.0M |
| — Depreciation & Amortization ($M) | $636.0M | $649.0M | $704.0M | $788.0M | $894.0M |
| Capital Expenditures ($M) | $1,764.0M | $2,297.0M | $2,575.0M | $2,856.0M | $3,126.0M |
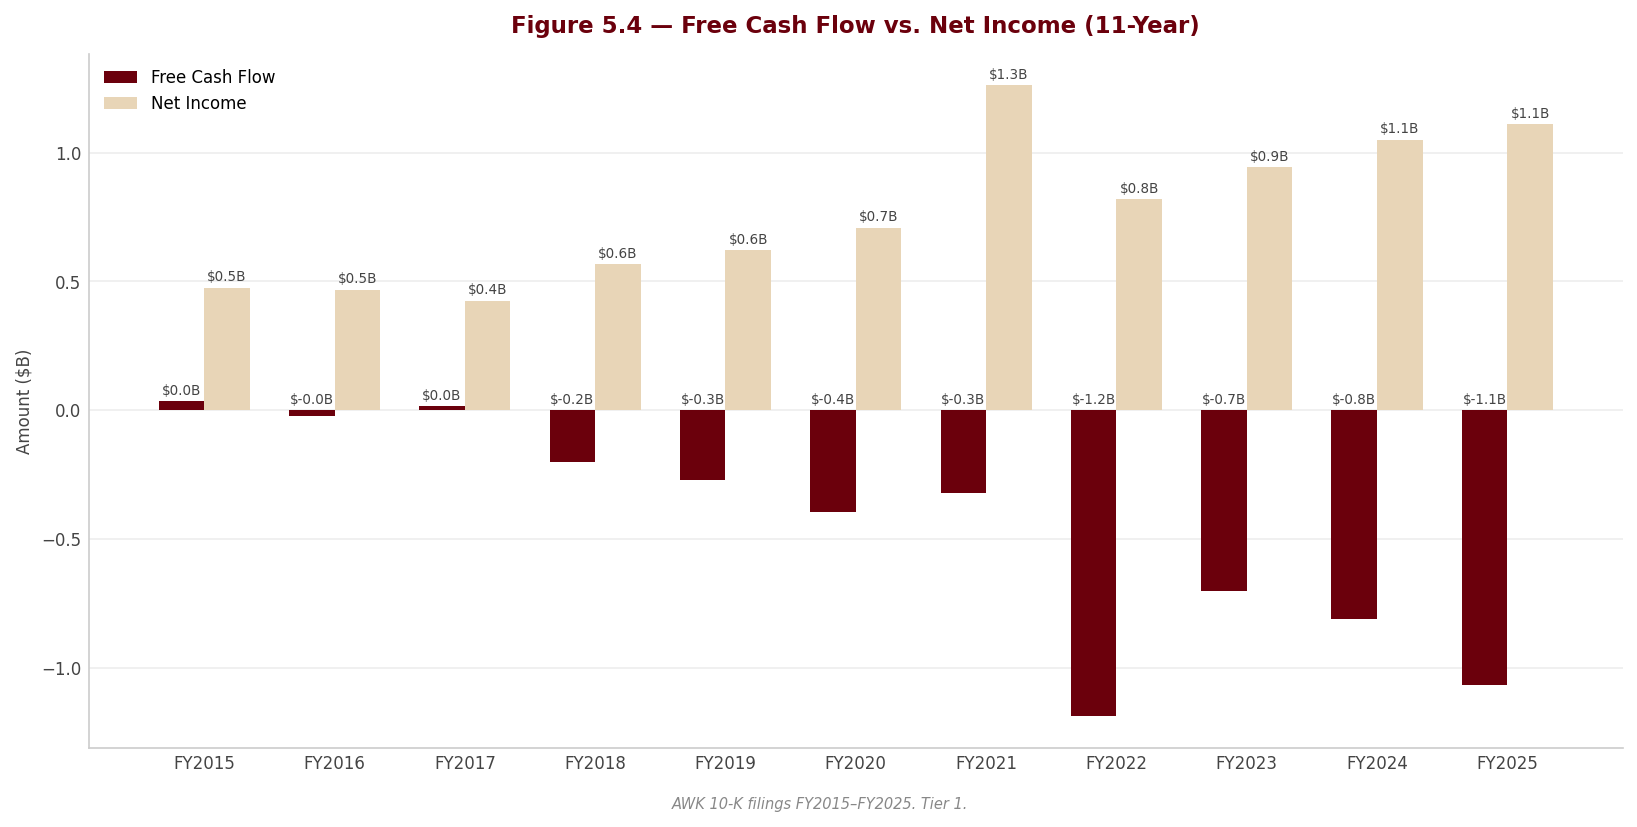
| Free Cash Flow ($M) | -$323.0M | -$1,189.0M | -$701.0M | -$811.0M | -$1,067.0M |
| FCF Margin | -8.2% | -31.4% | -16.6% | -17.3% | -20.8% |
| FCF / Share | -$1.77 | -$6.53 | -$3.63 | -$4.16 | -$5.47 |
| FCF Conversion (FCF/NI) | -25.6% | -145.0% | -74.3% | -77.2% | -96.0% |
| CapEx / Revenue | 44.9% | 60.6% | 60.8% | 61.0% | 60.8% |
| CapEx / D&A | 2.8x | 3.5x | 3.7x | 3.6x | 3.5x |
| Dividends Paid ($M) | $428.0M | $467.0M | $532.0M | $585.0M | $633.0M |
| Share Repurchases ($M) | — | — | — | — | — |
Source: Company SEC filings (10-K); figures per the FL model — see Appendix A.1–A.2.
3.3B Cash Flow — Analysis
sources The central fact: this business is structurally free-cash-flow negative, and that is the model, not a warning sign. Capital expenditure has exceeded operating cash flow in every year since FY2018 — free cash flow was -$323.0M, -$1,189.0M, -$701.0M, -$811.0M and -$1,067.0M across the window, and FCF conversion of -96.0% in FY2025 is deeply negative. In a merchant company that pattern would be a cash-consuming treadmill. [Rating and price target withdrawn — see the note at the top.] This is not an AWK-specific weakness — all four regulated-water peers are also free-cash-flow negative, with capital expenditure exceeding operating cash flow across the group; it is the regulated-water capex cycle, full stop. What must be stated honestly is the consequence: the gap between capex and internally generated cash is funded by debt and equity issuance, total debt has roughly doubled over the period, and that creates genuine dependence on continued access to capital markets on acceptable terms — the funding-and-dilution risk developed in Section 2 and in 3.2B.
CapEx intensity. Operating cash flow itself is healthy and growing — from $1,441.0M to $2,059.0M, with a one-year dip to $1,108.0M in FY2022 on working-capital timing and the HOS transition — but it is simply dwarfed by investment. [Rating and price target withdrawn — see the note at the top.] CapEx/Revenue of 60.8% is extraordinarily high by any non-utility standard and is the clearest single quantification of how capital-hungry — and, if regulators cooperate, how growth-rich — this model is.
Capital-allocation waterfall. The allocation mix is unambiguous and internally consistent. Essentially all internally generated cash, plus a large and growing slug of external debt and equity, is directed into reinvestment; the dividend is the only material return of capital, rising steadily from $428.0M to $633.0M (a per-share dividend CAGR of roughly 8.7% over five years) and funded out of upstream distributions from the regulated subsidiaries. There were no share repurchases in any year of the window — the buyback authorization exists only to offset dilution from compensation and dividend-reinvestment plans, not as a return lever. [Rating and price target withdrawn — see the note at the top.]
[Rating and price target withdrawn — see the note at the top.]
3.4 Returns Analysis
| FY2021 | FY2022 | FY2023 | FY2024 | FY2025 | |
|---|---|---|---|---|---|
| ROIC | 5.3% | 5.4% | 5.7% | 5.8% | 5.8% |
| ROE | 18.4% | 10.9% | 10.8% | 10.4% | 10.5% |
| ROA | 5.0% | 3.0% | 3.3% | 3.3% | 3.3% |
| Interest Coverage | 3.0x | 2.9x | 3.3x | 3.3x | 3.1x |
Source: Company SEC filings (10-K); figures per the FL model — see Appendix A.1–A.2.
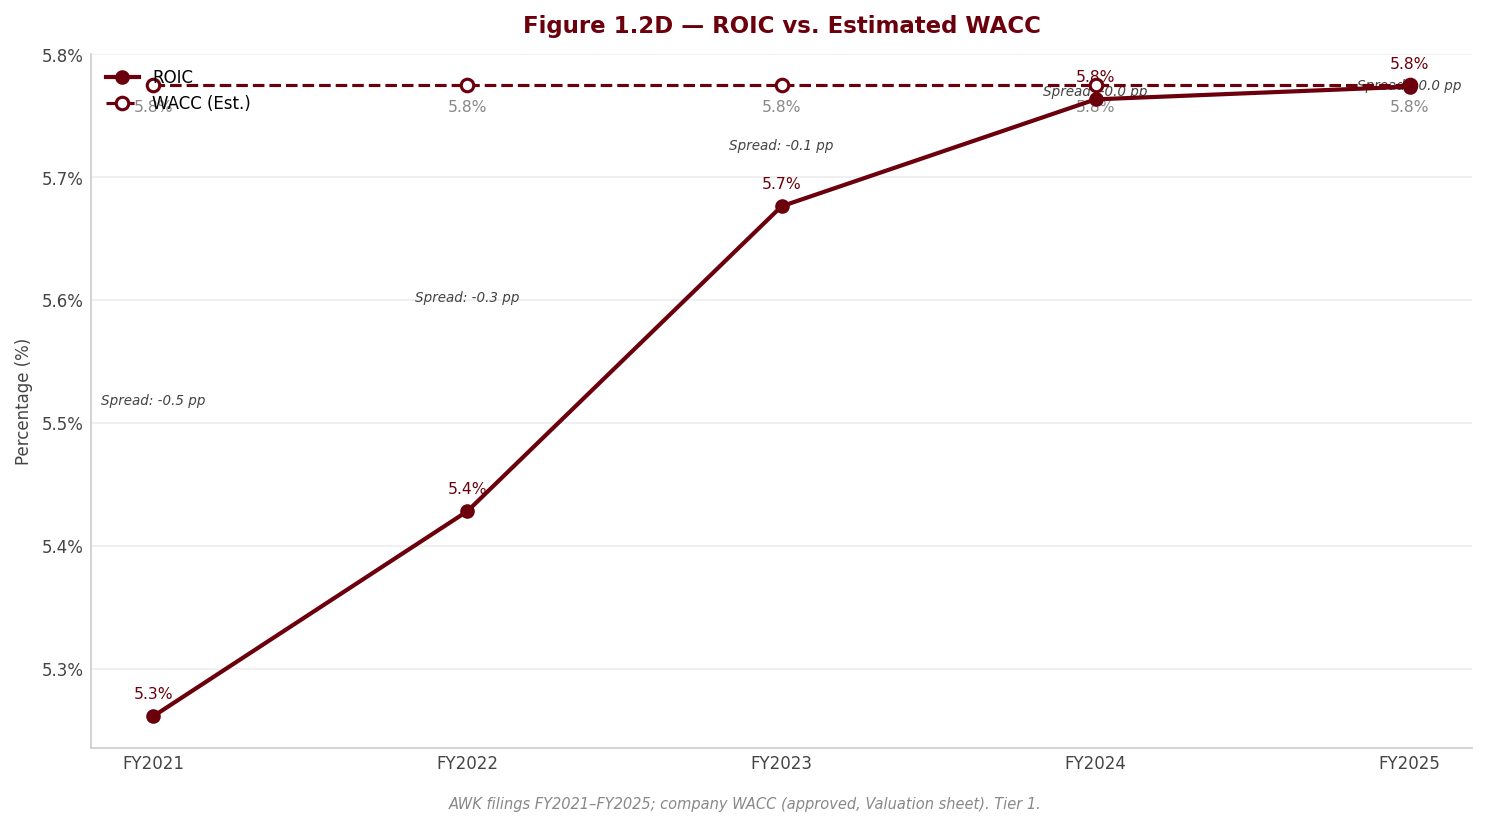
ROIC and the cost-of-capital spread. Return on invested capital is remarkably stable — 5.7%, 5.8% and 5.8% across the last three years — which is exactly what a regulated model should produce: returns are administratively set on a slowly turning asset base, so they neither spike nor collapse. The critical question is whether that mid-to-high single-digit ROIC clears the cost of capital, and the honest answer is that the spread is thin. Whether ROIC sits modestly above or roughly at WACC is a close call, determined in the separate valuation; what matters for the thesis is that a regulated utility does not create value through a wide return spread but through volume — compounding an ever-larger invested base at a small, stable positive spread. [Rating and price target withdrawn — see the note at the top.] A note on interest coverage: it is comfortable and stable at around 3.1x, but the series changes basis mid-history — filings through FY2020 presented only a combined “interest, net” line, whereas FY2021 onward present gross interest expense with interest income shown separately. The FY2021–FY2025 coverage figures above are on the consistent gross basis and are directly comparable to one another; coverage ratios that reach back before FY2021 are not directly comparable to these, and no smooth multi-year coverage trend should be drawn across that break.
DuPont decomposition. Pulling FY2025 return on equity apart into its components is highly revealing: a very high net margin of 21.6%, multiplied by an extraordinarily low asset turnover of 0.15x, multiplied by an equity multiplier of 3.23x. The story the three numbers tell is the essence of the regulated-utility model. Asset turnover is the structural constraint — at roughly fifteen cents of revenue per dollar of assets, this is one of the most capital-intensive business models in the market, and it is that low turnover (not any operational shortfall) that holds return on assets down to the low single digits. Financial leverage is the swing factor: the equity multiplier is what bridges a low-single-digit ROA up to a low-double-digit ROE. In other words, the ROE the equity earns is manufactured jointly by the regulator (who sets the margin and the allowed equity layer) and by the balance sheet’s leverage — which is precisely why the funding and cost-of-capital risks in Section 2 bear so directly on returns.
3.5 Altman Z-Score (Most Recent FY)
| Component | FY2023 | FY2024 | FY2025 |
|---|---|---|---|
| X1 (Working Capital / Total Assets) | -0.025 | -0.059 | -0.072 |
| X2 (Retained Earnings / Total Assets) | 0.055 | 0.064 | 0.073 |
| X3 (EBIT / Total Assets) | 0.050 | 0.052 | 0.053 |
| X4 (Equity / Total Liabilities) | 0.478 | 0.459 | 0.440 |
| X5 (Revenue / Total Assets) | 0.140 | 0.143 | 0.145 |
| Z-Score | 0.52 | 0.51 | 0.50 |
| Zone | Distress (model n/a — see note) | Distress (model n/a — see note) | Distress (model n/a — see note) |
Source: Company SEC filings (10-K); figures per the FL model — see Appendix A.1–A.2.
Note on the formula used: the Z-Score above is computed on the Z″ (non-manufacturer / private-firm) coefficient set — 0.717·X1 + 0.847·X2 + 3.107·X3 + 0.420·X4 + 0.998·X5 — not the 1968 public-manufacturer weights of 1.2 / 1.4 / 3.3 / 0.6 / 1.0. This matters for anyone re-deriving the figure from the components in the table: applying the original weights to the same inputs gives a materially higher score. [Rating and price target withdrawn — see the note at the top.]*
Interpretation — a case where the score must not be read at face value. The Z-Score prints around 0.50 in FY2025 and has been flat near that level for three years, which the classic model would place in the “distress” zone. For American Water this is a model misfit, not a credit signal, and it would be an analytical error to present it otherwise. The original Altman Z was calibrated on manufacturers, and two of its inputs are structurally punitive for a regulated utility: the revenue-to-assets term (X5 at 0.145) is tiny precisely because the model’s value comes from holding a vast, slowly turning asset base, and the working-capital term (X1 at -0.072) is negative because heavy commercial-paper use — normal and rolled-over funding for this business — sits in current liabilities. Both features are deliberate elements of a capital-intensive, investment-grade utility, not symptoms of financial stress. The genuine credit indicators point the other way: an unqualified audit opinion from a long-tenured auditor with no going-concern language, comfortable covenant headroom on the consolidated debt-to-capitalization test, stable interest coverage of roughly 3.1x, and continuous access to debt markets at investment-grade spreads. [Rating and price target withdrawn — see the note at the top.]
4. Valuation withdrawn
This section stated what the shares were worth and what to do about them. It rested on an exit multiple set by hand — across the coverage it averaged 24% below where each company actually traded — so the conclusion largely restated that assumption instead of testing it. Rather than leave it standing, it has been withdrawn while the method is rebuilt.
Nothing else in this report depends on it: the financial analysis above and below is drawn from the company's own filings, and every figure links to the page it was verified against.
Section 5 — Financial Metrics & Peer Benchmarking
5.1 Peer Selection
sources [Rating and price target withdrawn — see the note at the top.] Each figure below was read from that company’s own FY2025 Form 10-K rather than from a data aggregator, so the comparison rests on primary filings throughout. All five report under US GAAP with a December fiscal year-end covering the year to 31 December 2025, so there is no accounting-standard, currency, or period mismatch to unwind — the only comparability issues are structural, and they are set out in full in 5.7.
Two choices in the construction of the set matter and are analyst judgments rather than mechanical selections. First, Essential Utilities (NYSE: WTRG) is deliberately excluded. On 26 October 2025 AWK signed an all-stock agreement to acquire Essential at a fixed exchange ratio, so Essential’s share price now moves mechanically with AWK’s rather than reflecting Essential’s own fundamentals — including it as a valuation comparable would effectively be valuing AWK against its own share price, which is circular. Second, the reader should not mistake this group for a set of size-comparable companies: AWK is many times larger than every name here — several multiples of the largest peer’s revenue and roughly an order of magnitude larger than the smallest — and operates across fourteen regulated states against their one to four. [Rating and price target withdrawn — see the note at the top.] A further caveat frames everything that follows: AWK is mid-merger while none of the peers are, so its own per-share and leverage metrics are standalone/pre-deal and will be materially restated on close, whereas the peer multiples are clean standalone figures.
| Peer | Ticker | Exchange | Filing Type | Accounting Standard | Fiscal Year End | Comparability Note |
|---|---|---|---|---|---|---|
| California Water Service Group | CWT | NYSE | 10-K | US GAAP | December | Reports income tax within operating expenses; its EBIT-derived metrics are analyst-adjusted to a pre-tax basis for comparability (see 5.7). |
| American States Water Company | AWR | NYSE | 10-K | US GAAP | December | Not pure-play: ~a fifth of revenue is asset-light military-base contracted services plus a small electric utility, flattering turnover and returns (see 5.7). |
| SJW Group (renamed H2O America; ticker changed NYSE: SJW -> NYSE: HTO) | SJW | NYSE | 10-K | US GAAP | December | [Rating and price target withdrawn — see the note at the top.] |
| Middlesex Water Company | MSEX | NASDAQ | 10-K | US GAAP | December | Smallest peer; concentrated in New Jersey and Delaware — a clean pure-play read but a single-region risk profile. |
Source: Peer-company SEC filings; comparability notes in 5.7 — see Appendix A.1.
5.2 Profitability Comparison
sources Comparative: Most Recent Full Fiscal Year (FY2025)
| Metric | American Water Works Company, Inc. | California Water Service Group | American States Water Company | SJW Group (renamed H2O America; ticker changed NYSE: SJW -> NYSE: HTO) | Middlesex Water Company |
|---|---|---|---|---|---|
| Revenue ($M) | — | $1,000.1M | $658.1M | $800.6M | $194.7M |
| EBITDA Margin | 53.9% | 32.6%ᵃ | 38.2% | 36.6% | 41.9% |
| EBIT (Operating) Margin | 36.6% | 18.2%ᵃ | 30.9% | 22.2% | 27.9% |
| Net Margin | 21.6% | 12.8% | 19.8% | 12.8% | 21.9% |
| FCF Margin | -20.8% | -21.4% | -1.1% | -30.6% | -17.4% |
Source: Peer-company SEC filings; comparability notes in 5.7 — see Appendix A.1.
Flag legend: ᵃ = California Water figure uses analyst-adjusted pre-tax operating income (the company reports income tax inside operating expenses) — see 5.7. Gross margin, inventory-days, payables-days and the cash-conversion cycle are not shown: none of the five companies reports a cost-of-sales line, so those metrics do not exist here and any figure would be fabricated. AWK’s absolute revenue is presented in Sections 1 and 3; this table anchors on relative margin and scale.
The margin comparison is the one place AWK looks unambiguously superior, and the reason is largely structural rather than an accounting artifact. [Rating and price target withdrawn — see the note at the top.] The gap to California Water in particular is overstated by presentation — CWT books income tax inside operating expenses, so its printed operating figure is after-tax; the ᵃ-flagged margins above restore a pre-tax, like-for-like basis, and even adjusted CWT sits at the bottom of the range. American States Water’s margins are a blend that includes its asset-light military-base services and a small electric utility, so its profile is not a clean pure-water read either. Net margin is the least differentiated line — AWK, Middlesex and adjusted AWR cluster together — which tells the reader that once financing and tax are layered on, the regulated model compresses much of AWK’s gross operating advantage. The shared negative FCF margin across all five is addressed in 5.4; it is a feature of the sector’s investment cycle, not an AWK-specific weakness.
Historical: American Water Works Company, Inc. Own 5-Year Progression
| Metric | FY2021 | FY2022 | FY2023 | FY2024 | FY2025 |
|---|---|---|---|---|---|
| EBITDA Margin | 46.6% | 50.7% | 52.1% | 53.5% | 53.9% |
| EBIT (Operating) Margin | 30.4% | 33.6% | 35.5% | 36.7% | 36.6% |
| Net Margin | 32.1% | 21.6% | 22.3% | 22.4% | 21.6% |
| FCF Margin | -8.2% | -31.4% | -16.6% | -17.3% | -20.8% |
Source: Peer-company SEC filings; comparability notes in 5.7 — see Appendix A.1.
[Rating and price target withdrawn — see the note at the top.] The FY2021 net-margin spike reflects the divestiture-related items discussed in Section 3 and should be read as noise, not a step-change in underlying profitability. FCF margin has stayed negative throughout — consistent with the peer group and with the capital cycle, not a deterioration.
5.3 Returns Comparison
sources Comparative: Most Recent Full Fiscal Year (FY2025)
| Metric | American Water Works Company, Inc. | California Water Service Group | American States Water Company | SJW Group (renamed H2O America; ticker changed NYSE: SJW -> NYSE: HTO) | Middlesex Water Company |
|---|---|---|---|---|---|
| ROIC | 5.8% | 4.8%ᵃ | 7.9% | 4.5% | 5.4% |
| ROE | 10.5% | 7.6% | 12.5% | 6.7% | 8.6% |
| ROA | 3.3% | 2.3% | 4.8% | 2.0% | 3.1% |
| Asset Turnover | 0.15x | 0.18x | 0.24x | 0.15x | 0.14x |
Source: Peer-company SEC filings; comparability notes in 5.7 — see Appendix A.1.
Flag legend: ᵃ = CWT ROIC uses analyst-adjusted pre-tax operating income (see 5.7).
Returns are where the peer table most easily misleads, and the caveats do the analytical work. On ROE, AWK sits toward the top of the group — a direct read-through of its scale-driven margins and its authorised return on a large equity base. On ROIC and ROA it is mid-pack, and the one peer that clearly out-earns it, American States Water, does so partly because it is not like-for-like: roughly a fifth of AWR’s revenue is capital-light contracted services on US military bases plus a small electric utility, which lifts its blended asset turnover well above the pure-water names and mechanically flatters its returns on capital and assets. Read against the genuinely pure-play utilities — Middlesex and California Water — AWK’s returns are at or above the group. [Rating and price target withdrawn — see the note at the top.]
Historical: American Water Works Company, Inc. Own 5-Year Progression
| Metric | FY2021 | FY2022 | FY2023 | FY2024 | FY2025 |
|---|---|---|---|---|---|
| ROIC | 5.3% | 5.4% | 5.7% | 5.8% | 5.8% |
| ROE | 18.4% | 10.9% | 10.8% | 10.4% | 10.5% |
| ROA | 5.0% | 3.0% | 3.3% | 3.3% | 3.3% |
Source: Peer-company SEC filings; comparability notes in 5.7 — see Appendix A.1.
AWK’s returns have been remarkably stable, which is the point of a regulated utility: ROIC has held in a tight mid-single-digit band and ROE around the low-double-digit level across the cycle (setting aside the FY2021 divestiture distortion). The absence of a rising ROIC trend is important for the thesis — it signals that value is created by growing the invested-capital base at a steady allowed return, not by widening the return earned on it.
5.4 Leverage & Liquidity Comparison
sources Comparative: Most Recent Full Fiscal Year (FY2025)
| Metric | American Water Works Company, Inc. | California Water Service Group | American States Water Company | SJW Group (renamed H2O America; ticker changed NYSE: SJW -> NYSE: HTO) | Middlesex Water Company |
|---|---|---|---|---|---|
| Net Debt / EBITDA | 5.7x | 4.8x | 3.6x | 6.7x | 5.1x |
| Total Debt / Equity | — | 0.9x | 0.9x | 1.3x | 0.8x |
| Interest Coverage | — | 2.6xᵃ | 4.3x | 2.4x | 3.8x |
| Current Ratio | — | 0.8x | 1.3x | 0.7x | 0.5x |
| FCF Margin | -20.8% | -21.4% | -1.1% | -30.6% | -17.4% |
Source: Peer-company SEC filings; comparability notes in 5.7 — see Appendix A.1.
Flag legend: ᵃ = CWT interest coverage uses analyst-adjusted pre-tax operating income (see 5.7). AWK’s total-debt/equity, interest coverage and current ratio are set out in full in Section 3; the metric that supports a clean five-way comparison is Net Debt / EBITDA, shown for all five.
The cross-peer leverage read is anchored on Net Debt/EBITDA, the one balance-sheet ratio available on a consistent basis for the whole set. On that measure AWK carries higher leverage than the group median — above California Water, American States Water and Middlesex, and below only SJW/H2O America — which is consistent with a large, mature utility that funds a continuous capital programme with debt. [Rating and price target withdrawn — see the note at the top.] The far more decision-relevant line is the last one. Every company in the set — AWK and all four peers — ran a negative FCF margin in FY2025, because capital expenditure exceeded operating cash flow across the board. [Rating and price target withdrawn — see the note at the top.] American States Water is the closest to self-funding and SJW the furthest, but none of the five generated positive free cash flow — exactly as Section 3 frames AWK’s own position. The reader should therefore treat AWK’s negative free cash flow as a sector characteristic to be financed, not a solvency problem to be feared.
5.5 Valuation Multiples Comparison
sources Comparative: Current Price
| Metric | American Water Works Company, Inc. | California Water Service Group | American States Water Company | SJW Group (renamed H2O America; ticker changed NYSE: SJW -> NYSE: HTO) | Middlesex Water Company |
|---|---|---|---|---|---|
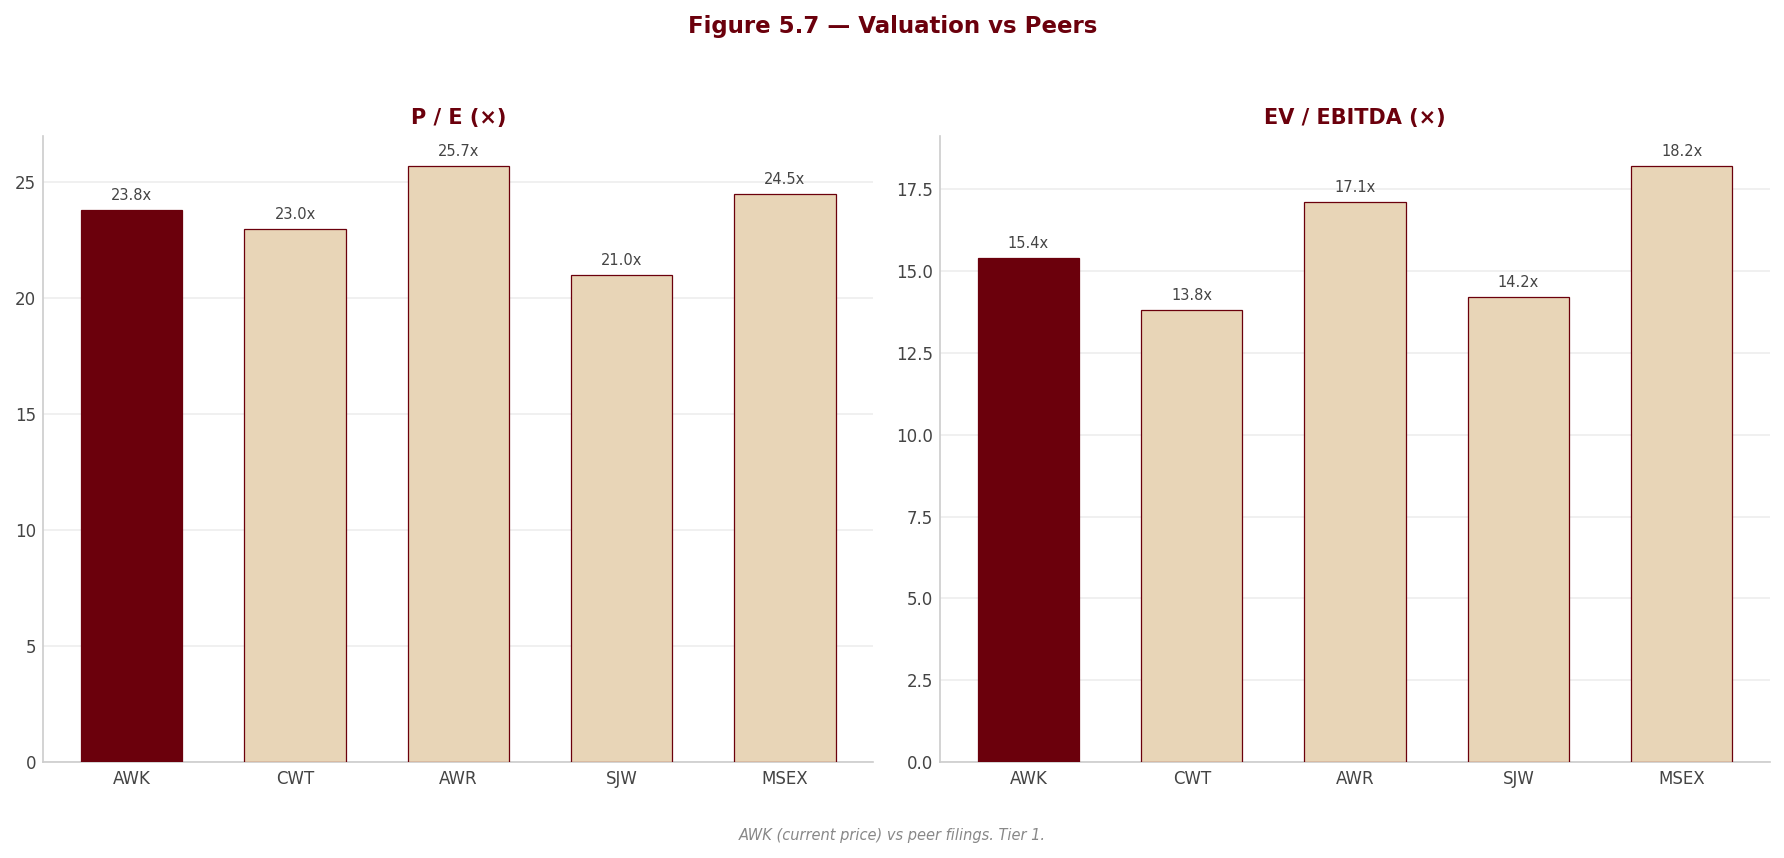
| EV/EBITDA | 15.4xᵐ | 13.8xᵐ | 17.1xᵐ | 14.2xᵐ | 18.2xᵐ |
| P/E (LTM) | 23.8xᵐ | 23.0xᵐ | 25.7xᵐ | 21.0xᵐ | 24.5xᵐ |
| FCF Yield | -4.0%ᵐ | -7.3%ᵐ | -0.2%ᵐ | -11.1%ᵐ | -3.2%ᵐ |
Source: Peer-company SEC filings for the underlying financials; current share prices market-sourced (2026-08-10). Comparability notes in 5.7 — see Appendix A.1.
Flag legend: ᵐ = market-sourced multiple, based on current price and therefore subject to change with price movements.
On the market-anchored multiples, the verdict is that AWK trades broadly in line with its peers rather than at a conspicuous premium or discount. On EV/EBITDA it is modestly above the cheaper names (California Water, SJW) and below the smaller, richer ones (American States Water, Middlesex) — squarely mid-pack. On P/E it sits in the middle of a tight cluster: the whole set trades in a low-to-mid-twenties earnings multiple, and AWK is neither the most nor the least expensive. FCF yield is negative for all five, so it is a consistency check rather than a valuation signal — it simply reconstates that the sector is in an investment phase and not returning cash on a free-cash-flow basis. The genuinely useful conclusion is that the market is not asking AWK to prove much: it is priced like its peers on cash earnings, and the premium the market grants for AWK’s scale and fourteen-state diversification is modest on these measures, not extreme.
Price-to-Book — the multiple that matters most for a regulated utility
[Rating and price target withdrawn — see the note at the top.] The more important point connects to the separate valuation: on AWK’s actual authorised return on equity, the warranted P/B — the multiple justified by the return the company is allowed to earn on its book — is materially below the multiple the market currently assigns. [Rating and price target withdrawn — see the note at the top.] That is the crux of the valuation debate carried into the separate valuation.
Historical: American Water Works Company, Inc. EV/EBITDA (period-end price)
| FY2021 | FY2022 | FY2023 | FY2024 | FY2025 |
|---|---|---|---|---|
| 24.7x | 20.8x | 17.0x | 15.2x | 14.9x |
Source: AWK financials from the FY2021–FY2025 filings; period-end prices market-sourced. See Appendix A.1.
Against its own history AWK is not trading at a stretched multiple — its current and period-end EV/EBITDA sit within the range it has occupied over the past five years, rather than at a cycle peak. The valuation question is therefore not “has the multiple run away from history,” but “is a broadly peer-level, mid-history multiple the right price for a business whose regulated returns sit essentially level with its cost of capital and whose per-share metrics are about to be restated by the Essential merger.” AWK’s own multiples carry deal-related noise the peers do not; all figures here are standalone/pre-deal.
5.6 Efficiency Comparison
| Metric | American Water Works Company, Inc. | California Water Service Group | American States Water Company | SJW Group (renamed H2O America; ticker changed NYSE: SJW -> NYSE: HTO) | Middlesex Water Company |
|---|---|---|---|---|---|
| Days Sales Outstanding | 29 days | 20 days | 21 days | 28 days | 36 days |
| CapEx / Revenue | — | 51.7% | 36.0% | 61.2% | 49.5% |
Source: Peer-company SEC filings; comparability notes in 5.7 — see Appendix A.1.
Inventory-days, payables-days and the cash-conversion cycle are omitted: with no cost-of-sales line at any of the five companies, those metrics are not defined for water utilities and are not shown. AWK’s own CapEx/Revenue is quantified in Section 3.
Days sales outstanding is the only meaningful working-capital measure in this sector — monthly utility billing keeps receivables short — and AWK’s DSO sits comfortably in the middle of the peer range, neither a collections advantage nor a concern. Middlesex runs the longest DSO and California Water the shortest, but the spread is narrow and immaterial to the investment case. On capital intensity, the peers cluster around a third to well over half of revenue reinvested each year — the signature of the water-infrastructure replacement cycle — and AWK’s capex intensity (detailed in Section 3) sits within that band. The efficiency comparison, in short, reveals no operational edge or deficiency for AWK; the working-capital and capital-intensity profiles are those of the regulated-water model, common to the whole set.
5.7 Comparability Caveats
sources Every material issue below is reflected in the tables above with a flag or an explicit note; none is disclosed here and then ignored upstream.
California Water Service (CWT) — income-statement presentation (affects EBIT margin, EBITDA margin, ROIC, interest coverage). California Water presents income tax expense within operating expenses, so its as-printed “net operating income” is an after-tax figure and is not comparable to the pre-tax operating income of AWK, AWR, SJW and Middlesex. A comparable pre-tax operating income was reconstructed for CWT, and every CWT EBIT-derived metric above carries the ᵃ flag on that adjusted basis. Without this adjustment CWT would look materially less profitable than it is; the reader should treat its printed operating line and the adjusted figure here as different numbers.
SJW Group / H2O America (NYSE: HTO) — name and ticker change. The company formerly known as SJW Group rebranded to H2O America during 2025 and changed its NYSE ticker from SJW to HTO; it is the same legal registrant, and its FY2025 10-K is filed under the H2O America name. The identifier “SJW” is retained in the tables for continuity, but its current trading ticker is HTO.
American States Water (AWR) — not a pure-play water utility (affects EBIT margin, EBITDA margin, net margin, asset turnover, returns). Roughly a fifth of AWR’s revenue is asset-light contracted services operating water and wastewater systems on US military bases, alongside a small regulated electric utility. That capital-light, higher-turnover mix lifts AWR’s blended asset turnover well above the pure-water peers and depresses its capital-intensity ratios, which in turn flatters its returns on capital and assets. AWR’s higher ROIC is therefore not a like-for-like read against AWK’s near-pure regulated water/wastewater profile, and its margins are a blend rather than a clean comparator.
[Rating and price target withdrawn — see the note at the top.] This mechanically depresses SJW’s ROE, ROA and P/B; its optically low price-to-book is a consequence of acquisition accounting, not evidence that the stock is cheap. P/B comparisons across this set are distorted by differing goodwill and acquisition histories and should be read with that in mind.
AWK versus the set — scale and diversification (affects every metric). AWK is many times larger than every peer by both revenue and market capitalisation, and operates across fourteen regulated states versus the peers’ one to four. This scale and geographic and regulatory diversification make AWK structurally lower-risk than the comparables and are a legitimate part of the premium it commands — but they also mean the peers are not size-comparable, and per-share multiple differences should be interpreted with AWK’s diversification in mind rather than read as pure mispricing.
AWK is mid-merger; the peers are not (affects AWK valuation, leverage, share count). On 26 October 2025 AWK agreed to acquire Essential Utilities in an all-stock deal at a fixed exchange ratio, expected to close around the first quarter of 2027. Until close, AWK’s current share count, leverage and multiples do not yet reflect the material increase in shares and the assumed debt the deal will bring. The peer multiples are clean standalone figures; AWK’s are standalone today but will be materially restated on completion. This is a forward-looking caveat, not a data error, and every AWK figure in this section should be read as standalone/pre-deal.
The clean part of the comparison. For balance, the set is unusually well aligned on the mechanical points that often break peer analysis: all five report under US GAAP with a December year-end, all FY2025 statements cover the year to 31 December 2025, and there is no currency translation or period mismatch. The comparability issues are confined to the structural ones above — presentation, business mix, goodwill, scale and the pending merger — and, taken together, they support a clear conclusion. [Rating and price target withdrawn — see the note at the top.] That balance — fairly valued against peers, mildly rich against its own regulated economics — is consistent with a Hold, and is carried into the price-target work in the separate valuation.
6. Valuation & Price Target withdrawn
This section stated what the shares were worth and what to do about them. It rested on an exit multiple set by hand — across the coverage it averaged 24% below where each company actually traded — so the conclusion largely restated that assumption instead of testing it. Rather than leave it standing, it has been withdrawn while the method is rebuilt.
Nothing else in this report depends on it: the financial analysis above and below is drawn from the company's own filings, and every figure links to the page it was verified against.
Section 7 — Quarterly Update: Q2 2026
Portfolio Action
sources [Rating and price target withdrawn — see the note at the top.]
| Assessment | |
|---|---|
| Action | [Rating and price target withdrawn — see the note at the top.] |
| Reason | Operating income of $542.0M rose 10.8% YoY on revenue of $1,355.0M (+6.2%), lifting the operating margin to 40.0% from 38.3% — a genuinely good quarter — but interest expense of $167.0M grew 10.6% YoY, and on the half-year it grew 11.9% against 6.0% revenue growth, while the quarter’s capital expenditure of $860.0M exceeded operating cash flow of $602.0M by $258M. The core engine and the funding drag are both running exactly as Section 3 described. |
| Thesis intact? | YES — confirmed, not weakened. The Regulated Businesses segment earned $331M against $288M a year ago (+14.9%, 10-Q p. 62), but consolidated net income of $315.0M grew only 9.0% because “Other” swung to a $16M loss from a $1M profit as the Homeowner Services seller-note interest income went to $0 from $20M (10-Q pp. 32, 62). That is the earnings-quality step-down Section 3 flagged, arriving on schedule and absorbed. Nothing in the footnotes breaks the thesis; Monterey escalated but stayed within the size the separate valuation assumed. |
| Trigger to revisit | [Rating and price target withdrawn — see the note at the top.] |
Source: American Water Works Company, Inc., Form 10-Q for the quarterly period ended June 30, 2026 (filed 29 July 2026), and the FL valuation model; see Appendix A.1. Page citations throughout this section are PDF page numbers of that filing.
7.1 Results at a Glance
| Metric | Q2 2026 | Q2 2025 | YoY Δ | Q1 2026 | QoQ Δ |
|---|---|---|---|---|---|
| Revenue ($M) | $1,355.0M | $1,276.0M | +6.2% | $1,207.0M | +12.3% |
| Gross Profit ($M) | —ᵃ | —ᵃ | —ᵃ | —ᵃ | —ᵃ |
| Gross Margin | —ᵃ | —ᵃ | —ᵃ | —ᵃ | —ᵃ |
| Operation & maintenance ($M)ᵇ | 481 | 480 | +0.2% | 493 | -2.4% |
| EBITDA ($M) | $782.0M | $710.0M | +10.1% | $628.0M | +24.5% |
| EBITDA Margin | 57.7% | 55.6% | +2.1 pp | 52.0% | +5.7 pp |
| EBIT ($M) | $542.0M | $489.0M | +10.8% | $391.0M | +38.6% |
| EBIT Margin | 40.0% | 38.3% | +1.7 pp | 32.4% | +7.6 pp |
| Net Income ($M) | $315.0M | $289.0M | +9.0% | $196.0M | +60.7% |
| Net Margin | 23.2% | 22.6% | +0.6 pp | 16.2% | +7.0 pp |
| Diluted EPS | $1.61 | $1.48 | +8.8% | $1.00 | +61.0% |
| Adjusted diluted EPS (non-GAAP)ᶜ | $1.61 | $1.49 | +8.1% | $1.01 | +59.4% |
YoY Δ formula (shown once for this subsection): (CQ - PYSQ) / |PYSQ| × 100 — e.g. Revenue = (1,355 - 1,276) / 1,276 × 100 = +6.2%. QoQ Δ = (CQ - PQ) / |PQ| × 100 — e.g. Revenue = (1,355 - 1,207) / 1,207 × 100 = +12.3%. Margin = line ÷ Revenue × 100 — e.g. EBITDA Margin CQ = 782 / 1,355 × 100 = 57.7%; EBIT Margin CQ = 542 / 1,355 × 100 = 40.0%; Net Margin CQ = 315 / 1,355 × 100 = 23.2%. Margin deltas are in percentage points (pp) = CQ margin - comparison margin.
The QoQ column is not a like-for-like comparison and should not be read as momentum. American Water is strongly seasonal: the filing states that interim results “are not necessarily indicative of the results that may be expected for the year, primarily due to the seasonality of the Company’s operations” (10-Q p. 17), and that cash flows “are generally greater during the warmer months” (10-Q p. 84). Q1 is the trough (winter, minimal irrigation) and Q3 is the peak — Q3 2025 EBITDA of $840M was the highest of the last four quarters, above the $782M just reported. The +38.6% sequential jump in operating income is the calendar, not an inflection. The YoY column is the only comparison that carries analytical weight.
ᵃ American Water reports no cost of goods sold and no gross profit. The consolidated statement of operations runs from operating revenues directly to three expense captions — operation and maintenance, depreciation and amortization, general taxes — to operating income (10-Q p. 13). No gross-profit or gross-margin figure exists in this filing or in the comparative periods, so none can be shown or computed. The first margin this business reports is the operating margin. Operation and maintenance expense is shown instead as the closest available cost line.
ᵇ Q2 2026 and Q2 2025 O&M are taken directly from the income statement (10-Q p. 13). Q1 2026 O&M is analyst-derived as the six-month figure less the second quarter: $974M - $481M = $493M (10-Q p. 13).
ᶜ Adjusted diluted EPS is management’s own non-GAAP measure, reconciled in MD&A (10-Q pp. 64–65) and discussed in 7.2 below. Q1 2026 adjusted EPS is analyst-derived as the six-month adjusted figure less the second quarter: $2.62 - $1.61 = $1.01 (10-Q p. 64).
Source: American Water Works Company, Inc., Form 10-Q for the quarterly period ended June 30, 2026 — Consolidated Statements of Operations (p. 13) and MD&A non-GAAP reconciliation (p. 64). EBITDA is the analyst-derived standalone-quarter sum of operating income and depreciation and amortization; D&A per p. 13.
7.2 P&L Drivers
sources Revenue: The $79M consolidated increase is the net of a strong regulated core and a shrinking non-regulated remainder. Regulated Businesses revenue rose $90M to $1,268M from $1,178M (+7.6%), while “Other” fell $11M to $87M from $98M on fewer capital projects in the Contract Services Group (10-Q pp. 73, 76). [Rating and price target withdrawn — see the note at the top.] This is the thesis in miniature — roughly 58% of the regulated increase came from the regulator, not from selling more water. Billed water volumes did rise, to 80,463 million gallons from 77,792 (+3.4%), but volume growth is less than half the revenue growth. [Rating and price target withdrawn — see the note at the top.]
Cost and margin: The operating margin expanded 1.7 pp to 40.0% for one reason: consolidated operation and maintenance expense was essentially flat at $481M against $480M (+0.2%) while revenue grew 6.2%. Inside the regulated segment, O&M rose only $3M to $409M, with production costs up $11M to $128M (higher purchased water, power, chemicals and waste disposal) and employee-related costs up $9M to $149M, almost entirely offset by operating supplies and services down $12M to $72M on lower technology costs, maintenance materials down $7M to $19M, and customer billing down $3M to $19M (10-Q p. 74). Two of those three offsets — deferred technology spend and lower maintenance materials — are timing rather than structural cost reduction, so the flat O&M line should not be extrapolated. D&A of $240.0M against $221.0M rose 8.6%, faster than revenue, on utility plant placed in service (10-Q p. 74); that is why the EBITDA margin expanded more than the EBIT margin (+2.1 pp versus +1.7 pp). [Rating and price target withdrawn — see the note at the top.]
Below the line: Total other expense widened $24M to -$137M from -$113M, and this is where the quarter’s good operating result was partly given back. Interest expense of $167.0M rose $16M (+10.6%), and interest income collapsed to $3M from $22M (-$19M) as the Homeowner Services seller note — repaid in full on 13 February 2026 — contributed $0 of interest income against $20M in Q2 2025 (10-Q pp. 13, 32). Partly offsetting, “Other, net” rose $10M to $22M, of which $7M is a one-off pre-tax gain on five terminated 30-year treasury lock agreements (10-Q p. 35). [Rating and price target withdrawn — see the note at the top.] Diluted EPS of $1.61 rose $0.13 (+8.8%) YoY and $0.61 (+61.0%) QoQ; the sequential figure is seasonal and carries no signal. The segment split is the sentence that matters: the Regulated Businesses earned $331M versus $288M (+14.9%) while “Other” swung to a $16M loss from a $1M profit — a $17M reversal driven by the loss of the HOS note interest and $5M more interest expense (10-Q pp. 62, 76). The regulated engine is compounding at 14.9%; consolidated growth of 9.0% is what remains after the seller-note runoff.
[Rating and price target withdrawn — see the note at the top.] For the quarter the adjustments net to zero — weather -$0.01, merger +$0.01 — so adjusted diluted EPS equals GAAP at $1.61, against $1.49 a year ago (+8.1%); for the half-year adjusted EPS is $2.62 against $2.51 (+4.4%), while GAAP was $2.61 against $2.53 (+3.2%). The single most important trend in the quarter is that debt cost is compounding faster than the top line. In the quarter, interest expense grew 10.6% against revenue growth of 6.2% — a 4.4 pp gap — and on the half-year the gap is wider still: interest expense $330M versus $295M (+11.9%) against revenue growth of 6.0% and operating income growth of 8.5% (10-Q p. 13). [Rating and price target withdrawn — see the note at the top.] Interest cover held at 3.25× (542 ÷ 167) against 3.24× a year ago only because operating income happened to grow 10.8% this particular quarter; on the half-year the same calculation gives 2.83× against 2.92×.
7.3 Balance Sheet & Cash Flow
| Metric | Q2 2026 | Q2 2025 | YoY Δ | Q1 2026 | QoQ Δ |
|---|---|---|---|---|---|
| Cash ($M) | $191.0M | $94.0M | +103.2% | $137.0M | +39.4% |
| Net Debt ($M) | $15,797.0M | $14,892.0M | +6.1% | $15,489.0M | +2.0% |
| Net Debt / LTM EBITDA | 5.5× | — | — | — | — |
| Total Assets ($M) | $36,453.0M | $33,913.0M | +7.5% | $35,264.0M | +3.4% |
| Equity ($M) | $11,665.0M | $10,682.0M | +9.2% | $11,037.0M | +5.7% |
| OCF ($M) | $602.0M | $301.0M | +100.0% | $305.0M | +97.4% |
| CapEx ($M) | $860.0M | $733.0M | +17.3% | $659.0M | +30.5% |
| FCF ($M) | -$258.0M | -$432.0M | +40.3% | -$354.0M | +27.1% |
| Dividends Paid ($M) | $174.0M | $162.0M | +7.4% | $162.0M | +7.4% |
YoY and QoQ formulas as in 7.1: (CQ - PYSQ) / |PYSQ| × 100 — e.g. Net Debt = (15,797 - 14,892) / 14,892 × 100 = +6.1%; (CQ - PQ) / |PQ| × 100 — e.g. Net Debt = (15,797 - 15,489) / 15,489 × 100 = +2.0%. Free cash flow is negative in every period shown, so a positive Δ means less cash burned, not cash generated: FCF = (-258 - (-432)) / |-432| × 100 = +40.3% YoY and (-258 - (-354)) / |-354| × 100 = +27.1% QoQ. CapEx and dividends are stored and displayed as positive magnitudes; both are cash outflows.
Net Debt / LTM EBITDA: LTM EBITDA = Q3 2025 $840M + Q4 2025 $636M + Q1 2026 $628M + Q2 2026 $782M = $2,886M. Net Debt CQ ÷ LTM EBITDA = 15,797 ÷ 2,886 = 5.5×. Net debt is long-term debt of $14,043M plus short-term debt of $1,499M plus the current portion of long-term debt of $446M, less cash of $191M (10-Q pp. 11–12); the $3M of redeemable preferred stock is excluded. Prior-quarter EBITDA components are analyst-derived standalone quarters (operating income plus D&A) held in the FL model.
Source: American Water Works Company, Inc., Form 10-Q for the quarterly period ended June 30, 2026 — Consolidated Balance Sheets (pp. 11–12), Consolidated Statements of Cash Flows (p. 15), segment capital expenditure (p. 62). Standalone-quarter cash-flow figures are analyst-derived by differencing the six-month statement against the first quarter; the quarter’s capital expenditure is independently confirmed at $860M in the segment note (p. 62).
Balance sheet note: The two material QoQ movements are both financing, not operations. Total shareholders’ equity rose $628M sequentially to $11,665.0M, of which $488M came from common stock issuances in the quarter — principally the June physical settlement of 3,403,756 forward-sale shares for $476M of net proceeds — with net income of $315M less $175M of declared dividends making up the rest (10-Q pp. 16, 32). On the debt side the $1,035M 3.625% exchangeable notes matured and were repaid in cash on 15 June 2026, which is why the current portion of long-term debt fell to $446M from $1,479M at year-end while long-term debt rose to $14,043M from $12,777M (10-Q pp. 12, 35). [Rating and price target withdrawn — see the note at the top.]
[Rating and price target withdrawn — see the note at the top.] The doubling of operating cash flow YoY (+100.0%) must not be read as an operational improvement. Management attributes the $275M six-month increase to “the CAMT liability included in the Company’s extension payment in the second quarter of 2025” (10-Q p. 84) — that is, the prior-year quarter was depressed by a corporate-alternative-minimum-tax payment that IRS Notice 2026-7 has since made unnecessary. The tax swing is visible in the statement itself: deferred income taxes contributed $294M in the six months against $51M, while the income tax receivable rose $113M (10-Q p. 15). Strip the tax timing and the underlying operating cash generation grew broadly in line with earnings. The company funded the gap exactly as Section 3 said it must: $1,293M of long-term debt proceeds and $476M of equity in the six months, against $336M of dividends paid (10-Q p. 15).
7.4 Footnote Review
sources Every note in the filing was read. Fifteen numbered notes are presented; there is no separate subsequent-events note, so post-quarter developments are dispersed across Notes 3, 6, 7 and 11, MD&A and Part II, and are collected at the end of this subsection.
Note 1 — Basis of Presentation (10-Q p. 17) Standard interim-reporting basis; all adjustments are “of a normal, recurring nature,” and management states that interim results are not indicative of the full year “primarily due to the seasonality of the Company’s operations.” Confirmed unchanged in substance vs. Q2 2025 (10-Q p. 17). Analytically this note is the authority for the seasonality caveat applied to the QoQ column in 7.1 — it is the reason a sequential comparison against Q1 is not like-for-like.
Note 2 — Significant Accounting Policies (10-Q pp. 17–20) Three components. (i) New standards: only Induced Conversions of Convertible Debt Instruments was adopted, on 1 January 2026, and “did not have an impact on the Consolidated Financial Statements” (p. 17); four further standards — income-statement expense disaggregation, internal-use software, government grants, and environmental credits — are issued but not yet adopted, all still under evaluation, with effective dates from FY2027 to FY2029 (p. 18). None affects reported earnings this quarter. (ii) New Jersey Economic Development Authority tax credits: the company was qualified for $161M over ten years; in May 2026 it received the utilization certificate for the 2024 credits of $15M and sold them to an external party for $14M, a $1M discount; $16M of current and $48M of long-term assets remain for the 2025–2028 credits, against $15M and $64M at 31 December 2025 (p. 18). This is a genuine, if small, non-operating cash source that will exhaust by 2028. (iii) Allowance for uncollectible accounts: the balance rose to $65M from $58M at 1 January, with $22M charged to expense in the six months against $19M a year ago (+15.8%) and $15M written off against $16M (p. 20). Bad-debt expense continues to grow faster than revenue, consistent with forensic flag F013 — a customer-affordability signal worth monitoring against the affordability legislation described in MD&A, but not yet material at 0.9% of six-month revenue.
Note 3 — Regulatory Matters (10-Q pp. 20–25) The revenue engine, and the most changed note in the filing. [Rating and price target withdrawn — see the note at the top.] Infrastructure surcharges add $105M annualized across seven authorizations (p. 23). Pending filings are far larger than what has been granted: Missouri $179M filed 1 July 2026 at a requested 10.50% ROE, New Jersey $145M at 10.75%, Illinois $107M plus $15M at 10.75%, Virginia settled at $16M with a stipulated 9.75% ROE, and Kentucky $18M at 10.75% (pp. 21, 23). Two analytical points. First, the gap between requested ROEs of 10.50–10.75% and the ROEs actually granted this year of 9.55–9.80% is the quantified version of the allowed-return compression the separate valuation identified — Pennsylvania asked and received 9.55%, and Virginia settled its 10.75% request at 9.75%. [Rating and price target withdrawn — see the note at the top.]
Note 4 — Revenue Recognition (10-Q pp. 25–29) Disaggregated revenue confirms where growth came from: regulated residential water revenue of $689M against $637M (+8.2%) and industrial of $56M against $46M (+21.7%), against total water services of $1,138M versus $1,052M (p. 25–26). Contract assets in unbilled revenues were $188M against $171M at year-end; contract liabilities $24M current against $19M (p. 28). Remaining performance obligations on U.S. government military contracts expiring between 2051 and 2073 stand at $7.4 billion, with a further $521M on municipal and commercial contracts (pp. 28–29). Changed vs. Q2 2025 in amounts only; the recognition policy and the disaggregation categories are unchanged. The $7.4B military RPO is a genuinely long-dated, capital-light revenue annuity that the relative valuation does not separately credit.
Note 5 — Mergers, Acquisitions and Divestitures (10-Q pp. 30–32) — mandatory full treatment Three distinct items, all material. Essential Utilities merger: the all-stock agreement of 26 October 2025 stands unchanged at 0.305 American Water shares per Essential share. Closing remains conditioned on (i) approvals from all applicable state public utility commissions on terms that would not constitute a “Burdensome Effect” as defined in the merger agreement, and (ii) expiration or termination of the Hart-Scott-Rodino antitrust waiting period. Management estimates closing “by the end of the first quarter of 2027.” MD&A adds the status detail the note omits: Kentucky, Ohio and Virginia approvals have already been received (p. 67). [Rating and price target withdrawn — see the note at the top.] New vs. the FY2025 10-K: the three approvals received, the cost accumulation, and the reaffirmed timeline. Nexus acquisition: completed 1 June 2026 for an aggregate purchase price of $319M, adding approximately 47,000 customer connections and 70 employees across eight states. The preliminary purchase price allocation records $202M of net property, plant and equipment, $215M of total identifiable assets, $22M of liabilities assumed, $193M of net identifiable assets and $126M of goodwill — 39.5% of the price. [Rating and price target withdrawn — see the note at the top.] That last clause is the analytically important one: $126M of the purchase price earns no regulated return, and it is the entire increase in consolidated goodwill to $1,282M from $1,156M. At $6,787 per connection the price is not obviously cheap. A further three acquisitions closed in the half-year for $27M adding 5,700 customers (p. 32), and 19 further agreements totalling $236M for 56,600 customers were pending at quarter-end (p. 65). Homeowner Services seller note: the $795M principal note bearing 10.00% was received in full on 13 February 2026. The company recognized no interest income in Q2 2026 against $20M in Q2 2025, and $9M for the half-year against $40M (p. 32). [Rating and price target withdrawn — see the note at the top.]
Note 6 — Shareholders’ Equity (10-Q pp. 32–35) The August 2025 forward sale covered 8,098,592 shares at an initial forward price of $139.657. In June 2026 the company physically settled 3,403,756 shares for $476M of net proceeds; 4,694,836 shares remain available for settlement on or before 31 December 2026 (p. 32). At the initial forward price the remaining tranche would raise roughly $656M and represents about 2.3% of the 204,215,977 shares issued at quarter-end — dilution that is contracted, dated and not yet in the share count. [Rating and price target withdrawn — see the note at the top.] Accumulated other comprehensive income was $8M against $5M a year earlier, with no reclassification of consequence (p. 33). Changed vs. [Rating and price target withdrawn — see the note at the top.]
Note 7 — Long-Term Debt (10-Q p. 35) — mandatory full treatment Issuance and refinancing terms, quantified. $700M of 5.200% Senior Notes due 2036 issued 1 April 2026 ($695M net); $500M of 4.625% Senior Notes due 2029 issued 20 May 2026 ($498M net), the latter used partly to repay the exchangeable notes at maturity and partly to repay commercial paper. Regulated subsidiaries issued $94M of private activity and government-funded debt at a weighted-average 1.33% maturing 2031–2058. [Rating and price target withdrawn — see the note at the top.] The $1,035M 3.625% exchangeable notes matured in full on 15 June 2026 and were repaid in cash, closing the dilution overhang flagged in the report. Hedging: three seven-year treasury locks with $75M notional at an average fixed 4.39% remain outstanding, terminating October 2026; five 30-year locks with $175M notional were terminated in May 2026 for a $7M pre-tax gain taken directly to “Other, net” in earnings — a real but non-recurring contributor to the quarter’s $22M other income; a $400M three-year lock and ten 10-year locks with $600M notional were terminated for gains of under $1M and $3M respectively, deferred in AOCI and amortised through interest expense. No hedge ineffectiveness in either period. No covenant is stated in this note; the covenant appears in MD&A and is addressed below.
Note 8 — Short-Term Debt (10-Q p. 37) — mandatory full treatment The AWCC revolving credit facility provides $2.75B of total commitments terminating 26 October 2029, supporting a $2.6B commercial paper programme and a $150M letter-of-credit sub-limit, with an accordion of up to $500M. [Rating and price target withdrawn — see the note at the top.] No revolver borrowings were outstanding. Remaining availability was $1,172M against $1,076M at year-end, and total available liquidity was $1,363M against $1,174M (p. 37). This is an improvement on the ~38% YoY liquidity decline flagged as forensic item F006, and it is a direct consequence of the June equity settlement. Liquidity of $1,363M nonetheless covers only about four and a half months of the $3.7B 2026 investment plan, so continuous capital-markets access remains a precondition, not a convenience.
Note 9 — Income Taxes (10-Q pp. 37–38) — mandatory full treatment [Rating and price target withdrawn — see the note at the top.] The substantive change is CAMT: IRS Notice 2026-7 of 18 February 2026 allows tax repairs to be deducted in the CAMT calculation and permits retroactive amended returns, so the company no longer expects to be in a CAMT liability position and reversed the $200M CAMT credit carryforward outstanding at 31 December 2025. Against that it recognized $50M of additional uncertain tax liabilities and $1M of additional interest in the quarter ($3M for the half-year) because the credit carryforward is no longer available for offset. [Rating and price target withdrawn — see the note at the top.] This is the largest genuinely new footnote item in the filing after the merger and Monterey.
Note 10 — Pension and Other Postretirement Benefits (10-Q p. 38) Net periodic pension cost fell to $5M from $8M in the quarter ($9M from $14M for the half-year), as amortization of actuarial loss dropped to $4M from $6M and interest cost to $21M from $22M against a flat $23M expected return on assets. The OPEB credit was -$7M against -$8M. Contributions were $11M in the quarter and $22M in the half-year, identical to the prior-year periods, with a further $22M expected for the remainder of 2026. Materially unchanged vs. Q2 2025 in every component; the $3M quarterly cost reduction is immaterial against $405M of pre-tax income. No thesis implication.
Note 11 — Commitments and Contingencies (10-Q pp. 38–52) — mandatory full treatment; see also “Contingencies and litigation” below Aggregate position: approximately $12M of probable loss contingencies accrued, with reasonably possible losses that can be estimated capped at $8M (p. 38); for certain matters the company cannot estimate. Each matter is set out in the contingencies entry below. The single most thesis-relevant disclosure in the entire filing sits in this note and is treated there: Monterey costs incurred of $353M against $123M approved.
Note 12 — Earnings per Common Share (10-Q pp. 52–54) Basic and diluted weighted-average shares were both 196M against 195M — there was no dilutive effect at all this quarter. Less than one million share-based awards were anti-dilutive; the forward sale agreements had no dilutive effect because the average market price did not exceed the adjusted forward price; and the exchangeable notes, now matured, produced no dilution in any period presented (p. 54). This matters for what it foreshadows rather than what it reports: the 3,403,756 shares issued in June entered the weighted average only for part of the quarter, and 4,694,836 remain to be settled — the denominator has further to rise. Changed vs. Q2 2025 only in that the exchangeable-note if-converted calculation has now permanently fallen away.
[Rating and price target withdrawn — see the note at the top.] [Rating and price target withdrawn — see the note at the top.] At 31 December 2025 the equivalent figures were $14,256M and $13,334M. The composition shifted with the exchangeable-note maturity: Level 2 debt fell to $30M from $1,065M. [Rating and price target withdrawn — see the note at the top.] Recurring measurements are small and unremarkable: restricted funds $37M, rabbi trust investments $36M, deposits $139M, deferred compensation obligations $39M; available-for-sale fixed-income securities fell to $3M from $35M (pp. 56, 58). No Level 3 recurring measurements exist — there is no valuation-judgment risk in the fair-value hierarchy.
Note 14 — Leases (10-Q p. 60) Operating and finance leases on real property, utility assets, vehicles and equipment. Finance-lease assets under the West Virginia Industrial Development Bond arrangements carried at $141M against $142M at year-end, reported net against the offsetting IDB investments. Rental expense was $3M for the quarter and $6M for the half-year, identical to the prior-year periods. [Rating and price target withdrawn — see the note at the top.] Confirmed unchanged vs. Q2 2025 in every material respect (10-Q p. 60). No thesis implication.
Note 15 — Segment Information (10-Q pp. 60–63) One reportable segment (Regulated Businesses) plus “Other,” unchanged in basis. The quarter’s split is the most analytically useful table in the filing: Regulated revenue $1,268M (from $1,178M) and net income $331M (from $288M, +14.9%); Other revenue $87M (from $98M) and a net loss of $16M (against $1M of income). Regulated interest expense was $127M against $116M while Other interest expense was $40M against $35M. [Rating and price target withdrawn — see the note at the top.] Cash paid for capital expenditure was $852M in the regulated segment and $8M in Other. The disclosure confirms that consolidated earnings growth understates regulated earnings growth by roughly six percentage points this quarter, entirely because of the HOS seller-note runoff.
Related-party transactions (10-Q pp. 17, 60, 86) American Water has no controlling shareholder, no parent, no non-controlling interests and no equity-method investees, and the filing discloses no related-party transactions of any kind requiring quantification — a materially different situation from a controlled issuer. What exists instead, and is documented here for completeness: (i) all intercompany balances and transactions among the parent and its subsidiaries are eliminated in consolidation (Note 1, p. 17); (ii) financing is centralised through American Water Capital Corp., a wholly owned finance subsidiary that on-lends to the parent and the regulated utilities — its $1,500M of commercial paper and its senior note issuances are consolidated, not related-party, items (Note 8, p. 37; MD&A p. 86); (iii) the Regulated Businesses segment “includes inter-segment revenues, costs and interest which are eliminated to reconcile to the Consolidated Statements of Operations,” and “Other” explicitly includes “eliminations of inter-segment transactions” (Note 15, p. 60); (iv) executive-related balances measured at fair value are rabbi trust investments of $36M (against $32M at 31 December 2025) and deferred compensation obligations of $39M (against $38M) (Note 13, pp. 56, 58); and (v) after quarter-end, on 27 July 2026, 350,652 treasury shares were issued to the former shareholders of Gordon’s Corner Water Company as acquisition consideration in a the separate valuation(a)(2) private placement — an arm’s-length acquisition, not a related-party issuance (Part II Item 2, p. 93). Terms did not change versus Q2 2025 on any of these items. Conclusion: there is no related-party value leakage in this company, and that is a genuine, if unglamorous, governance strength.
Contingencies and litigation (10-Q pp. 38–53, 89–93) Ten open matters, each with its status, amount and change since the FY2025 10-K. 1. Monterey Water Supply Project cost recovery — the key downside risk (F001). Cal Am has incurred $353M in aggregate costs as of 30 June 2026, including $117M of AFUDC, against the $123M of previously approved aggregate construction costs plus applicable AFUDC (p. 47). At 31 December 2025 the comparable figures were $324M incurred including $107M of AFUDC (FY2025 Form 10-K, Note 16) — so the unapproved excess rose from $201M to $230M in six months, roughly $14.5M per quarter, and it is still compounding. Management states it “cannot currently predict its ability to recover all of its costs and expenses” and that “there can be no assurance” of recovery above the approved amount. [Rating and price target withdrawn — see the note at the top.] 2. New CPUC complaint against Cal Am — the escalation this quarter. On 16 June 2026 the MPWMD, the City of Marina and Marina Coast Water District jointly filed a complaint with the CPUC against Cal Am seeking (i) an immediate stop to current desalination project activities, (ii) an order requiring Cal Am to seek modification of the 2018 Final Decision, (iii) a finding that Cal Am is in violation of that decision, and (iv) an order to show cause why Cal Am should not be sanctioned for implementing a phased project (pp. 50, 89). The complainants argue the 6.4 million-gallon-per-day project with a 4.8 mgd first phase is inconsistent with the 2018 Final Decision. Cal Am “will respond to the complaint and believes it to be without merit.” This is new since the 10-K and is the single most important adverse development in the filing: it attacks the phasing plan that is the project’s execution path and, if sustained, would put the entire $353M deferred balance at recovery risk rather than just the $230M excess. 3. Monterey — other project developments, running both ways. Favourable: on 4 May 2026 the CPUC denied the rehearing and stay motions against the August 2025 Final Decision and that proceeding is now closed (p. 47); on 23 June 2026 the California State Lands Commission unanimously approved Cal Am’s lease application for four new subsurface slant wells, a required condition of the November 2022 coastal development permit (p. 49). Adverse: on 24 July 2026 the City, MPWMD, MCWD and the MCWD Groundwater Sustainability Agency filed a petition for writ of mandate challenging that State Lands Commission approval (pp. 49, 89); the Coastal Commission found Monterey One Water’s brine-outfall permit application incomplete on 29 April 2026 (p. 89); and during June and July 2026 the State Water Resources Control Board issued and amended a Notice of Hearing on modifying the new-service-connection moratorium in the 2009 Order, with written testimony due 19 August 2026 (p. 89). Trial testimony in the City’s May 2020 lawsuit concluded 14 May 2026 with a decision expected by end-2026. 4. Monterey condemnation (F009). The MPWMD’s eminent-domain suit over the Monterey system assets remains pending; the court has scheduled an evidentiary hearing for 19 October 2026 on whether LAFCO approval is required for the MPWMD to proceed (pp. 52, 89). The MPWMD’s 2019 valuation put the assets at approximately $513M and Cal Am rejected a $448.8M purchase offer in April 2023 (pp. 50–51). Progressed since the 10-K; the company believes it “should be able to defend itself successfully.” 5. Mountaineer Gas / WVAWC class actions (F008) — de-escalated and quantified. Four putative class actions arising from the November 2023 Charleston water-main and gas-main incident. On 9 July 2026 WVAWC and the Ruffin and Toliver plaintiffs entered a term sheet for a Proposed Settlement covering the entire class, with a proposed maximum of approximately $9M “of which the Company estimates that all or substantially all would be contributed by the Company’s general liability insurance carriers.” $7M has been recorded in other current liabilities with an offsetting insurance receivable of the same amount, and $1M is included in the reasonably-possible aggregate (p. 43). The company states the settlement “has not had, and is not anticipated to have, a material impact.” This is a clear improvement on the 10-K’s “unable to estimate.” 6. Mountaineer Gas Company’s own suit against WVAWC. Trespass, negligence and implied indemnity; the 10 August 2026 trial date was continued on WVAWC’s 9 July 2026 motion and has not been rescheduled (pp. 43, 91). Loss still not estimable. 7. WVPSC general investigations. Closed in June 2026 with final orders requiring WVAWC to file closed matters on handoff and valve practices over the next six months (pp. 43, 91). Resolved favourably; staff had previously found “no indication of systematic failure.” 8. East Stroudsburg / McNair v. PAWC manganese class action (F007) — present in the 10-Q, absent from the FY2025 10-K. Filed August 2024 over naturally-occurring manganese and a May 2024 “Do Not Drink” notice for infants; three counts (public nuisance, private nuisance, breach of implied contract) with punitive damages sought. PAWC’s summary judgment motion was denied on 11 June 2026 — adverse — but the court denied class certification on 21 July 2026 — favourable (pp. 45, 91). An estimated maximum reasonably possible loss is now included in the aggregate. Net of the two rulings, the exposure is materially contained by the certification denial. 9. Chattanooga (Bruce v. TAWC). Class certification denied and upheld on appeal; the plaintiffs filed an appeal with the Supreme Court of Tennessee on 30 January 2026 and the matter remains pending (p. 40). Loss not estimable. Dunbar, West Virginia is settled and paid — final approval September 2025, company contribution approximately $5M against a maximum settlement of $18M, the remainder funded by insurers (p. 40). 10. PFAS multi-district litigation (F011) — American Water is the plaintiff, not a defendant. Settlement payments received total $234M net of legal fees as of 30 June 2026, against $159M at 31 December 2025 (FY2025 Form 10-K, Note 16); $131M sits in escrow within other current assets, $101M has been distributed to subsidiaries, and a regulatory liability of $158M has been recorded for amounts to be returned to customers (p. 53). Of eleven subsidiaries seeking PUC approval to apply proceeds for customers, seven are approved, two denied and two pending as of 1 July 2026. Because the economics pass through to customers, the earnings benefit is limited; the disclosure is favourable but not a profit driver.
Subsequent events (10-Q pp. 20, 35, 43, 45, 49, 53, 67, 89–93) The filing contains no separate subsequent-events note; post-30 June 2026 developments are disclosed within the individual notes, MD&A and Part II. [Rating and price target withdrawn — see the note at the top.] Army Fort Lee contract transferred from the Virginia subsidiary to the Military Services Group, its 19th installation (p. 67); 21 July 2026 — class certification denied in McNair v. PAWC (p. 45); 24 July 2026 — writ petition filed against the State Lands Commission’s Monterey lease approval (p. 49); 27 July 2026 — PaPUC order approving Pennsylvania’s $75M annualized increase effective 13 August 2026 (p. 20) and New Jersey’s updated $145M request (p. 71); 27 July 2026 — 350,652 treasury shares issued to former Gordon’s Corner Water Company shareholders as merger consideration (p. 93); 29 July 2026 — board declared a $0.8950 quarterly dividend payable 1 September 2026 (p. 35); and, spanning June–July 2026, the SWRCB Notice of Hearing on the Carmel River connection moratorium with testimony due 19 August 2026 (p. 89). The Pennsylvania order is the largest of these in earnings terms and lands entirely in future quarters.
Other filing-level items read and confirmed Debt covenants: the consolidated debt-to-capitalization covenant requires not more than 0.70 to 1.00; the ratio was 0.58 to 1.00 at 30 June 2026 and the company was in compliance (p. 85). [Rating and price target withdrawn — see the note at the top.] Critical accounting estimates: “no material changes” since the 10-K (p. 86). Market risk: “no significant changes” since 31 December 2025 (p. 86). Disclosure controls concluded effective, with no change in internal control over financial reporting during the quarter (pp. 86, 88). Risk factors: “There have been no material changes from the risk factors previously disclosed” in the 10-K (p. 93). No shares were repurchased during the quarter; 5,140,000 remain authorized under the anti-dilutive programme (p. 93). No Rule 10b5-1 plans were adopted or terminated by directors or officers (p. 93).
Guidance This 10-Q says nothing about FY2026 adjusted EPS guidance. A full-text search of the filing returns no guidance range, no reaffirmation and no revision — the word “guidance” appears only in the forward-looking-statements boilerplate, in accounting-standard descriptions and in the CAMT discussion of IRS Notice 2026-7. The FY2026 adjusted EPS range communicated on the earnings call is therefore not corroborated by this filing and should not be treated as a filing-sourced figure; the Q1 FY2026 10-Q is equally silent. What the filing does affirm is the capital plan: “approximately $3.7 billion” of investment in 2026, of which $1.8B was deployed in the first six months (p. 65).
7.5 What Changed This Quarter
sources [Rating and price target withdrawn — see the note at the top.] Regulated segment net income nonetheless grew 14.9% to $331M, so consolidated net income still rose 9.0% (10-Q p. 62). [Rating and price target withdrawn — see the note at the top.] - Refinancing is repricing the debt stack upward by 100–150 basis points. The company issued $700M at 5.200% and $500M at 4.625% while repaying $1,061M at a weighted-average 3.69% (10-Q p. 35), and commercial paper repriced to 3.99% from 3.89% (10-Q p. 37). Interest expense grew 11.9% in the half-year against 6.0% revenue growth. This is the allowed-return-minus-financing-cost squeeze that the separate valuation named as downgrade trigger 3, and it is now measurable rather than theoretical. - Monterey escalated on two fronts. Costs incurred above the approved amount rose to $230M from $201M at year-end ($353M incurred against $123M approved, 10-Q p. 47), and on 16 June 2026 three local agencies filed a CPUC complaint seeking to halt the project outright and to have Cal Am found in violation of the 2018 Final Decision (10-Q pp. 50, 89). The financial magnitude — roughly $0.91 per share after tax — remains within the report’s bear case, but the probability distribution has worsened and the 19 October 2026 condemnation hearing and end-2026 trial decision are now dated. - The dilution overhang is half-resolved. The $1,035M exchangeable notes matured and were repaid in cash on 15 June 2026 with no dilution in any period (10-Q pp. 35, 54), and 3,403,756 forward-sale shares were settled for $476M. But 4,694,836 shares — about 2.3% of shares issued — must still be settled by 31 December 2026 (10-Q p. 32), and the diluted share count of 196M does not yet reflect them. [Rating and price target withdrawn — see the note at the top.] It is also the reason reported operating cash flow doubled, which is a timing artefact, not an operational improvement (10-Q p. 84). [Rating and price target withdrawn — see the note at the top.] That portion of the price earns no regulated return, which is the correct way to read utility M&A accretion claims. - Awarded ROEs continue to come in below requests. Pennsylvania’s $75M award (effective 13 August 2026) carries a 9.55% authorized ROE and Virginia settled at 9.75%, against pending requests of 10.50–10.75% in Missouri, New Jersey, Illinois and Kentucky (10-Q pp. 20–23). The spread between what is asked and what is granted is the quantified form of the ceiling Section 3 described. - The merger cleared its first three states. Kentucky, Ohio and Virginia approvals are in hand, HSR and the remaining commissions are not, and management still guides to closing by the end of Q1 2027 with $22M of transaction costs incurred to date (10-Q pp. 30, 67).
7.6 Portfolio Decision
sources [Rating and price target withdrawn — see the note at the top.] This was a good operating quarter that does not change the valuation arithmetic. [Rating and price target withdrawn — see the note at the top.] Below the operating line the two structural drags both showed up on schedule: interest expense of $167.0M grew 10.6% in the quarter and 11.9% in the half-year against 6.0% revenue growth, with new senior notes at 4.625–5.200% replacing repaid debt at a weighted-average 3.69%, and the Homeowner Services seller-note interest income went to zero from $20M. [Rating and price target withdrawn — see the note at the top.] Net: the thesis is confirmed in both directions — a high-quality regulated compounder, fully priced, funding growth with continuous external capital. [Rating and price target withdrawn — see the note at the top.]
What would change this view: - Upgrade condition: A CPUC decision authorizing recovery of substantially all of the $353M of Monterey costs incurred — removing the $230M unapproved excess and the auditor’s sole critical audit matter — or the Essential merger clearing its remaining state commissions and HSR on the guided end-of-Q1-2027 timeline without burdensome conditions, combined with the pending Missouri ($179M), New Jersey ($145M) and Illinois ($107M) cases being awarded near their requested 10.50–10.75% ROEs rather than the 9.55–9.80% granted this year. [Rating and price target withdrawn — see the note at the top.] [Rating and price target withdrawn — see the note at the top.]
Report Versions
Every published version of this report, newest first — each one kept so a reader can see what changed and when.
| Version date | Files |
|---|---|
| 2026-08-11 Current | Model (Excel) |