
Adobe Inc.
Section 1 — Business Overview, Operations & Competitive Positioning
1.1 The Business
sources Adobe is a subscription software company: it sells recurring, ratably-recognized access to the creative, document, and marketing-technology tools that a large share of the world’s content is made, published, and measured with — and it earns its returns by renewing that access every year at high margins across a vast installed base rather than by selling one-time licenses. The economic engine is annualized recurring revenue (ARR): a durable subscription book that converts to revenue predictably, funds continued investment, and — because switching a professional creative or an enterprise marketing stack is disruptive and expensive — tends to renew.
That model has compounded revenue from $4,795.5M in FY2015 to $23,769.0M in FY2025, an unbroken multi-year climb that reflects the completed transition to subscription and the layering of new categories — document productivity, marketing technology, and now generative AI — onto the core creative franchise. Adobe organizes its go-to-market around two customer groups, Creative & Marketing Professionals and Business Professionals & Consumers, and markets both directly to enterprises through its own sales force and to businesses and consumers through its website and app stores. The workforce is a large, global, predominantly technical base operating under a hybrid model; management reports no work stoppages and characterizes employee relations as good. Adobe trades under ticker ADBE. §
The investment tension that frames this entire report is visible already at the level of the business model. [Rating and price target withdrawn — see the note at the top.] The market is not disputing the quality of what Adobe built; it is pricing the risk that generative AI, the very technology Adobe is racing to embed, lowers the barriers to entry around Adobe’s core creative and document workflows. [Rating and price target withdrawn — see the note at the top.] §
Key Information
| Item | Value |
|---|---|
| Ticker | ADBE |
| Sector / Industry | Information Technology / Application Software |
| Report Date | 2026-08-05 |
| Most Recent FY Revenue | $23,769.0M |
| EBIT Margin (Most Recent FY) | 36.6% |
| Diluted Shares Outstanding | 427M |
| Current Price | $273.20 |
Source: Company SEC filings (10-K); see Appendix A.1.
1.2 Operating Segments
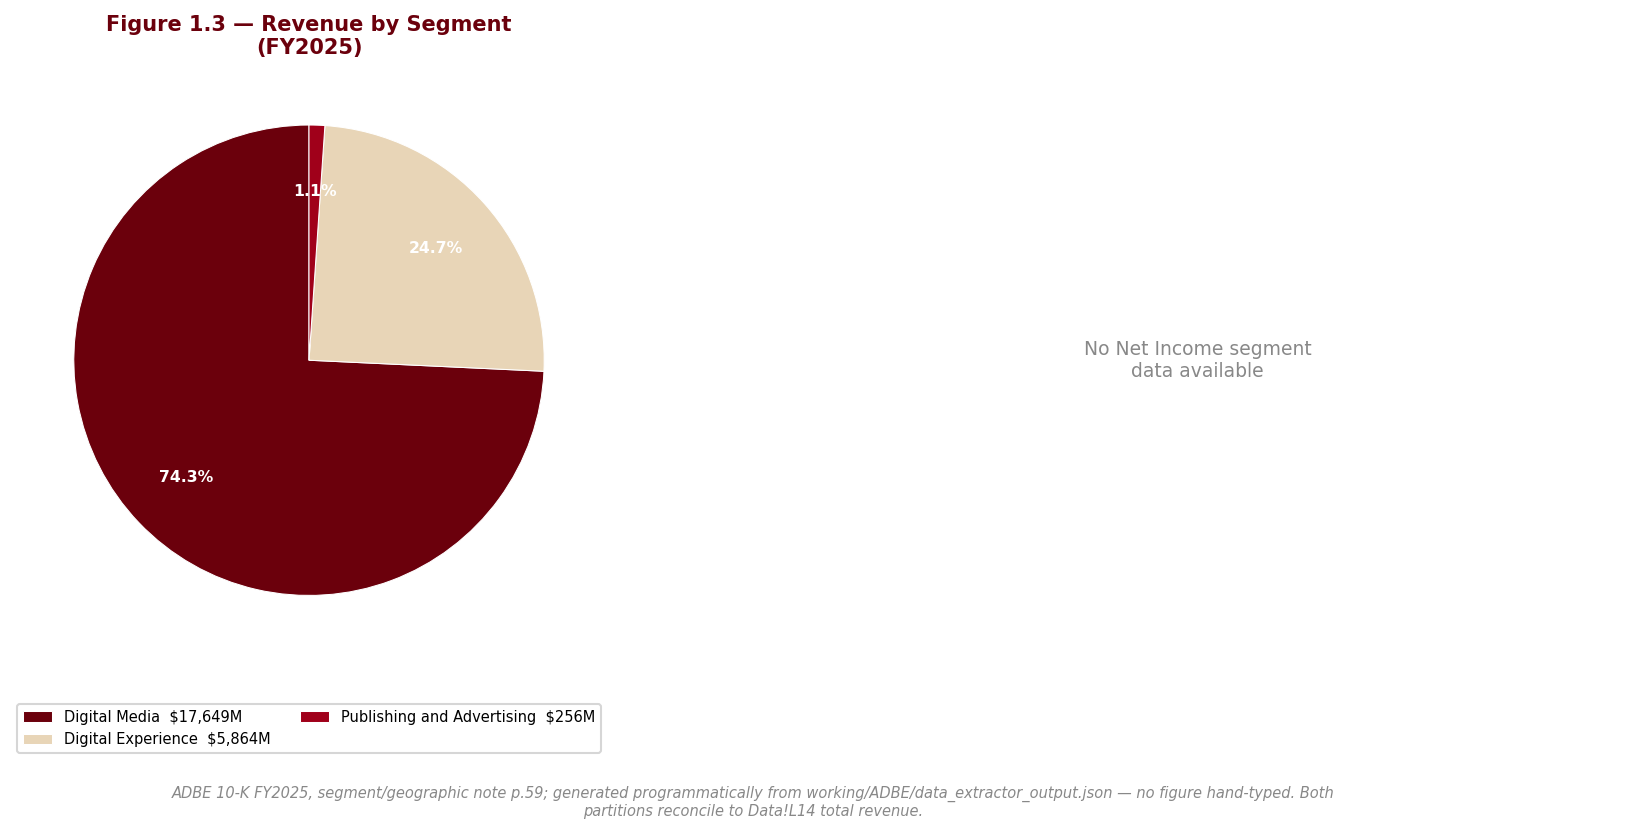
sources Through FY2025 Adobe reported three segments. Digital Media is the franchise: Creative Cloud and its flagship applications (Photoshop, Illustrator, Lightroom, Premiere Pro, After Effects), the Acrobat document family, Adobe Express, and the Firefly generative models. Its revenue model is subscription seats and ARR; the single variable that drives it is net subscriber growth times price/mix — new user acquisition through freemium funnels (free Acrobat Reader and Express feeding paid tiers) and upsell into higher-value plans and generative-credit consumption. Digital Experience serves marketing professionals with the Adobe Experience Platform and its applications — Real-Time CDP, Customer Journey Analytics, Experience Manager, Journey Optimizer, Marketo, and GenStudio — sold predominantly to enterprises on longer, larger, and more negotiated contracts; its driver is enterprise seat-and-platform expansion, which carries a longer sales cycle and more quarter-end weighting than Digital Media. Publishing and Advertising is a small legacy collection (eLearning, technical publishing, web conferencing, PostScript/PDF printing, and advertising) that is no longer a growth story and functions as a run-off tail. §
The segments fit together as a content flywheel: Digital Media creates the content, Digital Experience activates and measures it, and Adobe increasingly positions integrated offerings — GenStudio, Firefly Services — as the bridge between creation and marketing execution across a single content lifecycle. The synergy is real where a customer buys both sides; the fragility is that the two sides are very different businesses economically. Digital Media is high-velocity, high-retention, and consumer-adjacent; Digital Experience is slower-growing, enterprise, and more competitive against large cloud vendors. Blending them into one reported line will obscure exactly that difference. §
That blending is coming. Adobe has disclosed that, effective the first quarter of FY2026, it will collapse all three reportable segments into a single operating and reportable segment, citing changes in how management evaluates results and allocates resources. This is a structural break in the disclosure investors have relied on: from FY2026 the segment-level revenue and gross-profit series that allow Digital Experience to be tracked separately from Digital Media will disappear. It is not an accounting error and it does not affect FY2025’s reported figures, but it removes granularity — and it does so precisely as the slower-growing enterprise business becomes the more interesting one to watch. Compounding the loss of visibility, FY2025 also discontinued the long-standing Creative Cloud versus Document Cloud product breakout, replacing it with a two-customer-group presentation that management concedes is not cleanly comparable to the old product lines. For the purposes of this report, the three reportable segments remain the correct spine for historical trend analysis through FY2025; Section 3 uses them and flags the discontinuities explicitly.
1.3 Geographic Exposure
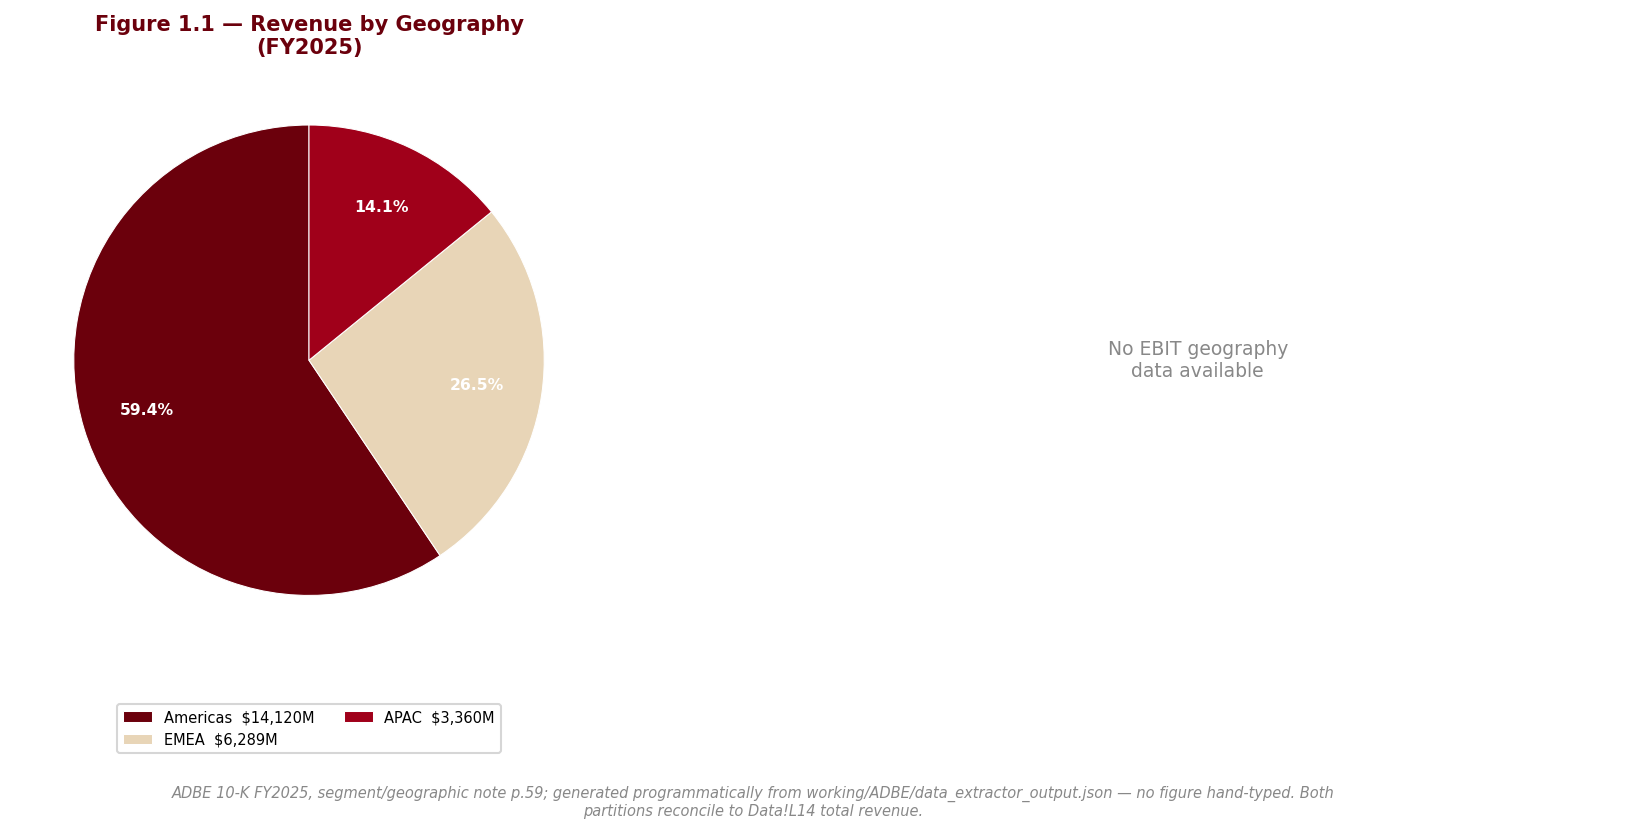
sources Adobe is a multinational deriving a large share of revenue outside the United States, reporting across three regions — Americas, EMEA, and APAC — with revenue growth in the latest year across all three. The economic consequence is genuine but manageable currency exposure: reported revenue and Adobe’s own performance metrics (ARR, remaining performance obligations) move with the dollar, and management runs a forward-and-option hedging program that it is careful to note offsets only a portion of adverse currency movement rather than all of it. Because the product is delivered from the cloud rather than manufactured and shipped, Adobe carries little of the tariff or physical-supply-chain geographic risk that burdens industrial multinationals; its cross-border exposure is instead concentrated in currency translation and in an evolving patchwork of data, privacy, and AI regulation across jurisdictions. The regulatory dimension of that exposure — including the EU AI Act and cross-border data-transfer regimes — is material enough to be treated in Section 2 rather than here.
1.4 Management Team
sources The anchor is Shantanu Narayen, who serves as Chair and CEO and is the architect of the two defining strategic bets of the modern company: the wholesale conversion to subscription and the current pivot to generative and agentic AI. That continuity at the top is a genuine asset — long-tenured leadership with a demonstrated record of executing hard business-model transitions — but it also concentrates a great deal of strategic authorship in one person, which raises the usual long-run succession question for a company this dependent on a single CEO’s platform vision.
Below the CEO, FY2025 shows a leadership team in transition. Adobe added a new Chief Marketing Officer, hired from Intuit, and a new Chief Legal Officer during the year — the latter a notable appointment given the litigation load discussed in Section 2. More significant analytically, the two business-unit President roles were renamed, with the former Digital Media president now leading the “Creativity and Productivity Business” and the former Digital Experience president leading the “Customer Experience Orchestration Business.” This is not cosmetic: the retitling mirrors, and telegraphs, the coming collapse into a single reportable segment, and it signals that management intends to run Adobe more as one integrated AI platform than as a federation of product businesses. The bench is deep and the changes are orderly rather than disruptive, but the CMO and CLO additions are new enough that their contribution is not yet demonstrated.
1.5 Capital Allocation Track Record
| Year | Dividends Paid ($M) | Share Repurchases ($M) | CapEx ($M) |
|---|---|---|---|
| FY2021 | — | $3,950.0M | $348.0M |
| FY2022 | — | $6,550.0M | $442.0M |
| FY2023 | — | $4,400.0M | $360.0M |
| FY2024 | — | $9,500.0M | $183.0M |
| FY2025 | — | $11,281.0M | $179.0M |
Source: Company SEC filings (10-K); see Appendix A.1.
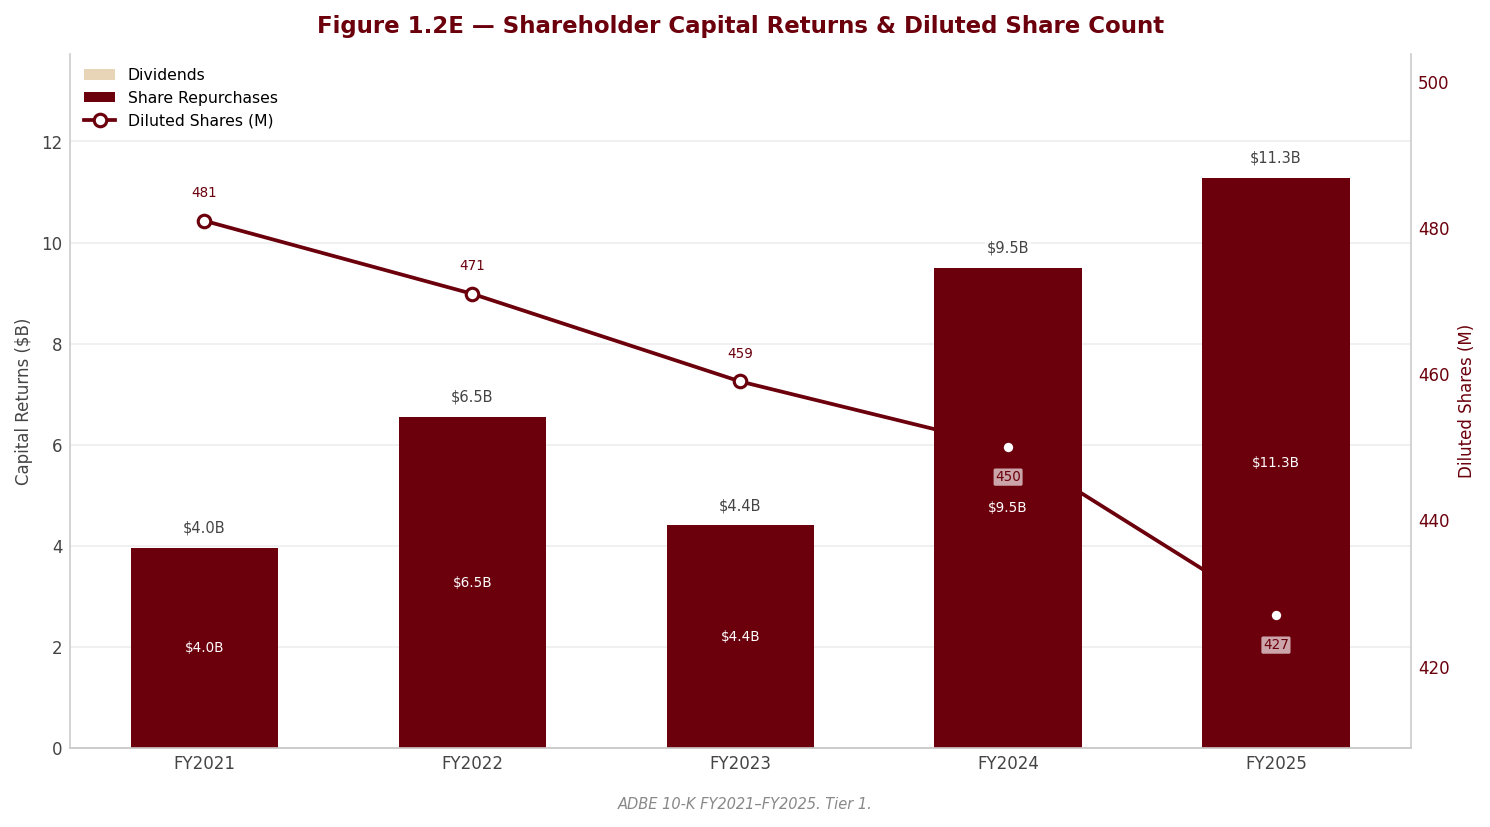
Adobe’s capital-allocation policy is unusually one-dimensional and that is the single most important thing to understand about it: the company pays no dividend and does not anticipate doing so, so essentially all shareholder return is effected through buybacks. There is no dividend payout ratio to report at all, while the total capital-return yield of 8.3% is entirely a repurchase yield. Management frames the buyback as returning value while offsetting dilution from stock-based compensation, executed through open-market and structured repurchase arrangements under a Board authorization.
Two features of this track record deserve emphasis at the descriptive level, with the financial consequences quantified in Section 3. First, the buyback is not merely returning surplus cash — its pace has run ahead of net income and has been partly funded with newly issued debt, which is a deliberate, moderately levered posture rather than a passive return of excess capital, and it is the primary engine behind the shrinking share count that supports per-share growth. Second, capital expenditure is strikingly light relative to the revenue base: this is an asset-light software model in which the balance sheet is not consumed by physical reinvestment, and cash generation is therefore available overwhelmingly for buybacks and bolt-on M&A rather than for maintaining plant. The one qualification to the asset-light characterization is that Adobe’s cash cost base is migrating toward third-party hosting and AI-inferencing capacity — a rising commitment that sits largely off the balance sheet and is addressed in Section 3. The net signal is a management team confident enough in recurring cash generation to lever modestly and buy stock aggressively, and disciplined enough on physical capital, but one whose entire shareholder-return proposition rides on the buyback continuing to be accretive — which is only true if the shares are not overvalued and the business is not being disrupted.
1.6 Competitive Positioning & Moat
sources Industry structure. Application software of this kind is a winner-take-most industry when a vendor owns the professional workflow and the file formats around it: returns accrue to whoever becomes the default tool that professionals are trained on, that enterprises standardize on, and that an ecosystem of files, plug-ins, and skills accumulates around. But Adobe itself characterizes its markets as highly competitive, rapidly evolving, and — critically — marked by limited barriers to entry, short product cycles, customer price sensitivity, and frequent entry of new, often AI-native, competitors. That combination is the crux: the incumbency is powerful, but the moat is behavioral and standards-based rather than structural, and generative AI is lowering the technical cost of building a credible competing tool.
Competitive advantages. Adobe’s moat rests on genuine and identifiable sources. Switching costs are high: creative professionals and enterprise marketing organizations embed Adobe deeply into trained workforces, established file formats (PDF, PostScript), and integrated multi-application workflows, so displacement is disruptive rather than a simple price comparison. Brand and category leadership are decades deep across creativity and document productivity. The integrated ecosystem — a single platform spanning ideation, creation, production, and marketing activation — is difficult for point-solution rivals to replicate end to end. And in the AI era Adobe has attempted to convert a potential threat into a moat extension through commercial safety: its Firefly models are trained on data Adobe has the rights to use, every generated asset carries Content Credentials, and eligible enterprise customers receive intellectual-property indemnification for Firefly-generated content. For risk-averse enterprises wary of copyright exposure from generative AI, that indemnity and provenance framework is a real, differentiated selling point that AI-native startups cannot easily match. Sustained heavy R&D — Adobe explicitly ties continued large research investment to embedding generative and agentic capability across the portfolio — reinforces the position.
Competitive vulnerabilities. The vulnerabilities are the mirror image of the same forces. [Rating and price target withdrawn — see the note at the top.] In plain terms: the technology that makes Firefly possible also lets a well-funded startup approximate a subset of Adobe’s tools at a fraction of the historical development cost, and it lowers the switching friction if a new tool is genuinely easier. A second, quieter vulnerability is margin: scaling AI features means rising third-party inferencing and hosting costs embedded in cost of subscription revenue, with monetization pathways (generative credits) still unproven at scale. There is no meaningful customer or commodity-price concentration risk here, and no single-customer dependence — the erosion risk is technological and competitive, not concentration-driven.
Verdict. Adobe’s competitive position is strong and, on any near-term view, durable: switching costs, ecosystem integration, brand, and the commercial-safety framing should protect the installed base and support high margins for the foreseeable future. The honest analytical judgment, however, is that the moat is narrower and more contestable in the AI era than the company’s historical margins would suggest — because Adobe’s own filing tells us the barriers to entry are limited and AI is lowering them further. [Rating and price target withdrawn — see the note at the top.]
Section 2 — Key Risks & Catalysts
2.1 Downside Risks
sources Adobe’s risk profile is unusual for a company of its quality: the dominant threats are not operational or financial — execution is strong and the balance sheet is sound — but strategic, disclosure-related, and, to a diminishing degree, regulatory. The single largest question is whether generative AI erodes the barriers around Adobe’s core creative and document franchise faster than Adobe can convert AI into a moat extension. Importantly, the multi-year FTC/DOJ subscription-cancellation overhang that dominated the prior-year risk picture has since been resolved by settlement, moving it from an acute, unbooked contingency to a recognised, closed matter — a genuine improvement that re-ranks the remaining risks. What now stands out beneath the AI question is a measurable degradation in the quality of disclosure available to outside analysts, a residual litigation cluster, and a thinning balance-sheet cushion behind Adobe’s AI build-out. The risks below are ordered by how directly they bear on the durability of the earnings stream.
Risk 1 — Generative AI erodes the competitive moat
sources [Rating and price target withdrawn — see the note at the top.] Adobe characterizes its markets as intensely competitive, rapidly evolving, and — critically — marked by limited barriers to entry, short product cycles, and customer price sensitivity, and it concedes that competition is intensifying specifically as generative and agentic AI is integrated across prompt-based creation and editing, document productivity, ad creation, and purpose-built agents. The mechanism that threatens the financials is straightforward: the same technology that powers Firefly lowers the cost for a well-funded, AI-native entrant to approximate a subset of Adobe’s tools, and it reduces switching friction wherever a new tool is genuinely easier to use. [Rating and price target withdrawn — see the note at the top.] Management also flags a second-order channel: it is not assured that Adobe’s own AI innovations will be successfully adopted or monetized, or that it will keep pace with the rapid evolution of AI. [Rating and price target withdrawn — see the note at the top.]
Probability: Medium | Timeframe: 3–5 years | Quantified potential impact: Not quantifiable at this stage; the exposure is to the durability of Digital Media gross margin and ARR growth rather than to any bookable liability. The impact is best understood as a valuation risk — a compression of the growth-and-margin assumptions embedded in the multiple — rather than a discrete earnings charge.
Risk 2 — Degradation of disclosure quality: product-line breakout eliminated and segments collapsing to one
sources This is a RED forensic flag, and with the regulatory matter resolved it is now the most consequential unresolved concern in the filing: a real, reportable fact rather than a matter of interpretation — an outside analyst is losing visibility into Adobe. Two changes compound. First, FY2025 eliminated the long-standing Creative Cloud versus Document Cloud revenue and ARR breakout that Adobe disclosed for years, replacing it with a two-“customer-group” presentation (Creative & Marketing Professionals; Business Professionals & Consumers) — and Adobe explicitly cautions that revenue for offerings with cross-product integrations “may be recognized in either customer group.” The new lens is therefore not a relabelling of the old product split; it embeds allocation judgment, and it cannot be cleanly reconciled to the prior lines. Any growth narrative built on tracking Document Cloud momentum loses its primary datapoint. Second, and now in effect, Adobe has collapsed all three reportable segments (Digital Media, Digital Experience, and Publishing and Advertising) into a single operating and reportable segment, effective the first quarter of FY2026 — a change disclosed in the FY2025 10-K and carried through in the Q1 and Q2 FY2026 10-Qs. From FY2026 the segment-level revenue and gross-profit series that let investors track the slower-growing Digital Experience business separately from Digital Media have disappeared.
Why this matters to the investment case: reduced disaggregation removes the ability to detect divergence between Adobe’s two economically distinct businesses precisely as that divergence becomes the more interesting question. It is not evidence of wrongdoing — the reportable-segment figures remain accurate and comparable through FY2025, and Section 3 uses them as the historical spine — but it lowers the resolution at which deterioration, if it comes, could be seen from the outside. When a high-quality company reduces the granularity of what it shows investors, that is itself a governance signal worth weighting, however benign the stated rationale.
Probability: High | Timeframe: Immediate (product breakout already gone; single-segment presentation now in force from FY2026) | Quantified potential impact: Not a direct earnings impact; the cost is analytical — permanent loss of the sub-product and, from FY2026, segment-level series. It raises the risk premium a disciplined investor should attach to the name by making future underperformance harder to detect early.
Risk 3 — Residual subscription-mechanics risk following the ROSCA settlement
sources The multi-year FTC/DOJ action over Adobe’s subscription-disclosure and cancellation practices under the Restore Online Shoppers’ Confidence Act (ROSCA) — which in the FY2025 10-K was an open and escalating matter, with the motion to dismiss denied and the case in discovery — has since been resolved. Adobe reached an agreement to settle the action and filed a stipulation of dismissal with the court during Q2 FY2026, and the associated cost has been accrued and expensed within general and administrative expense as a loss contingency. This is a genuine positive and should be read as such: a long-running regulatory overhang that management had warned could have a materially adverse impact is now closed, the “cannot estimate a reasonably possible loss” language no longer attaches to it, and the exposure has moved from an unbooked, off-balance-sheet contingency to a recognised cost. It is risk removed, not risk pending — a material improvement over the posture assumed when the underlying forensic review was performed against the FY2025 10-K alone. §
What legitimately survives is narrower and forward-looking. The settlement terms are not disclosed, so it is not possible to see from the outside whether Adobe has agreed to change how it presents renewal terms, obtains consent, or processes cancellations. [Rating and price target withdrawn — see the note at the top.] This is a real consideration but a much diminished one relative to the open-litigation posture of the prior filing; it belongs on the watch list rather than at the top of it.
Probability: Low | Timeframe: 1–2 years | Quantified potential impact: The direct contingency has been resolved and expensed (amount not separately disclosed). [Rating and price target withdrawn — see the note at the top.]
Risk 4 — Litigation overhang beyond ROSCA
sources Beyond the now-settled ROSCA matter, a cluster of Figma-related litigation remains open. A consolidated securities class action alleged that Adobe’s FY2021–2022 statements about competition from Figma were false and misleading; it was dismissed in full at the trial level and leave to amend was denied, but the plaintiff is appealing, so the matter remains live. Multiple related shareholder derivative actions against officers and directors, based on largely the same facts, are stayed. Adobe states it is unable to estimate a reasonably possible loss for these matters — the “cannot estimate” language that once also covered ROSCA now attaches only to these Figma-related actions. Separately, Adobe notes ongoing exposure to intellectual-property disputes, including from patent-assertion entities, which could require unfavorable royalty arrangements or customer indemnification. Individually these rank below the strategic risks above — the securities action has already been dismissed once — but collectively they form an unaccrued litigation tail disclosed only qualitatively. §
Probability: Low-to-Medium | Timeframe: 1–2 years | Quantified potential impact: Not estimable; Adobe books no accrual and cannot bound the loss for these matters. The realistic exposure is legal cost and settlement risk rather than an operational hit, but the pending appeal keeps reputational and headline risk alive.
Risk 5 — Rising off-balance-sheet AI-infrastructure commitments, and a goodwill impairment that has now crystallised
sources Adobe’s shift toward generative AI carries a financial cost that is easy to miss because it sits largely off the balance sheet. The company discloses substantial non-cancellable purchase obligations, primarily for third-party hosting and data-center services — the compute and inferencing capacity that AI features consume — concentrated in the near term. These are contractually committed cash outflows that do not appear as balance-sheet liabilities and represent a rising fixed cost base that reduces flexibility if revenue disappoints: unlike headcount or marketing, contracted capacity cannot be dialed back quickly. As Adobe scales generative credits and agentic features, this commitment is likely to grow and to pressure subscription gross margin — the cost of subscription revenue is already rising, driven mainly by hosting and data-center costs.
The balance-sheet cushion behind that build-out is thinning, and here the concern has moved from hypothetical to realised. The equity-reducing buyback program (analyzed in Section 3) has driven book equity down to the point where goodwill exceeds total stockholders’ equity, and Adobe tests that goodwill only on a qualitative basis, disclosing no fair-value headroom. The forensic review flagged that the bulk of the goodwill sits in the slower-growing Digital Experience unit and that a qualitative-only test leaves investors unable to gauge proximity to a trigger. Since that review, an impairment has actually crystallised — but not where it was first flagged: the most recent quarterly filing discloses a goodwill impairment charge against the Publishing and Advertising reporting unit, the small legacy run-off business, recorded within general and administrative expense. The charge falls on Adobe’s least strategically important unit and is not, in itself, a signal of stress in the core franchise. Its significance is confirmatory: it is a concrete demonstration that a qualitative-only impairment test can mask unit-level pressure until a charge is actually taken. That partially validates the original concern while relocating it — away from Digital Experience, where the larger, still-material block of goodwill continues to be tested only qualitatively. Adobe’s own risk factors concede a further charge could follow from declines in market capitalization or slower industry growth.
Probability: Low-to-Medium | Timeframe: 3–5 years (with one impairment already realised) | Quantified potential impact: Not separately quantifiable here; the exposure is to gross-margin durability (rising committed AI-compute cost) and to further non-cash goodwill charges that would dent book value without affecting cash flow. Both are contextual watch items rather than modeled liabilities.
2.2 Upside Catalysts
sources The balance of this section should be stated plainly: the risks still outnumber and, on the central question, outweigh the catalysts — though the picture has improved since the prior filing, because two of the uncertainties that clouded it have resolved favourably: the ROSCA regulatory overhang has settled, and the Semrush acquisition has closed. [Rating and price target withdrawn — see the note at the top.]
Catalyst 1 — Generative AI converts from threat to monetized moat extension
sources The mirror image of Risk 1 is the most important catalyst. If Adobe successfully monetizes generative AI — through generative-credit consumption, Firefly subscription tiers, GenStudio, Acrobat AI Assistant, and agentic features — it converts the technology that threatens its franchise into an ARR accelerant. The differentiated asset is commercial safety: Firefly is trained on data Adobe has the rights to use, every generated asset carries Content Credentials, and eligible enterprise customers receive intellectual-property indemnification for Firefly-generated content. For risk-averse enterprises wary of copyright exposure, that provenance-and-indemnity framework is something AI-native startups cannot easily replicate, and it is the most credible route by which Adobe defends and even widens the moat. This would show up first as reaccelerating Total Adobe ARR and Digital Media ARR, and in subscription revenue growth holding up despite competitive noise. §
Probability: Medium | Timeframe: 1–2 years | Monitoring trigger: Acceleration in reported ARR and evidence — in management commentary or the customer-group revenue disclosure — that generative-credit and Firefly monetization is contributing measurably to net new ARR rather than merely driving engagement.
Catalyst 2 — Buyback-driven per-share compounding
Adobe’s asset-light model throws off substantial free cash flow that, absent a dividend, is directed overwhelmingly at repurchases. A continued aggressive buyback shrinks the share count and compounds per-share metrics even when net income growth is more modest — the mechanical support beneath EPS growth analyzed in Section 3. This is the most reliable of the catalysts because it is within management’s control and does not depend on resolving the AI question. The important caveat is that the buyback is only accretive if the shares are not overvalued and the business is not being disrupted; it is a lever, not a thesis.
Probability: High | Timeframe: Immediate / ongoing | Monitoring trigger: Continued reduction in diluted share count and the pace of repurchase relative to free cash flow and remaining Board authorization; a slowing buyback would remove a key EPS-growth support.
Catalyst 3 — Integrating a completed acquisition (Semrush) and demonstrating restored M&A capability
sources Adobe’s acquisition of Semrush, a brand-visibility platform, has now closed — completed during Q2 FY2026 and reflected in goodwill on the balance sheet, funded from cash on hand. The catalyst is therefore no longer whether the deal clears regulatory review but whether Adobe integrates it well and converts it into marketing-analytics and Digital Experience growth. The close itself is a positive signal: it demonstrates that Adobe can execute M&A after the regulatory failure of the far larger Figma transaction, which was terminated on antitrust grounds and left a break fee and a litigation-and-capital-loss residue behind it. That Figma history remains the relevant caution rather than the base case — Adobe’s record on large deals is poor, and the value in Semrush now depends on integration and cross-sell rather than on a headline. This is a genuine but modest catalyst whose payoff, if any, will be operational and gradual.
Probability: Medium | Timeframe: 1–2 years | Monitoring trigger: Evidence of Semrush revenue retention and cross-sell into the Digital Experience base, and integration milestones achieved without customer churn or dis-synergies.
2.3 Risk & Catalyst Summary
| # | Item | Type | Probability | Timeframe | Status | Monitoring Trigger |
|---|---|---|---|---|---|---|
| 1 | Generative AI erodes the competitive moat | Risk | Medium | 3–5 years | Active | [Rating and price target withdrawn — see the note at the top.] |
| 2 | Disclosure degradation — product breakout eliminated; single-segment collapse (RED) | Risk | High | Immediate | Active | Single-segment presentation now in the FY2026 10-Qs; loss of Digital Experience visibility |
| 3 | Residual subscription-mechanics risk after the ROSCA settlement | Risk | Low | 1–2 years | Resolved / Monitoring | Any disclosed settlement terms; changes to renewal, consent or cancellation mechanics |
| 4 | Litigation overhang — Figma securities/derivative actions, IP disputes | Risk | Low-to-Medium | 1–2 years | Monitoring | Outcome of the securities-action appeal; movement in stayed derivative suits |
| 5 | Rising off-balance-sheet AI-infrastructure commitments; goodwill impairment now crystallised | Risk | Low-to-Medium | 3–5 years | Active | Subscription gross-margin trend; growth in hosting commitments; further impairment triggers, esp. Digital Experience |
| 6 | AI monetization converts threat to moat extension | Catalyst | Medium | 1–2 years | Monitoring | Reaccelerating ARR; measurable generative-credit / Firefly contribution to net new ARR |
| 7 | Buyback-driven per-share compounding | Catalyst | High | Ongoing | Active | Diluted share-count reduction; repurchase pace vs FCF and remaining authorization |
| 8 | Integrating the completed Semrush acquisition | Catalyst | Medium | 1–2 years | Monitoring | Semrush revenue retention and cross-sell into Digital Experience; clean integration |
Source: Company SEC filings (10-K, 10-Q) and forensic footnote review; see Appendix A.1.
2.4 Risk Interdependencies
sources These risks are not independent; the danger is in how they compound. With the ROSCA action resolved, the most damaging combination now pairs Risk 1 (AI-driven moat erosion) with Risk 2 (disclosure degradation). If the moat does begin to erode, or if a specific franchise weakens, the collapse to a single reportable segment and the elimination of the product-line breakout mean an outside analyst will see it later and less clearly than before — reduced visibility raises the probability that AI substitution materializes meaningfully before it is priced. Disclosure degradation amplifies every other risk rather than standing beside them.
A softer, residual interdependency runs from Risk 3 back to Risk 1. Before the settlement, the sharpest compounding risk in the filing was that a ROSCA-mandated change to cancellation mechanics could remove auto-renew friction at the very moment AI gave customers more reason to switch, striking subscription retention from two directions. The settlement has largely defused that combination, but because its terms are undisclosed the possibility survives in diminished form: if Adobe agreed to introduce friction into renewal or cancellation, it would still interact unfavourably with any AI-driven softening in retention. There is also a pointed link to the auditor’s work: KPMG’s sole critical audit matter concerns the sufficiency of audit evidence over software-subscription revenue sold at Adobe’s online store, driven by the number of IT systems involved — the same online-subscription channel that drew the regulator’s now-settled attention. The audit matter is longstanding and unqualified, but it underscores that online-store subscription revenue is the operationally complex, judgment-heavy area where both the auditor and, until recently, the regulator have focused.
Finally, Risk 5 interacts with Risk 1 on two fronts. Defending the moat against AI competitors requires scaling exactly the hosting and inferencing capacity that pressures gross margin, so the cost of responding to the competitive threat is itself a drag on the margins that make Adobe attractive; and the goodwill impairment now taken against the Publishing and Advertising unit is a concrete reminder that the balance-sheet cushion is genuinely thinning as buybacks reduce equity. Winning the AI race, preserving the margin structure, and running a deliberately levered capital-return posture are, to a degree, in tension with one another.
2.5 ESG & Regulatory Exposure
sources Governance. The most substantive governance considerations are the ones flagged above: a deliberate reduction in disclosure granularity (the eliminated product breakout and the now-effective single-segment presentation) and, until its recent resolution, a consumer-protection enforcement action (ROSCA) that alleged deficient disclosure and cancellation practices — a matter Adobe settled and dismissed during FY2026, moving it from an open governance concern to a closed, expensed one. Both bear on how transparently Adobe treats, respectively, its investors and its customers; the disclosure-granularity issue is the one that persists. Section 1 also noted the concentration of long-run strategic authorship in a single long-tenured CEO, a standing succession consideration. On the reassurance side, KPMG has issued an unqualified opinion on both the financial statements and internal control over financial reporting, with no going-concern or emphasis-of-matter paragraph and no restatement, and reports a single, recurring critical audit matter (online-store subscription revenue) rather than a new area of concern — a clean audit that supports reliance on the reported figures even as the governance signals around disclosure warrant attention.
Regulatory. Adobe’s regulatory exposure is broad and genuinely company-specific, even after the ROSCA resolution. It operates under an evolving global AI regulatory landscape — including the EU AI Act and emerging U.S. federal and state frameworks — that Adobe warns could raise compliance and R&D costs, expose it to investigations, and force changes to its AI development, monetization, and indemnity commitments. It faces expanding and inconsistent privacy and data regimes (GDPR, cross-border data-transfer mechanisms under legal challenge, the EU Digital Services Act and Data Act, and U.S. state privacy laws) that could constrain its business models and reach. Tax exposure is real and multi-jurisdictional, spanning the OECD global-minimum-tax regime and recent U.S. legislation; and its government-contracting activity carries budget-cycle, shutdown, and audit risk. Antitrust and merger-review risk is not hypothetical — the terminated Figma transaction is the concrete precedent, and while the smaller Semrush deal has since closed, that history continues to shadow Adobe’s ability to pursue large-scale M&A.
Environmental & social. The environmental footprint of an asset-light software company is modest, but Adobe discloses concentration risk: its headquarters, significant R&D, and certain data centers sit in the San Francisco Bay Area and Salt Lake Valley, both near major earthquake faults, and it flags climate-related events (flooding, heat waves, wildfires) among the catastrophes that could disrupt operations. The most distinctive social exposure is reputational and tied directly to the core product: the potential misuse of Adobe’s generative-AI tools to create misleading, deceptive, harmful, or infringing content outside its control, and stakeholder reaction to its positions on evolving AI technologies. Adobe’s response — commercially safe Firefly models, Content Credentials provenance labelling, and enterprise IP indemnification — is simultaneously its principal AI differentiator (Section 1) and its principal mitigant for this social risk, which is why the commercial-safety framing recurs across both the opportunity and the risk sides of this report. On cybersecurity governance, Adobe maintains a Board- and Audit-Committee-overseen information-security framework with a Chief Security Officer reporting to the CFO and providing regular Audit Committee updates — appropriate structure for a company whose solutions are embedded in customers’ supply chains, where a single compromise could affect a large share of the customer base at once.
Section 3 — Financial Analysis & Historical Performance
sources
Three-Statement Linkage Confirmation (complete before writing begins): - Net Income ties (Income Statement → Cash Flow Statement): Confirmed. Net income is the starting line of the operating cash-flow build and reconciles to the income-statement result in every year of the window. - Cash ties (Balance Sheet → Cash Flow Statement): Confirmed. The change in cash and equivalents on the cash-flow statement reconciles to the year-over-year movement in the balance-sheet cash line. - Retained Earnings reconciliation (Beg RE + NI - Dividends = End RE): Confirmed with one reconciling item, and there is no dividend leakage to reconcile because Adobe pays no dividend. The roll-forward is not simply beginning balance plus net income: closing retained earnings falls short of that sum by a small amount in each of the last four years, because Adobe charges part of the cost of retiring repurchased shares to retained earnings rather than running the entire buyback through treasury stock and additional paid-in capital. The residual is immaterial relative to the retained-earnings balance and is a capital-return bookkeeping effect, not an earnings or accrual issue — but the roll-forward should not be described as clean.
3.1A Income Statement
Source: Company SEC filings (10-K); figures per the FL model — see Appendix A.1–A.2.
CAGR Summary
| Metric | 3Y CAGR | 5Y CAGR | 10Y CAGR |
|---|---|---|---|
| Revenue | 10.5% | 13.1% | 17.4% |
| EBITDA | 11.1% | 13.8% | 22.6% |
| Net Income | 14.5% | 6.3% | 27.5% |
| Diluted EPS | 18.2% | 9.0% | 29.7% |
| FCF | 10.0% | 13.2% | 22.6% |
Source: Company SEC filings (10-K); figures per the FL model — see Appendix A.1–A.2.
3.1B Income Statement — Analysis
sources The revenue story is one of deceleration from a very high base, and that deceleration is the central fact of the income statement. Across the first half of the window Adobe compounded revenue in the low-to-mid twenties — 22.1% in FY2016, 24.7% in FY2017, 23.7% in FY2018 and 23.7% in FY2019 — as the subscription transition matured and Document Cloud and Digital Experience layered new ARR onto the creative franchise. Growth then stepped down to 15.2% in FY2020, rebounded to 22.7% in FY2021, and has since settled into a durable but distinctly slower low-double-digit cadence: 11.5% in FY2022, 10.2% in FY2023, 10.8% in FY2024 and 10.5% in FY2025. This is almost entirely a subscription-driven, recurring top line — net new ARR times price and mix — rather than a volume-and-price commodity story, so the deceleration reflects the law of large numbers acting on a maturing installed base, not a demand collapse. [Rating and price target withdrawn — see the note at the top.] One analytical caveat: the product-level lens that historically let an outside analyst attribute this growth between Creative Cloud and Document Cloud was discontinued in FY2025, so from this year forward the revenue series can be tracked only at the reportable-segment level, and from FY2026 not even there once the three segments collapse into one.
Margins tell the more flattering half of the story: they roughly doubled across the window and now sit near record levels. Operating margin expanded from 18.8% in FY2015 to 36.6% in FY2025 — the second-highest reading of the eleven-year window, behind only the 36.8% peak of FY2021. Gross margin drifted steadily upward from 84.5% in FY2015 into the high-eighties, reaching 89.3% in FY2025, a level characteristic of a scaled, cloud-delivered subscription model in which incremental revenue carries almost no incremental cost of goods. The expansion is structural rather than cyclical: it reflects the operating leverage of a recurring-revenue model whose largest cost lines — R&D and sales and marketing — grow slower than the ARR base they support. The one item working against gross margin is the rising cost of third-party hosting and AI-inferencing capacity embedded in cost of subscription revenue, which is a genuine forward headwind discussed below and in the cash-flow analysis.
Major movers.
-
Operating leverage on a recurring revenue base (structural). The single largest mover of the income statement over the window is the near-doubling of EBIT margin from 18.8% to 36.6%. On the FY2025 revenue base of $23,769.0M, each point of margin is worth a material sum, and the cumulative expansion is why net income has compounded faster than revenue. This is the durable core of the earnings quality and, on a base case, is likely to persist.
-
The FY2020 tax benefit (temporary; do not read as an operating result). FY2020 net margin spikes to 40.9% — far above the operating trend — and net income of $5,260.0M actually exceeds pre-tax income of $4,176.0M. [Rating and price target withdrawn — see the note at the top.]
-
The FY2024 Figma termination charge (temporary; distorts the FY2024→FY2025 comparison). FY2024 EBIT margin of 31.3% sits visibly below both the 34.3% of FY2023 and the 36.6% of FY2025 because operating income that year absorbed a one-time acquisition-termination fee tied to the abandoned Figma transaction. The consequence for analysis is important: the apparent FY2025 operating-margin and EBIT rebound — EBIT rising from $6,741.0M to $8,706.0M — substantially reflects the absence of that non-recurring charge, not a step-change in underlying operating acceleration. Read FY2025 against FY2023 to see the true operating trajectory, not against the depressed FY2024 base.
-
Share-count reduction as an EPS lever (management-controlled). Diluted EPS of $16.70 has grown faster than net income across the window because the diluted share count has fallen steadily — from 507 million shares in FY2015 to 427 million in FY2025. This is a genuine and reliable source of per-share compounding, but it is a capital-allocation lever rather than operating growth, and the honest framing is that reported EPS growth overstates the pace of business growth by the amount of the buyback contribution.
[Rating and price target withdrawn — see the note at the top.]
Quality of earnings. The audited numbers are reliable — the audit opinion is unqualified on both the financials and internal control, with a single longstanding critical audit matter over online-store subscription revenue and no restatement — but three interpretation items shape how the reported results should be read, and all three are disclosed as forensic flags. First, the FY2025 headline results are clean of one-offs at the operating line, but the year-over-year comparisons are distorted by the two non-recurring items above (the FY2020 tax benefit and the FY2024 Figma charge). Second, a post-balance-sheet resolution that materially changes the forward read: the FTC/DOJ subscription-cancellation action under ROSCA — which at the FY2025 balance-sheet date was an unaccrued, unquantified and potentially material contingency sitting entirely off the income statement and balance sheet — has since been settled, with the parties reaching an agreement and filing a stipulation of dismissal in the subsequent interim period. The statement about the FY2025 accounts remains true as at that date: those figures genuinely contain no provision for the matter, so nothing in the tables above changes. What changes is the forward-looking characterisation — the off-balance-sheet overhang described in the FY2025 statements has been resolved rather than crystallising as an unbounded liability, and the associated cost has been recognised as a loss-contingency charge within general and administrative expense in the FY2026 interim accounts. The “cannot estimate a reasonably possible loss” language now attaches only to the separate Figma-related securities and stayed derivative actions, not to ROSCA. The settlement amount is not separately disclosed, so its size cannot be quantified from the filing, but the direction of the news is favourable: an unbounded tail has become a bounded, recognised cost. Third, the elimination of the Creative Cloud versus Document Cloud revenue split (and, from FY2026, of segment-level disclosure altogether) does not affect the accuracy of the reported totals but permanently lowers the resolution at which an outside analyst can verify where growth and margin are actually coming from.
⚠ Items to Watch. If EBIT margin falls below the 34.3% level of FY2023 on a sustained basis, it would break the operating-leverage trend that underwrites the earnings-quality case and force a re-examination of whether rising AI-inferencing cost is structurally impairing gross margin. [Rating and price target withdrawn — see the note at the top.] With the ROSCA action now settled and dismissed, the residual forward risk is no longer a monetary crystallisation but a behavioural one: if the undisclosed settlement terms require changes to how Adobe discloses subscription terms, auto-renews, or processes cancellations, the frictionless renewal mechanics that underpin ARR retention could come under pressure — a slow, revenue-side risk to watch rather than a discrete cash charge.
3.2A Balance Sheet
Source: Company SEC filings (10-K); figures per the FL model — see Appendix A.1–A.2.
3.2B Balance Sheet — Analysis
sources Asset composition confirms the asset-light, acquisition-built nature of the business. This is not a PP&E-heavy balance sheet — net property and equipment of $1,873.0M is a small fraction of $29,496.0M in total assets — but a goodwill-and-intangibles-heavy one, the residue of a long history of acquisitions, alongside a substantial cash and short-term-investment position and a receivables book of $2,344.0M. Adobe carries no inventory, as befits a pure software model, so the inventory line is empty and conventional inventory-based working-capital analysis does not apply. The most important single fact on the asset side is that goodwill alone, at $12,857.0M, now exceeds total stockholders’ equity of $11,623.0M — before counting the separately reported other intangibles. That is a direct consequence of the buyback-driven shrinkage of the equity base rather than any deterioration in the assets, but it deserves flagging: Adobe tests goodwill on a qualitative basis only, disclosing no fair-value headroom, and the bulk of that goodwill sits in the slower-growing Digital Experience reporting unit. There is no evidence of impairment today, but a qualitative-only test gives an outside investor no cushion to gauge, and the FY2026 collapse to a single reportable segment may itself change the reporting-unit structure used for that test — a disclosure-quality watch item, not a present charge.
Leverage has risen deliberately, and the balance sheet has swung from net cash to net debt — but off a very low base. Gross debt has increased from $3,634.0M in FY2023 to $6,210.0M in FY2025 — an increase of more than two-thirds over two years — as Adobe issued new senior notes to help fund its repurchase program. The more telling swing is in the net position: Adobe held net cash of -$3,507.0M in FY2023 and -$1,985.0M in FY2024 (negative net debt), and moved to a net debt position of $779.0M in FY2025 as cash was drawn down and gross debt rose. This is a genuine change in financial posture — Adobe is now a modestly levered company where it was previously net-cash — and it is a direct expression of the capital-allocation choice to return more than the business earns. The critical qualification is that the leverage is trivial against cash generation: net debt to EBITDA ends the window at 0.1x and total debt to EBITDA at roughly 0.7x, and the debt itself is orderly and low-risk — senior notes with no financial covenants, a laddered maturity profile with no near-term wall, an undrawn revolver and an unused commercial-paper backstop. This is opportunistic, covenant-light leverage in service of buybacks, not balance-sheet stress. The FY2019 spike in short-term debt visible earlier in the history was simply notes and a term loan reaching within-a-year maturity, not a liquidity event.
Working capital has tightened to slightly negative, which is normal for this model but worth naming. The current ratio has drifted down across the window and fell just below 1.0x in FY2025 at 1.0x, versus 1.3x in FY2023. For a subscription business this is not a warning sign: a large deferred-revenue balance sits in current liabilities as cash collected ahead of revenue recognition, so a current ratio near or below 1.0x is a feature of the model, not a symptom of strain. There is no receivables build outpacing revenue and no inventory to bloat — the tightening is the combined result of the deferred-revenue liability and the deliberate draw-down of cash to fund repurchases, not a deterioration in collection quality. Book value per share is falling as a direct arithmetic consequence of the buyback: from $35.99 in FY2023 to $27.22 in FY2025, equity per share declines because equity is being retired faster than earnings replenish it. This is the honest corollary of the capital-return policy and it flatters every book-based return ratio, as the returns analysis below makes explicit.
⚠ Items to Watch. If net debt to EBITDA rises materially above the 0.1x reached in FY2025 while free cash flow softens, the debt-funded character of the buyback would move from opportunistic to strained, and the modest-leverage reassurance would need revisiting. The qualitative-only goodwill test flagged above is no longer a purely hypothetical concern: in a subsequent interim period Adobe recorded a goodwill impairment charge, taken through general and administrative expense, against its smallest reporting unit, Publishing & Advertising — not the Digital Experience unit where the concentration risk was greatest, and immaterial to cash flow, but a reminder that with goodwill of $12,857.0M sitting above a shrinking equity base the risk of a non-cash write-down denting reported book value and returns is live rather than theoretical, and Digital Experience remains the unit to watch. And a current ratio falling well below the 1.0x of FY2025 would warrant confirming that the driver remains deferred revenue rather than a genuine liquidity squeeze.
3.3A Cash Flow Statement
| FY2021 | FY2022 | FY2023 | FY2024 | FY2025 | |
|---|---|---|---|---|---|
| Cash from Operations ($M) | $7,230.0M | $7,838.0M | $7,302.0M | $8,056.0M | $10,031.0M |
| — Depreciation & Amortization ($M) | $788.0M | $856.0M | $872.0M | $857.0M | $818.0M |
| Capital Expenditures ($M) | $348.0M | $442.0M | $360.0M | $183.0M | $179.0M |
| Free Cash Flow ($M) | $6,882.0M | $7,396.0M | $6,942.0M | $7,873.0M | $9,852.0M |
| FCF Margin | 43.6% | 42.0% | 35.8% | 36.6% | 41.4% |
| FCF / Share | $14.31 | $15.70 | $15.12 | $17.50 | $23.07 |
| FCF Conversion (FCF/NI) | 142.7% | 155.5% | 127.9% | 141.6% | 138.2% |
| CapEx / Revenue | 2.2% | 2.5% | 1.9% | 0.9% | 0.8% |
| CapEx / D&A | 0.4x | 0.5x | 0.4x | 0.2x | 0.2x |
| Dividends Paid ($M) | — | — | — | — | — |
| Share Repurchases ($M) | $3,950.0M | $6,550.0M | $4,400.0M | $9,500.0M | $11,281.0M |
Source: Company SEC filings (10-K); figures per the FL model — see Appendix A.1–A.2.
3.3B Cash Flow — Analysis
sources Cash generation is the strongest single feature of this business, and its quality is genuinely excellent — this is the part of the earnings story that is not flattered by anything. Free cash flow of $9,852.0M in FY2025 represents an FCF margin of 41.4%, in line with the high-thirties-to-low-forties range Adobe has sustained for years (43.6% in FY2021, 35.8% in FY2023). More important than the level is the conversion: free cash flow has exceeded net income in every year of the window, with FCF conversion of 138.2% in FY2025 and never below 127.9% even in its weakest year. A company that consistently converts more than the whole of its net income into free cash is not consuming cash in working capital or capitalized costs — the opposite: the deferred-revenue dynamic of a growing subscription book means cash is collected ahead of revenue recognition, so operating cash flow structurally runs ahead of accounting earnings. This is the highest-quality attribute in the financials and the anchor of the valuation.
Capital intensity is negligible and the business is firmly in a capital-light, cash-harvest posture. CapEx of $179.0M was just 0.8% of revenue in FY2025, and CapEx ran at only 0.2x of depreciation and amortization — well below the 1.0x line that would signal net growth investment in physical assets. In an industrial company a CapEx/D&A ratio this far below 1.0x would raise an underinvestment concern; here it simply reflects that Adobe’s “investment” is expensed R&D and, increasingly, contracted cloud capacity rather than capitalized plant. That last point is the important qualification to the asset-light story: Adobe’s growth investment in AI is migrating into large off-balance-sheet purchase commitments for third-party hosting and data-center capacity — non-cancellable obligations that do not appear as balance-sheet liabilities or as CapEx, but that represent a real and rising fixed-cost claim on future cash and a genuine headwind to subscription gross margin as generative-AI inferencing scales. The low reported CapEx therefore understates the true forward investment intensity of the AI build-out.
The capital-allocation waterfall is stark and one-dimensional: essentially all of the free cash flow generated is returned through buybacks, and in FY2025 the return exceeded both earnings and free cash flow. Adobe pays no dividend, so there is no payout ratio to speak of — the dividend line is empty by policy. Share repurchases of $11,281.0M in FY2025 exceeded net income of $7,130.0M, and did so partly on the strength of newly issued debt rather than purely from internally generated cash. This is a deliberately levered capital-return posture, and its consequences run through the whole balance sheet and returns picture: it is the engine behind the falling share count that supports EPS, the direct cause of the decline in stockholders’ equity to $11,623.0M, and the reason book value per share is falling. Whether this mix makes sense depends entirely on price and on the AI question: buying back stock in preference to reinvestment is rational for a business with limited high-return reinvestment needs and abundant cash, but it is only accretive if the shares are not overvalued and the franchise is not being disrupted — the two open questions of this report. As a use of a scarce M&A opportunity set, the near-absence of acquisition spend in FY2025 (ahead of the smaller Semrush deal, since completed in FY2026) is consistent with a management that, after the failed Figma transaction, is choosing the buyback as the default use of cash.
⚠ Items to Watch. If FCF conversion falls durably below one-for-one — below the 127.9% floor of the window — it would signal that the deferred-revenue tailwind is fading as growth slows, and would remove the single best feature of the financials. If FCF margin drops below the 35.8% low of the window as AI-hosting costs scale, it would confirm the gross-margin-durability concern. And if repurchases continue to exceed free cash flow and are funded by rising debt, the per-share compounding that supports the equity story would increasingly be borrowed rather than earned — sustainable at today’s 0.1x net leverage, but not indefinitely.
3.4 Returns Analysis
| FY2021 | FY2022 | FY2023 | FY2024 | FY2025 | |
|---|---|---|---|---|---|
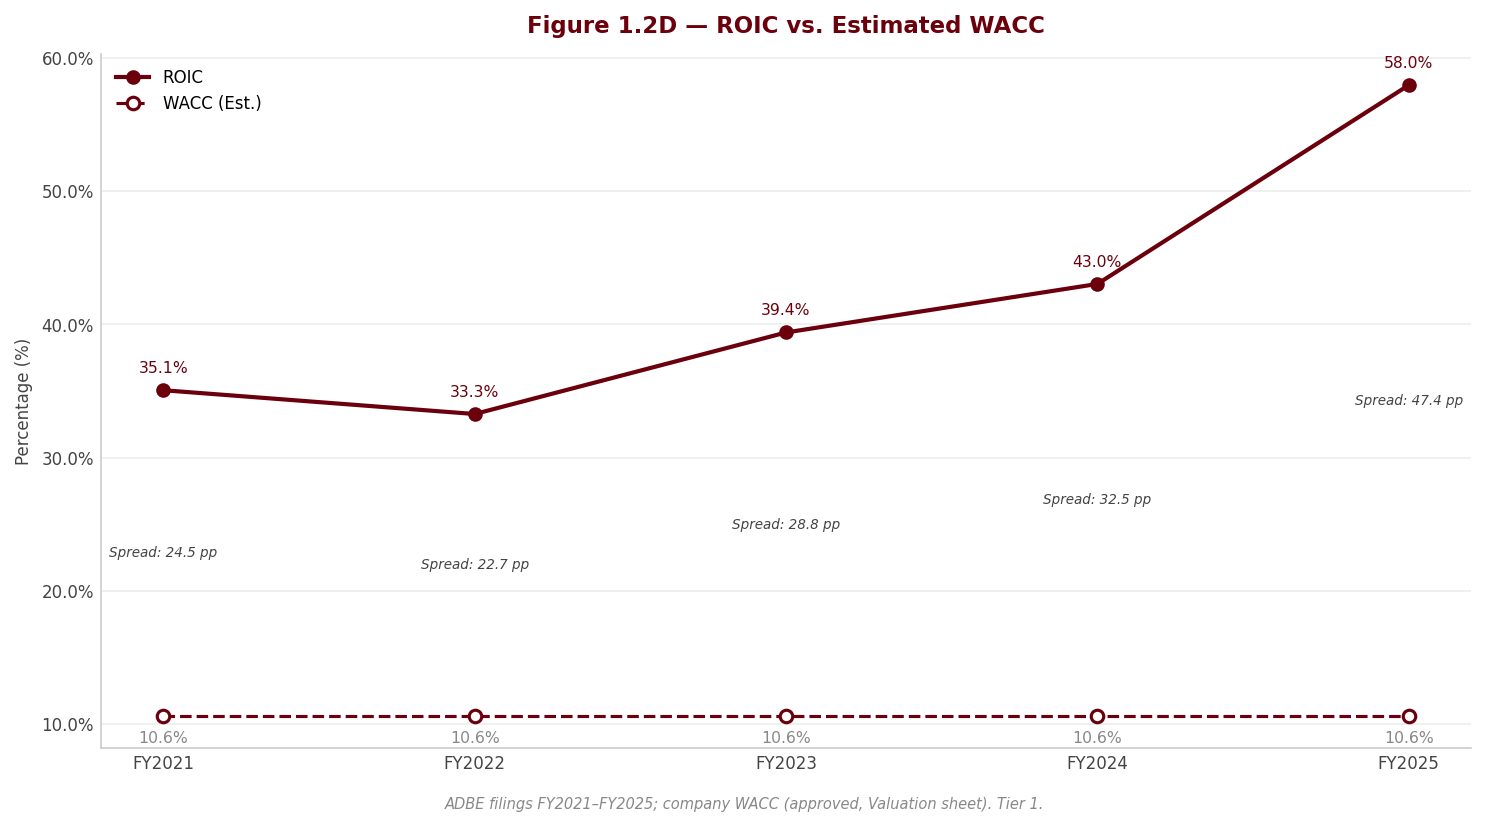
| ROIC | 35.1% | 33.3% | 39.4% | 43.0% | 58.0% |
| ROE | 34.4% | 33.0% | 35.5% | 36.3% | 55.4% |
| ROA | 18.7% | 17.5% | 19.1% | 18.5% | 23.9% |
| Interest Coverage | 51.3x | 54.4x | 58.8x | 39.9x | 33.1x |
Source: Company SEC filings (10-K); figures per the FL model — see Appendix A.1–A.2.
Returns on capital are exceptionally high and rising — ROIC reached 58.0% in FY2025, up from 35.1% in FY2021, and sits far above any reasonable estimate of the weighted-average cost of capital. On a forward-looking basis the ROIC–WACC spread is very wide and firmly positive: Adobe earns multiples of its cost of capital on invested capital, which is the fundamental economic justification for the franchise’s value and the reason the business compounds intrinsic value even as top-line growth slows. That is the genuinely good news, and it is real: the numerator — high-margin, cash-generative operating profit — is doing legitimate work. But intellectual honesty requires naming the denominator effect. Part of the sharp upward move in ROIC and ROE in FY2024–FY2025 is not operating improvement at all; it is the mechanical result of a shrinking invested-capital and equity base. The buyback has retired equity aggressively — driving stockholders’ equity down to $11,623.0M — so the same operating profit is measured against a smaller denominator, inflating the return ratios. ROE jumping to 55.4% in FY2025 from 36.3% in FY2024 is only partly earned; a large share of that step-up is financial engineering via the equity reduction rather than a genuine leap in operating profitability. [Rating and price target withdrawn — see the note at the top.] Interest coverage remains comfortable throughout, at 33.1x in FY2025; it has fallen from the 51.3x of FY2021 purely because debt and interest expense have risen from a near-zero base, not because earnings power has weakened, and at 33.1x it signals no credit stress whatsoever.
The DuPont decomposition makes the source of the FY2025 ROE of 55.4% explicit. It resolves into a net margin of 30.0%, an asset turnover of 0.80x, and an equity multiplier of 2.32x. The dominant driver of the level of ROE is profitability — the very high net margin — consistent with a scaled software model; asset turnover is modest, as expected for a goodwill-heavy balance sheet. The swing factor, and the analytically critical one, is the equity multiplier: at 2.32x it is elevated and rising precisely because the buyback has shrunk equity and added leverage. In other words, the component that moved ROE higher most recently is not margin or turnover — both of which are relatively stable — but the leverage/equity-reduction term. This confirms the caution above: the FY2025 ROE is a genuinely high return amplified by a deliberately smaller and more levered equity base, and it should be read as such rather than as a pure operating result.
3.5 Altman Z-Score (Most Recent FY)
| Component | FY2023 | FY2024 | FY2025 |
|---|---|---|---|
| X1 (Working Capital / Total Assets) | 0.095 | 0.024 | -0.001 |
| X2 (Retained Earnings / Total Assets) | 1.120 | 1.273 | 1.538 |
| X3 (EBIT / Total Assets) | 0.223 | 0.223 | 0.295 |
| X4 (Equity / Total Liabilities) | 1.246 | 0.875 | 0.650 |
| X5 (Revenue / Total Assets) | 0.652 | 0.711 | 0.806 |
| Z-Score | 2.88 | 2.86 | 3.30 |
| Zone | Gray | Gray | Safe |
Source: Company SEC filings (10-K); figures per the FL model — see Appendix A.1–A.2.
On the Z′ model computed here (safe above 2.90, distress below 1.23), Adobe sat just inside the gray band in FY2023 (2.88) and FY2024 (2.86) — a whisker under the safe line, an artifact of the buyback-shrunk book equity in X4 rather than any credit signal — and crossed into the Safe zone in FY2025 at 3.30: the model reads Adobe as moving further from, not toward, any distress boundary. This is the expected result for a highly profitable, cash-generative business with modest leverage, and it corroborates the low credit risk evident in the debt structure and interest coverage. One nuance worth flagging for intellectual honesty: the buyback-driven reduction in equity pressures the X4 (equity to total liabilities) term downward, yet the overall score still rose, because the strength of the profitability terms (X3 EBIT to total assets) and the revenue-productivity term (X5) more than offset it. The credit implication is unambiguous — bankruptcy risk is negligible and the balance sheet carries no solvency concern — but the reader should understand that the equity-reducing capital policy is a headwind to one component of an otherwise very comfortable score, and that the off-balance-sheet items discussed above (the unquantified ROSCA contingency and the growing hosting commitments) sit outside what a Z-Score can capture.
4. Valuation withdrawn
This section stated what the shares were worth and what to do about them. It rested on an exit multiple set by hand — across the coverage it averaged 24% below where each company actually traded — so the conclusion largely restated that assumption instead of testing it. Rather than leave it standing, it has been withdrawn while the method is rebuilt.
Nothing else in this report depends on it: the financial analysis above and below is drawn from the company's own filings, and every figure links to the page it was verified against.
Section 5 — Financial Metrics & Peer Benchmarking
5.1 Peer Selection
sources Adobe has no clean one-for-one comparable. No other listed company pairs a creative-content franchise (Creative Cloud), a document platform (Document Cloud) and an enterprise experience-management stack at anything like Adobe’s margin structure. The peer set is therefore assembled from the large-capitalisation application-software names that overlap Adobe on at least one of the axes that matter for this analysis: subscription/SaaS unit economics, enterprise go-to-market, and — most topically — a maturing growth profile now being re-underwritten by the market for the arrival of generative AI. Salesforce and SAP anchor the enterprise-software comparison on scale; Intuit matches Adobe’s blend of high-retention recurring revenue and best-in-class cash generation; and Autodesk is the closest structural analogue of the four — a design-software franchise on a comparable subscription model with a near-identical gross-margin profile, albeit a fraction of Adobe’s size.
The weaknesses of the set are explicit and material, not incidental. SAP SE reports under IFRS in euros, so every SAP comparison is directional only; no two companies in the table share a fiscal-year end, so no two columns cover the same twelve months; and the group spans a revenue range of roughly five-to-one. These limitations are catalogued in full in 5.7, and every comparison that follows is framed accordingly — as a directional read on where Adobe genuinely stands, not a precise like-for-like ranking.
| Peer | Ticker | Exchange | Filing Type | Accounting Standard | Fiscal Year End | Comparability Note |
|---|---|---|---|---|---|---|
| Salesforce, Inc. | CRM | NYSE | 10-K | US GAAP | January | Same standard and currency; fiscal year ends ~10 months before Adobe’s. |
| SAP SE | SAP | NYSE (ADR) | 20-F | IFRS | December | IFRS/EUR and ~11 months stale; FY2024 profit depressed by a large restructuring charge — directional only. |
| Intuit Inc. | INTU | Nasdaq | 10-K | US GAAP | July | Same standard and currency; consumer-heavy mix distorts working-capital metrics. |
| Autodesk, Inc. | ADSK | Nasdaq | 10-K | US GAAP | January | Closest fiscal-year alignment (~2 months later); book equity depleted by buybacks. |
Source: Peer-company SEC filings; comparability notes in 5.7 — see Appendix A.1.
5.2 Profitability Comparison
sources Comparative: Most Recent Full Fiscal Year
| Metric | Adobe Inc. | Salesforce, Inc. | SAP SE | Intuit Inc. | Autodesk, Inc. |
|---|---|---|---|---|---|
| Revenue ($M) | $23,769.0M | $37,895.0M | $36,993.0Mᶠ | $18,831.0M | $7,206.0M |
| Gross Margin | 89.3% | 77.2% | 73.0%ᶠ | 79.6% | 91.0% |
| EBITDA Margin | 40.1% | 28.2% | 17.4%ᶠ | 30.4% | 24.6% |
| EBIT Margin | 36.6% | 19.0% | 13.6%ᶠ | 26.1% | 21.9% |
| Net Margin | 30.0% | 16.4% | 9.1%ᶠ | 20.5% | 15.6% |
| FCF Margin | 41.4% | 32.8% | 12.9%ᶠ | 32.3% | 33.4% |
Source: Peer-company SEC filings; comparability notes in 5.7 — see Appendix A.1.
Flag legend: ᶠ = IFRS-translated (directional only); ᵐ = market-sourced; ᶜ = computed from filing components. Peer profitability and return figures below are analyst-computed from filing components per the peer pack; SAP figures (ᶠ) are IFRS-based and EUR-translated at 1.0824.
Peer figures: Salesforce, Inc. (10-K, FY2025), SAP SE (20-F, FY2024), Intuit Inc. (10-K, FY2025), Autodesk, Inc. (10-K, FY2026) — each peer’s most recent completed fiscal year; periods are not aligned (see 5.7).
This table contains the strongest single piece of evidence for the quality of Adobe’s business. On gross margin Adobe is effectively tied with Autodesk, Inc. at the very top of the group, both near ninety percent — unsurprising, because at the gross line a well-run subscription-software business converts almost all revenue to gross profit, so gross margin does not separate these companies. The decisive gap opens below the gross line. On EBIT margin, EBITDA margin, net margin and free-cash-flow margin, Adobe leads every peer outright, and by a wide distance: its operating margin sits well above Intuit Inc., the next-best of the four, and roughly double Salesforce, Inc.’s. That separation is a genuine operating advantage, not an accounting artifact — all five are measured on a broadly similar SaaS cost structure. It reflects the structural economics of the Digital Media franchise: Creative Cloud and Document Cloud carry pricing power and near-zero incremental delivery cost, with none of the heavy services drag that dilutes Salesforce, Inc.’s enterprise-CRM model, none of the on-premise-to-cloud transition burden and large services line that weighs on SAP SE, and greater scale than Autodesk, Inc.’s design-tools franchise. The one caveat sits with SAP: its as-reported EBIT and EBITDA margins are both depressed by IFRS treatment and, more importantly, by a large FY2024 restructuring charge, so its true underlying operating margin is materially higher than the figure shown (see 5.7). Even normalised, however, SAP would not approach Adobe’s operating profitability.
Historical: Adobe Inc. Own 5-Year Progression
| Metric | FY2021 | FY2022 | FY2023 | FY2024 | FY2025 |
|---|---|---|---|---|---|
| Gross Margin | 88.2% | 87.7% | 87.9% | 89.0% | 89.3% |
| EBITDA Margin | 41.7% | 39.5% | 38.8% | 35.3% | 40.1% |
| EBIT Margin | 36.8% | 34.6% | 34.3% | 31.3% | 36.6% |
| Net Margin | 30.5% | 27.0% | 28.0% | 25.9% | 30.0% |
| FCF Margin | 43.6% | 42.0% | 35.8% | 36.6% | 41.4% |
Source: Peer-company SEC filings; comparability notes in 5.7 — see Appendix A.1.
Adobe’s own five-year path confirms the peer read is structural rather than a single-year snapshot. Gross margin has drifted higher as the subscription model matured, and the operating and cash margins that separate Adobe from the group have been sustained across the window — the EBIT margin softened in FY2024, on the elevated spend and one-off costs discussed in Section 3, before recovering in FY2025. The point for benchmarking is that Adobe was already the group’s profitability leader before FY2025 and remains so; the margin advantage is a durable feature of the franchise, not a cyclical high.
5.3 Returns Comparison
sources Comparative: Most Recent Full Fiscal Year
| Metric | Adobe Inc. | Salesforce, Inc. | SAP SE | Intuit Inc. | Autodesk, Inc. |
|---|---|---|---|---|---|
| ROIC | 58.0% | 9.9% | 6.5%ᶠ | 17.3% | 33.7% |
| ROE | 55.4% | 10.1% | 6.9%ᶠ | 19.6% | 36.9% |
| ROA | 23.9% | 6.0% | 4.2%ᶠ | 10.5% | 9.0% |
| Asset Turnover (period-end assets) | 0.81x | 0.37x | 0.46xᶠ | 0.51x | 0.58x |
Source: Peer-company SEC filings; comparability notes in 5.7 — see Appendix A.1.
Historical: Adobe Inc. Own 5-Year Progression
| Metric | FY2021 | FY2022 | FY2023 | FY2024 | FY2025 |
|---|---|---|---|---|---|
| ROIC | 35.1% | 33.3% | 39.4% | 43.0% | 58.0% |
| ROE | 34.4% | 33.0% | 35.5% | 36.3% | 55.4% |
| ROA | 18.7% | 17.5% | 19.1% | 18.5% | 23.9% |
Source: Peer-company SEC filings; comparability notes in 5.7 — see Appendix A.1.
Adobe posts the highest returns in the group on every measure — ROIC of 58.0%, ROE of 55.4%, and ROA of 23.9% — and the ROIC sits many multiples above the 10.58% cost of capital a very wide and firmly positive spread that is the economic core of the franchise. But two denominator caveats must be applied before reading these returns as clean evidence of operating superiority, and both cut in the direction of caution. First, Autodesk, Inc.’s headline ROE and ROIC — the second-highest in the table — are flattered, not earned: years of buybacks have driven Autodesk’s book equity down to an accumulated-deficit position, mechanically inflating any return measured against that shrunken base. On the metrics that are immune to this distortion — ROA and EBIT margin — Autodesk sits mid-pack, which is the honest read of its operating returns. Second, and for consistency the same lens must be turned on Adobe itself: as Section 3 establish, part of Adobe’s own recent step-up in ROIC and ROE is the identical denominator effect — an aggressive buyback shrinking the invested-capital and equity base and measuring the same operating profit against fewer dollars. The correct reading holds both truths at once. Adobe’s underlying returns are genuinely excellent and lead the group on the cleanest operating measures (ROA, asset turnover, margins); but the reported trajectory of ROIC and ROE overstates the pace of operating improvement, and a reader must not mistake buyback arithmetic for an operating breakthrough. SAP’s returns, meanwhile, are depressed by the same restructuring charge that weighs on its margins and should be read as directional only.
5.4 Leverage & Liquidity Comparison
sources Comparative: Most Recent Full Fiscal Year
| Metric | Adobe Inc. | Salesforce, Inc. | SAP SE | Intuit Inc. | Autodesk, Inc. |
|---|---|---|---|---|---|
| Net Debt / EBITDA | 0.1x | 0.0x | -0.3xᶠ | 0.5x | 0.1x |
| Total Debt / Equity | 0.5x | 0.1x | 0.2xᶠ | 0.3x | 0.8x |
| Interest Coverage | 33.1x | 26.5x | 8.5xᶠ | 19.9x | 20.8x |
| Current Ratio | 1.0x | 1.1x | 1.1xᶠ | 1.4x | 0.8x |
| FCF Margin | 41.4% | 32.8% | 12.9%ᶠ | 32.3% | 33.4% |
Source: Peer-company SEC filings; comparability notes in 5.7 — see Appendix A.1.
Leverage does not differentiate this group in any way that matters to credit risk: cash-generative software franchises simply do not need debt, and none of the five carries a balance sheet that constrains it. Adobe runs at roughly 0.1x net-debt-to-EBITDA — effectively unlevered against a single year of cash generation — while Salesforce, Inc. and SAP SE sit in a net-cash position. Adobe’s total-debt-to-equity of 0.5x screens above the two net-cash peers, but Section 3 and the separate valuation make clear this is a deliberate, buyback-funded use of the balance sheet rather than any sign of stress: interest coverage of 33.1x is the highest in the group, and the debt is covenant-light senior paper with no near-term maturity wall. Two liquidity readings need correcting before they mislead. The current ratios clustered near or below 1.0 across the group are not a warning — they reflect large deferred-revenue balances, a non-cash prepaid-subscription liability typical of SaaS; Autodesk, Inc.’s sub-1.0 current ratio is entirely this effect, not a cash shortfall. Intuit Inc.’s higher current ratio, conversely, is grossed up by roughly seven billion dollars of pass-through customer funds that inflate both sides of its balance sheet and are not Intuit’s own capital. And SAP’s debt figure includes IFRS-16 lease liabilities that US-GAAP total debt excludes, so its debt-to-equity is not strictly like-for-like. The net conclusion is straightforward: Adobe has ample financial flexibility, and its modest leverage is a capital-allocation choice, not a capital-structure risk.
5.5 Valuation Multiples Comparison
sources Comparative: Current Price
| Metric | Adobe Inc. | Salesforce, Inc. | SAP SE | Intuit Inc. | Autodesk, Inc. |
|---|---|---|---|---|---|
| EV/EBITDA | 11.5x | 14.4xᵐ | 31.9xᵐᶠ | 15.6xᵐ | 28.4xᵐ |
| P/E | 16.4x | 29.3xᵐ | 61.3xᵐᶠ | 23.3xᵐ | 45.4xᵐ |
| FCF Yield | 9.1% | 8.1% | 2.3%ᶠ | 7.0% | 4.8% |
Source: Peer-company SEC filings; comparability notes in 5.7 — see Appendix A.1.
All peer valuation multiples are market-sourced. Subject to change with price movements.
Historical: Adobe Inc. EV/EBITDA (period-end price)
| FY2021 | FY2022 | FY2023 | FY2024 | FY2025 |
|---|---|---|---|---|
| 48.9x | 23.3x | 36.8x | 30.3x | 14.4x |
Source: Peer-company SEC filings; comparability notes in 5.7 — see Appendix A.1.
[Rating and price target withdrawn — see the note at the top.] Adobe screens at or near the bottom of the peer range on both EV/EBITDA and P/E while simultaneously generating the group’s highest free-cash-flow margins and, on the figures here, a superior free-cash-flow yield. On a naive screen — cheapest multiple, best margins, best returns — that combination looks like a mispricing begging to be bought. The historical context is what dissolves the illusion. [Rating and price target withdrawn — see the note at the top.] That compression is not an accident of the tape; it is the market discounting the terminal-value risk that generative AI poses to the Creative franchise, the central debate of Sections 1, 2 and 4. Adobe is cheap because its growth outlook has been re-underwritten downward — the multiple is the market’s verdict on growth durability, not an oversight. [Rating and price target withdrawn — see the note at the top.]
The peer multiples reinforce rather than undercut this reading, but they must be handled with care. [Rating and price target withdrawn — see the note at the top.]
5.6 Efficiency Comparison
| Metric | Adobe Inc. | Salesforce, Inc. | SAP SE | Intuit Inc. | Autodesk, Inc. |
|---|---|---|---|---|---|
| Days Sales Outstanding | 34 days | 115 days | 72 daysᶠ | 10 days | 73 days |
| Days Inventory Outstanding | - | — | — | — | — |
| Days Payables Outstanding | 56 days | 281 days | 79 daysᶠ | 75 days | 237 days |
| Cash Conversion Cycle | -22 days | -166 days | -6 daysᶠ | -65 days | -164 days |
| CapEx / Revenue | 0.8% | 1.7% | 2.3%ᶠ | 0.7% | 0.6% |
Source: Peer-company SEC filings; comparability notes in 5.7 — see Appendix A.1.
For a group of software businesses, most of this table is presented for completeness rather than signal. Days-inventory, days-payables and the cash-conversion cycle are not economically meaningful here: these companies carry negligible physical inventory, and their payables lines are dominated by accrued expenses against a cost of revenue that is tiny relative to sales, producing erratic figures that should not be read as operating discipline. Days-sales-outstanding is the one working-capital metric worth interpreting, and even it varies by business model rather than by collection quality. Adobe’s DSO of 34 days is comfortably below Salesforce, Inc.’s, whose enterprise annual-billing model pushes receivables out well beyond one hundred days, and below SAP and Autodesk. Intuit Inc.’s strikingly low DSO reflects a heavily consumer, prepaid revenue mix — TurboTax and Credit Karma collect up front — not superior collections against comparable enterprise terms. On capital intensity Adobe is asset-light in the extreme, spending well under one percent of revenue on capex; SAP’s higher ratio partly reflects IFRS development-cost capitalisation rather than genuinely heavier investment.
5.7 Comparability Caveats
sources The comparisons above are only as credible as the caveats attached to them. The following issues are material and are applied — not merely noted — in the commentary above.
Fiscal-period misalignment (all peers). No two columns in this section cover the same twelve months. Adobe’s FY2025 ended 28 November 2025; Salesforce, Inc.’s FY2025 ended 31 January 2025 (~10 months earlier); SAP SE’s FY2024 ended 31 December 2024 (~11 months earlier, and the latest completed year available on its 20-F); Intuit Inc.’s FY2025 ended 31 July 2025 (~4 months earlier); and Autodesk, Inc.’s FY2026 ended 31 January 2026 (~2 months later, the closest alignment of the four). [Rating and price target withdrawn — see the note at the top.] SAP in particular is nearly a full year stale against Adobe; its column should never be read as contemporaneous.
IFRS/EUR reporting (SAP). SAP SE reports under IFRS in euros, while Adobe and the three US peers report under US GAAP in dollars. [Rating and price target withdrawn — see the note at the top.] SAP’s margins, returns and ratios are currency-neutral and taken directly from the euro statements. Note also that SAP’s total debt includes IFRS-16 capitalised operating leases, which US-GAAP total debt excludes, inflating its debt-to-equity relative to the group. Treat all SAP comparisons as directional.
SAP restructuring distortion (SAP). SAP’s FY2024 operating profit is depressed by a large restructuring charge tied to its 2024 transformation program. This mechanically drags down every EBIT- and EBITDA-based metric — operating margin, EBITDA margin, ROIC, interest coverage — and inflates its EV/EBITDA and P/E. SAP’s underlying operating margin ex-restructuring is roughly twenty-two to twenty-three percent, materially above the low-teens figure shown. Because the figures here are as-reported and NOT normalised, SAP’s EV/EBITDA and P/E overstate its expensiveness and its margins understate its profitability; neither multiple is a clean comparable.
Autodesk equity base (ADSK). Autodesk, Inc.’s book equity is artificially small because years of buybacks have driven it into an accumulated-deficit position. This inflates its ROE and ROIC — the second-highest in the group — well above what its operating performance would support. On operating metrics (EBIT margin, ROA) Autodesk sits mid-pack. Its returns are a capital-structure and return-of-capital artifact, not evidence of superior operating economics — the same denominator effect that Section 3 identified for Adobe itself, and it is treated consistently here.
Market-sourced multiples (all peers). Every peer valuation multiple in 5.5 is market-sourced and indicative, pairing current August-2026 market capitalisations with each peer’s most recently completed fiscal year. Because the price is current but the fundamentals are trailing, there is an inherent period mismatch — worst for SAP, whose fiscal year is nearly a year stale and additionally restructuring-distorted. Cross-peer multiple comparisons should be read as directional, not precise.
Working-capital metrics (all peers). Days-inventory, days-payables and the cash-conversion cycle are largely inapplicable across this software group and should not be read as operating signals; DSO is the only meaningful working-capital measure, and even it is driven by billing model. Intuit’s balance sheet is additionally grossed up by roughly seven billion dollars of pass-through customer funds (offsetting receivable and payable), which inflate its total assets and current ratio without representing its own capital and understate its asset turnover. Autodesk’s sub-1.0 current ratio reflects large deferred-revenue balances typical of subscription software, not liquidity stress.
Margin leadership is a genuine finding, not a caveat (all peers). Finally, one point that belongs here to prevent misreading: Adobe’s lead on operating, EBITDA, net and free-cash-flow margins is a real operating advantage, not a comparability artifact. All five companies are measured on GAAP or IFRS operating margins on a broadly similar SaaS cost base; the gap reflects the structural pricing power and low delivery cost of the Digital Media franchise. [Rating and price target withdrawn — see the note at the top.]
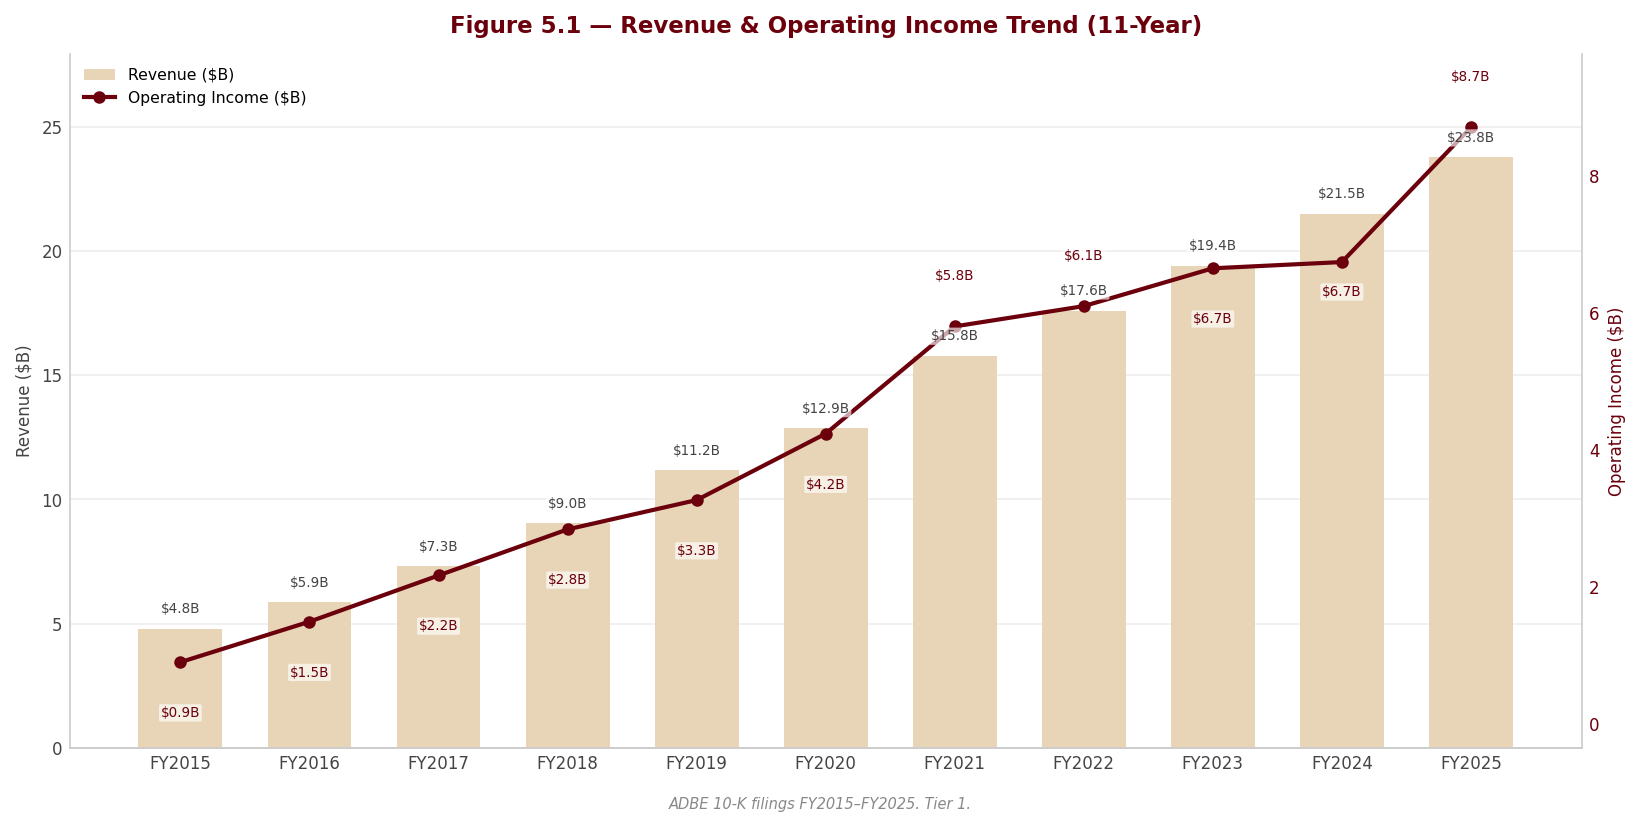
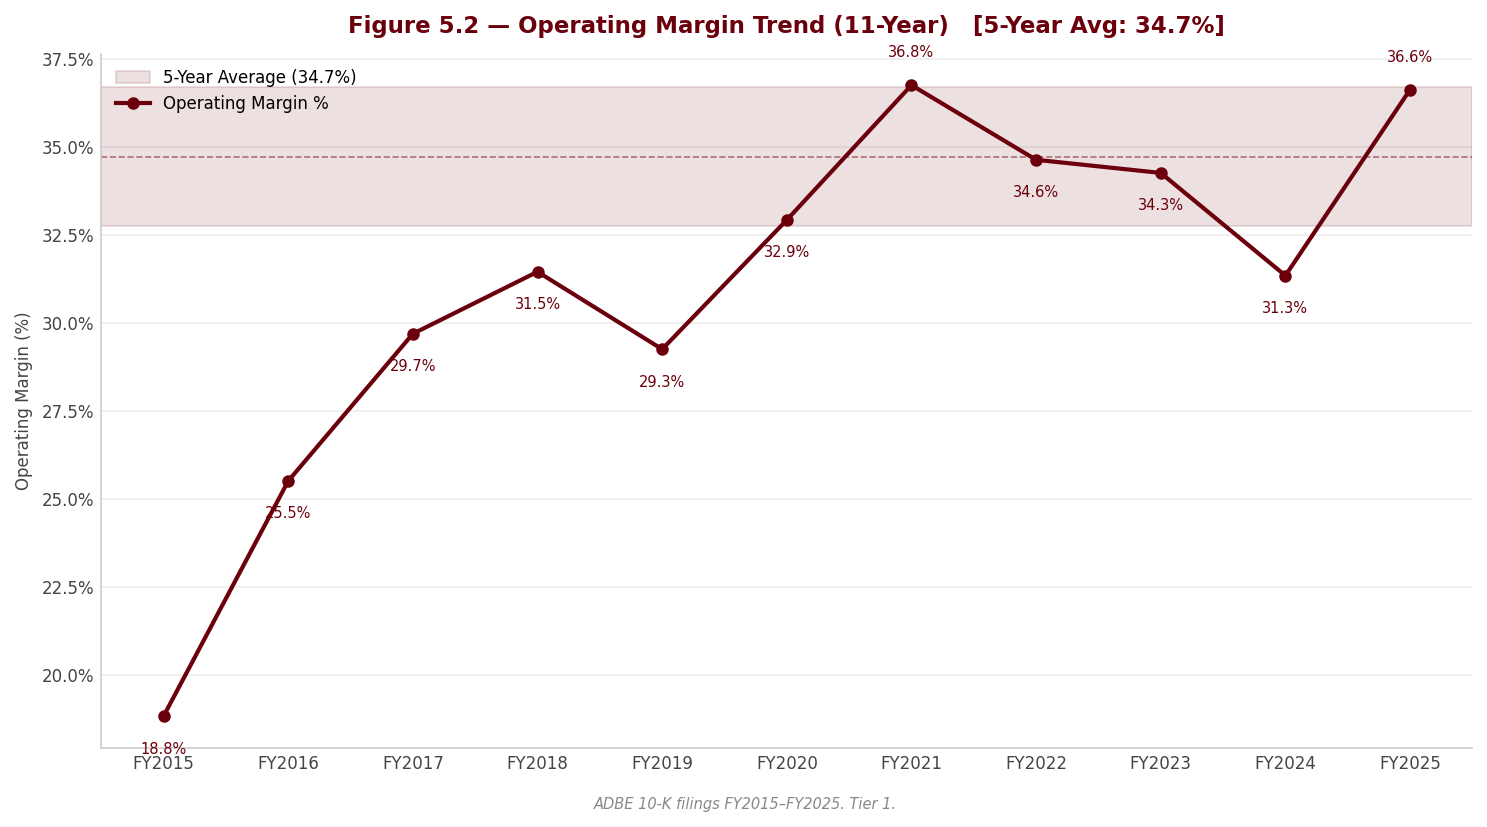
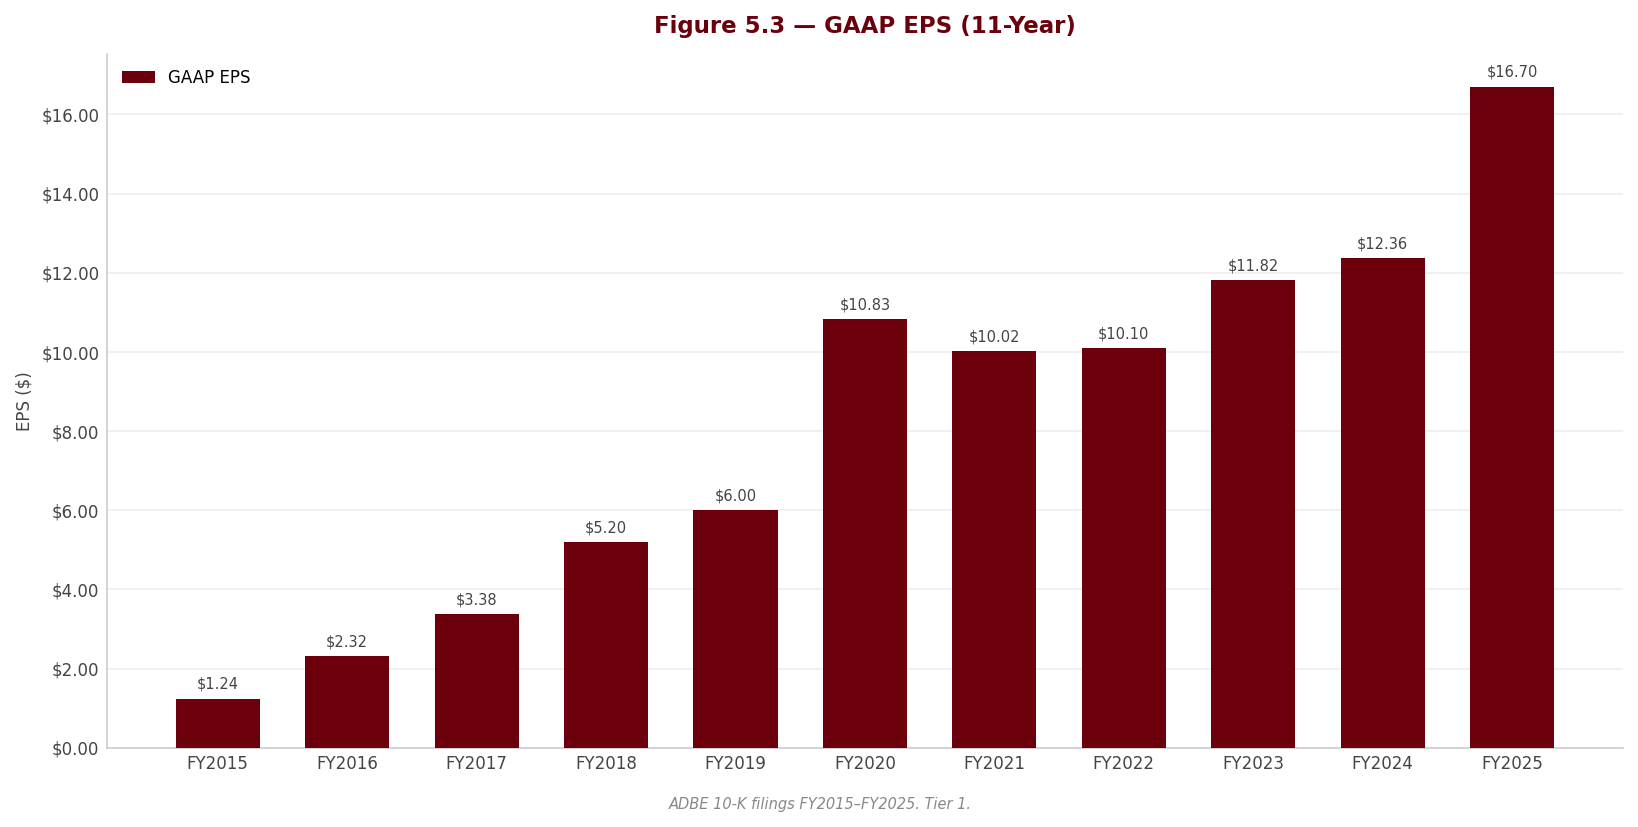
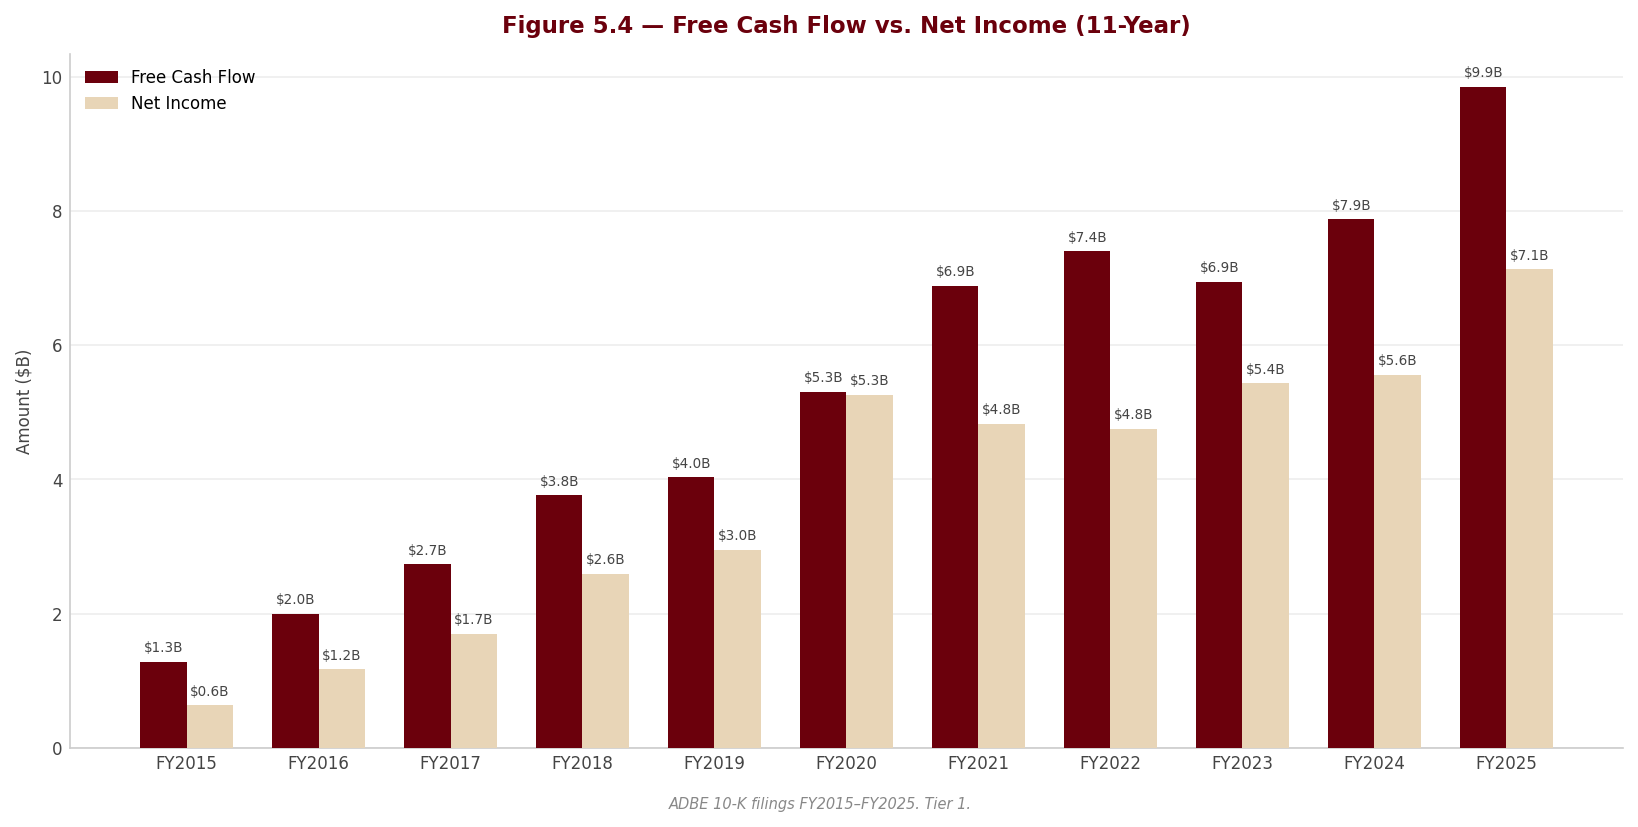
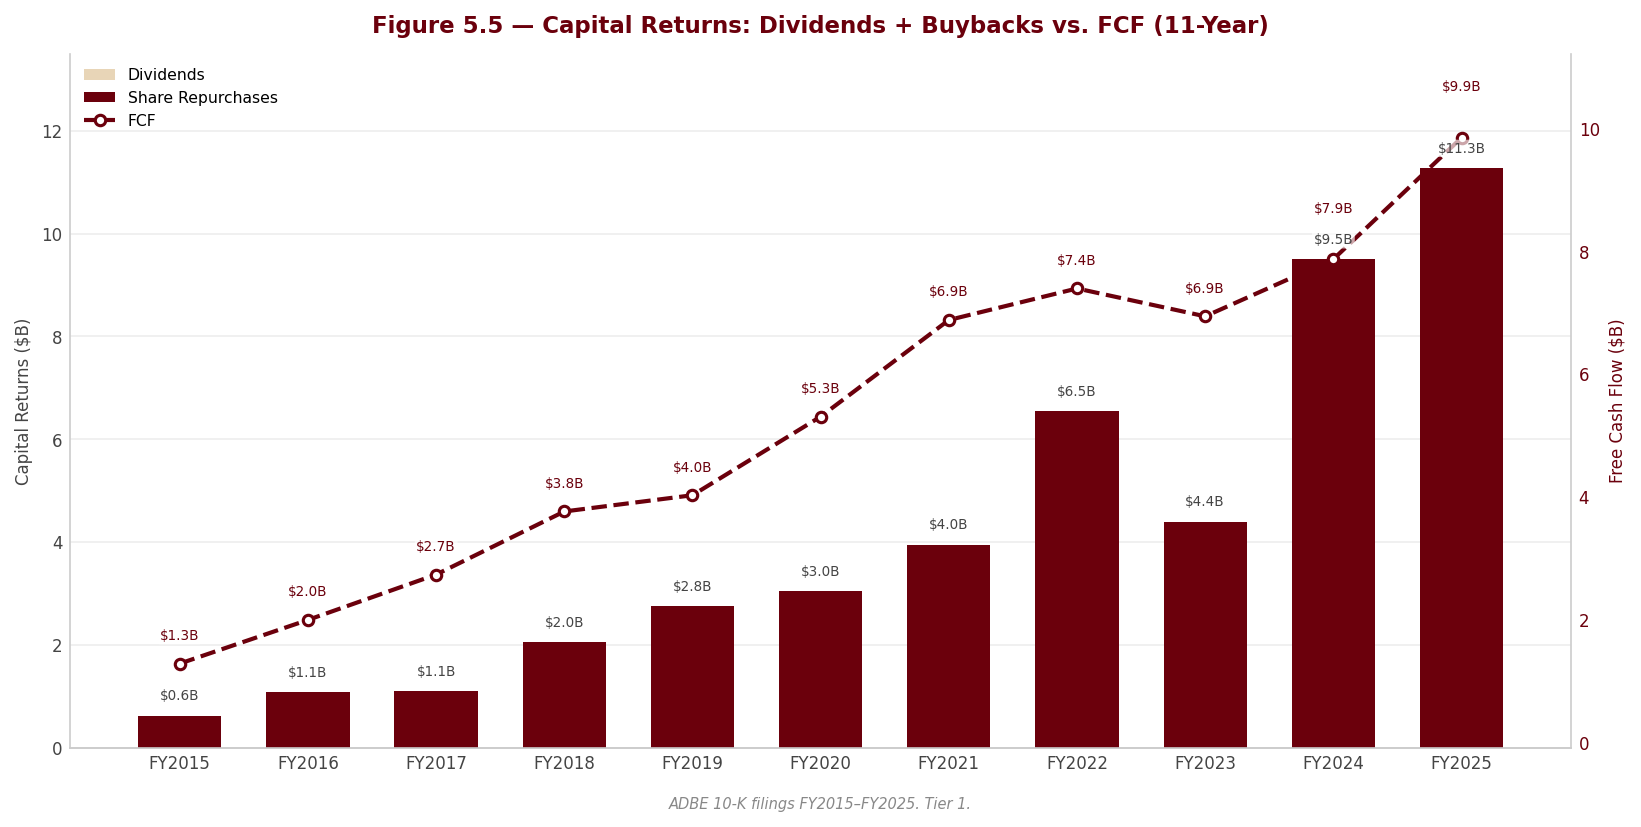
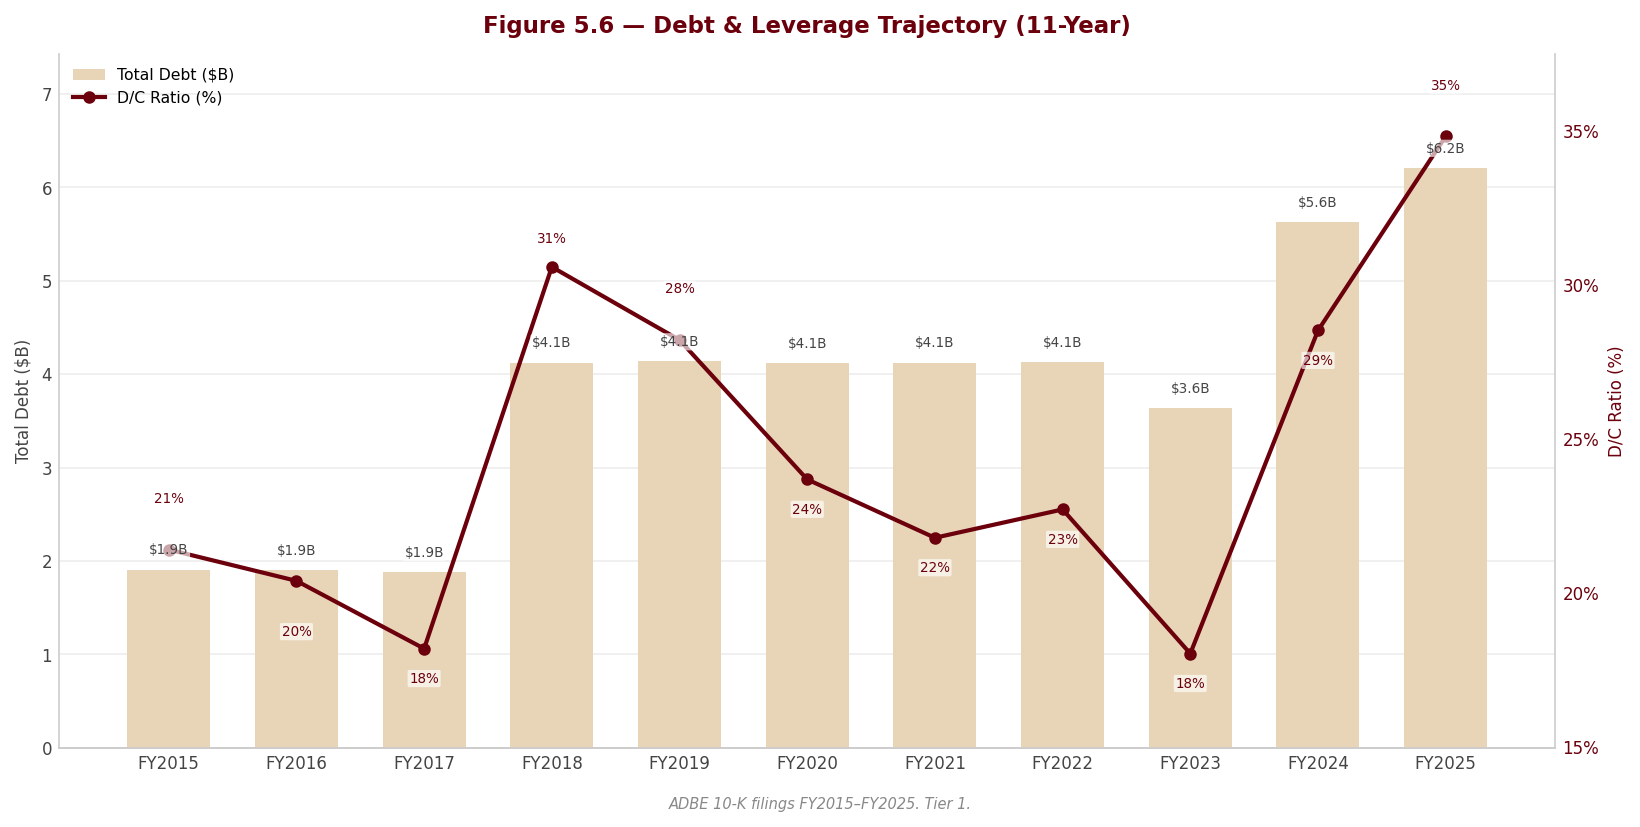
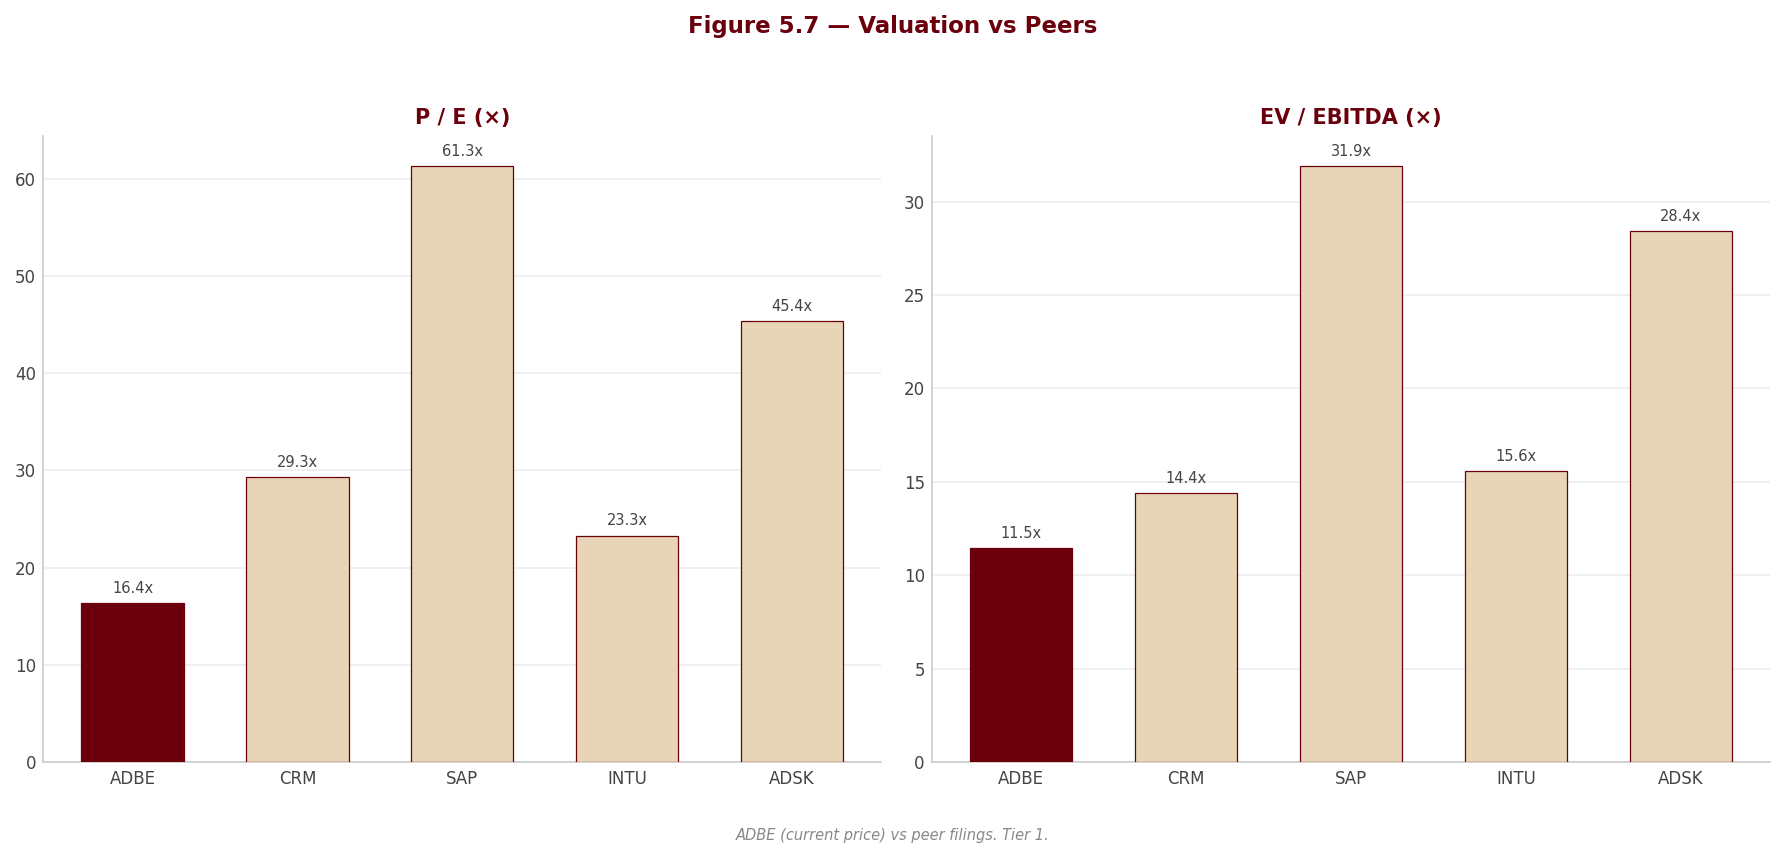
6. Valuation & Price Target withdrawn
This section stated what the shares were worth and what to do about them. It rested on an exit multiple set by hand — across the coverage it averaged 24% below where each company actually traded — so the conclusion largely restated that assumption instead of testing it. Rather than leave it standing, it has been withdrawn while the method is rebuilt.
Nothing else in this report depends on it: the financial analysis above and below is drawn from the company's own filings, and every figure links to the page it was verified against.
Section 7 — Quarterly Update: Q2 2026 (fiscal quarter ended May 29, 2026)
Portfolio Action
sources [Rating and price target withdrawn — see the note at the top.]
| Assessment | |
|---|---|
| Action | [Rating and price target withdrawn — see the note at the top.] |
| Reason | Revenue of $6,618.0M (+12.7% YoY) and remaining performance obligations of $22.27B (+13% YoY, 10-Q p. 29) show no revenue erosion yet, but EBIT margin fell to 33.8% (-2.1 pp YoY) as operating expenses grew 17% against 13% revenue growth (10-Q p. 32) — the franchise is being defended with spend, not yet losing share. |
| Thesis intact? | PARTIALLY — the top line and the forward book hold, but the defence now costs margin (EBIT $2,238.0M, +6.1% YoY vs revenue +12.7%), roughly 2.0 pp of the 12.5% ARR growth was purchased via Semrush, and the single-segment recast removes the disclosure that would have revealed Creative-specific erosion first. |
| Trigger to revisit | [Rating and price target withdrawn — see the note at the top.] |
Source: Adobe Q2 FY2026 Form 10-Q (quarter ended 29 May 2026) and the FL model; see Appendix A.1.
7.1 Results at a Glance
| Metric | Q2 2026 | Q2 2025 | YoY Δ | Q1 2026 | QoQ Δ |
|---|---|---|---|---|---|
| Revenue ($M) | $6,618.0M | $5,873.0M | +12.7% | $6,398.0M | +3.4% |
| Gross Profit ($M) | $5,903.0M | $5,235.0M | +12.8% | $5,734.0M | +2.9% |
| Gross Margin | 89.2% | 89.1% | +0.1 pp | 89.6% | -0.4 pp |
| EBITDA ($M) | $2,431.0M | $2,318.0M | +4.9% | $2,592.0M | -6.2% |
| EBITDA Margin | 36.7% | 39.5% | -2.7 pp | 40.5% | -3.8 pp |
| EBIT ($M) | $2,238.0M | $2,109.0M | +6.1% | $2,418.0M | -7.4% |
| EBIT Margin | 33.8% | 35.9% | -2.1 pp | 37.8% | -4.0 pp |
| Net Income ($M) | $1,712.0M | $1,691.0M | +1.2% | $1,889.0M | -9.4% |
| Net Margin | 25.9% | 28.8% | -2.9 pp | 29.5% | -3.7 pp |
| Diluted EPS | $4.25 | $3.94 | +7.9% | $4.60 | -7.6% |
YoY Δ formula (shown once for this subsection): (CQ - PYSQ) / |PYSQ| × 100 — e.g. Revenue = (6,618 - 5,873) / 5,873 × 100 = +12.7%. QoQ Δ = (CQ - PQ) / |PQ| × 100 — e.g. Revenue = (6,618 - 6,398) / 6,398 × 100 = +3.4%. Margin = line ÷ Revenue × 100 — e.g. Gross Margin CQ = 5,903 / 6,618 × 100 = 89.2%; EBITDA Margin CQ = 2,431 / 6,618 × 100 = 36.7%; EBIT Margin CQ = 2,238 / 6,618 × 100 = 33.8%; Net Margin CQ = 1,712 / 6,618 × 100 = 25.9%. Margin deltas are in percentage points (pp) = CQ margin - comparison margin.
Source: Adobe Inc. Form 10-Q for the quarterly period ended May 29, 2026, Condensed Consolidated Statements of Income (p. 4); Net Income Per Share note (Note 12, p. 21). EBITDA and D&A are analyst-derived standalone-quarter figures (EBIT + D&A), the quarterly D&A being the difference between the six-month cash-flow figure and the prior quarter (10-Q p. 8).
7.2 P&L Drivers
sources Revenue: Total revenue rose $745M (+12.7%) YoY, of which subscription revenue accounted for $775M (+14%) while services and other fell $31M (-22%) as legacy consulting and advertising continued to run off (10-Q p. 29). Growth was broadest in EMEA at +17% to $1,809M versus Americas +11% to $3,872M and APAC +13% to $937M, and a weaker U.S. Dollar added approximately $116M to reported revenue, offset by $22M of net cash-flow-hedge losses — so roughly $94M, or 1.6 pp of the 12.7% YoY growth, was currency rather than volume (10-Q p. 30). Total Adobe ARR reached $27.10B, +12.5% YoY, but approximately $480M of that came from the Semrush acquisition; excluding it, organic ARR grew about 10.5% (10-Q p. 27). [Rating and price target withdrawn — see the note at the top.]
Cost and margin: COGS was $715.0M in Q2 2026 versus $638.0M in Q2 2025 and D&A was $193.0M versus $209.0M, leaving gross margin essentially unchanged at 89.2% (+0.1 pp YoY); within that, cost of subscription revenue rose 16%, with hosting, data-centre and AI inferencing costs alone contributing 16 percentage points of the increase and lower intangible amortisation offsetting 6 points (10-Q p. 31). The margin compression is entirely below the gross line: operating expenses grew 17% to $3,665M against 13% revenue growth, driven by sales and marketing +16% to $1,884M on higher advertising spend and general and administrative +45% to $546M, of which 19 points of the 45% increase was the $70M Publishing & Advertising goodwill impairment and 8 points a legal loss contingency (10-Q pp. 32–33). Stripping the $70M impairment, the $30M loss contingency and $5M of acquisition-related expenses, EBIT would have been $2,343M (35.4% margin) versus $2,482M (38.8%) on the same basis in Q1 2026 — so the -4.0 pp sequential margin move is roughly one-third one-off items and two-thirds a genuine step-up in sales, marketing and R&D spend, with Semrush consolidated for only one month of the quarter (10-Q pp. 12, 25).
[Rating and price target withdrawn — see the note at the top.] Diluted EPS of $4.25 rose $0.31 (+7.9%) YoY and fell $0.35 (-7.6%) QoQ; with net income up only 1.2%, essentially all of the YoY EPS growth came from the 6.2% reduction in the diluted share count to 402.5 million from 428.9 million (10-Q p. 21).
7.3 Balance Sheet & Cash Flow
| Metric | Q2 2026 | Q2 2025 | YoY Δ | Q1 2026 | QoQ Δ |
|---|---|---|---|---|---|
| Cash ($M) | $4,919.0M | $4,931.0M | -0.2% | $6,332.0M | -22.3% |
| Net Debt ($M) | $1,726.0M | $1,235.0M | +39.8% | -$104.0M | +1,759.6%ᵃ |
| Net Debt / LTM EBITDA | 0.18× | — | — | — | — |
| Total Assets ($M) | $29,933.0M | $28,107.0M | +6.5% | $29,704.0M | +0.8% |
| Equity ($M) | $11,518.0M | $11,448.0M | +0.6% | $11,433.0M | +0.7% |
| OCF ($M) | $2,165.0M | $2,191.0M | -1.2% | $2,958.0M | -26.8% |
| CapEx ($M) | $58.0M | $47.0M | +23.4% | $37.0M | +56.8% |
| FCF ($M) | $2,107.0M | $2,144.0M | -1.7% | $2,921.0M | -27.9% |
| Dividends Paid ($M) | $0.0M | $0.0M | —ᵇ | $0.0M | —ᵇ |
Net Debt / LTM EBITDA: LTM EBITDA = Q3 2025 $2,381M + Q4 2025 $2,445M + Q1 2026 $2,592.0M + Q2 2026 $2,431.0M = $9,849M. Net Debt CQ $1,726.0M ÷ $9,849M = 0.18×. Net Debt is defined here as short-term debt plus long-term debt less cash and cash equivalents ($1,843M + $4,802M - $4,919M), and therefore excludes the $707M of short-term investments the company also holds (10-Q p. 3). YoY Δ and QoQ Δ use the same formulas shown in 7.1 — e.g. Cash QoQ = (4,919 - 6,332) / 6,332 × 100 = -22.3%; OCF YoY = (2,165 - 2,191) / 2,191 × 100 = -1.2%.
ᵃ The QoQ percentage is arithmetically correct but not economically meaningful: Q1 2026 net debt was a near-zero net-cash position of -$104.0M, so a small absolute swing produces a very large percentage. The absolute move is the informative figure — net debt rose $1,830M sequentially.
ᵇ Adobe pays no dividend; the cash flow statement contains no dividend line for either period (10-Q p. 8), so a percentage change on a zero base cannot be computed.
Source: Adobe Inc. Form 10-Q for the quarterly period ended May 29, 2026, Condensed Consolidated Balance Sheets (p. 3) and Condensed Consolidated Statements of Cash Flows (p. 8); Debt note (Note 14, pp. 23–24). Quarterly cash-flow figures are analyst-derived by differencing the six-month statement against the prior quarter, because the 10-Q presents cash flows on a year-to-date basis only.
[Rating and price target withdrawn — see the note at the top.] It nonetheless swung reported working capital to -$3,010M from -$37M at year-end (10-Q p. 35), and cash fell from $6,332.0M to $4,919.0M as $1,560M was paid for Semrush net of cash acquired and $2,130M of stock was repurchased; goodwill rose to $14,041M from $12,857M at the FY2025 year-end on $1,251M of Semrush goodwill less the $70M impairment (10-Q pp. 8, 12, 17).
Cash flow note: FCF conversion = FCF ÷ Net Income = 2,107 ÷ 1,712 × 100 = 123.1%, so cash generation continued to run well ahead of accounting earnings, with the $536M stock-based compensation add-back and rising deferred revenue the main reconciling items (10-Q pp. 8, 19). OCF was nonetheless down 26.8% sequentially from the seasonally strong Q1 2026, and on a year-to-date basis the six-month figures — OCF $5,123M versus $4,673M and CapEx $95M versus $73M — show underlying cash generation up 10% YoY, so the quarterly decline is timing of billings and collections rather than deterioration (10-Q pp. 8, 29).
7.4 Footnote Review
sources Note 1 — Basis of Presentation and Summary of Significant Accounting Policies (10-Q p. 9) Adobe states there have been no material changes to its significant accounting policies versus the FY2025 Annual Report, and that all adjustments are normal and recurring. Three pronouncements are disclosed as not yet effective: ASU 2023-09 on income tax disaggregation (effective for the FY2026 annual report), ASU 2024-03 on expense disaggregation (FY2028 annual, FY2029 interim) and ASU 2025-06 on internal-use software (FY2029). This note has changed versus Q2 2025 — ASU 2025-06 was only issued in September 2025 and is new to the disclosure — but none of the three affects recognition or measurement in the current period; the practical implication is that ASU 2024-03 will eventually force the expense-line disaggregation that the segment recast has just removed.
Note 2 — Revenue (10-Q pp. 10–11) Revenue is disaggregated by geography (Americas $3,872M, EMEA $1,809M, APAC $937M) and by customer group subscription revenue (Creative & Marketing Professionals $4,537M, Business Professionals & Consumers $1,853M, other subscription $26M). Contract balances: trade receivables $1.99B including $89M unbilled, versus $2.34B including $74M at 28 November 2025; contract assets $178M versus $241M; deferred revenue $7.25B including $99M of refundable customer deposits, versus $7.03B; capitalised contract acquisition costs $782M versus $721M; refund liabilities $122M versus $137M. Remaining performance obligations were approximately $22.27B, of which approximately 67% is expected to be recognised within twelve months. The recognition policy itself is unchanged, and the RPO disclosure convention is unchanged versus the prior-year presentation; the analytically important point is that the forward book grew 13% YoY (10-Q p. 29), slightly faster than reported revenue, which argues against imminent demand erosion.
Note 3 — Acquisitions (10-Q p. 12) Adobe completed the acquisition of Semrush Holdings on 28 April 2026 for $1,874M, primarily cash. The preliminary allocation is $582M of identifiable intangibles (purchased technology $415M / 7 years, customer contracts $107M / 11 years, trademarks $60M / 7 years), $262M of acquired cash, $221M of net liabilities assumed and $1,251M of goodwill, non-deductible for tax. This note is new versus Q2 2025, when there was no comparable acquisition. [Rating and price target withdrawn — see the note at the top.]
Note 4 — Cash, Cash Equivalents and Short-Term Investments (10-Q pp. 12–13) Total cash, cash equivalents and short-term investments were $5,626M versus $6,595M at 28 November 2025, a reduction of just under $1B. Holdings are money market funds $3,252M, corporate debt securities $806M in cash equivalents and $606M in short-term investments, time deposits $95M, U.S. Treasuries $101M and cash $766M; unrealised gains and losses were nil in both periods and all short-term securities mature within one year. No allowance for credit-related losses was recognised in either the current or prior-year six-month period. The portfolio composition and risk profile are unchanged; the balance decline is the funding of Semrush and buybacks, not a change in investment policy.
Note 5 — Fair Value Measurements (10-Q pp. 14–16) Recurring fair-value assets were $5,360M ($3,732M Level 1, $1,628M Level 2) versus $6,404M at 28 November 2025, and liabilities $110M versus $108M, all Level 2. There are no Level 3 recurring assets or liabilities in either period — a genuine absence of mark-to-model exposure, confirmed against both balance-sheet dates in this filing. [Rating and price target withdrawn — see the note at the top.] No analytical concern.
Note 6 — Derivative Financial Instruments (10-Q pp. 16–17) [Rating and price target withdrawn — see the note at the top.] Total derivative assets were $115M and liabilities $110M, versus $178M and $108M at year-end. Adobe recognised $54M of net unrealised gains on FX contracts in the quarter, against $281M of net losses in Q2 2025 — a sharp swing driven by the weaker Dollar — and $26M of net hedge losses are expected to be recognised into revenue over the next twelve months. The programme’s structure is unchanged; the $26M pending revenue drag is small relative to the $116M gross FX tailwind this quarter.
Note 7 — Goodwill and Other Intangibles (10-Q pp. 17–18) Goodwill rose to $14.04B from $12.86B at 28 November 2025, being $1,251M from Semrush less a $70M impairment charge on the Publishing & Advertising reporting unit, recorded in general and administrative expenses. Other intangibles, net rose to $1,012M from $495M; amortisation of intangibles was $50M in the quarter versus $83M in Q2 2025, of which $12M versus $42M sat in cost of revenue. Future amortisation is $131M for the remainder of FY2026 and $208M in FY2027. This is the analytically significant change in the filing: the impairment is a written acknowledgement that a legacy Adobe reporting unit’s cash flows no longer support its carrying value. The amount is immaterial to earnings — 3.1% of quarterly EBIT — but the direction matters for a thesis about franchise durability, and it is the residual disclosure that survived the segment consolidation.
Note 8 — Accrued Expenses and Other Current Liabilities (10-Q p. 18) Accrued expenses fell to $2,455M from $2,648M at 28 November 2025. The moving parts are accrued compensation $1,223M versus $1,345M, excise taxes payable $41M versus $105M, derivative collateral liabilities $33M versus $101M, accrued corporate marketing $222M versus $197M and other $568M versus $511M. No new liability category appears. [Rating and price target withdrawn — see the note at the top.]
Note 9 — Stock-Based Compensation (10-Q pp. 18–19) Total stock-based compensation was $536M in the quarter versus $481M in Q2 2025 (+11.4%), of which $277M sat in R&D. Unrecognised compensation cost was $4.21B over a 2.55-year weighted average. Restricted stock units outstanding rose to 12.8 million from 7.9 million at the start of the year, with 7.0 million awarded at a $293.34 weighted average grant-date fair value against a $436.52 opening average, and 0.4 million added via the acquisition. This is a real change versus the prior year and it matters: because the share price is lower, the $293.34 grant-date value against a $436.52 opening average means Adobe must issue roughly 49% more units to deliver the same dollar of compensation, which raises the future share count that the buyback must absorb. SBC at 8.1% of revenue is also the largest single non-cash item flattering the 123.1% FCF conversion.
Note 10 — Accumulated Other Comprehensive Income (Loss) (10-Q p. 20) AOCI moved to -$247M from -$245M at 28 November 2025, comprising -$41M of net unrealised hedge losses (from -$45M) and -$206M of cumulative translation adjustment (from -$200M). Taxes on each component were immaterial in both the three- and six-month periods. Read and confirmed as immaterial to the thesis: the $2M net movement is noise.
Note 11 — Stock Repurchase Program (10-Q p. 20) The Board granted an additional $25B authorisation in April 2026 through 30 April 2030, on top of the March 2024 $25B authorisation running to March 2028; $26.78B remained available at 29 May 2026. Six-month open-market repurchases were 16.6 million shares for $4,588M, versus 15.6 million shares for $6,750M in the prior-year six months (of which $6,250M was via accelerated share repurchase agreements). The Part II Item 2 table shows 8.5 million shares repurchased during the quarter at average prices of $260.24, $241.27 and $245.90 across the three monthly windows (10-Q p. 50). The change versus prior year is one of method and price, not commitment: Adobe has stopped using ASRs and is buying more shares for less money because the stock is lower. This directly underwrites the per-share arithmetic flagged in Section 3 — EPS is growing at 7.9% while net income grows at 1.2%.
Note 12 — Net Income Per Share (10-Q p. 21) Diluted shares were 402.5 million versus 428.9 million in Q2 2025, a 6.2% reduction; basic 402.4 million versus 428.2 million. Dilutive potential shares collapsed to 0.1 million from 0.7 million, and anti-dilutive potential shares rose to 12.1 million from 6.4 million. The change versus prior year is material and under-appreciated: at the current share price almost the entire equity-award overhang is out of the money and therefore excluded from diluted EPS, so reported diluted EPS understates the dilution that would appear if the share price recovered.
Note 13 — Commitments and Contingencies (10-Q pp. 21–23) Indemnification obligations to customers, officers and directors are described as historically insignificant and, for officers and directors, unlimited in theory but insured; this language is unchanged. Legal proceedings — accrued provisions for probable and estimable legal liabilities were “not material” at 29 May 2026. Full treatment of each open matter is in the dedicated entry below.
Note 14 — Debt (10-Q pp. 23–24) Senior notes outstanding at par were $6,150M, identical to 28 November 2025 across all eight tranches (2.15% 2027 $850M, 4.85% 2027 $500M, 4.75% 2028 $800M, 4.80% 2029 $750M, 4.95% 2030 $700M, 2.30% 2030 $1,300M, 4.95% 2034 $750M, 5.30% 2035 $500M). The change is classification: $1,350M of par ($1,349M carrying) moved to current as the two 2027 maturities came inside twelve months, leaving $4,802M long-term against $6,210M at year-end. [Rating and price target withdrawn — see the note at the top.] Covenants: the note states explicitly that the senior notes “do not contain any financial covenants”; the February 2020 notes carry only a lien and sale-leaseback limitation and a 101% change-of-control repurchase right. No financial covenant level or actual ratio is disclosed anywhere in this 10-Q, so none can be reported; the risk-factor section refers generically to covenant compliance under the notes, commercial paper programme and revolver (10-Q p. 49) without stating a test or a level. Management intends to refinance the current portion on or before its due date, subject to market conditions (10-Q p. 36). [Rating and price target withdrawn — see the note at the top.]
Note 15 — Segment Information (10-Q p. 25) Effective Q1 2026 Adobe combined its former Digital Media, Digital Experience and Publishing and Advertising segments into a single operating and reportable segment, and prior periods have been recast; the CEO as chief operating decision maker now reviews consolidated results only, and segment assets equal consolidated total assets. The note discloses significant segment expenses for the quarter: cost of revenue $669M, R&D $911M, sales and marketing $1,729M, G&A $364M, stock-based and deferred compensation $556M, goodwill impairment $70M, amortisation of purchased intangibles $46M, loss contingency $30M and acquisition-related expenses $5M, plus interest income of $56M (unchanged versus $56M in Q2 2025). This is the single most consequential disclosure change in the filing and it is a permanent analytical loss, not a technicality: the Digital Media versus Digital Experience revenue and operating-income series that let an outside analyst test whether the Creative franchise specifically was slowing has ended here. What remains is a two-way customer-group subscription revenue split with no profitability attached and a three-region geographic split. Any future erosion in the core Creative business will now be visible only after it is large enough to move a $6.6B consolidated top line.
Related-party transactions (10-Q pp. 9–25, Notes 1–15) Adobe has no controlling shareholder and no related-party transactions note. Every note in the filing (Notes 1 through 15, pp. 9–25) was read in this session and none discloses a transaction with a controlling entity, affiliate, director or officer other than ordinary-course compensation. There are no equity-method investments and no non-controlling interests — the balance sheet carries no minority-interest line and total stockholders’ equity of $11,518M reconciles entirely to Adobe common stockholders (10-Q pp. 3, 6). The only balances of a related-party character are the deferred compensation plan assets of $385M (versus $342M at 28 November 2025), held for employees and measured at Level 1 fair value (10-Q pp. 14–15), and the officer and director indemnification agreements described in Note 13 (10-Q p. 21), which are unchanged in scope and carry no recognised liability. There is therefore no related-party amount to compare between Q2 2026 and Q2 2025, and no terms that could have changed.
Contingencies and litigation (10-Q pp. 21–23) There are four matters, and one of them changed materially this quarter. - FTC / DOJ ROSCA action (settled). The DOJ filed a civil complaint in the Northern District of California on 17 June 2024 alleging Adobe failed to clearly disclose material subscription terms, obtain express informed consent and provide a simple cancellation mechanism, seeking injunctive relief and civil penalties. Adobe’s motion to dismiss was denied on 2 May 2025 and discovery followed. On 12 March 2026 Adobe reached an agreement to settle, and filed a stipulation of dismissal on 13 March 2026 (10-Q p. 22). No settlement amount is disclosed. The related expense is visible in the segment note as a loss contingency of $30M in Q2 2026 and $92M for the six months, described as “associated with a legal settlement and other legal matters” (10-Q pp. 25, 33), so the settlement is accrued and expensed rather than unquantified — a change from the prior position, in which no loss was estimable. This removes a four-year regulatory overhang on Adobe’s subscription-cancellation practices and is the clearest positive in the footnotes. - In Re Adobe Inc. Securities Litigation (S.D.N.Y.). Class action on behalf of purchasers between 23 July 2021 and 22 September 2022 alleging misleading statements about competition from Figma. Adobe’s motion to dismiss was granted in full on 27 March 2025 and leave to amend was denied on 7 November 2025; plaintiff is appealing (10-Q p. 22). Unchanged this quarter; no amount at stake is stated and Adobe is unable to estimate a reasonably possible loss. - Consolidated Derivative Actions (Shah, Gervat, Sbriglio, Roy, Daniel). Five shareholder derivative suits on substantially the same facts as the Securities Action; the Sbriglio and Daniel actions were consolidated on 11 July 2025 and plaintiffs filed an amended complaint on 16 March 2026 — the one procedural development inside the quarter. All Derivative Actions are presently stayed. Damages are unspecified and Adobe cannot estimate a reasonably possible loss (10-Q pp. 22–23). - Third-party intellectual property disputes. Described generically as ongoing and potentially costly, with no specific matter or amount identified (10-Q p. 23). Unchanged in substance from the prior-year language. Aggregate accrued legal provisions are stated as “not material” at 29 May 2026 (10-Q p. 22). Against $2,238M of quarterly EBIT, none of the surviving matters is sized to threaten the thesis; the settled ROSCA action was the only one with a defined regulatory remedy attached.
Subsequent events (10-Q p. 50, and Notes 1–15, pp. 9–25) No subsequent-events note is presented in this filing — the notes run from Note 1 to Note 15 and none addresses post-balance-sheet events — and Part II Item 5, Other Information, states “None” (10-Q p. 50). The only post-quarter fact disclosed anywhere in the document is on the cover page: 397.5 million shares were issued and outstanding as of 11 June 2026, against 399 million at the 29 May 2026 balance sheet date (10-Q pp. 1, 3), indicating repurchases continued after quarter end at roughly the same pace.
7.5 What Changed This Quarter
sources - The segment disclosure that would first reveal AI erosion is gone. Effective Q1 2026 the three former segments were merged into one reportable segment with prior periods recast (10-Q p. 25). The Digital Media revenue and operating-income series ends here; what remains is a customer-group subscription revenue split ($4,537M Creative & Marketing Professionals, $1,853M Business Professionals & Consumers) with no margin attached. For a thesis whose central question is whether generative AI erodes the Creative franchise specifically, this removes the primary evidentiary instrument — the burden of proof now shifts almost entirely to ARR and RPO.
-
Margin, not revenue, is where this quarter deteriorated. Revenue grew 12.7% and gross margin held at 89.2%, but operating expenses grew 17% to $3,665M and EBIT margin fell 2.1 pp YoY to 33.8% and 4.0 pp sequentially (10-Q p. 32). Adjusting both quarters for one-off items, EBIT was $2,343M this quarter versus $2,482M in Q1 2026, so roughly two-thirds of the sequential decline is recurring spend — chiefly sales and marketing advertising — not accounting noise. This is what “defending the franchise costs money” looks like in the numbers before it looks like anything in revenue.
-
AI is showing up as a cost line before it shows up as a defence. Hosting, data-centre and AI inferencing costs contributed 16 of the 16 percentage points by which cost of subscription revenue rose YoY (10-Q p. 31), and R&D rose 11% to $1,198M. Gross margin absorbed it this quarter only because intangible amortisation rolled off (-6 points); that offset is finite, with remaining FY2026 amortisation of just $131M (10-Q p. 18).
-
Nearly 2 points of ARR growth were bought. Semrush closed 28 April 2026 for $1,874M and contributed approximately $480M of the $27.10B total ARR (10-Q pp. 12, 27). Organic ARR growth was therefore about 10.5%, not the headline 12.5% — still healthy, but a materially different number for a franchise-durability thesis, and it cost $1,251M of new, non-tax-deductible goodwill.
-
A goodwill impairment on the legacy Publishing & Advertising unit. A $70M charge was taken (10-Q p. 17), equal to 3.1% of quarterly EBIT. Immaterial to earnings, but it is a quantified admission that a legacy unit’s forecast cash flows have fallen below carrying value, and it drove 19 of the 45 percentage points by which G&A rose.
-
The ROSCA regulatory overhang was settled. Adobe agreed to settle the DOJ/FTC subscription-cancellation action on 12 March 2026 and filed a stipulation of dismissal the following day (10-Q p. 22); the associated loss contingency was $30M in the quarter and $92M year-to-date (10-Q p. 25). [Rating and price target withdrawn — see the note at the top.]
-
Per-share metrics are being carried by the denominator. Net income rose 1.2% to $1,712.0M while diluted EPS rose 7.9% to $4.25, because diluted shares fell 6.2% to 402.5 million (10-Q p. 21). Adobe repurchased $2,130M of stock in the quarter (10-Q p. 6) and holds $26.78B of remaining authorisation (10-Q p. 20). Simultaneously, RSUs outstanding rose to 12.8 million from 7.9 million at the start of the year (10-Q p. 18) because a lower share price requires more units per dollar of compensation — the buyback is now running against a growing, not shrinking, issuance requirement.
-
Debt moved to current; leverage did not move. Short-term debt rose to $1,843M from zero at FY2025 year-end, being $1,349M of 2027 senior notes reclassified as their maturities came inside twelve months plus $494M of commercial paper; total senior notes at par were unchanged at $6,150M and the $1.5B revolver is undrawn (10-Q pp. 3, 23–24). Net debt of $1,726.0M is 0.18× LTM EBITDA. This is a refinancing calendar item, not a liquidity event, and the filing says so explicitly (10-Q p. 36).
-
The forward book still grows faster than revenue. Remaining performance obligations reached $22.27B, +13% YoY, with approximately 67% expected to convert within twelve months (10-Q pp. 11, 29). This is the strongest single piece of counter-evidence to the AI-erosion case in the filing, and it is why this quarter reads as margin pressure rather than demand loss.
7.6 Portfolio Decision
sources [Rating and price target withdrawn — see the note at the top.] This quarter produced no evidence that customers are leaving: revenue of $6,618.0M grew 12.7% YoY, gross margin held at 89.2%, and remaining performance obligations of $22.27B grew 13% — a forward book expanding slightly faster than reported revenue is not the signature of a franchise being displaced. It equally produced no evidence that the AI question is settled in Adobe’s favour: EBIT margin fell 2.1 pp YoY to 33.8% because operating expenses grew 17% against 13% revenue growth, organic ARR growth was approximately 10.5% once the $480M Semrush contribution is stripped out, and the $70M Publishing & Advertising goodwill impairment is the first quantified concession that a legacy unit’s cash flows have deteriorated. The footnote review adds two things the income statement does not show. First, the ROSCA settlement (10-Q p. 22) closes a four-year regulatory threat to Adobe’s cancellation and retention mechanics for a disclosed loss contingency of $30M in the quarter — a genuine, if modest, de-risking. Second, and pulling the other way, the collapse to a single reportable segment (10-Q p. 25) permanently removes the Digital Media disclosure that would have been the earliest warning of Creative-specific erosion; an investor holding this position for a franchise-durability reason now has materially less instrumentation than last quarter, which is itself a reason not to add. Net income growth of 1.2% versus EPS growth of 7.9% confirms the Section 3 observation that per-share results are being carried by a 6.2% smaller share count rather than by profit growth. The thesis is intact but thinner: it holds on the top line and the balance sheet — leverage is 0.18× LTM EBITDA and FCF conversion 123.1% — and weakens on margin, organic growth quality and transparency.
What would change this view: - Upgrade condition: organic ARR growth (excluding acquisition contribution) re-accelerating above 13% while EBIT margin is held at or above 36%, demonstrating that the elevated sales, marketing and AI-inferencing spend is buying durable growth rather than defending a shrinking base. - Downgrade condition: two consecutive quarters of organic ARR growth below 10%, or EBIT margin below 32%, or a goodwill impairment taken against a core creative or experience asset rather than the legacy Publishing & Advertising unit — any of which would convert “defending the franchise costs money” into “the franchise is eroding”.
Report Versions
Every published version of this report, newest first — each one kept so a reader can see what changed and when.
| Version date | Files |
|---|---|
| 2026-08-20 Current | Model (Excel) |
| 2026-08-10-2 | Model (Excel) |
| 2026-08-10 | Model (Excel) |
| 2026-08-05 | Model (Excel) |