
Apple Inc.
Section 1 — Business Overview, Operations & Competitive Positioning
sources
1.1 The Business
sources Apple designs a tightly integrated system of hardware, software and services and monetises it twice — once when it sells a device, and then continuously thereafter through a high-margin services layer that runs on the installed base those devices create. §
The company designs, manufactures and markets smartphones, personal computers, tablets, wearables and accessories, and sells a broad range of related digital services on top of them. Hardware is the entry point: the iPhone smartphone family running iOS, the Mac line of laptops and desktops on macOS, the iPad tablet range on iPadOS, and a Wearables, Home and Accessories category that spans Apple Watch, AirPods and Beats headphones, the Apple Vision Pro spatial computer, Apple TV, HomePod and branded accessories. The services layer — the App Store, advertising, AppleCare, iCloud, the subscription content businesses (Apple Music, Apple TV, Apple Arcade, Apple Fitness+, Apple News+), and payments through Apple Card and Apple Pay — converts each device sale into a recurring, far higher-margin revenue stream. Apple sells directly through its own retail and online stores and sales force, and indirectly through carriers and resellers, to consumer, business, education, enterprise and government customers worldwide; the fiscal year ends on the last Saturday of September. FY2025 revenue reached $416,161.0M, a record, and the company trades on Nasdaq under the ticker AAPL. Apple does not compete on volume — it holds only a minority unit share in every hardware category it serves — but on the profitability that comes from controlling the entire stack and commanding premium pricing across a very large, loyal installed base. Its workforce is a large, predominantly full-time global employee base that management frames as central to its execution advantage; the company positions competitive compensation, equity participation and internal development programmes as core to attracting and retaining engineering and design talent.
Key Information
| Item | Value |
|---|---|
| Ticker | AAPL |
| Sector / Industry | Technology |
| Report Date | 2026-08-19 |
| Most Recent FY Revenue | $416,161.0M |
| EBIT Margin (Most Recent FY) | 32.0% |
| Diluted Shares Outstanding | 15,005M |
| Current Price | $310.03 |
Source: Company SEC filings (10-K); see Appendix A.1.
1.2 Operating Segments
sources Apple reports its results on a geographic basis — Americas, Europe, Greater China, Japan and Rest of Asia Pacific — but the economically meaningful units are the five product-and-service lines that management discusses within MD&A. Each is driven by a single dominant variable.
iPhone is the anchor and the largest single revenue source. Its economic driver is smartphone unit demand weighted by mix — the shift toward higher-priced Pro models is what moves the line more than raw units. This is also the company’s central concentration: management itself warns that a significant portion of net sales comes from one product category, so iPhone demand is effectively the demand curve for the whole enterprise.
Mac is driven by the personal-computer refresh cycle and, more recently, by the migration to Apple’s own silicon, which resets the upgrade clock across the installed base. iPad is likewise a refresh-and-mix business, with demand rotating between the mainstream Air/mini/entry models and the premium Pro tier. [Rating and price target withdrawn — see the note at the top.]
Services is the profit engine and the strategically decisive segment. Its driver is not units but monetisation of the installed base — services revenue is, in effect, the installed base multiplied by revenue per device across the App Store, advertising, cloud storage, AppleCare, payments and content subscriptions. It carries a gross margin roughly double that of hardware and has been the primary source of consolidated margin expansion. It is also the segment carrying the most concentrated legal risk. A material and rising slice of Services economics is contingent on outcomes Apple does not control: the search-distribution licensing arrangement with Google is directly exposed to the U.S. antitrust remedy against Google, and the App Store commission model is under simultaneous pressure from the EU Digital Markets Act, the Epic Games injunction and a related U.S. court order restricting commissions on purchases made outside apps. In other words, the highest-margin, fastest-growing part of Apple is also the part most exposed to regulatory reversal — a dependency examined in detail in Section 2.
Viewed as a system, these lines form a self-reinforcing flywheel: hardware seeds the installed base, the installed base powers the recurring services annuity, services and cross-device continuity raise switching costs, and high switching costs return the customer to Apple for the next device. That integration is the source of the durability. Its two fragilities are the mirror image of its strengths — the flywheel leans heavily on a single category (iPhone) to seed the base, and its most profitable link (Services) is precisely the one now most exposed to regulation. A hit to either does not stay contained: it propagates through the whole system.
1.3 Geographic Exposure
sources Apple’s five reportable segments are geographic, and the exposure is genuinely global — a majority of net sales are generated outside the United States. The Americas is the largest region and, together with Europe, Japan and Rest of Asia Pacific, carried consolidated growth in FY2025 on stronger iPhone and Services demand. §
Greater China is the structural exception and the region that warrants the closest watch. Revenue there has now declined for a third consecutive year, driven principally by lower iPhone sales amid intense domestic competition, and the long-lived assets Apple holds in the region have been drawn down over the same period. The exposure is doubly concentrated: China is both a softening end market and, alongside the rest of Asia, the geographic core of Apple’s outsourced manufacturing base — so the region sits at the intersection of demand risk, supply-chain risk and the new U.S. tariff regime. Because consolidated growth in the Americas, Europe and Japan has masked the China decline at the group level, the trajectory is easy to overlook; it should not be netted away.
Currency is a persistent second-order headwind. Apple is a net receiver of non-dollar currencies, so a stronger dollar reduces the reported value of foreign sales and can force higher international pricing that dampens demand; the company hedges portions of this exposure but does not eliminate it. The geography-specific regulatory and tariff detail — the EU DMA, the U.S. tariff and Section 232 semiconductor investigations — is developed in Section 2.
1.4 Management Team
sources This is an assessment of stability rather than a directory. The FY2025 filing shows an unusually settled leadership picture: no chief-executive change, no auditor change (Ernst & Young has served since 2009), and an orderly, internally-promoted succession in the principal-accounting-officer role with the outgoing officer remaining at the company and continuity in the finance function under the sitting CFO. Nothing in the filing points to a governance discontinuity, a disagreement with accountants, or a restatement.
The genuine leadership question is not competence — Apple’s operational excellence, particularly its supply-chain mastery, is a management-built advantage — but succession depth at the very top. The company’s identity and capital-return discipline are closely associated with a long-tenured chief executive, and eventual CEO succession is the single most consequential governance variable for a business of this scale, even though the filing gives no indication it is imminent. Detailed director and officer information (Item 10) is incorporated by reference to the forthcoming proxy statement and therefore sits outside this filing, which limits what can be concluded here about board composition and independence. On the evidence available, the leadership backdrop is a source of continuity and low execution risk, with succession the one item to monitor over a multi-year horizon.
1.5 Capital Allocation Track Record
| Year | Dividends Paid ($M) | Share Repurchases ($M) | CapEx ($M) |
|---|---|---|---|
| FY2021 | $14,467.0M | $85,971.0M | $11,085.0M |
| FY2022 | $14,841.0M | $89,402.0M | $10,708.0M |
| FY2023 | $15,025.0M | $77,550.0M | $10,959.0M |
| FY2024 | $15,234.0M | $94,949.0M | $9,447.0M |
| FY2025 | $15,421.0M | $90,711.0M | $12,715.0M |
Source: Apple Inc. FY2025 Form 10-K, Consolidated Statements of Cash Flows; Portfolio model, Data sheet.
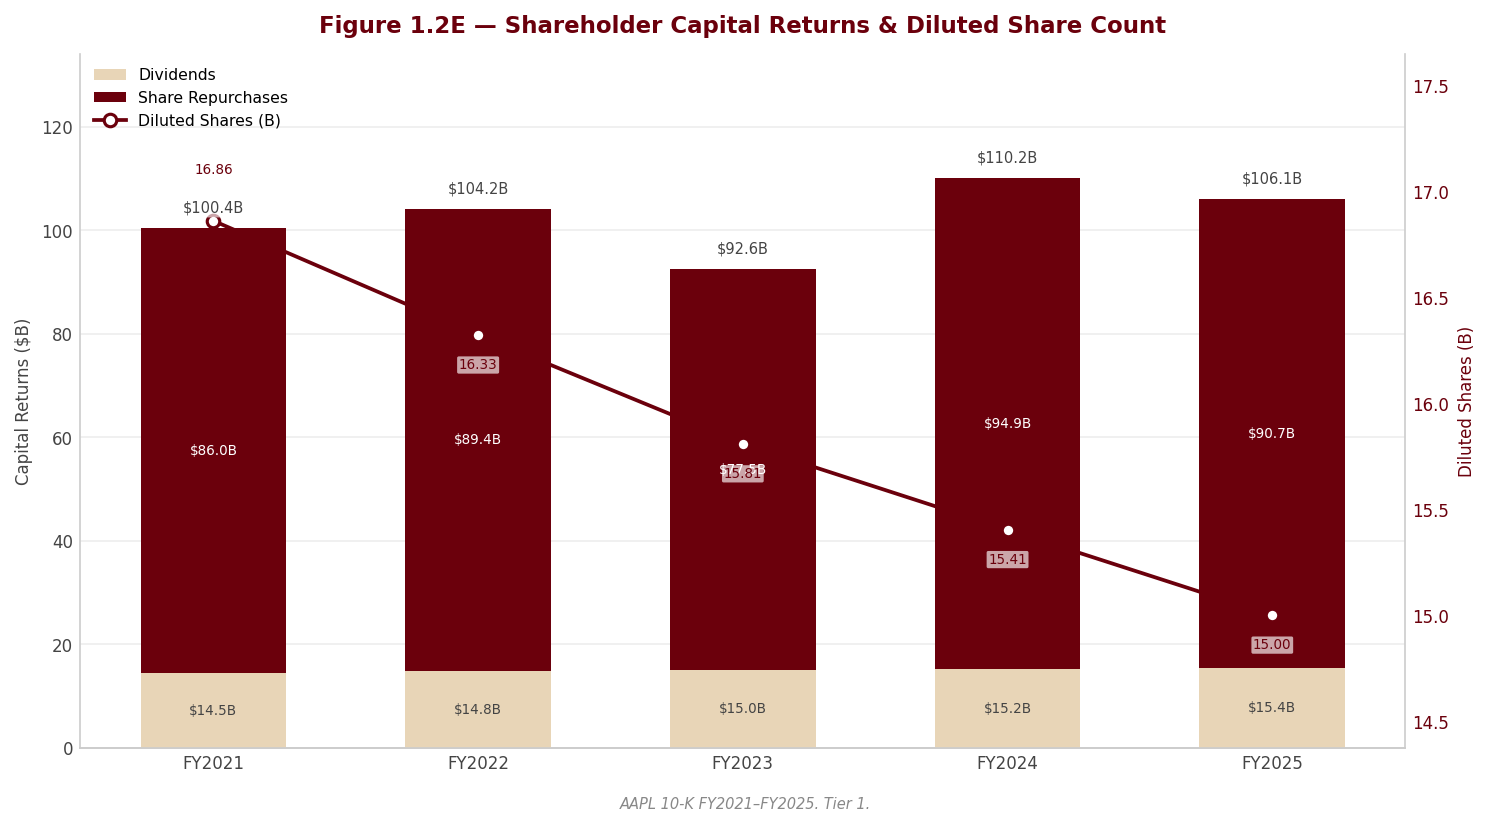
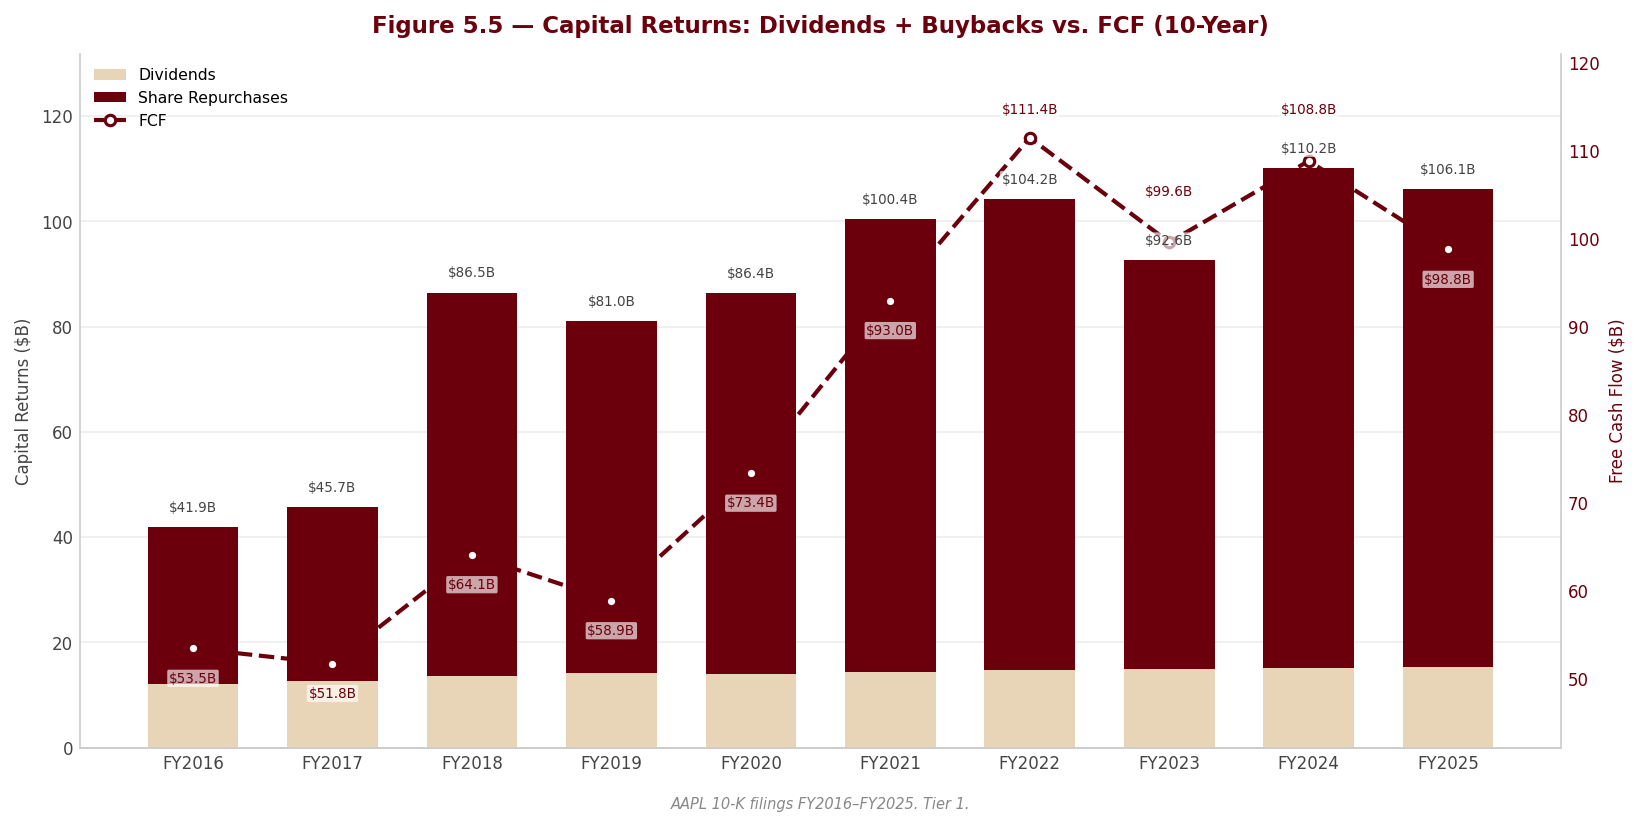
Apple’s capital allocation is unambiguous: this is a cash-return machine, not a reinvestment story. Over the period, shareholder distributions have been dominated by buybacks, which dwarf the dividend by a wide margin, while capital expenditure has remained modest relative to a company of Apple’s revenue scale — the direct consequence of an asset-light model in which the heavy manufacturing capital sits with outsourcing partners rather than on Apple’s own balance sheet (the counterpart being the large off-balance-sheet purchase commitments discussed in Section 2). Capex running only modestly above the depreciation base signals maintenance and product-tooling investment rather than a build-out for growth; management’s confidence is expressed through the pace of return of capital, not through reinvestment intensity. The dividend, though raised annually, functions as a secondary, steadier signal alongside the far larger and more variable repurchase programme.
Two analytical cautions belong here. First, the scale of buybacks means a meaningful part of per-share earnings growth is share-count reduction rather than operating growth — and because repurchases have been executed into a rising share price, the return on that repurchase capital is lower than the headline pace suggests. Second, sustained returns well in excess of retained earnings have driven book equity to a very thin, at times negative, position, which distorts conventional book-value and return-on-equity metrics and means they must be read with the buyback context in mind. Both points are quantified in Section 3. The signal from the mix itself, however, is clear and consistent: a mature, high-free-cash-flow franchise choosing to return capital aggressively rather than deploy it internally.
1.6 Competitive Positioning & Moat
sources 1.6.1 Industry structure. Apple competes in markets management describes as intensely competitive, defined by aggressive price competition, short product life cycles, rapidly evolving standards and frequent imitation — with some rivals willing to supply products and services at little or no profit, or at a loss, to win share. In an industry with those dynamics, returns do not accrue to the largest unit-volume supplier; they accrue to whichever competitor can differentiate enough to command pricing power and lock customers into an ecosystem. That distinction is the entire investment case for Apple: by its own admission it holds only a minority share of the global smartphone, PC, tablet and wearables markets, several of which have at times stagnated or contracted, yet it captures a disproportionate share of the industry’s profit. The structure rewards integration and brand, not volume — and that is the game Apple plays.
1.6.2 Competitive advantages. Apple’s moat rests on four reinforcing pillars, each grounded in a filing disclosure or a hard metric. First and foremost is integration: management frames its central advantage as controlling nearly the entire solution — hardware, operating system, applications and services — which competitors relying on assembling third-party components cannot replicate at the same quality or margin. Second is brand and pricing power, evidenced by the ability to shift mix toward premium models and still grow the installed base to a record $416,161.0M in revenue. Third are switching costs: cross-device continuity, iCloud synchronisation and services attach make leaving the ecosystem costly in convenience terms, which is what converts a one-time hardware buyer into a recurring services annuity. Fourth is scale and supply-chain mastery — the operational capability to design custom, often single-sourced components and ramp them at volume, which both lowers cost and creates a capability gap rivals struggle to close. Together these produce the sector-leading margins the model depends on.
1.6.3 Competitive vulnerabilities. The moat is real but not unconditional. The most acute vulnerability is regulatory, and it strikes at the most profitable link in the chain: the Services economics that drive margin expansion are materially exposed to the Google search-distribution antitrust remedy, the EU Digital Markets Act, and the Epic/DOJ challenges to the App Store commission model — a cluster of contingencies that could impair growth and margin simultaneously, developed in Section 2. Second, single-product concentration leaves the whole system dependent on continued iPhone demand. Third, Apple’s minority unit share is a genuine strategic exposure, because developer support — and therefore the quality and availability of the third-party software that makes the ecosystem valuable — depends in part on Apple remaining a platform worth building for. Fourth, the Greater China decline, supply-chain concentration in Asia and the new tariff regime combine into a compounding geographic risk. Finally, low-cost imitators exert continuous downward pressure on hardware pricing and margin.
1.6.4 Verdict. Apple’s competitive position is among the widest and most durable in large-cap technology: integration, brand and ecosystem lock-in underpin margins that the broader industry structure would not otherwise permit, and there is no sign of competitive erosion in the core franchise. The important qualification is that FY2025’s margin expansion was a Services-mix effect — hardware margin actually softened on tariff costs — so the durability of the margin now rests on the continued growth of exactly the revenue stream most exposed to regulation. The binding question for long-run margin durability is therefore not competitive but legal and regulatory. [Rating and price target withdrawn — see the note at the top.] The competitive strength is real, and this analysis does not dispute it — Apple is a franchise we admire. [Rating and price target withdrawn — see the note at the top.]
Section 2 — Key Risks & Catalysts
2.1 Downside Risks
sources The risk profile that dominates Apple today is not operational or financial — the balance sheet is fortress-grade and the franchise is intact — but regulatory and legal. This is a company whose principal threats now sit in courtrooms and competition authorities rather than in factories or product labs. The FY2025 10-K is unusually saturated with legal and regulatory narrative, and the single most important analytical point about Apple’s forward earnings is that the highest-margin, fastest-growing part of the business is the part most exposed to adverse legal outcomes. Two structural exposures compound this: a manufacturing base concentrated in Asia and freshly subject to a new U.S. tariff regime, and a revenue base still leaning heavily on one product category and one increasingly difficult geography.
Regulatory and legal assault on Services economics — the dominant risk
sources This is the report’s most important risk disclosure, and it is a RED-flag item. A material and rising portion of Apple’s high-margin Services revenue is legally contingent, and the contingency is not reflected in any accrual — it is forward revenue-at-risk, not accrued loss. Three distinct legal fronts converge on the same economics.
First, and most acute, is the search-licensing arrangement. Apple earns high-margin revenue from licensing arrangements under which third parties, principally Google, pay to have their search services offered on Apple’s platforms. Google has been found to have violated U.S. antitrust laws, and a U.S. District Court has ordered remedies that remain subject to appeal by both the Department of Justice and Google. Management explicitly warns that a reversal on appeal could impose remedies prohibiting Google from offering Apple commercial terms for search distribution — which would materially reduce Apple’s ability to earn revenue from these arrangements. This is a near-pure-margin revenue stream that could be curtailed by a legal outcome entirely outside Apple’s control. §
Second is the European Digital Markets Act. Apple has restructured iOS, iPadOS, the App Store and Safari to comply — introducing alternative distribution, alternative payment processing and new business terms — but the European Commission has opened formal non-compliance investigations, has already fined Apple and issued a cease-and-desist order requiring removal of anti-steering restrictions, and continues a second, still-open investigation in which it has issued preliminary findings. A final adverse determination could bring further fines tied to a share of worldwide net sales, plus additional penalties for violating a cease-and-desist order. The exposure is therefore both a direct fine risk of potentially extreme magnitude and a forced-business-model-change risk to App Store economics. §
Third is the Epic Games litigation. A U.S. District Court has found Apple in violation of an earlier injunction and has barred it from imposing any commission or fee on purchases consumers make outside an app — and, more gravely, referred Apple to the U.S. Attorney for a determination of whether criminal contempt proceedings are appropriate. Apple’s request to stay pending appeal was denied; the Ninth Circuit heard the expedited appeal in October 2025. Running alongside all of this is the Department of Justice’s civil monopolization lawsuit over the “performance smartphones” and “smartphones” markets, joined by numerous state attorneys general. §
Why it matters to the financials: Services is the engine of blended gross-margin expansion and the cleanest growth story Apple has. If the Google arrangement is curtailed, or App Store commission economics are compressed by the DMA or the Epic order, both the growth narrative and the margin-mix narrative are impaired at once — a double hit to the two pillars of the current bull case. What would make it materialize: an unfavorable appellate outcome in Google, a final DMA violation finding, or an adverse Ninth Circuit ruling upholding the Epic injunction. §
Probability: Medium (each individual case is uncertain, but the cluster as a whole is escalating) | Timeframe: 1–2 years | Quantified potential impact: Not precisely quantifiable — the revenue-at-risk is disclosed as a contingency with no accrual; the DMA fine ceiling is expressed only as a share of worldwide net sales. The impact would be felt through Services revenue growth and blended gross margin rather than through a discrete charge.
Concentration risk: a single product category and a deteriorating Greater China
sources Management states explicitly that Apple generates a significant portion of net sales from a single product category, and that a decline in demand for that category could significantly impact sales and margins. That structural concentration is amplified by a genuine, multi-year problem in one geography. Greater China is Apple’s only reportable segment in secular decline — revenue has fallen for three consecutive years, management attributes the FY2025 decline primarily to lower iPhone sales, and China long-lived assets have been drawn down. This is a real deterioration partially masked at the consolidated level by growth in the Americas, Europe and Japan; an analyst should not net it away in the consolidated growth story. China is doubly exposed because it is simultaneously a revenue market in retreat and a supply-chain concentration. §
Probability: High (the China decline is already occurring; single-category dependence is structural) | Timeframe: Immediate and ongoing | Impact: A continued China slide directly reduces segment revenue and operating income and, if it spreads to the flagship category more broadly, would strike the largest revenue line. Intense local competition and geopolitical/tariff overlay make a near-term reversal unlikely.
Tariffs and an Asia-concentrated supply chain
sources New U.S. tariffs introduced beginning the second fiscal quarter of 2025 — together with reciprocal measures abroad and a national-security trade investigation into semiconductor imports — represent a fresh and unquantified cost headwind. This is a YELLOW watch item that is already showing up in the numbers: management attributes part of the decline in Products gross margin to tariff costs. A substantial majority of Apple’s hardware is manufactured by outsourcing partners located primarily in China mainland, India, Japan, South Korea, Taiwan and Vietnam — precisely the geographies most exposed to the new regime. Compounding this, Apple carries sizeable off-balance-sheet manufacturing and purchase commitments, largely non-cancelable and concentrated in Asia, most of it due within twelve months. Management repeatedly stresses that the ultimate impact of the tariffs is uncertain, depends on their magnitude and duration, and may be announced with little advance notice. §
Probability: High (tariffs are already in force and already affecting Products margin) | Timeframe: Immediate | Impact: Direct pressure on Products gross margin and potential disruption to component and rare-earth availability; the open-ended nature of the tariff regime leaves a forward cost risk that management cannot size.
Innovation, product-transition and AI execution risk
sources Apple competes in markets it characterizes as highly competitive, price-aggressive and subject to rapid technological change, where many rivals imitate its products and some can supply at little or no profit. Management acknowledges it holds only minority share in the global smartphone, personal computer, tablet and wearables markets. Sustaining the franchise therefore depends on a continual and timely flow of innovative products, and on successfully managing product transitions that may carry lower revenues or lower margins than what they replace. Artificial intelligence sharpens this in two directions: the filing flags that AI features can heighten product-safety risk by exposing users to harmful or inaccurate content, and that AI-related use of third-party and copyrighted material for training raises intellectual-property infringement exposure. A failure to deliver a compelling AI-enabled product cycle would be both a competitive setback and a missed catalyst. §
Probability: Medium | Timeframe: 1–2 years | Impact: Not directly quantifiable — the risk manifests as slower replacement demand, margin pressure on new categories, or litigation and product-liability costs rather than as a single measurable line.
Financial concentrations — receivables, foreign exchange and tax
sources Beneath the headline exposures sit several narrower concentrations worth monitoring. On the credit side, a significant share of trade receivables is concentrated among cellular carriers and resellers and is largely uncollateralized, while vendor non-trade receivables are heavily concentrated in a small number of Asian vendors — the same assemblers on which the supply chain depends, so a disruption at a key partner would hit both the supply chain and the receivable at once (a YELLOW watch item). Apple is also a net receiver of non-dollar currencies, so a stronger dollar reduces the dollar value of foreign sales and can force higher international pricing that dampens demand. [Rating and price target withdrawn — see the note at the top.] §
[Rating and price target withdrawn — see the note at the top.]
2.2 Upside Catalysts
sources The catalyst picture is asymmetric, and honesty requires stating so: Apple’s downside risks are more numerous, more concrete and nearer-term than its identifiable catalysts. Much of the upside is also the mirror image of the dominant risk — the same legal cluster that threatens Services would, if resolved favorably, remove an overhang rather than add new earnings. The genuine forward catalysts are execution-driven and macro-relief-driven rather than binary windfalls.
A successful AI-enabled product and upgrade cycle
Apple introduced a refreshed product slate across the fiscal year — new Mac and iPad lines, a lower-priced iPhone, mid-year operating-system releases across all platforms, and a later-year iPhone lineup including a new thin model, new Apple Watch models and new AirPods. The clearest path to re-accelerating hardware demand is a compelling AI-enabled feature set that drives an installed-base upgrade cycle in the flagship category. [Rating and price target withdrawn — see the note at the top.]
Probability: Medium | Timeframe: 1–2 years | Monitoring trigger: Evidence of shortened upgrade cycles or above-trend flagship-category sell-through following a major AI-feature rollout.
Continued Services growth and monetization
Services remains the highest-margin, fastest-growing revenue stream, driven by advertising, the App Store and cloud services, and it is the primary reason blended gross margin has expanded. Absent an adverse regulatory outcome, continued Services growth is the single most powerful lever on consolidated margin and earnings quality — the same reason it is also the largest risk. Its dual nature is the defining tension of the Apple thesis.
Probability: Medium-High (operationally; conditional on the regulatory outcome) | Timeframe: Ongoing | Monitoring trigger: Sustained double-digit Services growth without a step-down in the App Store or search-licensing revenue lines.
Favorable resolution of the legal overhang
Because the regulatory cluster is currently a discount on the stock, favorable outcomes would act as catalysts by removing that discount. [Rating and price target withdrawn — see the note at the top.]
Probability: Low-to-Medium per individual case | Timeframe: 1–2 years | Monitoring trigger: Ninth Circuit ruling, DOJ-Google appellate schedule, and the European Commission’s final determination in the open DMA investigation.
Supply-chain diversification away from tariff and China exposure
sources Apple’s continued shift of manufacturing toward geographies such as India offers a structural path to reducing both tariff sensitivity and single-country supply concentration. Progress here would blunt the Products-margin pressure now attributed to tariffs and reduce the compound China exposure on both the demand and supply sides.
Probability: Medium | Timeframe: 3–5 years | Monitoring trigger: Disclosed shifts in the geographic mix of manufacturing partners and any stabilization or recovery of Products gross margin against a constant tariff backdrop.
2.3 Risk & Catalyst Summary
| # | Item | Type | Probability | Timeframe | Status | Monitoring Trigger |
|---|---|---|---|---|---|---|
| 1 | Regulatory/legal assault on Services economics (Google search, DMA, Epic, DOJ) | Risk | M | 1–2 yrs | Active | Google appeal, DMA final ruling, Ninth Circuit Epic decision |
| 2 | Single-product-category concentration & Greater China decline | Risk | H | Immediate | Active | China segment revenue trend; flagship-category demand |
| 3 | Tariffs & Asia-concentrated supply chain | Risk | H | Immediate | Active | Tariff magnitude/duration; Section 232 semiconductor probe |
| 4 | Innovation, product-transition & AI execution/IP risk | Risk | M | 1–2 yrs | Monitoring | New-product sell-through; AI-related litigation |
| 5 | Financial concentrations — receivables, FX, tax | Risk | M | Ongoing | Monitoring | Carrier/vendor receivable concentration; ETR volatility |
| 6 | Successful AI-enabled product & upgrade cycle | Catalyst | M | 1–2 yrs | Latent | [Rating and price target withdrawn — see the note at the top.] |
| 7 | Continued Services growth & monetization | Catalyst | M-H | Ongoing | Active | Sustained Services growth without regulatory step-down |
| 8 | Favorable resolution of the legal overhang | Catalyst | L-M | 1–2 yrs | Latent | Appellate and Commission outcomes |
Source: Company SEC filings (10-K) and forensic footnote review; see Appendix A.1.
2.4 Risk Interdependencies
sources The Apple risk set is dangerous less as a list than as a system, because its principal threats are correlated rather than independent. The tightest coupling runs through Services: the regulatory cluster (Risk 1) and the margin-mix dependence on Services are the same exposure viewed from two angles. Blended gross-margin expansion is driven almost entirely by the rising Services mix, while Products margin is simultaneously being compressed by tariffs (Risk 3). If a regulatory outcome curtails the search-licensing or App Store revenue at the same moment tariffs continue to erode Products margin, Apple would lose its margin tailwind and see its margin headwind intensify at once — the two effects would not offset, they would compound, hitting both the growth story and the margin story in the same period.
The second dangerous cluster is geographic. Greater China is simultaneously a revenue market in multi-year decline (Risk 2) and a core node of the Asia-concentrated supply chain (Risk 3), and the two-vendor concentration in vendor non-trade receivables (Risk 5) sits on the same assemblers. A geopolitical shock centred on China — escalating tariffs, retaliatory measures, or disruption at a key partner — would therefore strike demand, supply and a large receivable simultaneously. Because Apple relies on single or limited sources for many critical components, a business interruption at one of these concentrated nodes would be amplified rather than absorbed. The combination that would be disproportionately damaging is a China-centred supply-and-demand shock landing at the same time as an adverse Services ruling: it would remove the growth engine and impair the cost base together, against a capital structure already run with thin book equity by design. §
2.5 ESG & Regulatory Exposure
sources Apple’s most material ESG-and-regulatory exposures are governance- and regulatory-facing rather than environmental. The regulatory dimension is the substance of Risk 1 above — the DMA, DOJ, Epic and Google antitrust matters constitute the single largest external-governance overhang on the business, and the DMA in particular carries fine exposure tied to a share of worldwide net sales alongside forced changes to the App Store business model. Layered onto this is a growing and inconsistent global regime governing personal data — including cross-border transfers among Apple’s own subsidiaries, heightened obligations for minors’ and sensitive health, biometric and financial data, and new online-safety and mandatory age-verification laws — compliance with which is costly and has already required changes to business practices. Cybersecurity is overseen by a dedicated corporate information-security function and a separate supplier-trust team, with incident escalation to senior management and Audit Committee oversight; management notes Apple is attacked on a regular basis and considers itself at relatively greater risk given its profile and the value of the data it holds.
On the social and environmental side, management flags that varied and sometimes conflicting stakeholder expectations expose Apple to potential liabilities, increased costs and reputational harm, and that its environmental and other goals depend partly on third-party performance and data outside its control and may not be fully achieved — a candid acknowledgement that its published commitments are not entirely within its own gift. Supplier-code-of-conduct violations are disclosed to occur from time to time within the outsourced-manufacturing base. §
The governance backdrop, by contrast, is clean and supportive. The 10-K discloses no related-party transactions in its body and Apple has no controlling shareholder, so there is no evident value-extraction risk from insiders (a completeness note: related-party detail is deferred to the forthcoming proxy). The accounting-leadership transition disclosed for the period is an orderly internal succession — an internal promotion with the predecessor remaining at the company, under the same CFO and the same auditor — not a red flag. Ernst & Young has served continuously since 2009 and issued an unqualified opinion on both the financial statements and internal control over financial reporting, with a single critical audit matter (uncertain tax positions) that aligns with the largest genuine judgment area in the accounts. In short, the governance and audit foundation is sound; the ESG-and-regulatory risk that matters for valuation is external and legal, concentrated in the antitrust and data-regulation arena.
Section 3 — Financial Analysis & Historical Performance
sources Three-Statement Linkage Confirmation: - Net Income ties (Income Statement → Cash Flow Statement): Confirmed. Net income of $112,010.0M is the starting line of the FY2025 cash flow statement and reconciles to the income statement without adjustment. - Cash ties (Balance Sheet → Cash Flow Statement): Confirmed. The change in cash and equivalents implied by the cash flow statement reconciles to the balance-sheet cash position of $35,934.0M. Note that the balance-sheet “cash and equivalents” line excludes the far larger marketable-securities portfolio; Apple’s true liquidity and its effective net-cash position are addressed in 3.2B. - Retained Earnings reconciliation (Beg RE + NI - Dividends - Buybacks charged to RE = End RE): Confirmed in direction. Retained earnings moved to an accumulated deficit of -$14,264.0M because cumulative buybacks and dividends have exceeded cumulative earnings — a deliberate consequence of the capital-return program, not a reconciliation break. This is analysed in 3.2B.
3.1A Income Statement
Source: Apple Inc. FY2025 Form 10-K, Consolidated Statements of Operations; prior years as originally reported. Apple presents interest expense on a net basis within other income/(expense) from FY2024 onward, so a standalone interest-expense line is not separately disclosed for FY2024–FY2025.
CAGR Summary
| Metric | 3Y CAGR | 5Y CAGR | 10Y CAGR |
|---|---|---|---|
| Revenue | 1.8% | 8.7% | 5.9% |
| EBITDA | 3.5% | 13.4% | — |
| Net Income | 3.9% | 14.3% | 7.7% |
| Diluted EPS | 6.9% | 17.9% | 12.5% |
| FCF | -3.9% | 6.1% | — |
Source: Company SEC filings (10-K); figures per the FL model — see Appendix A.1–A.2.
3.1B Income Statement — Analysis
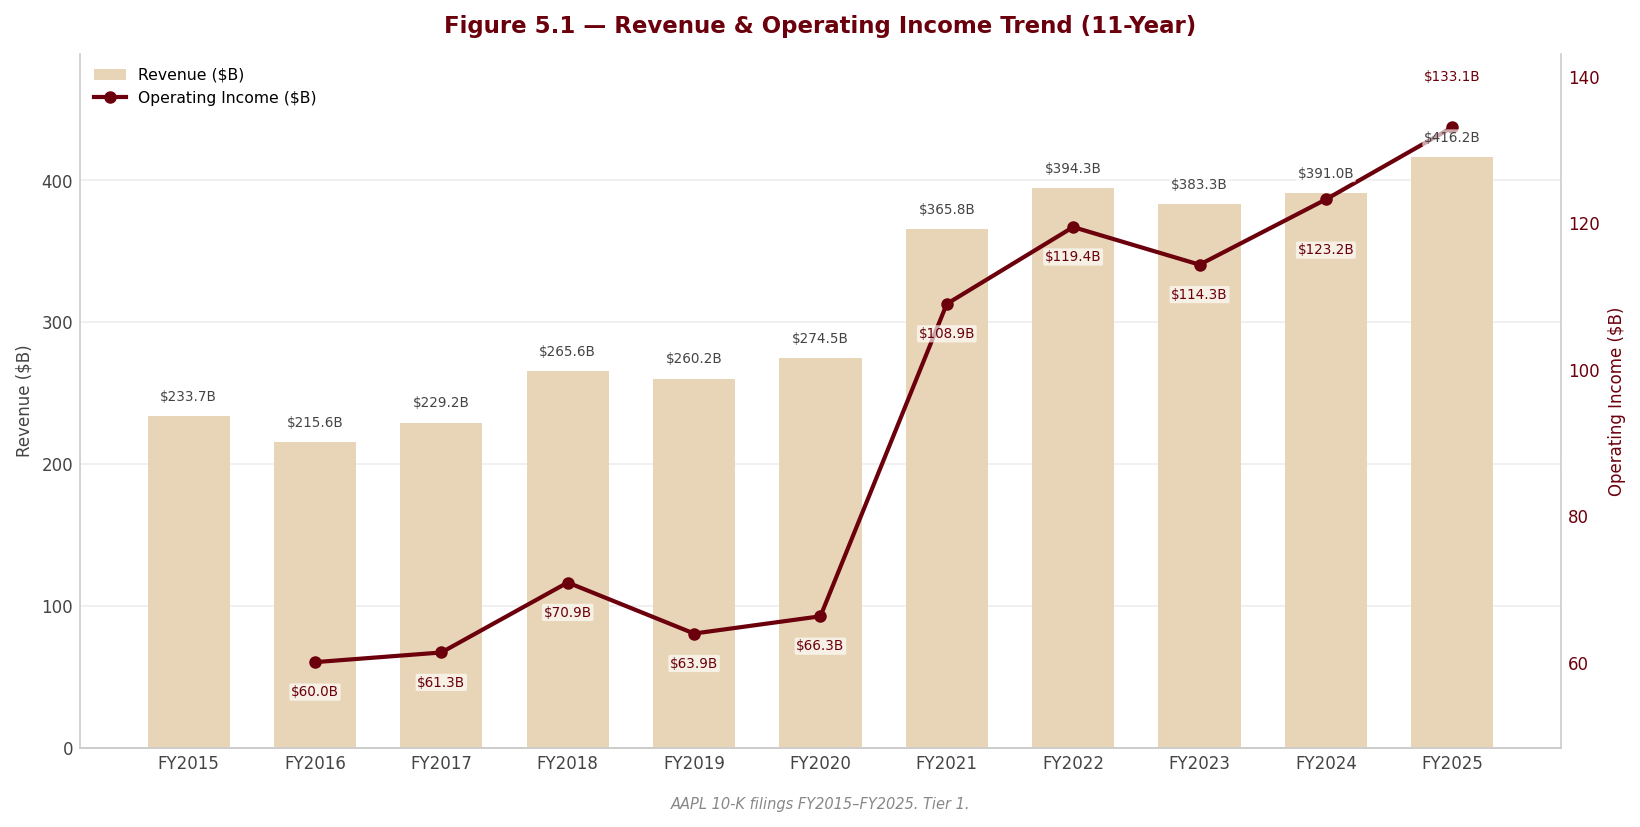
sources Revenue story. Apple’s top line is best understood as a large, slow-growing hardware installed base with a fast-growing, high-margin services annuity layered on top. FY2025 revenue of $416,161.0M grew 6.4%, a marked re-acceleration from the 2.0% of FY2024 and the outright contraction of -2.8% in FY2023. That three-year round-trip — the post-pandemic surge to $394,328.0M, the FY2023 give-back to $383,285.0M, and the recovery to $416,161.0M — frames the central point about this business: unit-driven hardware growth has essentially plateaued, and the 5-year revenue CAGR of 8.7% flatters a more recent 3-year CAGR of only 1.8%. The growth that remains is disproportionately mix-driven. Per management’s own attribution, the FY2025 top line was carried by iPhone (Pro-model strength), Mac, and above all Services, while Greater China — down for a third consecutive year — was the sole reportable geography in secular decline. An investor should treat the headline revenue re-acceleration as real but low-single-digit in its durable, volume-based component, with the higher-quality growth concentrated in Services.
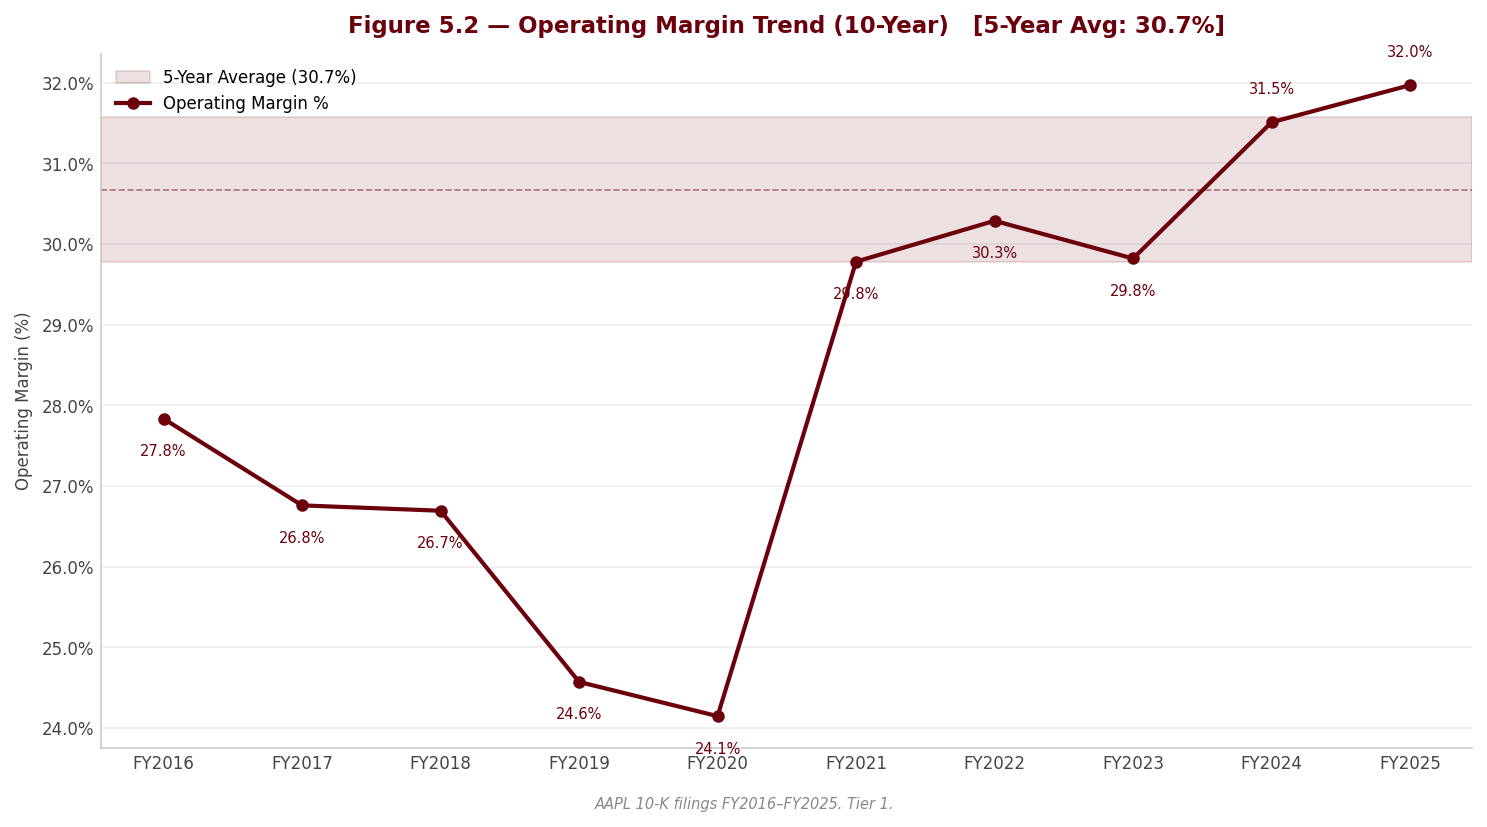
Margin trajectory. Gross margin has expanded almost without interruption, from 41.8% in FY2021 to 46.9% in FY2025 — a cumulative gain of several hundred basis points. This is the single most important structural feature of the income statement, and its source must be identified precisely, because the headline number is misleading. The expansion is entirely a revenue-mix effect. Products gross margin actually declined in FY2025 on an unfavourable product mix and the new US tariff costs that began in the second fiscal quarter; the consolidated improvement came from Services, which carries a far higher gross margin and rose to roughly a quarter of revenue. In other words, Apple’s blended margin is rising not because its hardware is becoming more profitable — it is becoming slightly less profitable on tariffs — but because a structurally higher-margin revenue stream is out-growing the lower-margin one. This is a genuine, durable mix tailwind, but it is only as durable as Services growth, which (see Section 2 and 3.1B “Quality of earnings” below) carries concentrated regulatory risk. Below the gross line, operating leverage is modest and controlled: total operating expense grew to $62,151.0M on higher R&D and SG&A headcount costs, but EBIT margin still expanded to 32.0% from 29.8%, and EBITDA margin reached 34.8%. The margin story is structural on the mix axis and cyclical/headwind on the hardware-cost axis.
Major movers.
-
Services mix — the margin engine (structural). The rotation of revenue toward Services lifted consolidated gross margin to 46.9% even as hardware profitability slipped. [Rating and price target withdrawn — see the note at the top.] Its durability is contingent on the regulatory outcomes discussed below.
-
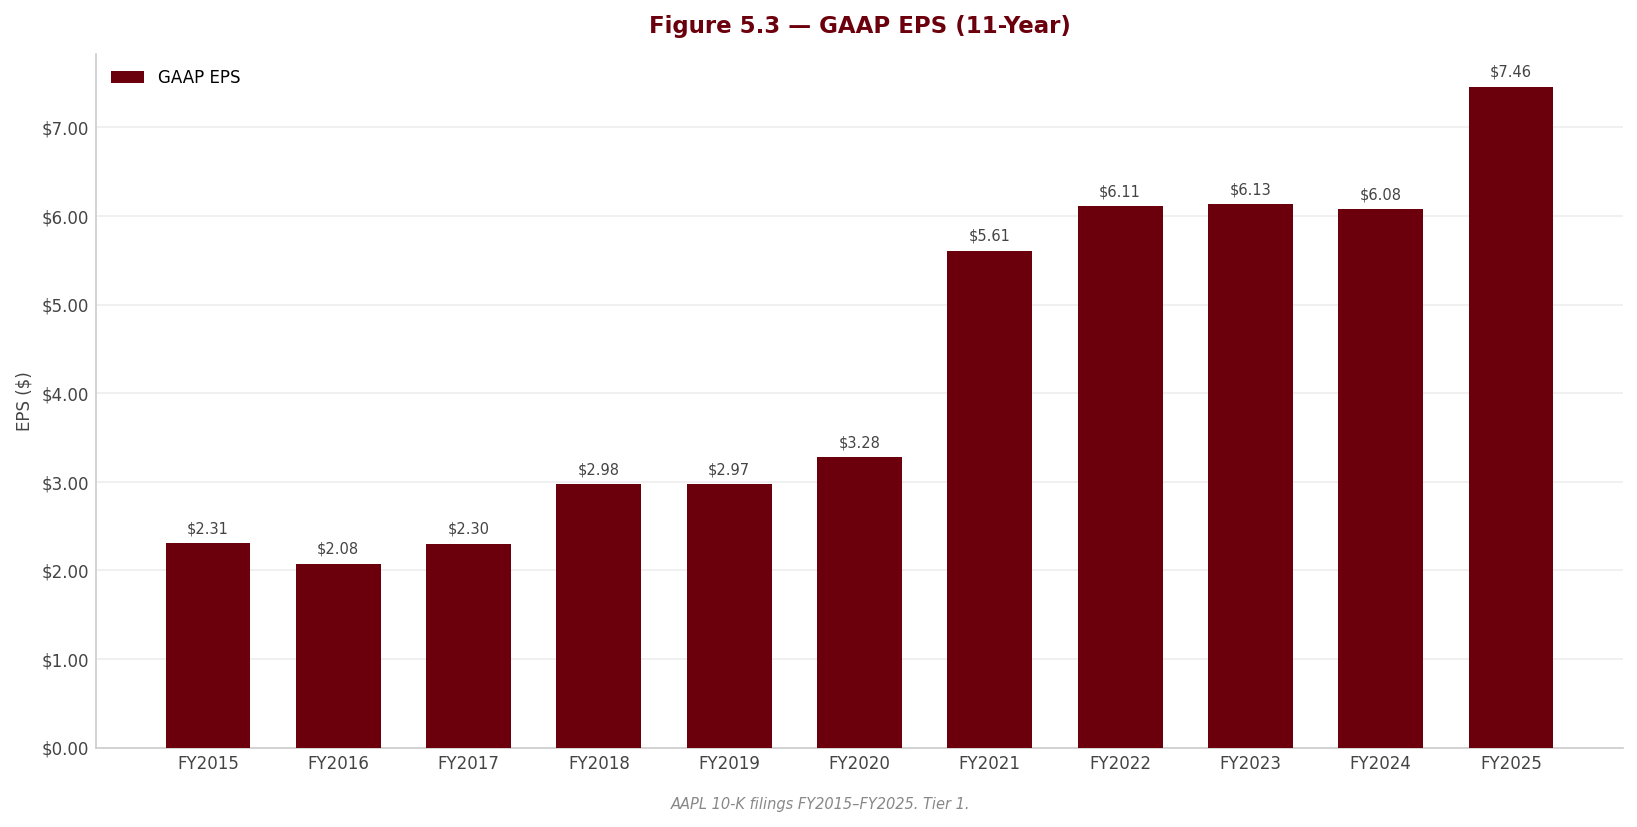
The FY2024 tax-charge base effect — the flattered comparison (temporary). This is the most important single item for any investor reading FY2025 growth. Reported net income rose to $112,010.0M from $93,736.0M, a gain of 19.5%, and diluted EPS rose 22.7% to $7.46. But pre-tax income grew only from $123,485.0M to $132,729.0M — a high-single-digit advance. [Rating and price target withdrawn — see the note at the top.] A momentum or valuation thesis anchored to headline EPS growth is mis-specified. This item is disclosed in full as a RED forensic flag and revisited under “Quality of earnings.”
-
Tariffs on Products cost of sales (emerging headwind). New US tariffs from the second fiscal quarter of FY2025 raised Products cost of sales and pushed Products gross margin down year-over-year. The magnitude and duration are unquantified by management, leaving an open-ended forward cost risk to hardware margin. This is the counterweight to the Services mix tailwind and, unlike the FY2024 tax base, it is a real cash cost rather than an accounting comparison. §
-
Share-count reduction (mechanical EPS lift). Diluted shares fell to 15,005 from 16,865 — a steady, cumulative reduction of well over a tenth of the share count driven by relentless buybacks. A meaningful portion of per-share earnings growth is therefore share-count arithmetic rather than operating growth. EPS grew at a 5-year CAGR of 17.9% against a net-income CAGR of 14.3%; the wedge is the buyback. The 10-year EPS CAGR of 12.5% looks weak only because the FY2015 base was itself a peak “supercycle” year — a reminder to be careful with endpoint selection on this name.
Quality of earnings. Apple presents results exclusively on a GAAP basis, with no non-GAAP add-backs anywhere in the filing — which removes an entire category of earnings-management surface and is a genuine positive. The one normalization an analyst must perform is for the FY2024 EU State Aid tax charge, a GAAP-disclosed discrete item. RED flag — headline growth is flattered. As detailed in Major Mover 2, normalizing the FY2024 base for the one-time charge collapses the reported 19.5% net-income and 22.7% EPS growth toward high-single-digit; the pre-tax figure ($132,729.0M vs $123,485.0M) is the honest gauge of the year’s operating progress. RED flag — Services growth and margin carry concentrated legal risk. The Services stream that drives both the growth and the margin-mix narrative is partly contingent on outcomes Apple does not control: the Google search-distribution licensing arrangement (subject to the US antitrust remedies process), the EU DMA investigation (whose statutory fine ceiling is a share of worldwide net sales), and the Epic injunction on App Store commissions. No accrual reflects this forward revenue-at-risk. If either the Google arrangement or the App Store commission model is curtailed, the growth and the margin-mix story are impaired simultaneously — the two tailwinds share a single point of failure. Two further YELLOW items belong here: a new valuation-allowance charge (management asserting it is not more-likely-than-not that certain Ireland and California credit carryforwards will be fully used — a mild negative on DTA recoverability), and a large book of gross uncertain tax positions that E&Y designated as the sole Critical Audit Matter, a meaningful portion of which could reverse within twelve months. [Rating and price target withdrawn — see the note at the top.]
⚠ Items to Watch. - If Products gross margin continues to erode on tariffs faster than Services mix can offset it, consolidated gross margin could stall below 46.9% — the first reversal of a four-year expansion and a direct hit to the core margin thesis. - If EBIT margin falls below 29.8%, it would unwind the recent operating-leverage gains and force a re-examination of the mix tailwind. - Any adverse resolution of the Google search-distribution or App Store commission cases would impair Services revenue and, with it, the margin-mix engine — watch the appeals calendar as a first-order catalyst, not a footnote.
3.2A Balance Sheet
Source: Apple Inc. FY2025 Form 10-K, Consolidated Balance Sheets. “Cash & Equivalents” excludes short- and long-term marketable securities; Apple does not separately report material goodwill or acquired intangibles.
3.2B Balance Sheet — Analysis
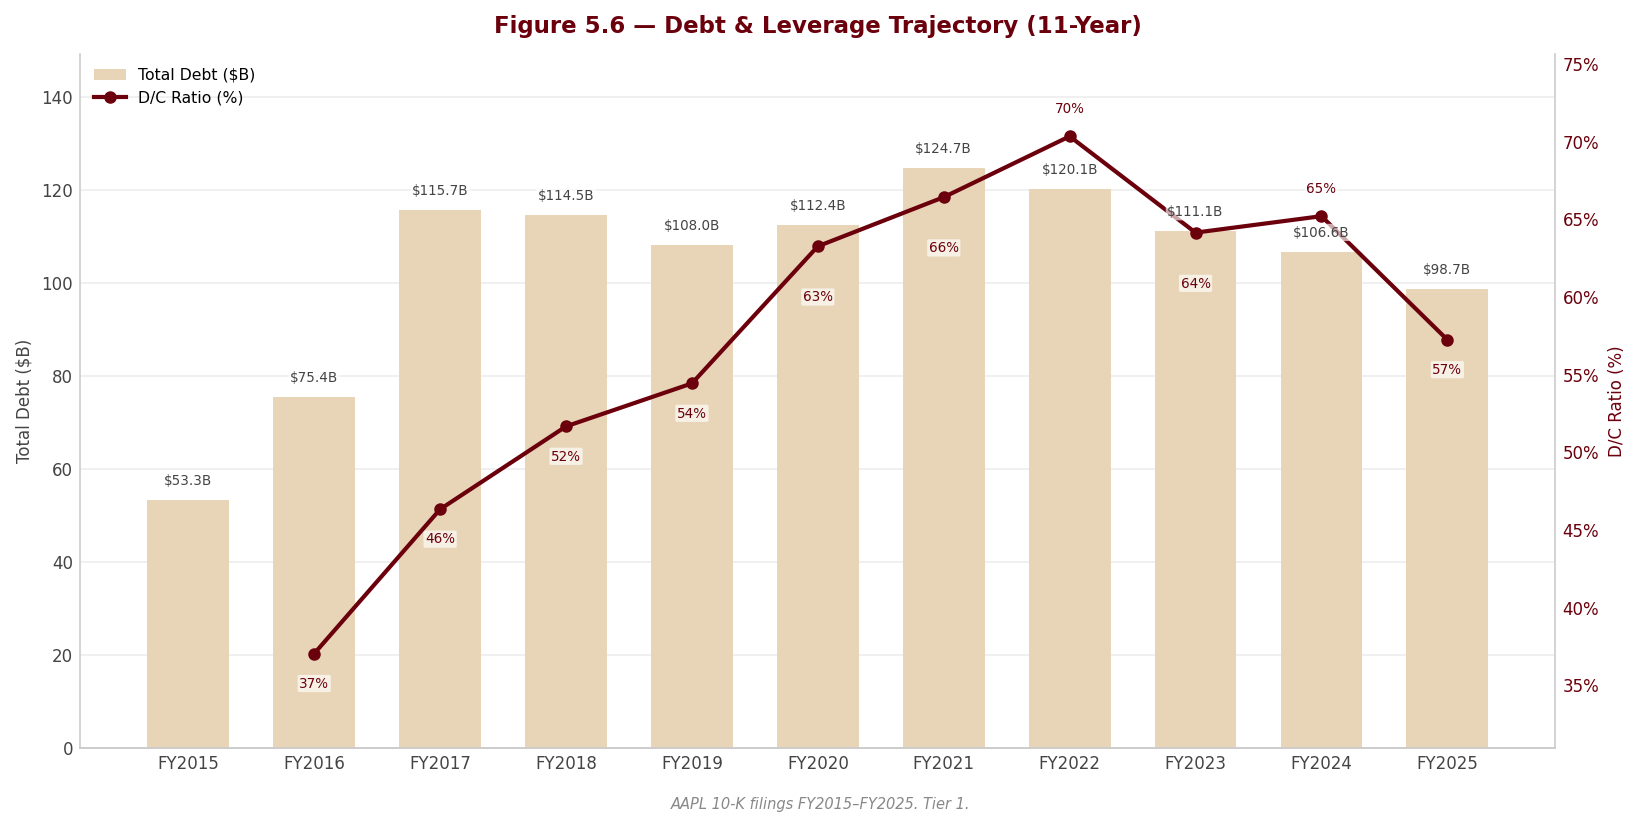
sources Asset composition. Apple’s balance sheet is neither capital-intensive nor acquisition-built. PP&E of $49,834.0M is modest against total assets of $359,241.0M, and goodwill/intangibles are immaterial — a reflection of Apple’s strategy of buying components and contract-manufacturing capacity rather than businesses. The asset base is dominated instead by financial assets: the balance-sheet cash line of $35,934.0M is only the tip of a much larger cash-and-marketable-securities portfolio that management explicitly cites as sufficient, together with operating cash flow and debt-market access, to fund the entire capital-return program. This is the single most important interpretive point on the balance sheet: on the pipeline’s debt-minus-cash convention, net debt is a positive $62,723.0M — but that convention nets only the small balance-sheet cash line, not the marketable-securities portfolio. Once those securities are included, Apple is effectively in a net-cash position. The reported net-debt figure should therefore be read as a convention artifact, not as genuine financial leverage. Total assets are essentially flat over five years ($351,002.0M to $359,241.0M) because Apple is deliberately shrinking its own equity capital via buybacks rather than accumulating assets — the balance sheet is a conduit for capital return, not a store of retained value.
Leverage trajectory. Gross debt has fallen steadily, from $124,719.0M to $98,657.0M, and net-debt/EBITDA has compressed to 0.4x from 0.7x — comfortably below one turn of EBITDA on the conservative convention, and negative on a securities-inclusive basis. Reported debt/equity of 1.3x looks elevated, but that ratio is distorted by a denominator Apple is actively destroying: shareholders’ equity is only $73,733.0M, held down by an accumulated deficit of -$14,264.0M. Retained earnings turned negative in FY2022 and have stayed there because cumulative dividends and buybacks now exceed cumulative earnings — a normal and intended consequence of the return policy, but one that renders conventional book-value and leverage ratios close to meaningless for this name. There are no covenant concerns flagged; the credit profile is investment-grade and improving. The thin book equity is a feature of the capital structure, not a warning.
Working capital. Apple runs one of the most favourable working-capital positions in corporate finance: a negative cash conversion cycle of roughly -72 days in FY2025, meaning suppliers effectively finance Apple’s operations. Days payable of 115 days dwarf days inventory of 11 days, and inventory of $5,718.0M remains negligible on a just-in-time model. The current ratio of 0.9x sits below one — which would be a liquidity flag at almost any other company but is a sign of strength here, reflecting the large current payables of a negative-CCC business against a cash pile parked partly in non-current securities. The one item worth monitoring is receivables: at $39,777.0M they have grown faster than revenue over the period (DSO extended to 32 days from 21 days), and the receivables book is concentrated — carriers represent roughly a third of trade receivables, and two Asian vendors dominate the separate vendor non-trade receivable. This is a genuine credit/operational concentration (a YELLOW forensic item), not an accounting red flag, but it is the one place on an otherwise pristine balance sheet where a single counterparty disruption would be felt.
⚠ Items to Watch. - If receivables continue to outgrow revenue and DSO extends materially beyond 32 days, it would signal either channel-financing stress or deteriorating carrier credit — the first crack in a negative-CCC model. - If net-debt/EBITDA were to rise back above 0.7x, it would mark a reversal of the multi-year deleveraging and warrant scrutiny of whether buybacks are being debt-funded rather than cash-funded. - Tens of billions of dollars of off-balance-sheet purchase commitments, concentrated in tariff-exposed Asian geographies, sit outside these ratios and represent near-term, largely non-cancelable cash obligations that the leverage optics understate.
3.3A Cash Flow Statement
| FY2021 | FY2022 | FY2023 | FY2024 | FY2025 | |
|---|---|---|---|---|---|
| Cash from Operations ($M) | $104,038.0M | $122,151.0M | $110,543.0M | $118,254.0M | $111,482.0M |
| — Depreciation & Amortization ($M) | $11,284.0M | $11,104.0M | $11,519.0M | $11,445.0M | $11,698.0M |
| Capital Expenditures ($M) | $11,085.0M | $10,708.0M | $10,959.0M | $9,447.0M | $12,715.0M |
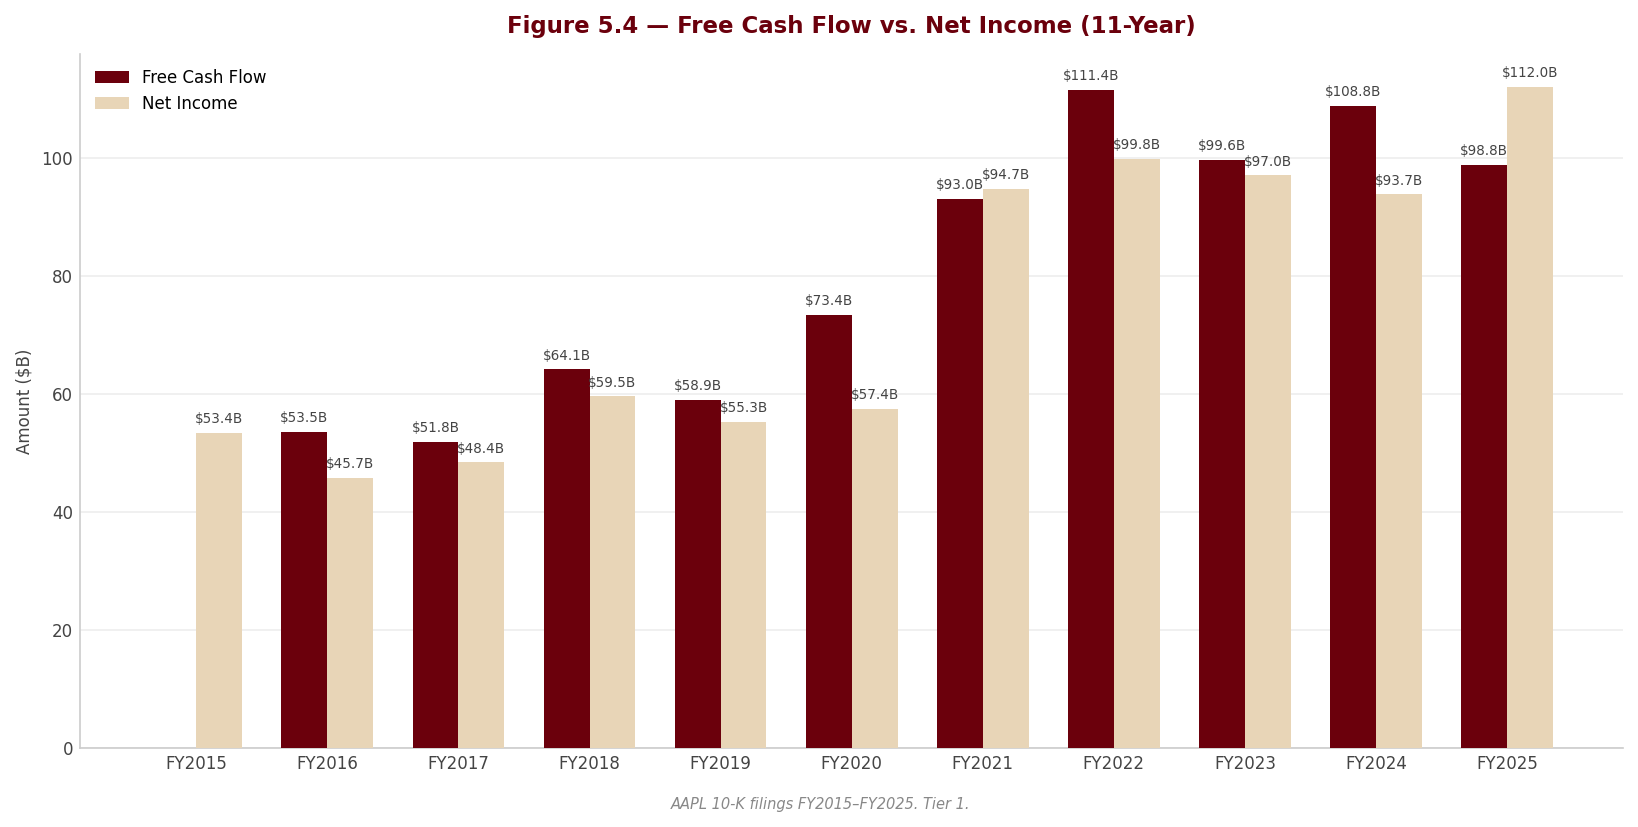
| Free Cash Flow ($M) | $92,953.0M | $111,443.0M | $99,584.0M | $108,807.0M | $98,767.0M |
| FCF Margin | 25.4% | 28.3% | 26.0% | 27.8% | 23.7% |
| FCF / Share | $5.51 | $6.83 | $6.30 | $7.06 | $6.58 |
| FCF Conversion (FCF/NI) | 98.2% | 111.7% | 102.7% | 116.1% | 88.2% |
| CapEx / Revenue | 3.0% | 2.7% | 2.9% | 2.4% | 3.1% |
| CapEx / D&A | 1.0x | 1.0x | 1.0x | 0.8x | 1.1x |
| Dividends Paid ($M) | $14,467.0M | $14,841.0M | $15,025.0M | $15,234.0M | $15,421.0M |
| Share Repurchases ($M) | $85,971.0M | $89,402.0M | $77,550.0M | $94,949.0M | $90,711.0M |
Source: Apple Inc. FY2025 Form 10-K, Consolidated Statements of Cash Flows.
3.3B Cash Flow — Analysis
sources Quality of operating cash flow — the year’s key divergence. In every prior year of the window Apple converted more than the whole of net income into free cash flow — FCF conversion of 116.1% in FY2024, 111.7% in FY2022. FY2025 broke that pattern: operating cash flow FELL to $111,482.0M from $118,254.0M even as net income rose to $112,010.0M, and FCF conversion dropped to 88.2%. This is a RED forensic flag, and the cause is specific and largely non-recurring: FY2025 cash taxes ran far above the $20,719.0M book provision — reflect the settlement of the multi-year Ireland State Aid liability (funded from released escrow) plus deemed-repatriation payments. Income taxes payable on the balance sheet fell sharply as these catch-up obligations were paid. [Rating and price target withdrawn — see the note at the top.] Because the State Aid and repatriation payments are largely behind the company, FY2026 cash conversion should rebound toward the historical norm of full-or-better conversion — an analyst must not extrapolate the FY2025 OCF decline as a trend. Note the symmetry with the income statement: FY2024 net income was depressed by the book tax charge while FY2025 cash flow was depressed by paying it. The two RED flags are the accrual and the cash sides of the same Irish tax event.
CapEx analysis. Apple is a capital-light compounder. [Rating and price target withdrawn — see the note at the top.] The tick up in FY2025 capex/D&A from 0.8x is modest and does not signal a capital-intensity regime change; the vast majority of Apple’s “investment” runs through R&D on the income statement and through off-balance-sheet supplier commitments, not through owned PP&E. There is no growth-capex story to underwrite here — the reinvestment opportunity set is deliberately narrow, which is precisely why so much cash is returned.
Capital allocation waterfall. Apple’s capital allocation is among the most concentrated and shareholder-return-oriented of any large-cap. Over the five-year window the overwhelming majority of free cash flow — and in FY2025 more than the year’s entire FCF — was returned to shareholders, with buybacks dwarfing dividends. FY2025 repurchases of $90,711.0M were several times the $15,421.0M dividend, and combined shareholder returns exceeded free cash flow of $98,767.0M, funded by drawing down the securities portfolio and net debt reduction. This mix is defensible given the narrow reinvestment set — a company that cannot productively deploy capital internally should return it — but it carries a YELLOW forensic caveat: buybacks are being executed at rising share prices (the Q4 average repurchase price rose month over month), which lowers the return on repurchase capital, and a portion of the EPS growth investors pay for is share-count arithmetic rather than operating progress. The waterfall makes sense; the price paid for the buyback does not always.
⚠ Items to Watch. - If FY2026 FCF conversion does not rebound toward full conversion, the FY2025 shortfall would have to be re-read as structural rather than one-time — a material change to the cash-generation thesis. The remaining deemed-repatriation balance is a known further FY2026 cash-tax outflow to monitor. - If combined dividends-plus-buybacks persistently exceed free cash flow and are increasingly debt-funded, the deleveraging trend reverses and the return program’s self-funding character is compromised. - If capex/D&A were to rise durably above parity without a commensurate revenue response, it would signal either a shift toward heavier owned infrastructure (e.g., silicon or AI compute) or declining asset efficiency.
3.4 Returns Analysis
| FY2021 | FY2022 | FY2023 | FY2024 | FY2025 | |
|---|---|---|---|---|---|
| ROIC | 64.6% | 66.7% | 67.1% | 67.6% | 83.1% |
| ROE | 147.4% | 175.5% | 171.9% | 157.4% | 171.4% |
| ROA | 28.1% | 28.4% | 27.5% | 26.1% | 30.9% |
| Interest Coverage | 41.2x | 40.7x | 29.1x | — | — |
Source: Company SEC filings (10-K); figures per the FL model — see Appendix A.1–A.2.
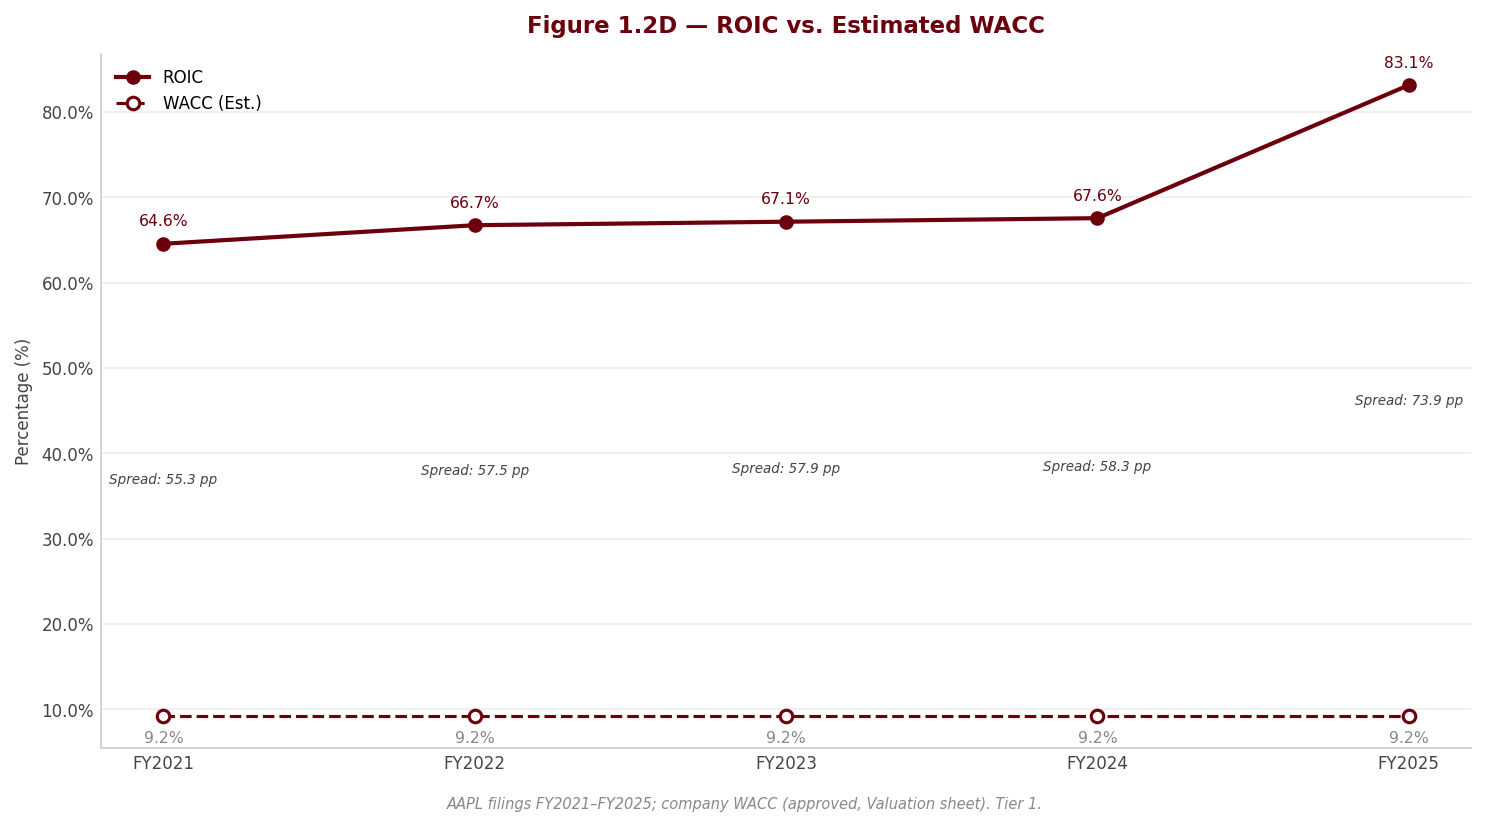
ROIC. Return on invested capital is the single most important long-term metric for this business, and Apple’s is extraordinary: 83.1% in FY2025, up from 64.6% in FY2021, and rising. Against the WACC — a high-single-digit figure — this represents a spread of many multiples of the cost of capital, among the widest and most durable in the investable universe. [Rating and price target withdrawn — see the note at the top.] The economic point is structural: Apple earns these returns on a very small invested-capital base because the balance sheet is asset-light and capital is continuously returned rather than retained — the denominator stays small while NOPAT compounds. A wide, persistent ROIC-over-WACC spread of this magnitude is the quantitative signature of the moat described in Section 1, and it is the primary justification for any premium multiple. Interest coverage, where separately disclosed, ran above 29.1x — a non-issue for a company that is effectively net cash; the metric is not disclosed for FY2024–FY2025 because interest expense is now reported net within other income, and coverage is immaterial to the credit in any case.
DuPont decomposition. Decomposing FY2025 ROE of 171.4% into its three levers is revealing. Net margin of 26.9% and asset turnover of 1.15x are both strong but not extreme — respectable for a hardware-plus-services franchise. The component that pushes ROE to triple digits is the equity multiplier of 5.54x. That multiplier is not a product of financial leverage in the risk sense — Apple is net cash — but a mechanical consequence of a shrunken equity base driven to near-nothing by cumulative buybacks and the accumulated deficit. The swing factor in Apple’s ROE is therefore the equity multiplier, i.e., the capital-return policy, not operating profitability. This is critical for interpretation: Apple’s headline ROE overstates operating quality because the denominator is artificially small, just as its debt/equity overstates leverage for the same reason. The honest read of operating returns is ROIC and ROA (ROA of 30.9% being genuinely elite), not the buyback-inflated ROE. An investor should anchor on the ROIC-versus-WACC spread and treat the reported ROE as a distorted, policy-driven figure.
3.5 Altman Z-Score (Most Recent FY)
| Component | FY2023 | FY2024 | FY2025 |
|---|---|---|---|
| X1 (Working Capital / Total Assets) | -0.005 | -0.064 | -0.049 |
| X2 (Retained Earnings / Total Assets) | -0.001 | -0.052 | -0.040 |
| X3 (EBIT / Total Assets) | 0.324 | 0.338 | 0.370 |
| X4 (Equity / Total Liabilities) | 0.214 | 0.185 | 0.258 |
| X5 (Revenue / Total Assets) | 1.087 | 1.071 | 1.158 |
| Z-Score | 2.18 | 2.11 | 2.35 |
| Zone | Gray | Gray | Gray |
Source: Company SEC filings (10-K); figures per the FL model — see Appendix A.1–A.2.
Interpretation. The Altman Z-Score places Apple in the “gray zone” (the Z′ model’s 1.23–2.90) in all three years, at 2.35 in FY2025 — improved from 2.11 in FY2024, and back above the FY2023 level. Taken at face value this reads as ambiguous credit standing, which would be absurd for one of the most cash-generative, investment-grade balance sheets in existence. The gray-zone score is a model artifact, and it is important to say exactly why rather than simply dismiss it. Two of the five components are mechanically penalized by Apple’s capital-return policy: X1 (working capital / total assets) is negative because Apple runs a deliberately negative cash conversion cycle, and X2 (retained earnings / total assets) is negative because buybacks have driven retained earnings to an accumulated deficit. Both “weaknesses” are, in Apple’s case, signs of financial strength — supplier-financed operations and aggressive shareholder returns — that the Z-Score, designed to detect distress in conventional industrial firms, misreads. The components that measure actual earning power, X3 (EBIT/assets) and X5 (revenue/assets), are strong and improving. The honest conclusion: the gray-zone score is real but non-diagnostic here; it reflects the Z-model’s incompatibility with a capital-returning, negative-working-capital megacap, not genuine credit risk. The favourable read is the trend — the FY2025 improvement to 2.35 came from rising EBIT/assets and a recovering equity/liabilities ratio, both directionally positive. Actual credit risk, assessed on cash generation and the securities-inclusive net-cash position, is negligible.
4. Valuation withdrawn
This section stated what the shares were worth and what to do about them. It rested on an exit multiple set by hand — across the coverage it averaged 24% below where each company actually traded — so the conclusion largely restated that assumption instead of testing it. Rather than leave it standing, it has been withdrawn while the method is rebuilt.
Nothing else in this report depends on it: the financial analysis above and below is drawn from the company's own filings, and every figure links to the page it was verified against.
Section 5 — Financial Metrics & Peer Benchmarking
5.1 Peer Selection
sources Apple is not a clean comp for any single company, because it runs two distinct engines — premium consumer hardware and a high-margin, recurring ecosystem/services layer — inside a mega-cap platform-tech valuation. No listed peer replicates that combination, so the group below is built to triangulate it rather than to mirror it. Two peers anchor the hardware read and two anchor the services/platform and valuation read; each is a best-available proxy on one axis and a deliberate imperfection on the other.
Samsung Electronics is Apple’s closest direct product competitor — smartphones, tablets, wearables, displays — and the natural hardware-scale benchmark. But it reports under Korean IFRS in won, is heavily weighted to memory and semiconductors by profit, and is therefore structurally more cyclical and more capital-intensive than Apple. Its comparisons are directional only. Qualcomm sits inside the iPhone ecosystem as a mobile-silicon supplier and is the smallest peer, but it carries the cleanest fiscal alignment — a September year-end within days of Apple’s — making it the tightest period match in the set. Microsoft and Alphabet are the mega-cap platform-tech peers of comparable scale and valuation; both carry hardware (Surface/Xbox; Pixel) alongside dominant software, cloud and advertising franchises, and both frame the multiple Apple is asked to justify. Amazon and Meta were excluded as weaker fits on the combined hardware-plus-services axis.
The set’s honest weaknesses: one IFRS/convenience-translated reporter (Samsung), fiscal years that span a full quarter (June to December), and two peers whose net income is distorted this year by one-off items (Alphabet up, Qualcomm down). These are not cosmetic — they are addressed metric-by-metric below and consolidated in 5.7. Treat the margin and returns comparisons as clean on the operating lines (EBIT, EBITDA, FCF) and as caveated on the net-income-derived lines.
| Peer | Ticker | Exchange | Filing Type | Accounting Standard | Fiscal Year End | Comparability Note |
|---|---|---|---|---|---|---|
| Microsoft Corporation | MSFT | NASDAQ | Annual report (10-K) | US GAAP | June | 3-month lag vs Apple; clean US-GAAP/USD basis |
| Alphabet Inc. | GOOGL | NASDAQ | 10-K | US GAAP | December | 3-month lead; net income inflated by securities gains |
| Samsung Electronics Co., Ltd. | 005930.KS | KRX | K-IFRS FS | K-IFRS | December | K-IFRS, USD convenience translation; memory-cycle mix — directional only |
| QUALCOMM Incorporated | QCOM | NASDAQ | 10-K | US GAAP | September | Cleanest period match; net income depressed by one-off tax charge |
Source: Peer-company SEC filings; comparability notes in 5.7 — see Appendix A.1.
5.2 Profitability Comparison
sources Comparative: Most Recent Full Fiscal Year
| Metric | Apple Inc. | Microsoft Corporation | Alphabet Inc. | Samsung Electronics Co., Ltd. | QUALCOMM Incorporated |
|---|---|---|---|---|---|
| Revenue ($M) | $416,161.0M | $281,724.0M | $402,836.0M | $234,622.0Mᶠ | $44,284.0M |
| Gross Margin | 46.9% | 68.8% | 59.7% | 39.4%ᶠ | 55.4% |
| EBITDA Margin | 34.8% | 57.7% | 37.3% | 27.1%ᶠ | 31.5% |
| EBIT Margin | 32.0% | 45.6% | 32.0% | 13.1%ᶠ | 27.9% |
| Net Margin | 26.9% | 36.1% | 32.8%* | 13.3%ᶠ | 12.5%† |
| FCF Margin | 23.7% | 25.4% | 18.2% | 11.3%ᶠ | 22.8% |
Source: Peer-company SEC filings; comparability notes in 5.7 — see Appendix A.1.
Flag legend: ᶠ = K-IFRS, USD convenience-translated (Samsung — directional only, see 5.7); ᵐ = market-sourced; ᶜ = computed from filing components. * = Alphabet net margin inflated by non-operating securities gains; † = Qualcomm net margin depressed by a one-off tax charge (see 5.7). Peer figures: Microsoft Corporation (Annual report (10-K), FY2025), Alphabet Inc. (10-K, FY2025), Samsung Electronics Co., Ltd. (K-IFRS FS, FY2025), QUALCOMM Incorporated (10-K, FY2025).
Historical: Apple Inc. Own 5-Year Progression
| Metric | FY2021 | FY2022 | FY2023 | FY2024 | FY2025 |
|---|---|---|---|---|---|
| Gross Margin | 41.8% | 43.3% | 44.1% | 46.2% | 46.9% |
| EBITDA Margin | 32.9% | 33.1% | 32.8% | 34.4% | 34.8% |
| EBIT Margin | 29.8% | 30.3% | 29.8% | 31.5% | 32.0% |
| Net Margin | 25.9% | 25.3% | 25.3% | 24.0% | 26.9% |
| FCF Margin | 25.4% | 28.3% | 26.0% | 27.8% | 23.7% |
Source: Peer-company SEC filings; comparability notes in 5.7 — see Appendix A.1.
The profitability picture only makes sense once hardware and software are separated. On gross margin, Apple’s 46.9% sits below Microsoft (68.8%) and Alphabet (59.7%) — as it should, because those are software/advertising businesses with near-zero unit cost, whereas Apple still builds physical devices. What is remarkable is that Apple earns 46.9% as a hardware company: it clears Samsung (39.4%ᶠ, a direct device peer) by a wide margin and edges Qualcomm (55.4%). That gap is genuine operating advantage — pricing power, an increasingly services-weighted mix, and supply-chain scale — not an accounting artifact. Apple’s own five-year progression corroborates the structural story: gross margin has climbed from 41.8% to 46.9%, driven by the rising Services contribution rather than device pricing alone, consistent with the mix-shift narrative in Section 3.
The more instructive line is EBIT margin, which is clean across the whole group. Apple’s 32.0% matches Alphabet (32.0%) and comfortably exceeds Qualcomm (27.9%) and Samsung (13.1%ᶠ), while trailing Microsoft (45.6%) — the one peer whose software/cloud mix carries a structurally higher operating margin than even Apple’s ecosystem. That Apple converts a hardware-led revenue base into an operating margin on par with Alphabet’s advertising franchise is the single most important profitability fact in this table.
On net margin the caveats bite, and they must be read before the numbers. Apple’s 26.9% is a clean figure. Alphabet’s 32.8% is flattered by a large block of non-operating, largely unrealized securities gains booked below the operating line — on operating earnings its true profitability is nearer its 32.0% EBIT margin. [Rating and price target withdrawn — see the note at the top.] So the honest net-margin ranking is Apple ahead of a normalized Alphabet and well ahead of a normalized Qualcomm — not the raw ordering the cells suggest. FCF margin cuts through all of it: at 23.7%, Apple leads every peer in the group, and because free cash flow is untouched by the securities-gain and tax distortions, this is the cleanest single read of relative earnings quality on the page.
5.3 Returns Comparison
Comparative: Most Recent Full Fiscal Year
| Metric | Apple Inc. | Microsoft Corporation | Alphabet Inc. | Samsung Electronics Co., Ltd. | QUALCOMM Incorporated |
|---|---|---|---|---|---|
| ROIC | 83.1% | 29.6% | 24.8% | 9.9%ᶠ | 17.7%† |
| ROE | 171.4% | 33.3% | 35.7%* | 10.8%ᶠ | 23.3%† |
| ROA | 30.9% | 18.0% | 25.3%* | 8.4%ᶠ | 10.5%† |
| Asset Turnover | 1.16x | 0.50x | 0.77x | 0.62xᶠ | 0.84x |
Source: Peer-company SEC filings; comparability notes in 5.7 — see Appendix A.1.
Historical: Apple Inc. Own 5-Year Progression
| Metric | FY2021 | FY2022 | FY2023 | FY2024 | FY2025 |
|---|---|---|---|---|---|
| ROIC | 64.6% | 66.7% | 67.1% | 67.6% | 83.1% |
| ROE | 147.4% | 175.5% | 171.9% | 157.4% | 171.4% |
| ROA | 28.1% | 28.4% | 27.5% | 26.1% | 30.9% |
Source: Peer-company SEC filings; comparability notes in 5.7 — see Appendix A.1.
Returns are where Apple separates from the entire group, and the separation is real rather than optical. Apple’s ROIC of 83.1% is multiples of every peer — Microsoft 29.6%, Alphabet 24.8%, Qualcomm 17.7%† (itself distorted downward by the tax charge), Samsung 9.9%ᶠ. Against the cost of capital of 9.21%, Apple is earning a spread over WACC that is in a different league from its peers, and the five-year path (64.6% → 83.1%) shows it widening, not fading. This is the quantitative core of the moat thesis: Apple does not merely earn high returns, it earns them on a capital base it has deliberately shrunk.
That last point is the crucial interpretive caveat on ROE. Apple’s 171.4% dwarfs Microsoft’s 33.3% and Alphabet’s 35.7%, but the reader should not treat that headline gap as a proportional gap in operating quality. A large share of Apple’s ROE — and the bulk of the gap versus peers — is financial engineering: a decade of buybacks has driven the equity base down (visible in the depressed book-value-per-share of $4.91), which mechanically inflates return on equity*. ROIC and ROA strip that leverage out, and on those cleaner measures Apple still leads decisively — ROA of 30.9% versus the best peer — which tells you the underlying business is genuinely elite even before the capital structure amplifies it. Peers here carry their own distortions: Alphabet’s ROE and ROA are lifted by the securities gain, and Qualcomm’s are pushed down by the tax charge, so both should be read on ROIC-with-an-asterisk rather than at face value.
Asset turnover completes the story. Apple turns its asset base 1.16x — the highest in the group, against roughly 0.50x–0.84x for the peers — because it outsources manufacturing and runs a famously lean balance sheet. High turnover on high margins is the DuPont recipe for the returns above; the peers, particularly the hyperscalers now building AI datacenters, are moving in the opposite direction.
5.4 Leverage & Liquidity Comparison
sources Comparative: Most Recent Full Fiscal Year
| Metric | Apple Inc. | Microsoft Corporation | Alphabet Inc. | Samsung Electronics Co., Ltd. | QUALCOMM Incorporated |
|---|---|---|---|---|---|
| Net Debt / EBITDA | 0.4x‡ | -0.3x | -0.5x | -1.1xᶠ | 0.3x |
| Total Debt / Equity | 1.3x | 0.1x | 0.1x | 0.1xᶠ | 0.7x |
| Interest Coverage | - | 53.9x | 175.3x | 92.9xᶠ | 18.6x |
| Current Ratio | 0.9x | 1.4x | 2.0x | 2.3xᶠ | 2.8x |
| FCF Margin | 23.7% | 25.4% | 18.2% | 11.3%ᶠ | 22.8% |
Source: Peer-company SEC filings; comparability notes in 5.7 — see Appendix A.1.
‡ Apple’s net debt and Net Debt/EBITDA are OVERSTATED on this basis — see the critical caveat below and 5.7.
The leverage table carries the single most important comparability distortion in this section, and it sits on Apple’s own side. As reported here, Apple shows Net Debt/EBITDA of 0.4x while all four peers show net cash (negative ratios) — Microsoft -0.3x, Alphabet -0.5x, Samsung -1.1xᶠ, Qualcomm 0.3x. Read naively, that makes Apple look like the most levered name in the group. It is not. The peer net-debt figures subtract cash plus short-term investments/marketable securities; Apple’s figure here subtracts only cash and equivalents and omits its large marketable-securities portfolio. On a like-for-like basis Apple is approximately net cash, and its 0.4x should be read as a conservative upper bound, not a true leverage reading. This asymmetry is documented as issue C005 in 5.7 and the reader must carry it into any cross-company leverage judgment.
The same lens applies to Total Debt/Equity, where Apple’s 1.3x towers over the peers’ roughly 0.1x–0.7x. This is not balance-sheet stress — it is the arithmetic of the buyback program compressing the equity denominator, the identical mechanism behind the inflated ROE in 5.3. Gross debt is modest against Apple’s cash generation; the ratio looks extreme only because equity has been deliberately returned to shareholders. Interest coverage confirms there is no leverage problem anywhere in this group. Apple’s own coverage ratio is not a meaningful figure — the company is effectively in a net-cash position and its interest burden is immaterial against operating profit, so its coverage is best described as not meaningful rather than expressed as a ratio — while the peers span 18.6x to 175.3x, all sitting far above any level that would concern a creditor.
The one genuine structural difference is the current ratio. Apple runs 0.9x — the only sub-unity reading in the group and well under every peer, which range from 1.4x to 2.8x. In most companies a current ratio below one is a warning; for Apple it is a feature. It reflects a negative-working-capital model in which suppliers effectively finance operations — the same dynamic that produces the deeply negative cash conversion cycle in 5.6 — layered on top of enormous, reliable free cash flow (23.7% FCF margin, the highest in the group). Liquidity risk here is negligible; the low current ratio is a sign of working-capital dominance, not fragility.
5.5 Valuation Multiples Comparison
sources Comparative: Current Price
| Metric | Apple Inc. | Microsoft Corporation | Alphabet Inc. | Samsung Electronics Co., Ltd. | QUALCOMM Incorporated |
|---|---|---|---|---|---|
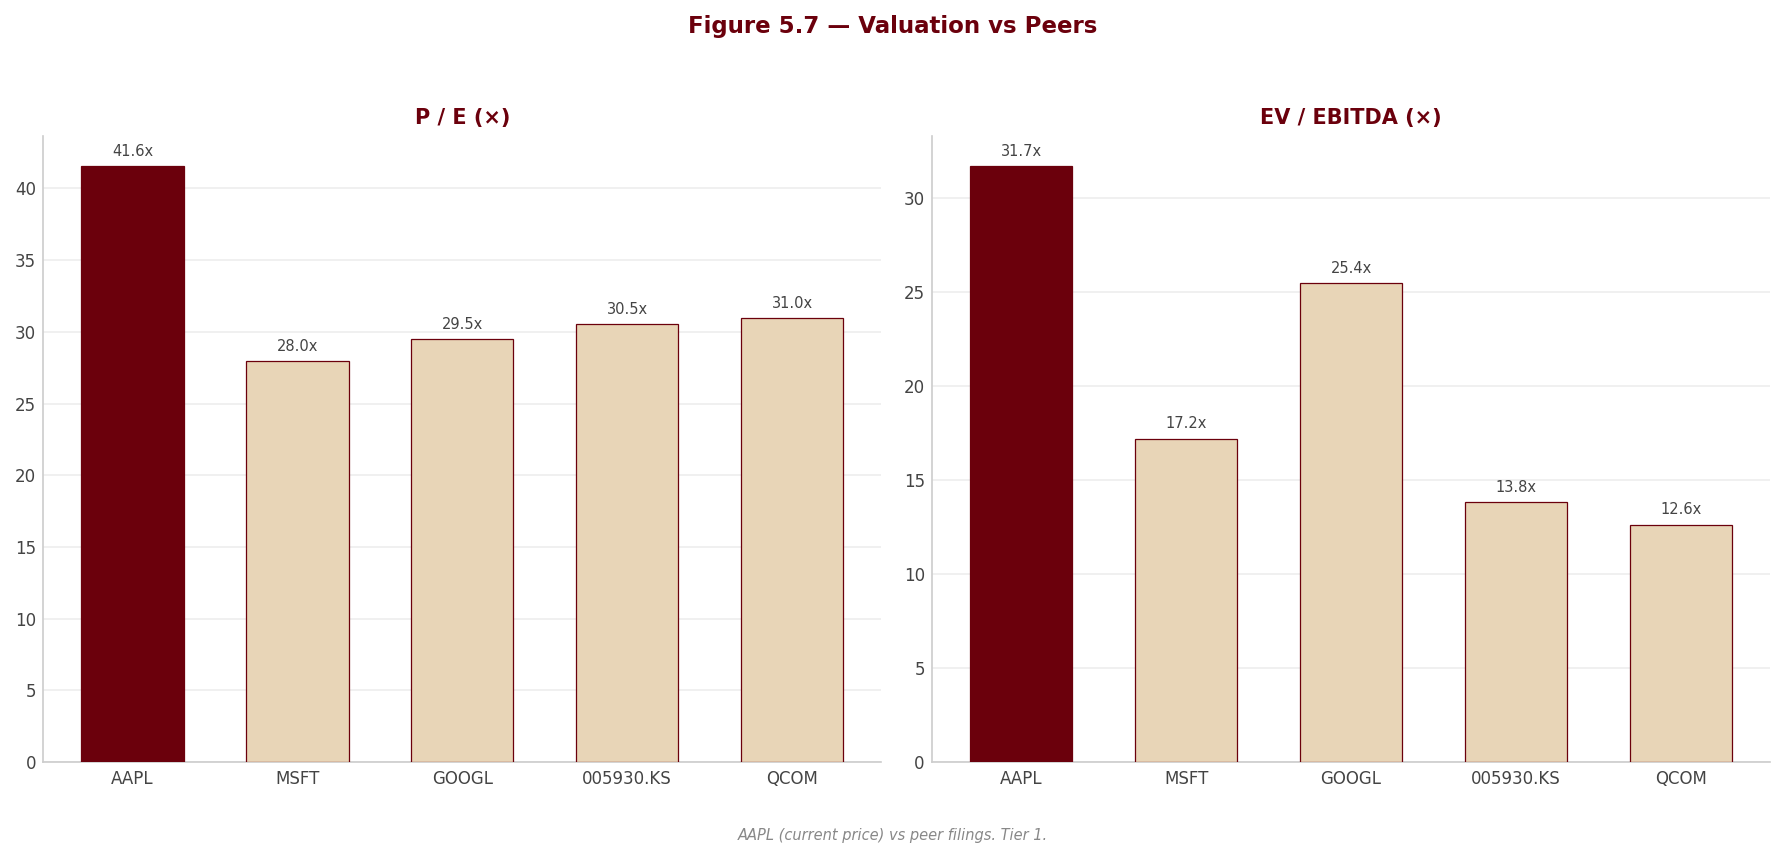
| EV/EBITDA | 31.7xᵐ‡ | 17.2xᵐ | 25.4xᵐ | 13.8xᵐᶠ | 12.6xᵐ |
| P/E | 41.6xᵐ | 28.0xᵐ | 29.5xᵐ* | 30.5xᵐᶠ | 31.0xᵐ† |
| FCF Yield | 2.2%ᵐ | 2.5%ᵐ | 1.9%ᵐ | 2.8%ᵐ | 5.9%ᵐ |
Source: Peer-company SEC filings; comparability notes in 5.7 — see Appendix A.1.
All peer valuation multiples are market-sourced (ᵐ) and move with price. ‡ Apple’s EV/EBITDA is overstated on the same net-debt basis noted in 5.4/5.7 — the true figure is lower. * Alphabet P/E understated by inflated net income; † Qualcomm P/E overstated by depressed net income (materially lower on normalized earnings).
Historical: Apple Inc. EV/EBITDA (period-end price)
| FY2021 | FY2022 | FY2023 | FY2024 | FY2025 |
|---|---|---|---|---|
| 20.6x | 18.0x | 22.2x | 27.2x | 26.8x |
Source: Peer-company SEC filings; comparability notes in 5.7 — see Appendix A.1.
Apple trades at a clear premium to the group on every clean measure. On EV/EBITDA — the multiple least contaminated by the net-income distortions, since EBITDA is clean for all five names — Apple’s 31.7xᵐ stands well above Microsoft (17.2xᵐ), Alphabet (25.4xᵐ), Samsung (13.8xᵐᶠ) and Qualcomm (12.6xᵐ). Even allowing that Apple’s stated EV is overstated by the marketable-securities omission (C005) — which means the true EV/EBITDA is somewhat lower than printed — Apple would still command the richest multiple in the peer set. The market is paying up for the highest returns, the highest FCF margin and the most durable ecosystem in the group; whether that premium is warranted is the subject of the separate valuation.
The P/E comparison must be read through the net-income caveats or it misleads. Apple’s 41.6xᵐ is a clean multiple on clean earnings. Alphabet’s 29.5xᵐ looks cheaper than it is because the denominator is inflated by securities gains — on operating earnings Alphabet is more expensive than the headline. Qualcomm’s 31.0xᵐ† looks broadly in line with the others but is overstated: normalize its one-off tax charge and its P/E compresses toward roughly half the printed figure, making Qualcomm the genuinely cheapest name in the group on normalized earnings. FCF yield* — again the cleanest cross-check — puts Apple at 2.2%ᵐ, among the lowest in the set (Qualcomm’s 5.9%ᵐ is the highest), confirming that on cash economics Apple is the most expensively valued, not the cheapest.
[Rating and price target withdrawn — see the note at the top.] The multiple Apple carries today is toward the upper end of its own recent range, so the premium is being paid not only relative to peers but relative to Apple’s own trading history. That is a demanding starting point that leaves little margin for growth disappointment.
5.6 Efficiency Comparison
| Metric | Apple Inc. | Microsoft Corporation | Alphabet Inc. | Samsung Electronics Co., Ltd. |
|---|---|---|---|---|
| Days Sales Outstanding | 32 days | 91 days | 57 days | 56 daysᶠ |
| Days Inventory Outstanding | 11 days | 4 days | 0 days | 95 daysᶠ |
| Days Payables Outstanding | 115 days | 115 days | 27 days | 24 daysᶠ |
| Cash Conversion Cycle | -72 days | -21 days | 30 days | 127 daysᶠ |
| CapEx / Revenue | 3.1% | 22.9% | 22.7% | 14.2%ᶠ |
Source: Peer-company SEC filings; comparability notes in 5.7 — see Appendix A.1.
Working-capital efficiency is a second, under-appreciated Apple moat, and it shows clearly here. Apple’s cash conversion cycle of -72 days is deeply negative — more negative than Microsoft’s -21 days and in a different universe from Alphabet’s 30 days or Samsung’s 127 daysᶠ. A negative cycle means suppliers and, in effect, customers fund Apple’s operations: it collects and sells before it pays. The engine is a combination of low inventory (11 days, against Samsung’s inventory-heavy 95 daysᶠ device-manufacturing model), fast receivables (32 days, the tightest in the group), and long payables (115 days). This is what allows Apple to run a sub-unity current ratio without any liquidity strain — the negative-working-capital model referenced in 5.4.
The CapEx/Revenue line is the most strategically loaded comparison in the table. Apple spends just 3.1% of revenue on capex — a fraction of Microsoft’s 22.9%, Alphabet’s 22.7% and Samsung’s 14.2%ᶠ. Part of this is structural: Apple outsources manufacturing, whereas Samsung owns fabs and the hyperscalers own datacenters. But part is a live strategic question — Microsoft and Alphabet are pouring capital into AI infrastructure, and Apple’s comparatively light spend is either evidence of a superior capital-efficient model or a signal that it is under-investing in the AI build-out reshaping its peers. That tension is a matter of judgment, not accounting, and it is one of the more important open questions in the investment case. Note that Samsung’s efficiency figures carry the K-IFRS/translation caveat and its memory-cycle inventory swings make its working-capital metrics only directionally comparable.
5.7 Comparability Caveats
sources This table is only as honest as its footnotes. Five material issues bear on how the comparisons above should be read; none is cosmetic, and each was carried through the relevant table commentary rather than disclosed and forgotten.
[Rating and price target withdrawn — see the note at the top.] Beyond currency, K-IFRS and US GAAP diverge on development-cost capitalization (Samsung capitalizes more R&D), impairment reversal (permitted under IFRS), and lease and pension treatment. Samsung is also weighted toward memory and semiconductors by profit — a more cyclical, more capital-intensive mix than Apple’s. Every Samsung cell above carries the ᶠ marker and should be treated as directional only, never as a precise like-for-like read.
C002 — Fiscal years differ by up to a quarter (affects Microsoft, Alphabet, Samsung). Apple’s FY2025 closed in September. Qualcomm’s September close aligns within days and is clean. Alphabet and Samsung close in December — a one-quarter lead that captures an extra quarter of AI/cloud momentum and, for Samsung, memory-price recovery. Microsoft closes in June — a one-quarter lag, a quarter staler than Apple. All sit within a one-quarter window, but growth and any momentum-sensitive comparison carries a phase difference; the fiscal-year-end month is labeled for each peer in 5.1.
C003 — Alphabet’s net income is inflated by non-operating securities gains (affects net margin, ROE, ROA, P/E, net income). Alphabet’s FY2025 net income is lifted by a large block of largely unrealized, mark-to-market gains on equity/debt securities booked below the operating line. Operating income, EBIT margin, EBITDA and EV/EBITDA are unaffected and clean; net-income-derived metrics are flattered. Anchor Alphabet’s profitability on its EBIT/EBITDA lines — its true profitability is closer to its 32.0% EBIT margin — and discount its headline net margin, ROE, ROA and P/E accordingly.
[Rating and price target withdrawn — see the note at the top.] Operating income, EBIT margin, EBITDA, EV/EBITDA and, critically, free cash flow are all clean; net margin, ROE, ROA, ROIC and P/E are distorted (earnings down, P/E up). Read Qualcomm on EBIT/EBITDA and on FCF — its FCF margin (22.8%) and FCF yield (5.9%) are the cleanest window on the business — and treat its net-income multiples as understated in earnings and overstated in P/E.
C005 — Apple’s own net debt and EV are overstated on this basis (affects Apple net debt, Net Debt/EBITDA, EV/EBITDA, EV/Revenue). The asymmetry that matters most sits on the subject side. For all four peers, net debt and enterprise value subtract cash plus short-term investments and marketable securities. Apple’s figures here subtract only cash and equivalents; its large marketable-securities portfolio is not in the extracted inputs and was, correctly, not fabricated. Consequently Apple’s shown net debt and EV — and therefore its Net Debt/EBITDA (0.4x) and EV/EBITDA (31.7x) — are overstated relative to the like-for-like peer basis. On a comparable footing Apple is approximately net cash, and both ratios should be read as conservative upper bounds. Any reader concluding from the raw table that Apple is the most levered or the most richly valued name on enterprise-value terms is being misled by this asymmetry, not by the business.
6. Valuation & Price Target withdrawn
This section stated what the shares were worth and what to do about them. It rested on an exit multiple set by hand — across the coverage it averaged 24% below where each company actually traded — so the conclusion largely restated that assumption instead of testing it. Rather than leave it standing, it has been withdrawn while the method is rebuilt.
Nothing else in this report depends on it: the financial analysis above and below is drawn from the company's own filings, and every figure links to the page it was verified against.
Section 7 — Quarterly Update: Q2 2026
Portfolio Action
[Rating and price target withdrawn — see the note at the top.] What this note updates is the near-term portfolio action in light of Q2 2026 results.*
[Rating and price target withdrawn — see the note at the top.]
| Assessment | |
|---|---|
| [Rating and price target withdrawn — see the note at the top.] | [Rating and price target withdrawn — see the note at the top.] |
| Near-term action (post-Q2 2026) | [Rating and price target withdrawn — see the note at the top.] |
| Why act now, not hold | The quarter was operationally strong — Greater China reaccelerated to +28% YoY revenue and +38.7% YoY segment operating income, gross margin a record 49.3%, +28.0% YoY FCF growth and an expanded $100B buyback. But the price ran with it: at $310.03 the stock sits far above the $200.41 composite fair value, so the business improvement has been more than capitalised. A strong quarter into a rising price is precisely when a valuation seller should be reducing — it improves the exit, it does not close the -35.4% gap. [Rating and price target withdrawn — see the note at the top.] |
| Reason | [Rating and price target withdrawn — see the note at the top.] |
| Valuation thesis intact? | YES — and reinforced. [Rating and price target withdrawn — see the note at the top.] |
| Trigger to revisit | [Rating and price target withdrawn — see the note at the top.] Accelerate the reduction if total gross margin falls back below ~47% for two consecutive quarters (component-cost pass-through failing) OR if the Google search-distribution remedy is reversed on appeal and Apple loses that Services revenue stream. |
7.1 Results at a Glance
| Metric | Q2 2026 | Q2 2025 | YoY Δ | Q1 2026 | QoQ Δ |
|---|---|---|---|---|---|
| Revenue ($M) | $111,184.0M | $95,359.0M | +16.6% | $143,756.0M | -22.7% |
| Gross Profit ($M) | $54,781.0M | $44,867.0M | +22.1% | $69,231.0M | -20.9% |
| Gross Margin | 49.3% | 47.1% | +2.2 pp | 48.2% | +1.1 pp |
| EBITDA ($M) | $39,324.0M | $32,250.0M | +21.9% | $54,066.0M | -27.3% |
| EBITDA Margin | 35.4% | 33.8% | +1.6 pp | 37.6% | -2.2 pp |
| EBIT ($M) | $35,885.0M | $29,589.0M | +21.3% | $50,852.0M | -29.4% |
| EBIT Margin | 32.3% | 31.0% | +1.2 pp | 35.4% | -3.1 pp |
| Net Income ($M) | $29,578.0M | $24,780.0M | +19.4% | $42,097.0M | -29.7% |
| Net Margin | 26.6% | 26.0% | +0.6 pp | 29.3% | -2.7 pp |
| Diluted EPS | $2.01 | $1.65 | +21.8% | $2.84 | -29.2% |
YoY formula (first use): (CQ - PYSQ) / |PYSQ| × 100 — Revenue = (111,184 - 95,359) / 95,359 × 100 = +16.6%. QoQ formula (first use): (CQ - PQ) / |PQ| × 100 — Revenue = (111,184 - 143,756) / 143,756 × 100 = -22.7%. Margin formula (first use): GROSS_PROFIT_CQ / REVENUE_CQ × 100 = 54,781 / 111,184 × 100 = 49.3%. Margin-delta = CQ margin - comparison margin, in percentage points (pp). QoQ declines are seasonal: Q1 2026 was the December holiday quarter (Products-heavy), so sequential drops reflect the calendar, not deterioration.
Source: Apple Inc. Q2 2026 Form 10-Q, Condensed Consolidated Statements of Operations (10-Q p. 1).
7.2 P&L Drivers
sources Revenue: Total net sales rose +16.6% YoY to $111,184.0M, driven overwhelmingly by iPhone, which grew +22% YoY to $56,994M on a richer Pro-model mix, and Services, up +16% YoY to $30,976M on advertising, App Store and cloud (10-Q pp. 6, 15). Geographically the standout was Greater China at $20,497M, +28% YoY — a genuine reacceleration — with management attributing it to higher iPhone sales and a favorable renminbi (10-Q p. 14); Americas grew +12% to $45,093M and Europe +15% to $28,055M, both aided by foreign-currency strength versus the dollar (10-Q p. 14). Every product line and every geography grew year-over-year.
Cost and margin: COGS was $56,403.0M in CQ vs $50,492.0M in PYSQ, rising only +11.7% against +16.6% revenue growth, so gross margin expanded +2.2 pp YoY to 49.3% — Products gross margin improved to 38.7% (from 35.9%) on product mix and FX, and Services gross margin reached 76.7% (from 75.7%) (10-Q p. 16). D&A was $3,439.0M CQ vs $2,661.0M PYSQ. The one cost line that outran revenue was R&D at $11,419M, up +34% YoY on infrastructure and headcount (10-Q p. 17); even so EBIT margin still expanded +1.2 pp YoY to 32.3%, so the margin gains look structural (mix and FX) rather than one-off.
Below the line: Apple does not report a standalone interest-expense line (— in the data pack); consolidated other income/(expense), net was -$52M in CQ, a much smaller drag than the -$279M in PYSQ (10-Q p. 1). [Rating and price target withdrawn — see the note at the top.] Diluted EPS of $2.01 was up $0.36 (+21.8%) YoY from $1.65 — outpacing net income because the diluted share count fell to 14,725,873K from 15,056,133K on buybacks — and down $0.83 (-29.2%) QoQ from $2.84 on holiday-quarter seasonality.
7.3 Balance Sheet & Cash Flow
| Metric | Q2 2026 | Q2 2025 | YoY Δ | Q1 2026 | QoQ Δ |
|---|---|---|---|---|---|
| Cash ($M) | $45,572.0M | $28,162.0M | +61.8% | $45,317.0M | +0.6% |
| Net Debt ($M) | $39,139.0M | $70,024.0M | -44.1% | $45,192.0M | -13.4% |
| Net Debt / LTM EBITDA | 0.2× | — | — | — | — |
| Total Assets ($M) | $371,082.0M | $331,233.0M | +12.0% | $379,297.0M | -2.2% |
| Equity ($M) | $106,491.0M | $66,796.0M | +59.4% | $88,190.0M | +20.8% |
| OCF ($M) | $28,702.0M | $23,952.0M | +19.8% | $53,925.0M | -46.8% |
| CapEx ($M) | $1,971.0M | $3,071.0M | -35.8% | $2,373.0M | -16.9% |
| FCF ($M) | $26,731.0M | $20,881.0M | +28.0% | $51,552.0M | -48.1% |
| Dividends Paid ($M) | $3,822.0M | $3,758.0M | +1.7% | $3,921.0M | -2.5% |
Net Debt / LTM EBITDA: LTM EBITDA = Q3 2025 + Q4 2025 + Q1 2026 + Q2 2026 = 31,032 + 35,554 + 54,066 + 39,324 = 159,976; Net Debt CQ / LTM EBITDA = 39,139 / 159,976 = 0.2×.ᵃ Net debt = total debt (term debt $82,714M + commercial paper $1,997M) - cash & equivalents $45,572M = $39,139M (10-Q pp. 3, 10); this convention excludes the $101,023M of marketable securities, on which basis Apple carries roughly $62B of net cash.
ᵃ Q3 2025 and Q4 2025 standalone EBITDA are not carried in the Section 7 data pack (which holds only CQ/PYSQ/PQ); they are taken from the Data workbook (row 20) that generates the pack, to complete the trailing-twelve-month window.
Source: Apple Inc. Q2 2026 Form 10-Q — Condensed Consolidated Balance Sheets (10-Q p. 3), Statements of Cash Flows (10-Q p. 5), Note 6 – Debt (10-Q p. 10).
Balance sheet note: The most material change is the deleveraging and equity rebuild: net debt fell -44.1% YoY to $39,139.0M as term debt was cut to $82.7B (from $90.7B at FY-end) and commercial paper dropped to $2.0B (from $8.0B), while total shareholders’ equity nearly doubled YoY to $106,491.0M as retained earnings swung positive to $12,359M from an accumulated deficit (10-Q pp. 3, 4, 10). One item warrants a flag: net intangible assets jumped to $25,797M gross $37,767M (from $24,950M gross at FY-end), the current portion alone rising to $4,463M (10-Q p. 9) — a ~$12.8B gross increase in a single half-year that is not explained in the footnote and merits monitoring.
Cash flow note: FCF conversion = FCF / Net Income = 26,731 / 29,578 × 100 = 90.4%, so cash generation tracked earnings closely, though it fell modestly short because the six-month cash-flow statement shows a $14,329M outflow in “other current and non-current assets” and only partial offset elsewhere (10-Q p. 5). FCF still grew +28.0% YoY to $26,731.0M — faster than net income — helped by CapEx falling -35.8% YoY to $1,971.0M.
7.4 Footnote Review
sources Every footnote in the Q2 2026 10-Q was read in this session. Page citations refer to the internal 10-Q page numbers printed on the filing.
Note 1 — Summary of Significant Accounting Policies (10-Q p. 6) States the basis of presentation, that fiscal 2026 and 2025 each span 52 weeks, and that certain prior-period amounts were reclassified to conform to current presentation. Confirmed substantively unchanged vs. the accounting-policy basis carried from the 2025 Form 10-K; no new policy adopted this quarter. No thesis implication.
Note 2 — Revenue (10-Q p. 6) Disaggregates net sales by product/service (iPhone $56,994M, Mac $8,399M, iPad $6,914M, Wearables $7,901M, Services $30,976M) and discloses total deferred revenue of $14.7B (vs $13.7B at FY-end), of which 64% is expected to be realized within one year. Deferred revenue rose ~$1.0B YoY-equivalent, consistent with the Services build. Analytically supportive of the recurring-Services thesis; no adverse change.
Note 3 — Earnings Per Share (10-Q p. 7) Reconciles diluted EPS of $2.01 on a weighted-average diluted share count of 14,725,873K, down from 15,056,133K a year ago — a -2.2% reduction from buybacks that directly boosted EPS. Changed vs. PYSQ only through the lower share count. Confirms buybacks are still a live EPS driver.
Note 4 — Financial Instruments (10-Q pp. 7–8) Reports total cash, cash equivalents and marketable securities of $146,595M fair value (adjusted cost $149,418M; net unrealized loss position of ~$2.8B). [Rating and price target withdrawn — see the note at the top.] Customer concentration: one customer was 17% of trade receivables (up from 12%), carriers 30%; two vendors were 51% and 18% of vendor non-trade receivables (10-Q p. 9). Changes vs. FY-end are modest; the rising single-customer receivable concentration (12%→17%) is a minor credit-risk watch item, not thesis-altering.
Note 5 — Condensed Consolidated Financial Statement Details (10-Q p. 9) Details PP&E net of $50,116M (gross $127,557M less $77,441M accumulated depreciation) and intangibles net of $25,797M (gross $37,767M, up from $24,950M at FY-end). The intangibles increase is the notable movement — a ~$12.8B gross build in six months that the note does not narrate; flagged above in the balance-sheet note as the item to watch. PP&E essentially flat.
Note 6 — Debt (10-Q p. 10) [Rating and price target withdrawn — see the note at the top.] Six-month net commercial-paper repayment was $5,911M and term-debt repayment $7,914M. Changed materially vs. FY-end — Apple actively paid down debt. Reinforces the deleveraging read; no covenant levels are disclosed (Apple’s notes are not covenant-restrictive).
Note 7 — Shareholders’ Equity (10-Q p. 10) Discloses that Apple repurchased 135 million shares for $36.0B during the six months ended March 28, 2026. This is the mechanical driver of the -2.2% diluted-share reduction in Note 3. Confirms the capital-return program continued at scale; changed vs. PYSQ only in pace (six-month repurchases were $36.0B vs $48.7B a year earlier per the equity statement, 10-Q p. 4 — a deliberate slowdown).
Note 8 — Share-Based Compensation (10-Q pp. 10–11) SBC expense was $3,528M in CQ (vs $3,226M PYSQ) and $7,122M for six months; total unrecognized RSU compensation cost was $28.8B to be recognized over 2.8 years; the RSU balance rose to 173,985K units at a $217.51 weighted-average grant fair value. SBC grew +9.4% YoY, below revenue growth, so it is not a rising drag on margin. No thesis implication.
Note 9 — Commitments and Contingencies (10-Q p. 11) Unconditional purchase obligations total $27,691M ($2,994M remaining in FY2026, $7,343M in 2027). On contingencies, management states there was “not at least a reasonable possibility” of a material loss beyond recorded accruals for asserted legal and other claims. Unchanged in tenor vs. prior periods; the specific legal matters are detailed in Legal Proceedings below. No accrual increase disclosed.
Note 10 — Segment Information (10-Q p. 12) Reports operating income by geographic segment: Americas $19,373M, Europe $13,052M, Greater China $9,189M, Japan $3,839M, Rest of Asia Pacific $4,127M, against Corporate costs of $(13,695)M, summing to the $35,885M consolidated operating income. Greater China operating income grew to $9,189M from $6,626M a year ago (+38.7%) — the clearest evidence the China recovery is flowing to profit, not just revenue. Strongly supportive of the thesis.
Related-party transactions (10-Q — none disclosed; see pp. 9, 22–23, 26) Apple has no controlling shareholder and discloses no material related-party transactions in the Q2 2026 10-Q; there are no equity-method investees or non-controlling interests to document (the filing consolidates only wholly owned subsidiaries, 10-Q p. 6). The closest analogues are commercial concentrations, not related parties: the customer/vendor receivable concentrations in Note 4 (one customer 17%; two vendors 51% and 18%, 10-Q p. 9) and the Google search-licensing arrangement, under which Apple earns revenue for offering Google search on its platforms (10-Q p. 23). No related-party terms exist to compare to PYSQ; this entry is complete as stated.
Contingencies and litigation (10-Q pp. 11, 20, 23) Four material matters, each carried forward from prior periods with this-quarter developments: - EU Digital Markets Act (10-Q p. 20): the Commission fined Apple €500M in the Article 5(4) investigation (April 23, 2025), which Apple has appealed; the Article 6(4) investigation is at the preliminary-findings stage and, if decided against Apple, could carry fines “up to 10% of the Company’s annual worldwide net sales” — an unquantified but potentially very large exposure. Unchanged in status this quarter. - DOJ antitrust lawsuit (10-Q p. 20): the March 2024 U.S. monopolization suit over “performance smartphones”/”smartphones” continues; DOJ seeks equitable relief. No dollar amount stated. Unchanged. - Epic Games (10-Q p. 20): on December 11, 2025 the Ninth Circuit upheld the 2025 Injunction in part but modified it — Apple may now require parity in link presentation and, importantly, may charge a commission on link-out purchases, remanded to the district court. This is a marginally favorable development vs. the prior all-or-nothing injunction, protecting part of the App Store commission model. - Google search licensing (10-Q p. 23): Google was found to violate U.S. antitrust law (Aug 5, 2024); remedies were ordered (Sept 2, 2025) and are on appeal by both DOJ and Google. A reversal could impose remedies “prohibiting Google from offering the Company commercial terms for search distribution,” which the filing states “could materially adversely affect the Company’s ability to earn revenue from such licensing arrangements.” No amount is disclosed, but this is the single largest unquantified downside catalyst. Apple also “settled certain matters during the second quarter of 2026” that were not individually or in aggregate material (10-Q p. 20).
Subsequent events (10-Q pp. 18, 25) Several post–quarter-end (March 28, 2026) events are disclosed in MD&A and Other Information: - On April 30, 2026, the Board authorized an additional program to repurchase up to $100 billion of common stock, on top of the $63.8B remaining under the prior authorization as of quarter-end (10-Q p. 18). - On April 30, 2026, the Board raised the quarterly dividend from $0.26 to $0.27 per share, effective the Q3 2026 payment (10-Q p. 18). - On February 6, 2026 (within the quarter), Principal Accounting Officer Ben Borders adopted a Rule 10b5-1 trading plan for up to 898 shares plus vesting awards, expiring December 31, 2026 (10-Q p. 25). Also relevant to the period: on February 20, 2026 the U.S. Supreme Court struck down certain IEEPA tariffs and Apple is applying for refunds of tariffs paid, and on January 14, 2026 the Section 232 semiconductor investigation’s initial results imposed no additional tariffs on Apple’s products (10-Q p. 14).
7.5 What Changed This Quarter
sources - Revenue growth accelerated to +16.6% YoY ($111,184.0M) with iPhone +22% and Services +16% — a materially faster pace than Apple’s recent low-single-digit-to-high-single-digit trend, evidence the product cycle (Pro-model mix, iPhone 17e launch) is landing. Reinforces the demand-durability thesis. - Greater China reaccelerated to +28% YoY revenue and +38.7% YoY segment operating income ($20,497M / $9,189M, 10-Q pp. 12, 14) — the region that had been the thesis’s soft spot is now its fastest grower and is flowing to profit, removing a key bear argument. - Gross margin set a record 49.3% (+2.2 pp YoY), Services gross margin 76.7% (10-Q p. 16) — mix and FX drove structural margin expansion even as R&D grew +34%; supports the “mix shift to high-margin Services lifts blended margin” thesis. - Balance sheet de-risked: net debt -44.1% YoY to $39,139.0M (0.2× LTM EBITDA) and equity +59.4% to $106,491.0M as debt was repaid and retained earnings turned positive — greater financial flexibility with no thesis cost. - Capital return expanded post-quarter: a new $100B buyback authorization and a dividend raise to $0.27 (10-Q p. 18) — confirms the shareholder-return pillar of the thesis is intact and growing. - New/intensifying negative — component costs: management now states supply constraints and rising costs for advanced semiconductors, NAND and DRAM “are expected to intensify” and “may materially adversely affect… gross margin” (10-Q p. 13) — a specific forward warning that puts the record 49.3% margin at risk in coming quarters and is one more reason the elevated multiple cannot be underwritten — the action remains to reduce into strength. - Unexplained intangibles build: net intangibles rose to $25,797M gross $37,767M (~$12.8B gross in six months, 10-Q p. 9) — not narrated in the footnote; a disclosure-quality item to monitor for a possible acquisition or capitalized-cost shift.
7.6 Portfolio Decision
sources [Rating and price target withdrawn — see the note at the top.] The quarter confirmed and, if anything, strengthened the thesis: revenue grew +16.6% YoY to $111,184.0M, gross margin hit a record 49.3% (+2.2 pp YoY), net income rose +19.4% to $29,578.0M, EPS +21.8% to $2.01, and free cash flow grew +28.0% to $26,731.0M at 90.4% conversion — while net debt fell -44.1% to $39,139.0M (0.2× LTM EBITDA) and the Board added a $100B buyback and a dividend raise (10-Q p. 18). The Greater China reacceleration (+28% revenue, +38.7% segment operating income) neutralizes the most-cited bear case. Operationally there is nothing in this quarter to fault — which is precisely the point: the sale is a valuation decision, taken while the operating news is good. [Rating and price target withdrawn — see the note at the top.] Improving fundamentals at -35.4% implied downside argue for exiting into liquidity and sentiment, not for holding through them. Two this-quarter disclosures reinforce the asymmetry at the current price: management’s explicit warning that component costs “are expected to intensify” and “may materially adversely affect… gross margin” (10-Q p. 13) puts the record margin at risk, and the Google search-licensing remedy on appeal (10-Q p. 23) is a large, unquantified downside catalyst that could remove a high-margin Services revenue stream. The footnote review surfaced no accounting red flags beyond an unexplained ~$12.8B intangibles build (10-Q p. 9) worth monitoring, and confirmed contingency accruals were not increased.
What would change this view: [Rating and price target withdrawn — see the note at the top.] - What would deepen the negative view: total gross margin falling below ~47% for two consecutive quarters as component costs bite, OR the Google search-distribution remedy reversed on appeal such that Apple loses that Services revenue stream (10-Q p. 23), OR an adverse final EU DMA Article 6(4) determination approaching the “up to 10% of annual worldwide net sales” fine ceiling (10-Q p. 20).
Report Versions
Every published version of this report, newest first — each one kept so a reader can see what changed and when.
| Version date | Files |
|---|---|
| 2026-08-19 Current | Model (Excel) |
| 2026-08-02 | Model (Excel) |
| 2026-08-01-4 | Model (Excel) |
| 2026-08-01-3 | Model (Excel) |
| 2026-08-01-2 | Model (Excel) |
| 2026-08-01 | Model (Excel) Model (Excel) |